
The Total Economic Impact™ Of The Alation Data Catalog
27
1 A Forrester Total Economic Impact™ Study Commissioned By Alation October 2019 The Total Economic Impact ™ Of The Alation Data Catalog Cost Savings And Business Benefits Enabled By Alation
Transcript of The Total Economic Impact™ Of The Alation Data Catalog

1
A Forrester Total Economic Impact™
Study Commissioned By Alation
October 2019
The Total Economic Impact™ Of The Alation Data Catalog
Cost Savings And Business Benefits Enabled By Alation

Table Of Contents Executive Summary 1
Key Findings 1
TEI Framework And Methodology 5
The Alation Data Catalog Customer Journey 6
Interviewed Organizations 6
Key Challenges 6
Solution Requirements 7
Key Results 7
Composite Organization 8
Analysis Of Benefits 9
Analyst Productivity Improvement Due To Shortened Data Discovery 9
Business User Productivity Improvement From Self-Service 11
Data Engineer Productivity Improvements 13
Savings From Faster Onboarding Of New Analysts 14
Unquantified Benefits 15
Flexibility 17
Analysis Of Costs 18
Fees To Alation 18
Implementation Cost 18
Training And Adoption Cost 19
Ongoing Management 20
Financial Summary 22
Alation: Overview 23
Appendix A: Total Economic Impact 24
Appendix B: Supplemental Material 25
Appendix C: Endnotes 25
Project Director:
Julia Fadzeyeva
Project Contributor:
Richard Cavallaro
ABOUT FORRESTER CONSULTING
Forrester Consulting provides independent and objective research-based
consulting to help leaders succeed in their organizations. Ranging in scope from a
short strategy session to custom projects, Forrester’s Consulting services connect
you directly with research analysts who apply expert insight to your specific
business challenges. For more information, visit forrester.com/consulting.
© 2019, Forrester Research, Inc. All rights reserved. Unauthorized reproduction
is strictly prohibited. Information is based on best available resources.
Opinions reflect judgment at the time and are subject to change. Forrester®,
Technographics®, Forrester Wave, RoleView, TechRadar, and Total Economic
Impact are trademarks of Forrester Research, Inc. All other trademarks are the
property of their respective companies. For additional information, go to
forrester.com.

1 | The Total Economic Impact™ Of The Alation Data Catalog
Executive Summary
In 2018, 37% of global data and analytics decision makers ranked
“sourcing, gathering, managing, and governing the data as it grows” as
one of their firm’s biggest challenges when using systems of insight.1 And
finding a solution for data management and governance becomes
increasingly urgent as data volumes continue to grow. In the Forrester
survey, 36% to 38% of global data and analytics decision makers reported
that their structured, semi-structured, and unstructured data each totaled
1,000 TB or more in 2017, up from only 10% to 14% in 2016.2 In this
reality, organizations seek to organize their data for effective consumption.
Alation provides an enterprise data catalog that helps scale the use of data
within the organization by making it easy to find, understand, trust, use
and reuse for self-service analysis. Alation commissioned Forrester
Consulting to conduct a Total Economic Impact™ (TEI) study and examine
the potential ROI enterprises may realize by deploying Alation. The
purpose of this study is to provide readers with a framework to evaluate
the potential financial impact of the Alation Data Catalog on their
organizations.
To better understand the benefits, costs and risks associated with this
investment, Forrester interviewed seven customers with experience using
the Alation Data Catalog.
Customers told Forrester that prior to using Alation their efforts to become
more data-driven yielded limited results: companies invested in data lakes
and other technologies but lacked accessible tools, documentation, and
guidance on how and where to find the data. Access to data was limited
and the team’s capacity served as a bottleneck to how quickly business
users could get the answers they needed. Bringing new analysts up to
speed took months due to system complexity and the lack of a single
source of reference. Data engineers, analysts, and business users
operated in siloes, with no venue to share their work, experience,
learnings, or best practices, so they frequently and unknowingly ran the
same queries, built redundant data sets, and made errors.
Alation provides organizations with a single platform to document data and
data usage guidelines, define best practices, and certify standard data
sets for further use. Clear documentation and links to experts and former
data users within Alation make data accessible and easy to understand
beyond engineering and analytics titles. The VP of information
management and strategy at a software company told Forrester: “Alation
is our foundation for data management. Everything depends on knowing
where your assets are and what’s in the data. So, whether you’re looking
at the data governance initiative and policies around the data, identifying
stewards, reviewing accountability models, or controlling for data quality,
it’s now all in Alation. It’s truly the foundation for everything else.”
Key Findings
Quantified benefits. The following risk-adjusted present value (PV)
quantified benefits are representative of those experienced by the
companies interviewed:
Investment Benefits
Analyst time saved from self-service:
$2.7 million
Business user productivity gains from self-service:
$584,182
Savings from faster onboarding of new analysts:
$286,085

2 | The Total Economic Impact™ Of The Alation Data Catalog
› Analyst productivity improvement due to shortened data discovery
of $2.7 million. Alation provides the platform to quickly find data sets
and queries verified by the user community, write new queries faster,
and when there are gaps in understanding the context of data before
querying, quickly identify subject matter experts. As a result of using the
Alation Data Catalog, organizations are shortening their time to analysis
from weeks to days or hours.
› Business user productivity improvement from self-service of
$584,182. Before Alation, business users had to work closely with data
analysts and engineers to receive the data necessary to make
decisions. Regardless of whether they submitted a request to get data or
used available tools to find it on their own, the process was time-
consuming. Alation enables business users to self-serve and find
answers in a matter of hours.
› Data engineer productivity improvement due to user self-service by
$165,065. Before Alation, there was no easy way for data engineers to
document the data and communicate the best practices or concerns
around the data to self-service users. The use of the Alation Data
Catalog reduces the number of requests the engineering team receives
to explain data, identify data owners, schedule custom queries, and
simplify data management.
› Savings from faster onboarding of new analysts of $286,085. Prior
to Alation, it would take an average of two months to ramp up a new
analyst. A significant portion of the onboarding process is dedicated to
familiarizing new hires with the data sources and types of data available,
shadowing other analysts on how they handle data requests and write
queries. Alation becomes a single source of reference to learn and
understand data assets and queries; it also shortens onboarding time by
at least 50%.
Unquantified benefits. The interviewed organizations experienced the
following benefits, which are not quantified for this study:
› Alation’s data catalog prevents data lakes from turning into data
swamps. Several interviewed organizations report that they are heavily
investing in building out data lakes. However, without a way to navigate
these ecosystems, these lakes begin to turn into sunk costs. Through
the use of Alation, these organizations are able to organize and
categorize that data, providing users with a portal that makes the data
lake more accessible and actionable for data analysts and business
users.
› Alation enables collaboration around data. The Alation Data Catalog
allows users to find data experts, reuse their work, and ask them
questions. The tool also enables users to share advice, endorsements,
or warnings for existing data sets within the platform, making it the single
venue to find answers about data.
› Alation facilitates documentation of tribal knowledge. The enterprise
data catalog provides automated capture of metadata that saves time
from manually documenting data assets. It lowers the barrier to
capturing tribal knowledge by inviting users to document their data and
share with others.
ROI 364%
Benefits PV $3.8 million
NPV $3 million

3 | The Total Economic Impact™ Of The Alation Data Catalog
› Increased data transparency and reuse improve the accuracy of
analysis. Alation provides a platform for finding existing data sets and
building upon the work already accomplished, versus starting fresh
every time. Repeated use of the already verified queries or data sets
allows users to leverage proven standards, get consistent results, learn,
and avoid repeating mistakes.
› Alation increases compliance with data governance policies.
Business users can gain access to data that is relevant and pre-
prepared without considering whether they should trust that data. Alation
embeds data governance policies side by side with the data and
features like TrustCheck automate compliance recommendations to
assist with policy enforcement.
› The use of Alation enables organizations to address business
challenges. Alation provides time and access to data for analysts and
business users, enabling them to discover and resolve business issues,
which contributes to better customer experience and faster time-to-
market.
Costs. The interviewed organizations experienced the following risk-
adjusted PV costs:
› Fees to Alation of $652,440. Alation pricing is based on the number of
users and the rights each user has within the catalog. Forrester builds
this financial model around a population of 300 active Alation users.
› Cost of implementation of $9,328. There is an associated cost to
implement and install Alation and connect the catalog to the
organization’s environment.
› Training and adoption cost of $38,593. Organizations designed
programs to train and engage employees on how to use Alation. This
effort is conducted following the initial implementation, and more users
are trained as the data catalog adoption grows in the subsequent years.
› Ongoing management of $112,841. Interviewees dedicate resources to
overseeing both the use of the data catalog enterprisewide and further
integration into the organizations’ data environment.
Forrester’s interviews with seven existing customers and subsequent
financial analysis found that an organization based on these interviewed
organizations experienced benefits of $3.8 million over three years versus
costs of $813,202, adding up to a net present value (NPV) of $3 million
and an ROI of 364%.

4 | The Total Economic Impact™ Of The Alation Data Catalog
Total benefits
PV, $3.8M
Total costs PV,
$813K
Initial Year 1 Year 2 Year 3
Financial Summary
$2.7M
$584.2K
$165.1K $286.1K
Analystproductivity
improvementsdue to
shortened datadiscovery
Business userproductivity
improvementsfrom selfservice
Data engineerproductivity
improvements
Savings fromfaster analystonboarding
Benefits (Three-Year)

5 | The Total Economic Impact™ Of The Alation Data Catalog
TEI Framework And Methodology
From the information provided in the interviews, Forrester has constructed
a Total Economic Impact™ (TEI) framework for those organizations
considering implementing Alation.
The objective of the framework is to identify the cost, benefit, flexibility, and
risk factors that affect the investment decision. Forrester took a multistep
approach to evaluate the impact that Alation can have on an organization:
DUE DILIGENCE Interviewed Alation stakeholders and Forrester analysts to gather data relative to Alation.
CUSTOMER INTERVIEWS Interviewed seven organizations using Alation to obtain data with respect to costs, benefits, and risks.
COMPOSITE ORGANIZATION Designed a composite organization based on characteristics of the interviewed organizations.
FINANCIAL MODEL FRAMEWORK Constructed a financial model representative of the interviews using the TEI methodology and risk-adjusted the financial model based on issues and concerns of the interviewed organizations.
CASE STUDY Employed four fundamental elements of TEI in modeling Alation’s impact: benefits, costs, flexibility, and risks. Given the increasing sophistication that enterprises have regarding ROI analyses related to IT investments, Forrester’s TEI methodology serves to provide a complete picture of the total economic impact of purchase decisions. Please see Appendix A for additional information on the TEI methodology.
The TEI methodology
helps companies
demonstrate, justify,
and realize the
tangible value of IT
initiatives to both
senior management
and other key
business
stakeholders.
DISCLOSURES
Readers should be aware of the following:
This study is commissioned by Alation and delivered by Forrester Consulting. It
is not meant to be used as a competitive analysis.
Forrester makes no assumptions as to the potential ROI that other
organizations will receive. Forrester strongly advises that readers use their own
estimates within the framework provided in the report to determine the
appropriateness of an investment in Alation data catalog.
Alation reviewed and provided feedback to Forrester, but Forrester maintains
editorial control over the study and its findings and does not accept changes to
the study that contradict Forrester’s findings or obscure the meaning of the
study.
Alation provided the customer names for the interviews but did not participate in
the interviews.
6 | The Total Economic Impact™ Of The Alation Data Catalog
The Alation Data Catalog Customer Journey
BEFORE AND AFTER THE ALATION DATA CATALOG INVESTMENT
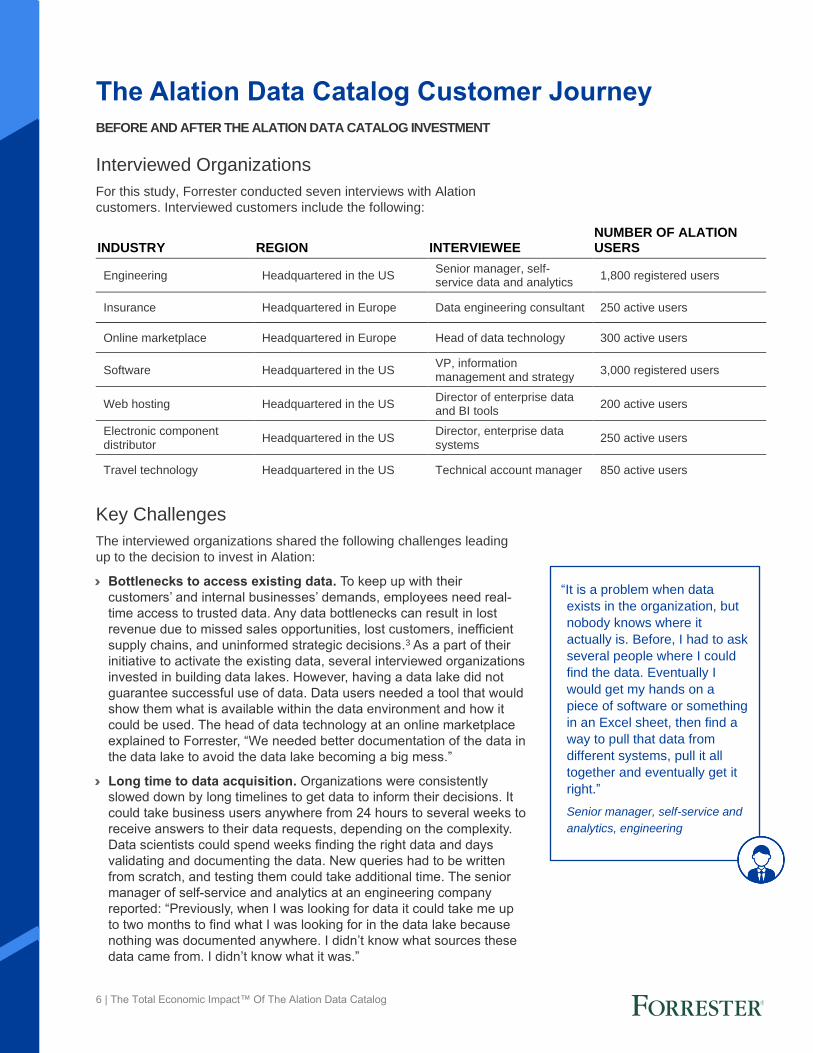
Interviewed Organizations
For this study, Forrester conducted seven interviews with Alation
customers. Interviewed customers include the following:
Key Challenges
The interviewed organizations shared the following challenges leading
up to the decision to invest in Alation:
› Bottlenecks to access existing data. To keep up with their
customers’ and internal businesses’ demands, employees need real-
time access to trusted data. Any data bottlenecks can result in lost
revenue due to missed sales opportunities, lost customers, inefficient
supply chains, and uninformed strategic decisions.3 As a part of their
initiative to activate the existing data, several interviewed organizations
invested in building data lakes. However, having a data lake did not
guarantee successful use of data. Data users needed a tool that would
show them what is available within the data environment and how it
could be used. The head of data technology at an online marketplace
explained to Forrester, “We needed better documentation of the data in
the data lake to avoid the data lake becoming a big mess.”
› Long time to data acquisition. Organizations were consistently
slowed down by long timelines to get data to inform their decisions. It
could take business users anywhere from 24 hours to several weeks to
receive answers to their data requests, depending on the complexity.
Data scientists could spend weeks finding the right data and days
validating and documenting the data. New queries had to be written
from scratch, and testing them could take additional time. The senior
manager of self-service and analytics at an engineering company
reported: “Previously, when I was looking for data it could take me up
to two months to find what I was looking for in the data lake because
nothing was documented anywhere. I didn’t know what sources these
data came from. I didn’t know what it was.”
INDUSTRY REGION INTERVIEWEE NUMBER OF ALATION USERS
Engineering Headquartered in the US Senior manager, self-service data and analytics
1,800 registered users
Insurance Headquartered in Europe Data engineering consultant 250 active users
Online marketplace Headquartered in Europe Head of data technology 300 active users
Software Headquartered in the US VP, information management and strategy
3,000 registered users
Web hosting Headquartered in the US Director of enterprise data and BI tools
200 active users
Electronic component distributor
Headquartered in the US Director, enterprise data systems
250 active users
Travel technology Headquartered in the US Technical account manager 850 active users
“It is a problem when data
exists in the organization, but
nobody knows where it
actually is. Before, I had to ask
several people where I could
find the data. Eventually I
would get my hands on a
piece of software or something
in an Excel sheet, then find a
way to pull that data from
different systems, pull it all
together and eventually get it
right.”
Senior manager, self-service and
analytics, engineering

7 | The Total Economic Impact™ Of The Alation Data Catalog
› Siloed teams and disjointed processes. Prior to Alation, there was
no easy way for data users to access previously completed data
requests, learn about data sets, find experts in certain data areas, or
document their own work. The VP of information management and
strategy at a software company responded: “People would share
details in emails or documents or spreadsheets instead of a
standardized place where you know you can get those particular
details and you can self-service. It was all ad hoc and very manual.”
› Lack of a single source of reference. Several interviewees shared
examples of situations when analysts presented findings back to
business to realize that the results did not look correct, or where
several analysts working with the same data found inconsistent
answers to the same problem. It was not uncommon to use data
sources that were outdated or not recommended for use because
there was no easy way to communicate about best practices.
Solution Requirements
The interviewed organizations searched for a solution that could:
› Activate the data to deliver business value.
› Provide an easy-to-use solution that enabled self-service for business
users.
› Shorten time to get to data across the organization.
› Introduce a social aspect of data use.
› Encourage and document user interaction about data assets, their use,
and best practices.
Key Results
The interviews revealed that key results from the Alation investment
include:
› Democratization of analytics. Clear documentation, direction, and
links to experts and former data users within Alation made data
accessible and easy to understand beyond the engineering and data
science teams. The senior manager of self-service data and analytics
at an engineering company noted: “Alation, because of its ease of use
and nature, makes the data look more approachable. Employees are
more likely to go and then start trying to use it. It’s the difference
between having a map in front of you when you’re walking somewhere
new versus going there blindly.”
› Single source of reference. The Alation Data Catalog became the
central platform to document data and data usage guidelines, define
best practices, and determine the standard data sets for further use.
Easy search, rich context, and collaboration around each query and
data set helped users find, understand, trust, use and reuse previously
completed work, ensuring consistency and continuity.
“Allowing people to self-serve
reduced our internal
operational costs.”
VP of information management
and strategy, software
“We really aim for everyone in
the company — from the CEO
and the management board to
a developer or someone in the
travel team — to get easy
access to the data and
analyze whatever is required
on their side.”
Head of data technology, online
marketplace
“We wanted the catalog to be
the entrance point that is easy
to use, easy to understand,
and allows you to easily find
your way to the answer you’re
looking for.”
Head of data technology, online
marketplace
“Alation gave us the ability to
discover what assets already
exist, make sure that we’re
using the best in class, the
highest data quality, and to
eliminate duplicates.”
VP of information management
and strategy, software

8 | The Total Economic Impact™ Of The Alation Data Catalog
› Improved data literacy. While data analysts cannot easily spot
patterns and trends in ways they write queries and work with data,
artificial intelligence and machine learning can sift through these
patterns and use them to make valuable suggestions to new analysts
and business users as they learn to find and use the data within the
organization. Not only does Alation speed up the onboarding process
for new data users, it also helps them learn from best practices and,
when needed, find the most relevant experts to ask for guidance.
› Collaboration around data. Having a central platform and automated
capture of meta-data lowered barriers for data users to document their
assets. Alation provided a tool to easily share insights, identify top
users and internal experts, provide endorsements, warnings, or advice
for existing data sets.
Composite Organization
Based on the interviews, Forrester constructed a TEI framework, a
composite company, and an associated ROI analysis that illustrates the
areas financially affected. The composite organization is representative
of the seven companies that Forrester interviewed and is used to present
the aggregate financial analysis in the next section. The composite
organization that Forrester synthesized from the customer interviews has
the following characteristics:
Description of composite. It is a global, multibillion-dollar enterprise.
The organization has a strong brand and a large customer base. Prior to
Alation, the organization did not have a specific data management or
data governance tool in place. Recently, the organization invested in a
data lake and wants to ensure that it is continually used.
Before investing in an enterprise data catalog, the organization conducts
a comprehensive vendor selection process that results in it choosing
Alation. The driving factors were data ingestion methods, collaboration
capabilities, native integrations, and intuitive interface.
The organization provides Alation licenses to users as needed.
Usage characteristics. Alation crawls and indexes assets stored across
different physical repositories including databases, Hadoop files, and
data visualization tools.
Key assumptions:
• 75 data analyst users
• 25 data engineer users
• 200 business users
• 30 hours per week an
analyst spends on data
projects
• 2 months to onboard a
new hire analyst
“The collaboration component
of the catalog helps us bridge
employees in different
divisions. It also centralizes
the network and becomes a
good place to document [best
practices].”
Senior manager, self-service and
analytics, engineering

9 | The Total Economic Impact™ Of The Alation Data Catalog
Analyst productivity improvement due to
shortened data discovery:
73% of total benefits
three-year benefit PV
$2.7 million
The table above shows the total of all benefits across the areas listed below, as well as present values (PVs) discounted at 10%. Over three years, the composite organization expects risk-adjusted total benefits to be a PV
of nearly $3.8 million.
Analysis Of Benefits
QUANTIFIED BENEFIT DATA AS APPLIED TO THE COMPOSITE
Analyst Productivity Improvement Due To
Shortened Data Discovery
All interviewed organizations name shortened time to data discovery as
the main benefit of using the Alation Data Catalog. Prior to Alation,
finding the necessary information required not only searching through
raw data and building SQL queries, but it also would take plenty of
legwork to find both what the data meant and who put it into the data
lake. Analysts would have to identify experts who could confirm what the
data meant and how it could be used. If a similar query had been
previously executed, the current model disallowed analysts from finding
proof of that completion and whether it had been successful or not.
Alation provides the platform to find trusted data, locate former queries,
write new queries faster, identify experts, and to see feedback from the
user community, which results in time savings for data analysts.
› A senior manager of self-service data analytics at an engineering
company said: “Previously, when I was looking for data it could take
me up to two months to find what I was looking for in the data lake
because nothing was documented anywhere. I didn’t know what
sources this data came from. I didn’t know what it was. And with
Alation, I can use search and find what I need within 5 to 10 minutes.”
› Similarly, the head of data technology at an online marketplace
company explained to Forrester: “It probably took two weeks to find out
who put the data where and in which format, and only then you could
start using it. Today, it takes you minutes in Alation to find the data.”
› According to the enterprise data and BI tools director at a web hosting
company, “Alation became a single place where analysts went to write
queries, save them, share them, and schedule them against multiple
platforms.” With the documentation and search available in Alation,
analysts could find experts in a certain field, reuse their queries or
parts of queries, and provide analysts with direction of who to ask for
guidance, if needed.
Total Benefits
REF. BENEFIT YEAR 1 YEAR 2 YEAR 3 TOTAL PRESENT VALUE
Atr Analyst productivity improvement due to shortened data discovery
$980,343 $1,106,387 $1,239,900 $3,326,631 $2,737,146
Btr Business user productivity improvements from self-service
$214,200 $235,620 $259,182 $709,002 $584,182
Ctr Data engineer productivity improvements
$66,375 $66,375 $66,375 $199,125 $165,065
Dtr Savings from faster analyst onboarding
$96,005 $126,006 $126,006 $348,017 $286,085
Total benefits (risk-adjusted) $1,356,923 $1,534,388 $1,691,464 $4,582,775 $3,772,478
10 | The Total Economic Impact™ Of The Alation Data Catalog
Impact risk is the risk that the business or technology needs of the organization may not be met by the investment, resulting in lower overall total benefits. The greater the uncertainty, the wider the potential range of outcomes for benefit estimates.
Among the Alation features that impact analysts’ workflow, all interviewed
customers specifically point to Alation Compose as a powerful tool which
allows data analysts to benefit from the wealth of previously built queries.
› The enterprise data and BI tools director at a web hosting company
said, “Alation Compose was the shining star of the product and it really
brought users onboard initially.”
› The head of data technology at an online marketplace said: “If you
start writing a query, it tests the knowledge of all other queries, which
have been written historically. It tells you, ‘Hey, this user created the
same query,’ or ‘For this table, that is the top user,’ or ‘No one before
used this column,’ or ‘This column is going to be deprecated.’ The SQL
composer with all the knowledge and the background of all queries
executed over the last 12 months really helped to write much faster,
efficient queries.”
For the composite organization, Forrester assumes:
› Of the 300 Alation users, 75 are data analysts who use Alation to fulfill
data requests coming from business users.
› On average, each analyst handles four data requests per day,
spending 1.5 hours per request each day.
› The organization is working on onboarding all of its data sources to
Alation, but to date not all of the sources are connected. Of the data
analysis requests being handled by an analyst, 70% are impacted by
the use of Alation in Year 1. The percentage grows as the organization
onboards new data sources in Year 2 and Year 3.
› The use of the Alation Data Catalog shortens the time needed for
analysts to complete a project by 70%.
› Forrester estimates that 50% of the total time saved per analyst is
applied directly back to data analysis tasks and is, therefore, included
in the benefit calculation. Individual users may apply additional time
savings toward professional development, networking, and work-life
activities, which are not included in the benefit analysis.
The time saved by analysts from business user self-service will vary
based on:
› The organization’s commitment to democratizing the data and the push
to educate business users on how to use Alation.
› The number of data analysts in the organization and the type of the
data requests handled by the analysts.
› The analysts’ annual burdened salary.
To account for these risks, Forrester adjusted this benefit downward by
10%, yielding a three-year, risk-adjusted total PV of $2.7 million.
Alation reduces the time
an analyst spends per
data request, on
average, by 70%.

11 | The Total Economic Impact™ Of The Alation Data Catalog
Business user productivity improvement
from self-service: 16% of total benefits
three-year benefit PV
$584,182
Business User Productivity Improvement From Self-
Service
Interviewees name data democratization among their top goals for using
Alation. An enterprise data catalog can remove bottlenecks between
business users and big data to accelerate data-driven decision making.
Before Alation, typical steps to access necessary analytics included
submitting a request to data analysts, answering any clarifying questions,
waiting for the data to come back from an analyst, verifying whether the
data set looked as intended, and, if necessary, engaging in the follow-up
clarifications and waiting for updates. Alternatively, business users
attempted finding the necessary data on their own, but with little to no
documentation. If they did not seek guidance from analysts or data
engineers, they were rarely able to fully understand what the data meant
and whether it was right to use.
Alation enables business users to self-service and find answers in a
matter of hours. Documentation helps them to understand the data and
find experts if they still require guidance.
Analyst Productivity Improvement Due To Shortened Data Discovery: Calculation Table
REF. METRIC CALC. YEAR 1 YEAR 2 YEAR 3
A1 Number of data analysts Includes 5% growth YOY
75 79 83
A2 Number of data projects an analyst works on per day, on average
4 4 4
A3 Percent of analyst’s work affected by Alation Includes 5% growth YOY
70% 75% 80%
A4 Number of hours spent per project per day by an analyst
1.5 1.5 1.5
A5 Time spent on projects (hours) in one week A2*A4*5 days 30 30 30
A6 Time spent to serve business users prior to Alation per week (hours)
A1*A5*A3 1,575 1,778 1,992
A7 Percent reduction in time needed to complete a project with Alation
70% 70% 70%
A8 Analyst time savings due to Alation (hours) A6*A7 1,103 1,244 1,394
A9 Productivity capture 50% 50% 50%
A10 Data analyst hourly rate (fully burdened) $80,000/ 2,080 hours (rounded)
$38 $38 $38
At Analyst productivity improvement due to shortened data discovery
A8*A9*A10* 52 weeks
$1,089,270 $1,229,319 $1,377,667
Risk adjustment ↓10%
Atr Analyst productivity improvement due to shortened data discovery (risk-adjusted)
$980,343 $1,106,387 $1,239,900

12 | The Total Economic Impact™ Of The Alation Data Catalog
› Interviewed organizations acknowledge that business users find
Alation easy to use and frequently trend toward self-service instead of
turning to the data team for assistance. A software company sees a
35% reduction in the number of data requests as business users use
Alation to get the necessary data.
› A web hosting company uses Alation to build and document a library of
data sets to allow business users to answer 80% of their data
questions without coming to data analysts.
› Within the engineering company, business users represent 90% of
Alation users, and include engineering, finance, and HR. The senior
manager of self-service data and analytics at an engineering company
said: “That’s the whole goal of the program. We truly democratized
access to data with Alation. Our focus was on the end users in the
business.”
For the composite organization, Forrester assumes that:
› Within the organization, 200 business users start using Alation in Year
1, and the adoption grows by 10% each year.
› Prior to Alation, a business user would need to perform a custom data
analysis, on average, once every two weeks. Once Alation had been
introduced, business users could mostly find answers in the existing
data and only needed to run a custom analysis or data request once
every six weeks.
› A custom analysis requires, on average, 4 hours to complete.
The reduction in business user productivity gains will vary with:
› Business users’ adoption of Alation to self-service.
› Business users’ need for data in decision making and business
analysts’ commitment to document data in Alation.
› Business users’ average hourly burdened rate.
To account for these risks, Forrester adjusted this benefit downward by
10%, yielding a three-year, risk-adjusted total PV of $584,182.
With Alation, the
number of custom data
analyses a business
user had to conduct
was reduced from 26
to 9 per year, saving
68 hours of labor per
user.

13 | The Total Economic Impact™ Of The Alation Data Catalog
Data engineer productivity
improvements: 5% of total benefits
three-year benefit PV
$165,065
Data Engineer Productivity Improvements
Several interviewees spoke about the impact that Alation’s
implementation had on their enterprise data engineers. Before Alation,
data engineering teams were tasked with building data sets for
organizations, but there was no easy way of documenting or describing
the data. Neither was there an efficient way to communicate best
practices or concerns around the data to their consumers. With Alation
making data more usable for analysts and business users, the number of
requests that the engineering team receives to explain data, identify data
owners, schedule custom queries, and simplify data management is
reduced.
› The director of enterprise data and BI tools at a web hosting company
said: “[With Alation] we see value in understanding where the data is
being used. When we are getting ready to deprecate a table we can
easily notify users that it is going away.”
› Data engineers at a travel company save time by creating automation
that assigns ownership to each new incoming data source based on its
patterns, according to the technical account manager of a travel
technology company: “As soon as a new object comes in and matches
a certain pattern, it’s stamped with the owner. So now, nobody has to
worry about somebody coming in to search for an object and not
knowing who the owner is. Because it is automated, a user doesn’t
ever have to worry about it not being decorated, and engineers do not
have to go in and update the new [sources] that keep coming into the
catalog.”
For the composite organization, Forrester assumes that:
› The organization employs 25 data engineers.
Business User Productivity Improvement From Self-Service: Calculation Table
REF. METRIC CALC. YEAR 1 YEAR 2 YEAR 3
B1 Number of business users Includes 10% growth YOY
200 220 242
B2 Number of custom data assets built by business users prior to Alation
1 every other week
26 26 26
B3 Number of custom data assets built by business users with Alation
1 every 6 weeks 9 9 9
B4 Time required to build a custom data asset (hours)
4 4 4
B5 Business analyst time saved by self-service (hours)
(B2-B3)*B4*B1 13,600 14,960 16,456
B6 Business user average hourly burdened rate
$73,000/ 2,080 hours
$35 $35 $35
B7 Productivity capture 50% 50% 50%
Bt Business user productivity improvement from self-service
B5*B6*B7 $238,000 $261,800 $287,980
Risk adjustment ↓10%
Btr Business user productivity improvement from self-service (risk-adjusted)
$214,200 $235,620 $259,182

14 | The Total Economic Impact™ Of The Alation Data Catalog
three-year benefit PV
$286,085
Savings from faster onboarding of new
analysts: 8% of total benefits
› With Alation, data engineers save 5% of their time previously spent on
data management and serving data users.
› An average annual burdened salary for a data engineer is $118,000.
The productivity improvement for data engineers will vary with:
› The number of data engineers employed.
› Data engineers’ use of the Alation Data Catalog to manage data and
serve data users.
› The fully loaded compensation of data engineers.
To account for these risks, Forrester adjusted this benefit downward by
10%, yielding a three-year, risk-adjusted total PV of $165,065.
Savings From Faster Onboarding Of New Analysts
All interviewed organizations report that shortening the time it takes to
onboard newly hired data analysts is an important need. Prior to Alation,
it would take an average of two months to ramp a new analyst. A
significant portion of the onboarding process is dedicated to familiarizing
them with the data sources and types of data available, shadowing other
analysts on how they handle data requests and write queries.
Interviewed organizations explain that analysts need to master several
tools in order to be successful in their role. In one organization the need
to switch from one tool to another frequently contributes to high analyst
attrition. Alation provides the environment for learning from real
organizational use cases, best practices, and experts.
› The VP of information management and strategy at a software
company said, “For the new hires, Alation became a single source of
truth to learn and understand our data assets, queries, what they are
producing, and how you handle them.”
› The technical account manager at a travel company said, “Teaching
and onboarding new analysts is easier and happens on the fly.”
For the composite organization, Forrester assumes that:
Data Engineer Productivity Improvements: Calculation Table
REF. METRIC CALC. YEAR 1 YEAR 2 YEAR 3
C1 Number of data engineers supporting enterprise data
25 25 25
C2 Percentage of data engineers’ time saved with Alation
5% 5% 5%
C3 Data engineers’ time saved with Alation (hours)
C1*2,080 hours*C2
2,600 2,600 2,600
C4 Data engineers’ average hourly burdened rate
$118,000/ 2,080 hours
$57 $57 $57
C5 Productivity capture 50% 50% 50%
Ct Data engineer productivity improvements C3*C4*C5 $73,750 $73,750 $73,750
Risk adjustment ↓10%
Ctr Data engineer productivity improvements (risk-adjusted)
$66,375 $66,375 $66,375
“I think now we have people
doing the right thing in the
right areas, as opposed to
having the heavy technical
team handling simple data
requests.”
Director of enterprise data and BI
tools, web hosting

15 | The Total Economic Impact™ Of The Alation Data Catalog
› The organization grows its data analyst team by 5% each year.
› The average turnover rate for data analysts in the organization is 21%.
The organization fills positions of the departed analysts every year.
› Prior to Alation, analysts need two months to get comfortable with the
organization’s data structure and query process.
› The use of Alation shortens the onboarding process by 50%.
The reduction in software development expenses will vary with:
› The number of analyst new hires requiring onboarding.
› The organization’s data complexity and the average onboarding time
prior to Alation.
› Data analysts’ turnover rate.
› Data analysts’ burdened annual compensation.
To account for these risks, Forrester adjusted this benefit downward by
10%, yielding a three-year, risk-adjusted total PV of $286,085.
Unquantified Benefits
› Data catalog prevents data lakes from turning into data swamps.
Forrester predicted that for 2018 one-third of all data lakes would be
taken off life support. Prior to Alation, several interviewed organizations
heavily invested in building these data lakes. However, without a way
to navigate across the ecosystem that fed these lakes, automatically
indexing and tagging raw data, the lakes ran the risk of sitting idle and,
ultimately, turning into sunk costs. Alation’s data catalog ingests and
categorizes that data, making it an actionable resource for all data
users in the organization instead of a data swamp.
Savings From Faster Onboarding Of New Analysts: Calculation Table
REF. METRIC CALC. YEAR 1 YEAR 2 YEAR 3
D1 New analysts hired every month due to organization growth
0 4 4
D2 Average analyst turnover Industry data 21% 21% 21%
D3 Analysts replaced due to turnover A1*D2 16 17 17
D4 Time to onboard a new analyst prior to Alation (months)
2 2 2
D5 Percent reduction in time to onboard a new analyst with Alation
50% 50% 50%
D6 Data analyst monthly salary (fully burdened) $80,000/ 12 months
$6,667 $6,667 $6,667
Dt Savings from faster analyst onboarding of new analysts
(D1+D3)*D4*D5*D6
$106,672 $140,007 $140,007
Risk adjustment ↓10%
Dtr Savings from faster analyst onboarding of new analysts (risk-adjusted)
$96,005 $126,006 $126,006
The use of Alation
shortens the analyst
onboarding process by
50%.
“Alation improves the quality of
our data because without it
people would stumble across
the challenges someone else
already resolved.”
Data engineering consultant,
insurance

16 | The Total Economic Impact™ Of The Alation Data Catalog
› Alation enables collaboration around data. Alation allows users to
see how others create and share knowledge, including query-building
advice, identifying top users and internal experts, and sharing
endorsements, warnings, or advice for the existing data sets. As a
manager of self-service and analytics at an engineering organization
said: “The collaboration component of the catalog helps us bridge
employees in different divisions. It also centralizes the network and
becomes a good place to document [best practices].”
› Alation facilitates documentation of tribal knowledge. Without
Alation, users have no way of easily documenting and sharing the
insights from important conversations over solutions to finding and
writing queries. Alation provides automated capture of metadata that
saves time from manually documenting data assets. It lowers the
barrier to capturing tribal knowledge by inviting users to curate their
data and share with others.
› Increased data transparency and reuse improve the accuracy of
analysis. Alation provides the platform for finding existing data sets
and building upon the work already done versus starting fresh every
time. Repeated use of the already verified queries or data sets allows
users to use proven standards, get consistent results, learn, and avoid
repeated mistakes. Reuse of certified assets, rather than creating their
own, also guarantees better adherence to best practices and reduces
the risks of noncompliant queries. The data engineering consultant at
an insurance organization noted: “Alation improves the quality of our
analysis because without it people would stumble across the
challenges someone else already resolved. For example, we have one
data set that consists of 40 tables. Someone wrote and checked a flat
table, and now everyone can connect to this table and doesn’t have to
think about how to correctly represent the hierarchy based on those 40
tables again.”
› Alation increases compliance with data governance policies.
Business users can gain access to data that is relevant and prepared
without considering if they should trust that data. Alation embeds data
governance definitions and policies side by side with the data, and
features like TrustCheck automate compliance recommendations to
assist with policy enforcement. The data engineering consultant at an
insurance company further explained: “Alation for us is about
consolidation and management of the global data and about
governance. We use the catalog to define what data you are allowed to
analyze and what restrictions are there as well as the guidelines and
the process.”
› Business outcomes. While they struggle to quantify it, several
interviewed companies experience impact to their topline from using
Alation:
• Alation allowed analysts at a web hosting company to spend less
time on supporting data requests, enabling them to dive deeper
into the company data to understand customer behavior and
identify difficulties customers had with some of the services. As a
result, the organization made changes to improve customer
experience and become more customer focused.
• With the help of Alation, an electronic component distributor was
able to start delivering parts to market faster. The organization’s
compliance department had to assign an export control class
number to each part as it came in. In the past, the team relied on a
“We never had that kind of a
relationship between the data
engineers and analysts where
the engineers could prescribe
best practices in a way that
was helpful and usable.”
Technical account manager,
travel technology
“[Using Alation] definitely made
us a better company because
we are now aware and are
paying attention to our
customers and end users. We
can help them along in their
journey as opposed to being
an order shop.”
Director of enterprise data and BI
tools, web hosting

17 | The Total Economic Impact™ Of The Alation Data Catalog
Flexibility, as defined by TEI, represents an investment in additional capacity or capability that could be turned into business benefit for a future additional investment. This provides an organization with the “right” or the ability to engage in future initiatives but not the obligation to do so.
legacy operational report. With Alation, the team “could find
numbers quickly and drill down to exactly what they were looking
for,” allowing the team to assign the export control class numbers
and get the products to market faster.
Flexibility
The value of flexibility is clearly unique to each customer, and the
measure of its value varies from organization to organization. There are
multiple scenarios in which a customer might choose to implement
Alation and later realize additional uses and business opportunities,
including:
› Fostering self-service culture. Organizations’ push to be data-and
insights-driven puts more pressure on business users to make
decisions quickly, taking away the luxury of waiting days until
necessary data is ready and provided by the data team. Interviewed
customers look to expand the number and increase the level of comfort
for business decision makers to use Alation and explore what they
need in real time to keep up with customers, competitors, and
partners.4
› Embedding Alation further into the data environment. Some
interviewed companies mentioned that they plan to build new
connectors to certain data sources in their environment to expand their
use of Alation. Others are considering developing applications to
connect Alation to other tools for fast definition and search of rules.
› Analyzing data use to optimize data consumption. Several
interviewees told Forrester that Alation allows companies to track what
data is used and how, who the active users are, and which queries are
most popular. While the interviewees said they were only starting to
track the patterns, they saw how this knowledge could help identify
direction for future improvements or additional training.
› Retiring homegrown data management tools. Prior to Alation,
several interviewed organizations developed internal tools to describe
and organize data. Alation far outperformed the capabilities of the
homegrown solutions, and organizations were in the process of
sunsetting them and reassigning resources.
Flexibility would also be quantified when evaluated as part of a specific
project (described in more detail in Appendix A).

18 | The Total Economic Impact™ Of The Alation Data Catalog
The table above shows the total of all costs across the areas listed below, as well as present values (PVs) discounted at 10%. Over three years, the composite organization expects risk-adjusted total costs to be a PV of $813,202.
Analysis Of Costs
QUANTIFIED COST DATA AS APPLIED TO THE COMPOSITE
Fees To Alation
The fees to Alation include a subscription to a server and are determined
by the number of Alation users and the distribution between the type of
licenses that users receive, which includes Contributors, Consumers,
and Collaborators.
For the composite organization with 300 Alation users, the annual price
amounts to $246,000, and it goes up as the number of users increases in
Year 2 and Year 3.
Forrester did not risk-adjust this cost because the calculation is based on
the average price paid per user based on their role and technology costs
that came from Alation. The three-year total PV was $652,440.
For more information regarding Alation pricing specific for your
organization and use case, please contact your Alation representative.
Implementation Cost
All interviewed organizations describe the Alation installation as an easy
process requiring up to two weeks of developers’ time. The following
phase of connecting the organization’s environment to Alation required
several months’ worth of effort from several employees across different
roles. For some companies, the legal department needed to approve
data integrations to ensure compliance with company security protocols
and any relevant organizational and industry requirements.
Total Costs
REF. COST INITIAL YEAR 1 YEAR 2 YEAR 3 TOTAL PRESENT VALUE
Etr Fees to Alation $0 $246,000 $266,580 $277,500 $790,080 $652,440
Ftr Implementation cost $9,328 $0 $0 $0 $9,328 $9,328
Gtr Training and adoption cost $31,889 $1,328 $3,404 $3,570 $40,192 $38,593
Htr Ongoing management $0 $45,375 $45,375 $45,375 $136,125 $112,841
Total costs (risk-adjusted) $41,217 $292,703 $315,359 $326,445 $975,725 $813,202
Fees To Alation: Calculation Table
REF. METRIC CALC. INITIAL YEAR 1 YEAR 2 YEAR 3
E1 Fees to Alation $246,000 $266,580 $277,500
Et Fees to Alation E1 $0 $246,000 $266,580 $277,500
Risk adjustment 0%
Etr Fees to Alation (risk-adjusted) $0 $246,000 $266,580 $277,500

19 | The Total Economic Impact™ Of The Alation Data Catalog
Implementation risk is the risk that a proposed investment may deviate from the original or expected requirements, resulting in higher costs than anticipated. The greater the uncertainty, the wider the potential range of outcomes for cost estimates.
For the composite organization Forrester assumes:
› Two engineers work on the initial installation and configure Alation’s
connection to the organization’s data sources.
› The organization uses connectors available through Alation and does
not need to develop any custom connectors. If new connectors were
necessary, the organization would incur additional development costs.
The cost of implementation would vary based on:
› The complexity of the existing data landscape and the team’s
dedication to connecting Alation to the environment.
› The number and salaries of FTEs involved in implementation.
To account for these risks, Forrester adjusted this cost upward by 10%,
yielding a three-year, risk-adjusted total PV of $9,328.
Training And Adoption Cost
Interviewees recognize that for their investment in Alation to have a
positive outcome, they need to get data analysts and business users to
use Alation and be proficient in the tool.
› An insurance company includes Alation training in its two-day big data
analytics training course, that’s aimed at introducing users to the
catalog and its main capabilities and dashboards.
› The online marketplace company provides regular webinars to
introduce business users to Alation for the first several months of using
the enterprise data catalog.
› A software company also runs regular training sessions to teach users
necessary skills, such as how to automate queries, write an article, and
how to customize a field in Alation.
› In addition to the training program, to stimulate user adoption rates and
engage their analyst community, the engineering company develops a
gamification program where users receive badges and rewards for
using Alation.
› An electronic component distributor runs a similar program with its
“Alation Days,” where data analysts and engineers are encouraged to
pause other work and focus on writing queries and creating
documentation in Alation. The most active participants receive
recognition and rewards.
Implementation Cost: Calculation Table
REF. METRIC CALC. INITIAL YEAR 1 YEAR 2 YEAR 3
F2 Engineering effort required to install Alation initial source connectivity (hours)
2 weeks for 2 engineers
160
F3 Engineer average burdened hourly rate (rounded)
$110,000/ 2,080 hours
$53
Ft Cost of implementation and initial adoption
F1+F2*F3 $8,480 $0 $0 $0
Risk adjustment ↑10%
Ftr Cost of implementation and initial adoption (risk-adjusted)
$9,328 $0 $0 $0
To stimulate user
adoption rates and
engage their analyst
community, the
engineering company
successfully executes a
gamification program in
which users receive
badges and rewards for
using Alation.

20 | The Total Economic Impact™ Of The Alation Data Catalog
For the composite organization Forrester assumes:
› Data/analytics leadership FTE(s) dedicate 80 hours to develop an
adoption and training program.
› Every user with access to Alation goes through a 2-hour training to
learn how to use the data catalog. Initially, the organization trains 300
new users, and every following year new hires and FTEs receive the
same training.
› An average user hourly rate amounts to $38.
Training and change management costs will vary based on:
› Organization’s effort to train employees new to Alation and to interest
them in using the platform.
› Number of employees who need to be trained and their prior
experience with data and data queries.
› Employees’ average hourly rate.
To account for these risks, Forrester adjusted this cost upward by 10%,
yielding a three-year, risk-adjusted total PV of $38,593.
Ongoing Management
All organizations report that Alation requires little maintenance and
administration. Their ongoing use exhibits the following patterns:
› An engineering company has less than one FTE’s worth of managing
the platform. It assigned four to five FTEs part-time to enhance the
processes around using the data catalog enterprisewide to further
integrate it within the organization’s environment.
› For the insurance company, the IT team takes on the administrative
efforts, and the data engineering team spends under 5% of their time
to quality control new integrations and features.
Training And Adoption Cost: Calculation Table
REF. METRIC CALC. INITIAL YEAR 1 YEAR 2 YEAR 3
G1 Data/analytics management hours dedicated to change management
80
G2 Data leadership burdened hourly rate
$165,000/ 2,080 hours
$79
G3 Training/adoption program development cost
G1*G2 6,346
G4 Number of users trained to use Alation
All users initially, then new hires only
300 16 41 43
G5 Hours required for training 2 2 2 2
G6 Average FTE hourly rate (Rounded) $38 $38 $38 $38
Gt Training and adoption cost G4*G5*G6 $28,990 $1,208 $3,095 $3,246
Risk adjustment ↑10%
Gtr Training and adoption cost (risk-adjusted)
$31,889 $1,328 $3,404 $3,570
One developer
dedicates 30% of their
time to building
enhancements and new
integrations for Alation.

21 | The Total Economic Impact™ Of The Alation Data Catalog
› A software company dedicates a product manager, an operations FTE,
and several developers part-time to managing the platform and
building connectors.
For the composite organization Forrester assumes:
› Data/analytics leadership FTE(s) dedicate 5% of their time to Alation
oversight.
› One developer dedicates 30% of their time to building enhancements
and new integrations for Alation.
The cost will vary based on:
› The number of Alation-related dev initiatives led by the organization
and the complexity of the organization’s data environment.
› Development effort required to support these data initiatives.
› Fully loaded salaries of developers and data/analytics leadership.
To account for these risks, Forrester adjusted this cost upward by 10%,
yielding a three-year, risk-adjusted total PV of $112,841.
Ongoing Management: Calculation Table
REF. METRIC CALC. INITIAL YEAR 1 YEAR 2 YEAR 3
H1 Percent of one product owner’s time to manage the platform
5% 5% 5%
H2 Director of analytics, average burdened annual salary
(Rounded) $165,000 $165,000 $165,000
H3 Number of developers building enhancements and new integrations
1 1 1
H4 Percentage of 1 developer’s time dedicated to Alation work
30% 30% 30%
H5 Developer annual fully burdened salary
(Rounded) $110,000 $110,000 $110,000
Ht Ongoing management (H1*H2)+ (H3*H4*H5)
$0 $41,250 $41,250 $41,250
Risk adjustment ↑10%
Htr Ongoing management (risk-adjusted)
$0 $45,375 $45,375 $45,375

22 | The Total Economic Impact™ Of The Alation Data Catalog
The financial results calculated in the Benefits and Costs sections can be used to determine the ROI and NPV for the composite organization’s investment. Forrester assumes a yearly discount rate of 10% for this analysis.
Financial Summary
CONSOLIDATED THREE-YEAR RISK-ADJUSTED METRICS
Cash Flow Chart (Risk-Adjusted)
-$1.0 M
-$0.5 M
$0.5 M
$1.0 M
$1.5 M
$2.0 M
$2.5 M
$3.0 M
$3.5 M
$4.0 M
Initial Year 1 Year 2 Year 3
Cashflows
Total costs
Total benefits
Cumulative net benefits
These risk-adjusted ROI
and NPV values are
determined by applying
risk-adjustment factors to
the unadjusted results in
each Benefit and Cost
section.
Cash Flow Table (Risk-Adjusted)
INITIAL YEAR 1 YEAR 2 YEAR 3 TOTAL PRESENT VALUE
Total costs ($41,217) ($292,703) ($315,359) ($326,445) ($975,725) ($813,202)
Total benefits $0 $1,356,923 $1,534,388 $1,691,464 $4,582,775 $3,772,478
Net benefits ($41,217) $1,064,219 $1,219,029 $1,365,019 $3,607,050 $2,959,276
ROI 364%

23 | The Total Economic Impact™ Of The Alation Data Catalog
Alation: Overview
The following information is provided by Alation. Forrester has not validated any claims and does not endorse
Alation or its offerings.
The Alation Data Catalog The first data catalog designed for human collaboration
Alation is changing the way people find, understand, trust, use, and reuse data. We make all of this possible with the world’s first collaborative enterprise data catalog. Alation’s data catalog acts as a recommendation engine for your data, delivers agile data governance, and connects data to insights in a self-service analytics environment. It automatically collects all knowledge about your data and its usage, so useful information is always available, allowing everyone in the organization, from data novices to experts, to easily search, collaborate,
and leverage knowledge from one trustworthy source. It’s a powerful solution that dramatically improves analytic productivity and empowers better business decisions for all.
Alation is building a customer-first data culture and has been credited by Forrester* for creating and leading the ‘Machine Learning Data Catalog’ category.
*The Forrester Wave™: Machine Learning Data Catalogs, Q2 2018, June 2018
A Data Catalog Is Only As Good As Its Applications
Alation surfaces proactive recommendations to data consumers through its applications, to make your life easier
Browse all your data–no technical jargon needed
We took inspiration from Google for a simple interface to connect the language of your business to the technical schema of your data. Finding the data you need is no longer stalled by tricky semantic translations.
SEARCH
Increase productivity for both the SQL-savvy and the novice
Interested in using a data set for analysis, but not sure
which filters or joins to use? We’ll guide you through building a query with inline recommendations powered by the Alation Data Catalog.
COMPOSE
Best practices shared through endorsements and warnings
In the creative flow of analysis, it’s easy to forget governance policies and best practices. Alation ensures that both data policies and proactive recommendations are available in real time, as you work.
CURATE
Share work seamlessly in a wiki built for data analysis
Collaborating with data is challenging. Data updates automatically and conclusions change. Cut and paste mistakes result in errors. Alation removes these barriers to teamwork with data-aware collaboration tools.
COLLABORATE

24 | The Total Economic Impact™ Of The Alation Data Catalog
Appendix A: Total Economic Impact
Total Economic Impact is a methodology developed by Forrester
Research that enhances a company’s technology decision-making
processes and assists vendors in communicating the value proposition
of their products and services to clients. The TEI methodology helps
companies demonstrate, justify, and realize the tangible value of IT
initiatives to both senior management and other key business
stakeholders.
Total Economic Impact Approach
Benefits represent the value delivered to the business by the
product. The TEI methodology places equal weight on the
measure of benefits and the measure of costs, allowing for a
full examination of the effect of the technology on the entire
organization.
Costs consider all expenses necessary to deliver the
proposed value, or benefits, of the product. The cost category
within TEI captures incremental costs over the existing
environment for ongoing costs associated with the solution.
Flexibility represents the strategic value that can be
obtained for some future additional investment building on
top of the initial investment already made. Having the ability
to capture that benefit has a PV that can be estimated.
Risks measure the uncertainty of benefit and cost estimates
given: 1) the likelihood that estimates will meet original
projections and 2) the likelihood that estimates will be
tracked over time. TEI risk factors are based on “triangular
distribution.”
The initial investment column contains costs incurred at “time 0” or at the
beginning of Year 1 that are not discounted. All other cash flows are discounted
using the discount rate at the end of the year. PV calculations are calculated for
each total cost and benefit estimate. NPV calculations in the summary tables are
the sum of the initial investment and the discounted cash flows in each year.
Sums and present value calculations of the Total Benefits, Total Costs, and
Cash Flow tables may not exactly add up, as some rounding may occur.
Present value (PV)
The present or current value of (discounted) cost and benefit estimates given at an interest rate (the discount rate). The PV of costs and benefits feed into the total NPV of cash flows.
Net present value (NPV)
The present or current value of (discounted) future net cash flows given an interest rate (the discount rate). A positive project NPV normally indicates that the investment should be made, unless other projects have higher NPVs.
Return on investment (ROI)
A project’s expected return in percentage terms. ROI is calculated by dividing net benefits (benefits less costs) by costs.
Discount rate
The interest rate used in cash flow analysis to take into account the time value of money. Organizations typically use discount rates between 8% and 16%.
Payback period
The breakeven point for an investment. This is the point in time at which net benefits (benefits minus costs) equal initial investment or cost.

25 | The Total Economic Impact™ Of The Alation Data Catalog
Appendix B: Supplemental Material
Related Forrester Research
“The Forrester Wave™: Machine Learning Data Catalogs, Q2 2018,” Forrester Research, Inc., June 21, 2018.
Appendix C: Endnotes
1 Source: Forrester Analytics Global Business Technographics® Data And Analytics Survey, 2018. 2 Source: “The Forrester Wave™: Machine Learning Data Catalogs, Q2 2018,” Forrester Research, Inc., June 21, 2018. 3 Source: “Your Business Is Only As Fast As Your Data,” Forrester Research Inc., November 13, 2018. 4 Source: “Create A Road Map For A Real-Time, Agile, Self-Service Data Platform,” Forrester Research, Inc., November 20, 2018.


![Catalog expetro™ 2014 [rus] links](https://static.fdocuments.us/doc/165x107/55a385731a28ab63388b4627/catalog-expetro-2014-rus-links.jpg)


