The Total Economic Impact™ Of Synopsys Software Testing...
33
A Forrester Total Economic Impact™ Study Commissioned By Synopsys Project Director: Liz Witherspoon September 2016 The Total Economic Impact™ Of Synopsys Software Testing Tools: Coverity And Defensics
Transcript of The Total Economic Impact™ Of Synopsys Software Testing...
A Forrester Total Economic
Impact™ Study
Commissioned By
Synopsys
Project Director:
Liz Witherspoon
September 2016
The Total Economic
Impact™ Of Synopsys
Software Testing Tools:
Coverity And Defensics
Table Of Contents
Executive Summary .................................................................................... 3
Disclosures .................................................................................................. 6
TEI Framework And Methodology ............................................................ 7
Analysis ........................................................................................................ 8
Financial Summary ................................................................................... 26
Product Overview: Coverity ..................................................................... 27
Product Overview: Defensics .................................................................. 29
Appendix A: Total Economic Impact™ Overview ................................. 30
Appendix B: Forrester And The Age Of The Customer ....................... 31
Appendix C: Glossary ............................................................................... 32
Appendix D: Endnotes .............................................................................. 33
ABOUT FORRESTER CONSULTING
Forrester Consulting provides independent and objective research-based
consulting to help leaders succeed in their organizations. Ranging in scope from a
short strategy session to custom projects, Forrester’s Consulting services connect
you directly with research analysts who apply expert insight to your specific
business challenges. For more information, visit forrester.com/consulting.
© 2016, Forrester Research, Inc. All rights reserved. Unauthorized reproduction is strictly prohibited.
Information is based on best available resources. Opinions reflect judgment at the time and are subject to
change. Forrester®, Technographics
®, Forrester Wave, RoleView, TechRadar, and Total Economic Impact
are trademarks of Forrester Research, Inc. All other trademarks are the property of their respective
companies. For additional information, go to www.forrester.com.
3
Executive Summary
Synopsys commissioned Forrester Consulting to conduct a
Total Economic Impact™ (TEI) study and examine the
potential return on investment (ROI) enterprises may realize
by deploying Coverity and Defensics. The purpose of this
study is to provide readers with a framework to evaluate the
potential financial impact of these tools on their organizations.
To better understand the benefits, costs, and risks associated
with a Coverity and Defensics implementation, Forrester
interviewed multiple testing engineers from an existing
customer with multiple years of experience using both security
testing tools. Coverity is a static analysis tool that enables
companies to find and fix quality defects and security
vulnerabilities in source code earlier in the software
development life cycle (SDLC) when they are cheaper and
easier to address. Defensics is a fuzz testing tool that
dynamically triggers and detects unknown vulnerabilities in a
test environment and can be used proactively to preempt
zero-day attacks. Both tools are used to prevent a product
from going to market with errors that can turn into costly
failures or security attack points in a production environment.
Both tools also reduce costs related to remediating code
defects/vulnerabilities at different stages of the SDLC.
Prior to Coverity and Defensics, the customer did not have a
systematic approach and tool set to find and fix software
defects that could lead to security vulnerabilities. It relied on a traditional software development life cycle approach with
teams of quality assurance testers writing and executing test scripts. This worked when end products were not exposed to
the internet, but the internet of things (IoT) changed that, bringing a host of new security threats alongside its networked
world. Furthermore, this company — a supplier of consumer communications devices to large telecom companies — was
required by its top-tier customers to include testing tools to meet the requirements of their contracts. This left the organization
no choice but to find a suite of testing tools that could satisfy those requirements and the contracts for its top two customers,
who comprised 35% of its annual revenue. With Coverity and Defensics, the organization was able to quickly implement a
fuzz testing and static analysis tool set and immediately catch defects and security vulnerabilities that — left undetected —
would have been costly to fix and could cause high-profile security incidents that would hurt its reputation. Said one systems
and integration test engineer, “Previously, the only way that our products could have been compromised was by something
happening at a customer site. Now, we know we are responsible for those products because what we deliver is affected by
the connections on the internet. With Synopsys, we are minimizing our risk exposure and ensuring that we don’t lose the
contract or business with the client.”
SYNOPSYS REDUCES REMEDIATION COSTS AND IMPROVES PRODUCT TIME-TO-MARKET
Our interviews with five systems and integration testing engineer leaders in the organization and subsequent financial
analysis found that the interviewed organization experienced the risk-adjusted ROI, benefits, and costs shown in Figure 1.1
With Coverity and Defensics, the organization reduced its cost to detect and remediate defects/vulnerabilities in both the
software development and testing phases. In addition, the development and testing teams were able to add new code bases
and maintain its existing code base more cost-effectively. The organization experienced additional business disruption
avoidance savings and faster time-to-market for its consumer products.
Combined, Coverity and Defensics reduce the
cost of remediation of defects and security
vulnerabilities and help prevent high-profile and
expensive failures from occurring when products
are in-market. The testing tools also reduce the
time-to-market for new products.
The interviewed company experienced the
following benefits:
Benefits of about $9.5 million over three
years (present value).
A five-time reduction in
defect/vulnerability remediation costs due
to earlier detection in the development
phase.
A two-time reduction in
defect/vulnerability remediation costs due
to earlier detection in the testing phase.
A 25% decrease in the time-to-market for
new products.
4
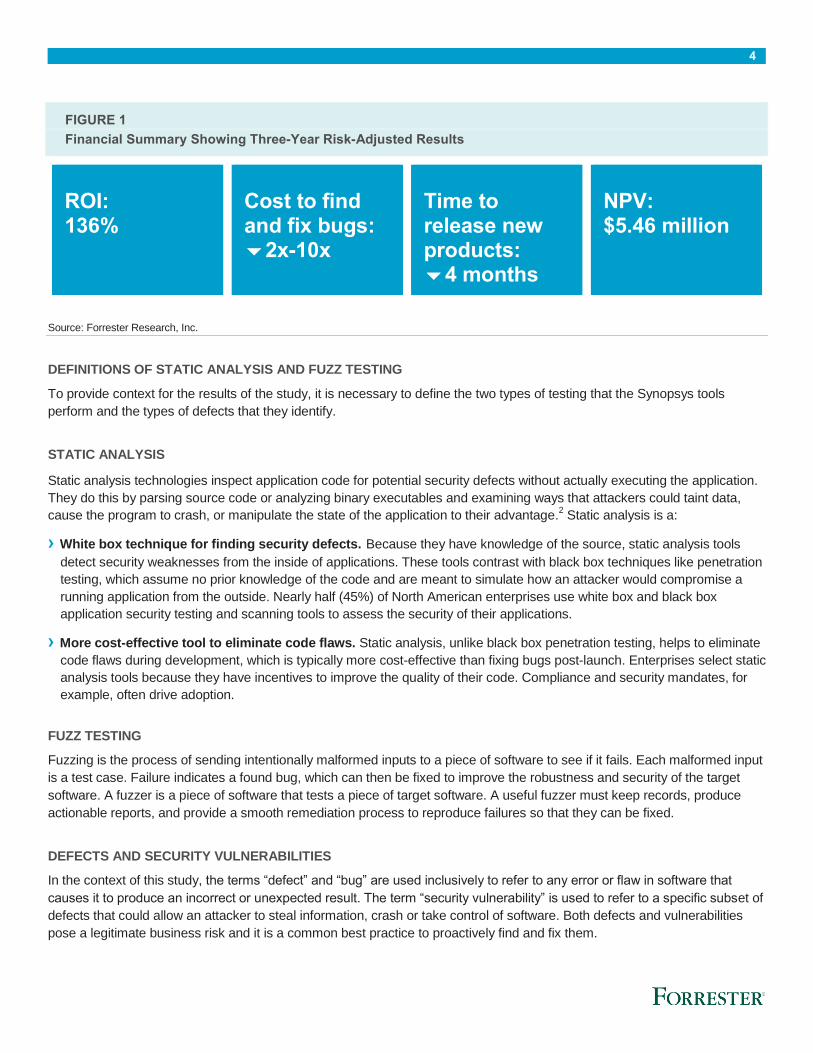
FIGURE 1
Financial Summary Showing Three-Year Risk-Adjusted Results
ROI: 136%
Cost to find and fix bugs: 2x-10x
Time to release new products: 4 months
NPV: $5.46 million
Source: Forrester Research, Inc.
DEFINITIONS OF STATIC ANALYSIS AND FUZZ TESTING
To provide context for the results of the study, it is necessary to define the two types of testing that the Synopsys tools
perform and the types of defects that they identify.
STATIC ANALYSIS
Static analysis technologies inspect application code for potential security defects without actually executing the application.
They do this by parsing source code or analyzing binary executables and examining ways that attackers could taint data,
cause the program to crash, or manipulate the state of the application to their advantage.2 Static analysis is a:
› White box technique for finding security defects. Because they have knowledge of the source, static analysis tools
detect security weaknesses from the inside of applications. These tools contrast with black box techniques like penetration
testing, which assume no prior knowledge of the code and are meant to simulate how an attacker would compromise a
running application from the outside. Nearly half (45%) of North American enterprises use white box and black box
application security testing and scanning tools to assess the security of their applications.
› More cost-effective tool to eliminate code flaws. Static analysis, unlike black box penetration testing, helps to eliminate
code flaws during development, which is typically more cost-effective than fixing bugs post-launch. Enterprises select static
analysis tools because they have incentives to improve the quality of their code. Compliance and security mandates, for
example, often drive adoption.
FUZZ TESTING
Fuzzing is the process of sending intentionally malformed inputs to a piece of software to see if it fails. Each malformed input
is a test case. Failure indicates a found bug, which can then be fixed to improve the robustness and security of the target
software. A fuzzer is a piece of software that tests a piece of target software. A useful fuzzer must keep records, produce
actionable reports, and provide a smooth remediation process to reproduce failures so that they can be fixed.
DEFECTS AND SECURITY VULNERABILITIES
In the context of this study, the terms “defect” and “bug” are used inclusively to refer to any error or flaw in software that
causes it to produce an incorrect or unexpected result. The term “security vulnerability” is used to refer to a specific subset of
defects that could allow an attacker to steal information, crash or take control of software. Both defects and vulnerabilities
pose a legitimate business risk and it is a common best practice to proactively find and fix them.
5
THE BENEFITS AND COSTS DESCRIBED IN THIS STUDY
Below is a summary of the benefits, costs, and future value of Coverity and Defensics captured in this study.
› Benefits. The interviewed organization experienced the following risk-adjusted benefits:
• Defect and security vulnerabilities remediation expenses avoided due to static analysis — existing code
bases. The cost to remediate defects/vulnerabilities introduced in the coding phase was reduced for eight existing
code bases, saving $3.86 million (present value). This improvement was complemented by Coverity’s low false
positive rate of about 15%.
• Defect and security vulnerabilities remediation expenses avoided due to static analysis — new code bases
and maintenance of existing code bases. The interviewed organization indicated that a key benefit from using the
Coverity testing tool for static analysis was a reduction in ongoing costs to remediate defects/vulnerabilities found in
new code bases and to maintain existing code bases. This saved the organization $2.3 million (present value).
• Defect and security vulnerabilities remediation expenses avoided due to fuzz testing. On the first test run of
Defensics, the organization was able to detect and remediate 40 defects/vulnerabilities through fuzz testing for
products heading to production. These defects could be remediated for two times fewer labor hours than later in the
post-release phase.
• Faster time-to-market for new products. Using fuzz testing and static analysis, the organization was able to
reduce its product release cycle from 12 months to eight months. This, in turn, enabled the company to redirect
resources toward other productive activities.
• Business disruption avoidance due to improved security testing. The use of Defensics for fuzz testing
prevented the organization from releasing products with defects/vulnerabilities that cause high-profile incidents,
something that had occurred before it purchased Synopsys’ testing suite.
› Costs. The interviewed organization experienced the following risk-adjusted costs:
• Software licensing fees for Coverity. These are annually recurring fees paid to Synopsys based on the lines of
code that are created by the development team.
• Software licensing fees for Defensics. These are annually recurring fees paid to Synopsys based on the number
of licenses used for Defensics.
• Onsite consulting services costs. These include costs for assistance with implementation and integration of the
Coverity and Defensics tools.
› Flexibility. The interviewed organization experienced the following flexibility benefits:
• Reduced defect density rate from code reuse. Once libraries of code are built, they are reused. By lowering the
defect density within its code base, the organization prevented future costs of allowing error-prone code to be
reused.
• Lower exposure to risk overall. Although the organization did not experience a malicious attack, the threat of a
security vulnerability opening it up to attack was ever-present. Coverity and Defensics lower future exposure to risk.
6
Disclosures
The reader should be aware of the following:
› The study is commissioned by Synopsys and delivered by Forrester Consulting. It is not meant to be used as a competitive
analysis.
› Forrester makes no assumptions as to the potential ROI that other organizations will receive. Forrester strongly advises
that readers use their own estimates within the framework provided in the report to determine the appropriateness of an
investment in Synopsys’ Coverity and Defensics products.
› Synopsys reviewed and provided feedback to Forrester, but Forrester maintains editorial control over the study and its
findings and does not accept changes to the study that contradict Forrester's findings or obscure the meaning of the study.
› Synopsys provided the customer names for the interviews but did not participate in the interviews.
7
TEI Framework And Methodology
INTRODUCTION
From the information provided in the interviews, Forrester has constructed a Total Economic Impact (TEI) framework for
those organizations considering implementing Coverity and Defensics. The objective of the framework is to identify the cost,
benefit, flexibility, and risk factors that affect the investment decision.
APPROACH AND METHODOLOGY
Forrester took a multistep approach to evaluate the impact that Coverity and Defensics can have on an organization (see
Figure 2). Specifically, we:
› Interviewed Synopsys marketing, sales, and consulting personnel, along with Forrester analysts, to gather data relative to
Coverity and Defensics and the marketplace for Coverity and Defensics.
› Interviewed multiple quality assurance testing leaders at one organization currently using Coverity and Defensics to obtain
data with respect to costs, benefits, and risks.
› Constructed a financial model representative of the interviews using the TEI methodology. The financial model is
populated with the cost and benefit data obtained from the interviews.
› Risk-adjusted the financial model based on issues and concerns the interviewed organization highlighted in interviews.
Risk adjustment is a key part of the TEI methodology. While the interviewed organization provided cost and benefit
estimates, some categories included a broad range of responses or had a number of outside forces that might have
affected the results. For that reason, some cost and benefit totals have been risk-adjusted and are detailed in each
relevant section.
Forrester employed four fundamental elements of TEI in modeling Synopsys’ products: benefits, costs, flexibility, and risks.
Given the increasing sophistication that enterprises have regarding ROI analyses related to IT investments, Forrester’s TEI
methodology serves to provide a complete picture of the total economic impact of purchase decisions. Please see Appendix
A for additional information on the TEI methodology.
FIGURE 2
TEI Approach
Source: Forrester Research, Inc.
Perform due diligence
Conduct customer interviews
Construct financial model using TEI
framework
Write case study
8
Analysis
INTERVIEWED ORGANIZATION DETAILS
The organization interviewed for this research is an entertainment and communications technology company that provides
hardware, software, and services to service and content providers for TV and internet. Its products include set-top boxes,
digital video, and Internet Protocol television (IPTV) distribution systems, along with cable equipment that reaches
consumers across the cloud, network, and home. While this multibillion-dollar global organization has a diversified product
line, only two of its customers make up 35% of its total revenues, a risk that is mentioned both in the company’s 10K report
and in the interviews conducted for this research. Any risk to these large contracts means significant lost revenue for the
company. Any brand reputation issues related to security vulnerabilities of its equipment further threaten those customer
relationships. Under the risks section of its 10K report, the organization writes: “Defects within our products could have a
material impact on our results. Many of our products are complex technology that include both hardware and software
components. It is not unusual for software, especially in earlier versions, to contain bugs that can unexpectedly interfere with
expected operations.”
For this study, Forrester conducted a total of three interviews with
four quality assurance leaders in the organization. They included:
› The lead systems and integration test engineer responsible for
testing set-top boxes. His primary role is to come up with tests,
which includes doing research on testing based on the
requirements and results the customer wants to achieve. He then
develops test plans for his team of testers to run. His team
comprises 15 people across multiple locations. They tested three
products using Defensics, and there are now approximately 3
million of these products in the field.
› The senior QA engineer and staff engineer system tester
responsible for testing four DSL products with four to five
releases per year for each. This group performs end-to-end
testing — system testing — of the whole product. They test the
application and firewall functionality in the box and do Layer 7
testing.
› The senior manager of DevOps and release engineering
responsible for all open and proprietary software. This team tests
code for eight code bases and around 11 million lines of code.
INTERVIEW HIGHLIGHTS
After experiencing an unplanned incident that looked malicious
(though it was not), the organization realized it needed a proper
security testing tool set to maintain its top customers.
Situation
The organization faced a shift in its approach to software development and security testing in response to the inherent risks
of manufacturing internet and cloud-based devices that are connected. While its original business was in providing
equipment that did not connect to the internet, this was no longer the case, as entertainment systems are increasingly
streamed through the internet. That point became exceeding clear when there was an unexpected reboot of 1.5 million
“One and a half million of our
routers rebooted — initially
they thought it was an attack.
None of this was scheduled,
and it looked strange when the
routers went down. One and a
half million households lost
connectivity for 5 minutes. It
turns out that a tech upgraded
the routers, but what came out
was a realization of how easy
it was for someone outside of
the customer network to cause
a disruption.”
~ Senior manager of DevOps and release
engineering
9
routers in households. While this was not an actual security attack, it caused the organization to have to dispatch all of its
senior-level engineers and account representatives who worked on the product and customer account to try to determine
what caused the event. They determined it was an off-schedule update to the software, but the scare caused such an
enormous impact to the customer relationship, with long ripple effects. Both sides determined it was critical to implement a
fuzz testing tool, immediately. In its search for a solution:
› The organization sought to test products prerelease, even when the individual code components may have already been
written and completed.
› The organization sought to find the full range of possible defects and vulnerabilities that could be detected. It wanted to do
this using the latest techniques and the expertise of security testing without having to hire in-house resources, who are
rare and costly to find.
› The organization wanted to find and fix more defects and security vulnerabilities early in the software development
process, rather than later when the defects/vulnerabilities would be more expensive to remediate.
› The organization sought to meet the contract requirements and criteria for winning business with large telecommunications
service providers. The requirement for using a security toolkit for testing was baked into the requirements. The
telecommunications service providers also used tools such as Coverity and Defensics and sought to purchase products
from suppliers that had the same quality standard for software testing.
Solution
The organization began using Coverity about 10 years ago as part of its software development life cycle. It implemented
Defensics two years ago after an unexpected router reboot interrupted service on 1.5 million consumer routers. Below
describes the rollout of the two testing tools within the organization:
› The organization had a long history of using Coverity for static
analysis. Starting with one team in 2006 and spreading to
multiple teams, the use of Coverity grew with the expansion of
code bases used by the company. The organization now has
eight code bases and about 1.5 million lines of code per code
base.
› The organization began using Defensics about two years ago
and selected it because several of its key clients were already
using it. Also, Defensics was one of the first fuzz testing products
available on the market that could test for defects/vulnerabilities
in code that had already been written.
› The use of Defensics spread across the organization as different
product teams learned of its availability and began using
licenses. These teams typically did not conduct an RFP for a
testing tool but rather sought internal referrals from other testing
teams, and they found that Defensics was well-regarded among
their peer groups.
Results
The interview revealed that Coverity and Defensics allowed the organization to:
› Detect errors in the code earlier in the development process with a low false positive rate. The most significant
benefit experienced was in the ability of the organization to detect errors in code earlier in the software development life
“If your largest customer says
that a testing tool is a
requirement and they want
you to have this tool and then
we say we can’t comply, there
is a really big risk that another
big vendor can come in and
say ‘we have the tool’ and can
win the bid.”
~ Staff engineer system tester
10
cycle and before the defects/vulnerabilities were more costly to remediate. With an expansive number of lines of code (1.5
million) and code bases (eight and growing), this ability to detect defects/vulnerabilities more accurately and quickly
enabled the developers to save a lot of costly labor hours later in the software development life cycle.
› Improve the quality of the code base, especially for code reuse. The organization found that using both Coverity and
Defensics improved the quality of the code written by its developers. Because code reuse is common — many of its
products share the same code base — allowing, for example, 30 defects/vulnerabilities to go undetected can snowball into
about 300-plus bugs when the defective code is reused. With Coverity and Defensics, the testing tools not only aided in
pinpointing errors for remediation but also enabled the company to improve the overall quality of its code base, as a result
of the tools’ workflow and integration with other developer tools used at the organization.
› Decrease the risk (and associated costs) of “failure in the field.” The organization felt significant pressure to prevent
security risks in its embedded software from reaching consumers, so much so that the organization (a public company)
identified this risk in its 10K, as the organization had been burned on occasion when the unexpected happened. Not only
would failure post-production be costly — requiring immediate and intensive dedication of the highest-paid technical and
sales resources — but it would also be a big risk to the end consumers who use the internet-connected devices they
produce. The risks included the following:
• Experiencing a hardware failure that would require a full replacement of millions of devices, which would be a
significant financial loss for the company.
• Exposing the sensitive data of consumers and end users of their communications products to potential malicious
threats. This could result in the loss or misuse of personal or financial information and damages.
• Causing brand reputation damage to its biggest customers (household-name communications companies) if and
when a high-profile security incident
occurs. This, in turn, would cause the
organization to lose very large contracts
that fuel 35% of its annual revenue.
› Improve time-to-market for new products.
Because both Coverity and Defensics detect
software defects/vulnerabilities prior to release
into production, they reduce the costs of finding
and fixing these defects/vulnerabilities.
However, they also speed the release of the
products that the organization puts to market.
› Use engineers with little security expertise
to perform testing. The organization found that
Defensics makes it easy for nonsecurity experts
(e.g., quality assurance engineers) to learn the
baseline skills to run network testing tools that
identify defects and security vulnerabilities. This
avoids having to wait for skilled security
resources to become available to perform
testing or to have to hire outside resources with
specialized skillsets.
“The time savings come from how the tool
works. It’s automated — you click ‘Run’
and it runs millions of test cases. It could
take days, weeks, or months, but it can go
without intervention. Imagine having to
do those tests one by one, by hand. That’s
the type of time savings that we see. We
are now less involved in testing. You click
it, let it run, and have it run in the
background while you move on to
something else.”
~ Staff engineer system tester
11
BENEFITS
The interviewed organization used both Coverity and Defensics for testing and experienced several quantified benefits:
› Defects and security vulnerabilities remediation expenses avoided due to static analysis — existing code base.
› Defects and security vulnerabilities remediation expenses avoided due to static analysis — new code bases and
maintenance.
› Defects and security vulnerabilities remediation expenses avoided due to fuzz testing.
› Faster time-to-market for new products.
› Business disruption avoidance due to improved security testing.
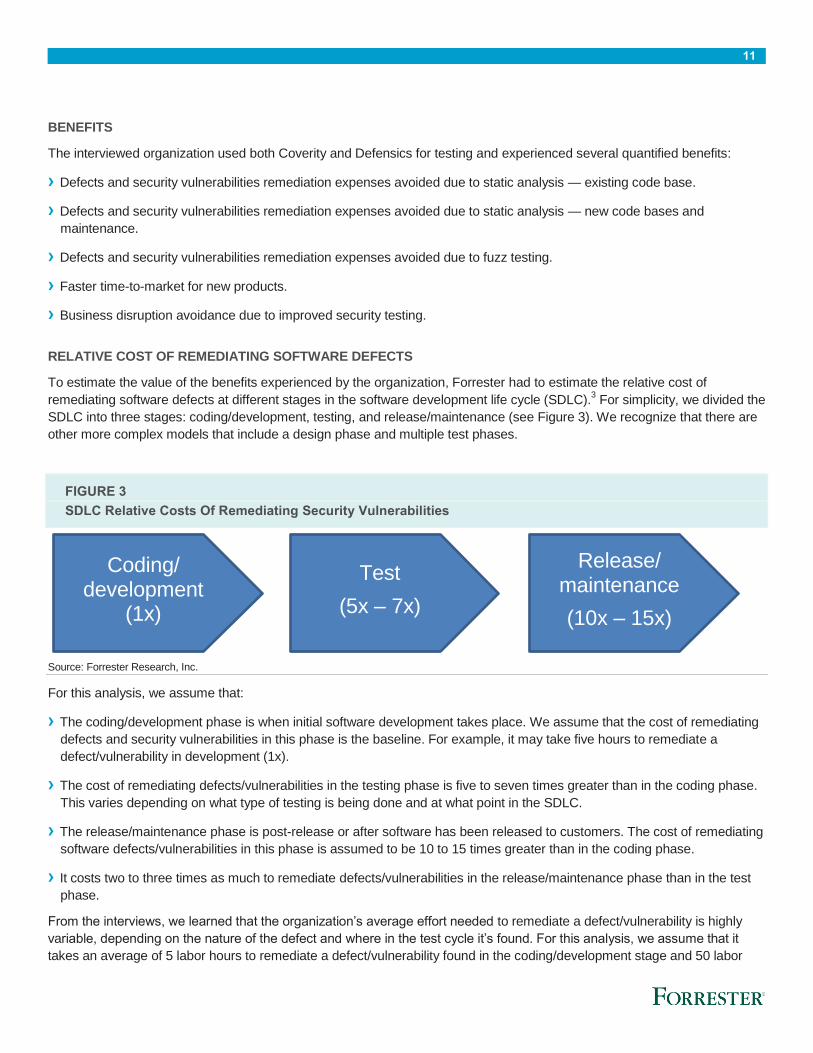
RELATIVE COST OF REMEDIATING SOFTWARE DEFECTS
To estimate the value of the benefits experienced by the organization, Forrester had to estimate the relative cost of
remediating software defects at different stages in the software development life cycle (SDLC).3 For simplicity, we divided the
SDLC into three stages: coding/development, testing, and release/maintenance (see Figure 3). We recognize that there are
other more complex models that include a design phase and multiple test phases.
FIGURE 3
SDLC Relative Costs Of Remediating Security Vulnerabilities
Source: Forrester Research, Inc.
For this analysis, we assume that:
› The coding/development phase is when initial software development takes place. We assume that the cost of remediating
defects and security vulnerabilities in this phase is the baseline. For example, it may take five hours to remediate a
defect/vulnerability in development (1x).
› The cost of remediating defects/vulnerabilities in the testing phase is five to seven times greater than in the coding phase.
This varies depending on what type of testing is being done and at what point in the SDLC.
› The release/maintenance phase is post-release or after software has been released to customers. The cost of remediating
software defects/vulnerabilities in this phase is assumed to be 10 to 15 times greater than in the coding phase.
› It costs two to three times as much to remediate defects/vulnerabilities in the release/maintenance phase than in the test
phase.
From the interviews, we learned that the organization’s average effort needed to remediate a defect/vulnerability is highly
variable, depending on the nature of the defect and where in the test cycle it’s found. For this analysis, we assume that it
takes an average of 5 labor hours to remediate a defect/vulnerability found in the coding/development stage and 50 labor
Coding/ development
(1x)
Test
(5x – 7x)
Release/ maintenance
(10x – 15x)
12
hours to remediate a defect/vulnerability found in the release/maintenance stage. The labor hours come from developers,
testers, and the cost to compile/build the software. If the defect/vulnerability were found after the software was released to
customers, the remediation expense would include additional labor from field engineers, account teams, and technical
support engineers.
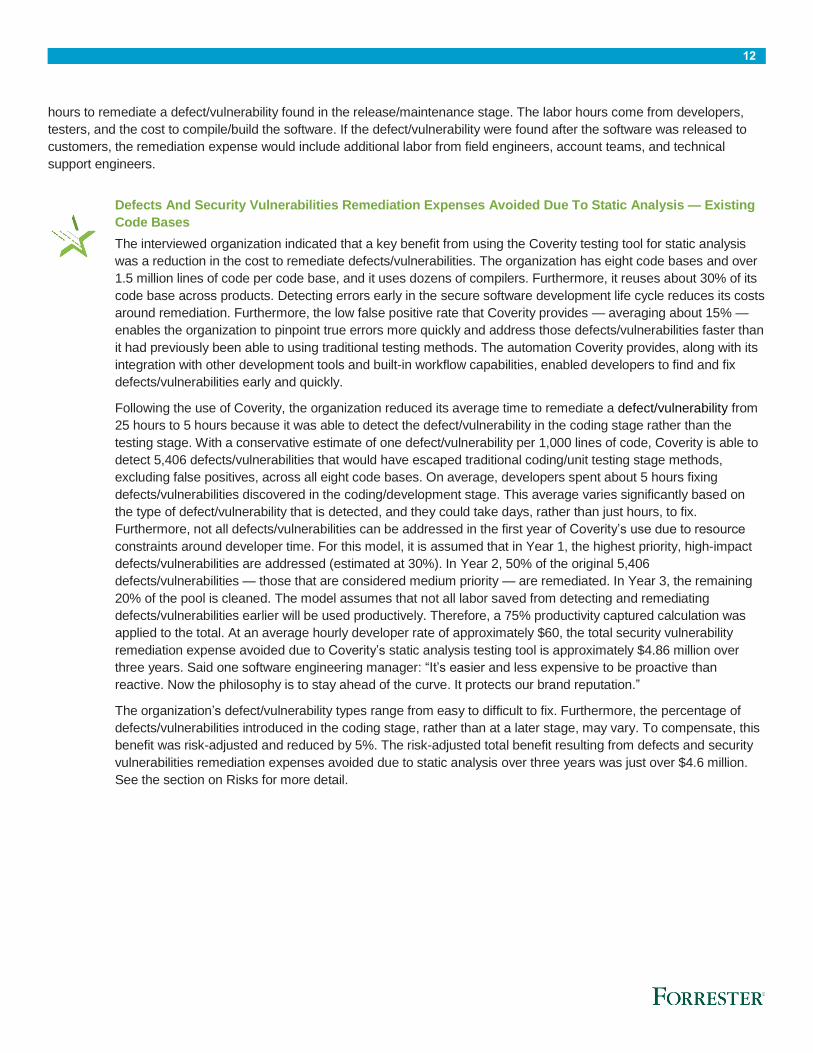
Defects And Security Vulnerabilities Remediation Expenses Avoided Due To Static Analysis — Existing
Code Bases
The interviewed organization indicated that a key benefit from using the Coverity testing tool for static analysis
was a reduction in the cost to remediate defects/vulnerabilities. The organization has eight code bases and over
1.5 million lines of code per code base, and it uses dozens of compilers. Furthermore, it reuses about 30% of its
code base across products. Detecting errors early in the secure software development life cycle reduces its costs
around remediation. Furthermore, the low false positive rate that Coverity provides — averaging about 15% —
enables the organization to pinpoint true errors more quickly and address those defects/vulnerabilities faster than
it had previously been able to using traditional testing methods. The automation Coverity provides, along with its
integration with other development tools and built-in workflow capabilities, enabled developers to find and fix
defects/vulnerabilities early and quickly.
Following the use of Coverity, the organization reduced its average time to remediate a defect/vulnerability from
25 hours to 5 hours because it was able to detect the defect/vulnerability in the coding stage rather than the
testing stage. With a conservative estimate of one defect/vulnerability per 1,000 lines of code, Coverity is able to
detect 5,406 defects/vulnerabilities that would have escaped traditional coding/unit testing stage methods,
excluding false positives, across all eight code bases. On average, developers spent about 5 hours fixing
defects/vulnerabilities discovered in the coding/development stage. This average varies significantly based on
the type of defect/vulnerability that is detected, and they could take days, rather than just hours, to fix.
Furthermore, not all defects/vulnerabilities can be addressed in the first year of Coverity’s use due to resource
constraints around developer time. For this model, it is assumed that in Year 1, the highest priority, high-impact
defects/vulnerabilities are addressed (estimated at 30%). In Year 2, 50% of the original 5,406
defects/vulnerabilities — those that are considered medium priority — are remediated. In Year 3, the remaining
20% of the pool is cleaned. The model assumes that not all labor saved from detecting and remediating
defects/vulnerabilities earlier will be used productively. Therefore, a 75% productivity captured calculation was
applied to the total. At an average hourly developer rate of approximately $60, the total security vulnerability
remediation expense avoided due to Coverity’s static analysis testing tool is approximately $4.86 million over
three years. Said one software engineering manager: “It’s easier and less expensive to be proactive than
reactive. Now the philosophy is to stay ahead of the curve. It protects our brand reputation.”
The organization’s defect/vulnerability types range from easy to difficult to fix. Furthermore, the percentage of
defects/vulnerabilities introduced in the coding stage, rather than at a later stage, may vary. To compensate, this
benefit was risk-adjusted and reduced by 5%. The risk-adjusted total benefit resulting from defects and security
vulnerabilities remediation expenses avoided due to static analysis over three years was just over $4.6 million.
See the section on Risks for more detail.
13
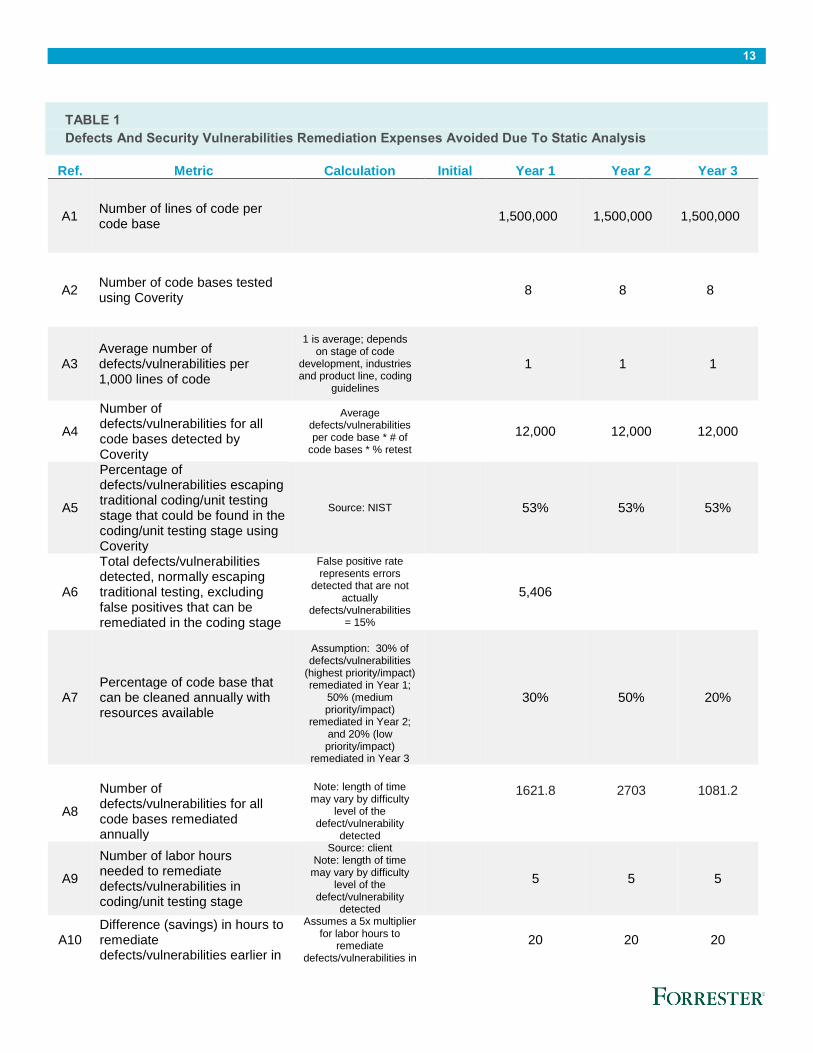
TABLE 1
Defects And Security Vulnerabilities Remediation Expenses Avoided Due To Static Analysis
Ref. Metric Calculation Initial Year 1 Year 2 Year 3
A1 Number of lines of code per code base
1,500,000 1,500,000 1,500,000
A2 Number of code bases tested using Coverity
8 8 8
A3 Average number of defects/vulnerabilities per 1,000 lines of code
1 is average; depends on stage of code
development, industries and product line, coding
guidelines
1 1 1
A4
Number of defects/vulnerabilities for all code bases detected by Coverity
Average defects/vulnerabilities per code base * # of
code bases * % retest
12,000 12,000 12,000
A5
Percentage of defects/vulnerabilities escaping traditional coding/unit testing stage that could be found in the coding/unit testing stage using Coverity
Source: NIST 53% 53% 53%
A6
Total defects/vulnerabilities detected, normally escaping traditional testing, excluding false positives that can be remediated in the coding stage
False positive rate represents errors
detected that are not actually
defects/vulnerabilities = 15%
5,406
A7 Percentage of code base that can be cleaned annually with resources available
Assumption: 30% of defects/vulnerabilities
(highest priority/impact) remediated in Year 1;
50% (medium priority/impact)
remediated in Year 2; and 20% (low priority/impact)
remediated in Year 3
30% 50% 20%
A8
Number of defects/vulnerabilities for all code bases remediated annually
Note: length of time may vary by difficulty
level of the defect/vulnerability
detected
1621.8 2703 1081.2
A9
Number of labor hours needed to remediate defects/vulnerabilities in coding/unit testing stage
Source: client Note: length of time
may vary by difficulty level of the
defect/vulnerability detected
5 5 5
A10 Difference (savings) in hours to remediate defects/vulnerabilities earlier in
Assumes a 5x multiplier for labor hours to
remediate defects/vulnerabilities in
20 20 20
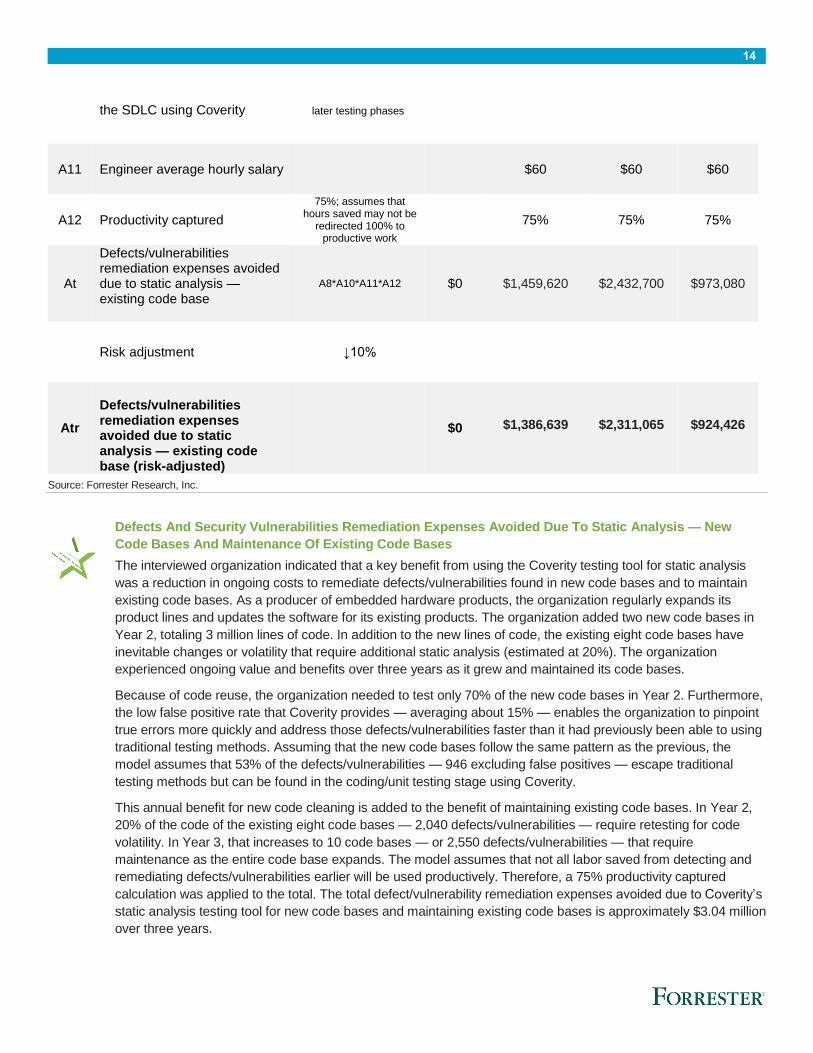
14
the SDLC using Coverity later testing phases
A11 Engineer average hourly salary
$60 $60 $60
A12 Productivity captured
75%; assumes that hours saved may not be
redirected 100% to productive work
75% 75% 75%
At
Defects/vulnerabilities remediation expenses avoided due to static analysis — existing code base
A8*A10*A11*A12 $0 $1,459,620 $2,432,700 $973,080
Risk adjustment ↓10%
Atr
Defects/vulnerabilities remediation expenses avoided due to static analysis — existing code base (risk-adjusted)
$0 $1,386,639 $2,311,065 $924,426
Source: Forrester Research, Inc.
Defects And Security Vulnerabilities Remediation Expenses Avoided Due To Static Analysis — New
Code Bases And Maintenance Of Existing Code Bases
The interviewed organization indicated that a key benefit from using the Coverity testing tool for static analysis
was a reduction in ongoing costs to remediate defects/vulnerabilities found in new code bases and to maintain
existing code bases. As a producer of embedded hardware products, the organization regularly expands its
product lines and updates the software for its existing products. The organization added two new code bases in
Year 2, totaling 3 million lines of code. In addition to the new lines of code, the existing eight code bases have
inevitable changes or volatility that require additional static analysis (estimated at 20%). The organization
experienced ongoing value and benefits over three years as it grew and maintained its code bases.
Because of code reuse, the organization needed to test only 70% of the new code bases in Year 2. Furthermore,
the low false positive rate that Coverity provides — averaging about 15% — enables the organization to pinpoint
true errors more quickly and address those defects/vulnerabilities faster than it had previously been able to using
traditional testing methods. Assuming that the new code bases follow the same pattern as the previous, the
model assumes that 53% of the defects/vulnerabilities — 946 excluding false positives — escape traditional
testing methods but can be found in the coding/unit testing stage using Coverity.
This annual benefit for new code cleaning is added to the benefit of maintaining existing code bases. In Year 2,
20% of the code of the existing eight code bases — 2,040 defects/vulnerabilities — require retesting for code
volatility. In Year 3, that increases to 10 code bases — or 2,550 defects/vulnerabilities — that require
maintenance as the entire code base expands. The model assumes that not all labor saved from detecting and
remediating defects/vulnerabilities earlier will be used productively. Therefore, a 75% productivity captured
calculation was applied to the total. The total defect/vulnerability remediation expenses avoided due to Coverity’s
static analysis testing tool for new code bases and maintaining existing code bases is approximately $3.04 million
over three years.
15
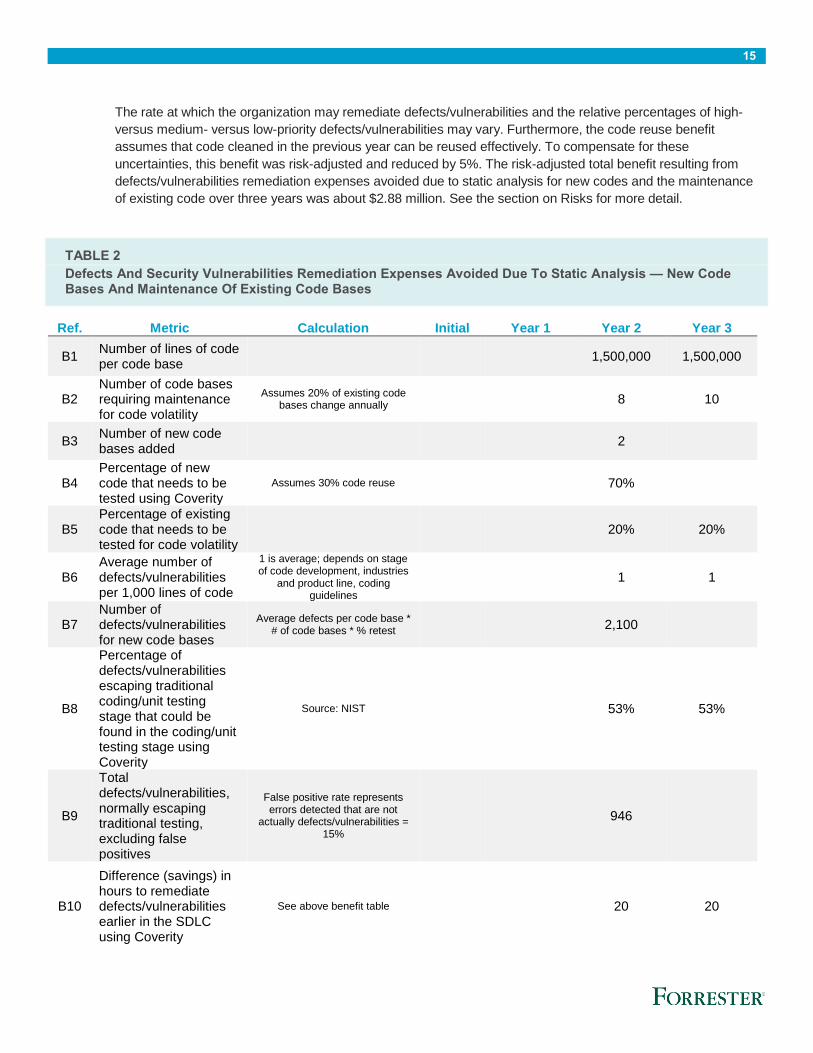
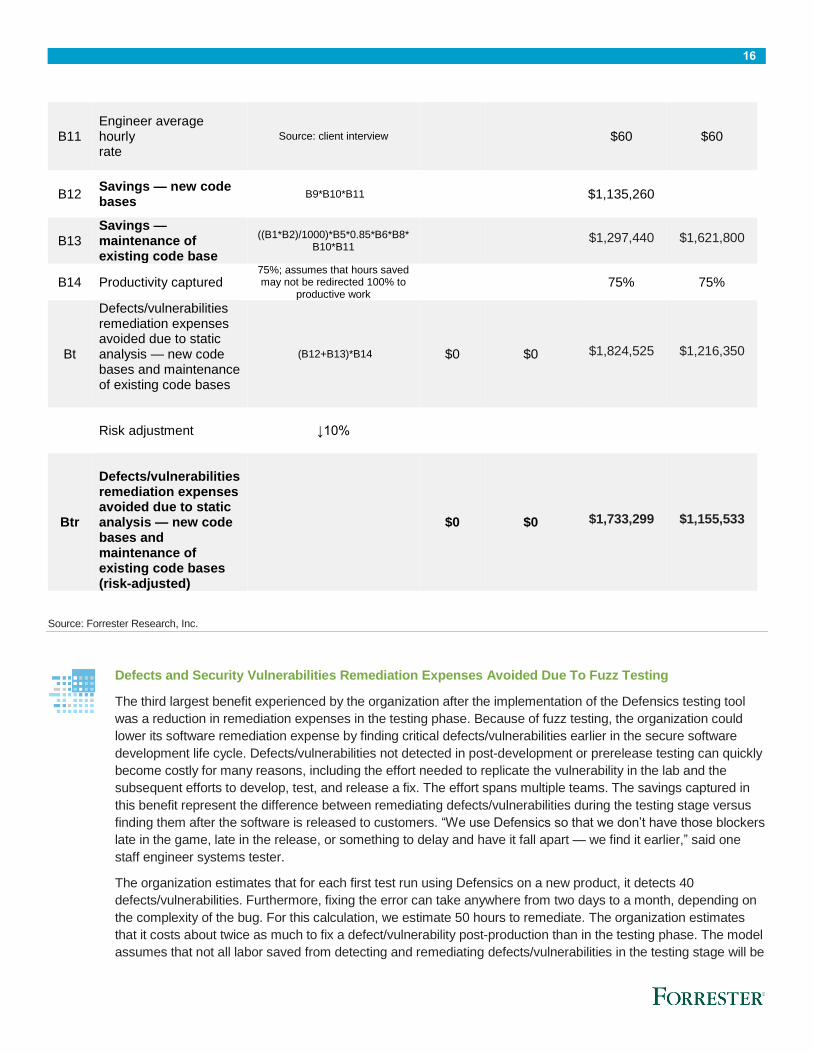
The rate at which the organization may remediate defects/vulnerabilities and the relative percentages of high-
versus medium- versus low-priority defects/vulnerabilities may vary. Furthermore, the code reuse benefit
assumes that code cleaned in the previous year can be reused effectively. To compensate for these
uncertainties, this benefit was risk-adjusted and reduced by 5%. The risk-adjusted total benefit resulting from
defects/vulnerabilities remediation expenses avoided due to static analysis for new codes and the maintenance
of existing code over three years was about $2.88 million. See the section on Risks for more detail.
TABLE 2
Defects And Security Vulnerabilities Remediation Expenses Avoided Due To Static Analysis — New Code Bases And Maintenance Of Existing Code Bases
Ref. Metric Calculation Initial Year 1 Year 2 Year 3
B1 Number of lines of code per code base
1,500,000 1,500,000
B2 Number of code bases requiring maintenance for code volatility
Assumes 20% of existing code bases change annually
8 10
B3 Number of new code bases added
2
B4 Percentage of new code that needs to be tested using Coverity
Assumes 30% code reuse
70%
B5 Percentage of existing code that needs to be tested for code volatility
20% 20%
B6 Average number of defects/vulnerabilities per 1,000 lines of code
1 is average; depends on stage of code development, industries
and product line, coding guidelines
1 1
B7 Number of defects/vulnerabilities for new code bases
Average defects per code base * # of code bases * % retest
2,100
B8
Percentage of defects/vulnerabilities escaping traditional coding/unit testing stage that could be found in the coding/unit testing stage using Coverity
Source: NIST
53% 53%
B9
Total defects/vulnerabilities, normally escaping traditional testing, excluding false positives
False positive rate represents errors detected that are not
actually defects/vulnerabilities = 15%
946
B10
Difference (savings) in hours to remediate defects/vulnerabilities earlier in the SDLC using Coverity
See above benefit table
20 20
16
B11 Engineer average hourly rate
Source: client interview
$60 $60
B12 Savings — new code bases
B9*B10*B11 $1,135,260
B13 Savings — maintenance of existing code base
((B1*B2)/1000)*B5*0.85*B6*B8* B10*B11
$1,297,440 $1,621,800
B14 Productivity captured 75%; assumes that hours saved may not be redirected 100% to
productive work 75% 75%
Bt
Defects/vulnerabilities remediation expenses avoided due to static analysis — new code bases and maintenance of existing code bases
(B12+B13)*B14 $0 $0 $1,824,525 $1,216,350
Risk adjustment ↓10%
Btr
Defects/vulnerabilities remediation expenses avoided due to static analysis — new code bases and maintenance of existing code bases (risk-adjusted)
$0 $0 $1,733,299 $1,155,533
Source: Forrester Research, Inc.
Defects and Security Vulnerabilities Remediation Expenses Avoided Due To Fuzz Testing
The third largest benefit experienced by the organization after the implementation of the Defensics testing tool
was a reduction in remediation expenses in the testing phase. Because of fuzz testing, the organization could
lower its software remediation expense by finding critical defects/vulnerabilities earlier in the secure software
development life cycle. Defects/vulnerabilities not detected in post-development or prerelease testing can quickly
become costly for many reasons, including the effort needed to replicate the vulnerability in the lab and the
subsequent efforts to develop, test, and release a fix. The effort spans multiple teams. The savings captured in
this benefit represent the difference between remediating defects/vulnerabilities during the testing stage versus
finding them after the software is released to customers. “We use Defensics so that we don’t have those blockers
late in the game, late in the release, or something to delay and have it fall apart — we find it earlier,” said one
staff engineer systems tester.
The organization estimates that for each first test run using Defensics on a new product, it detects 40
defects/vulnerabilities. Furthermore, fixing the error can take anywhere from two days to a month, depending on
the complexity of the bug. For this calculation, we estimate 50 hours to remediate. The organization estimates
that it costs about twice as much to fix a defect/vulnerability post-production than in the testing phase. The model
assumes that not all labor saved from detecting and remediating defects/vulnerabilities in the testing stage will be
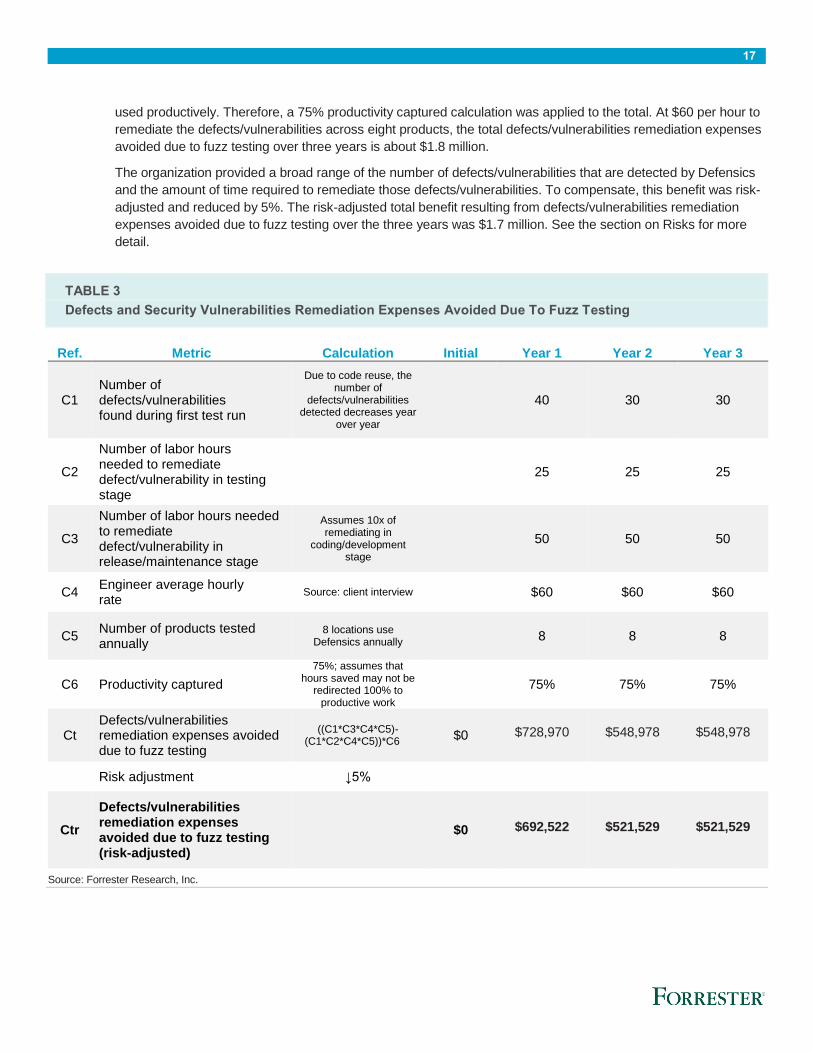
17
used productively. Therefore, a 75% productivity captured calculation was applied to the total. At $60 per hour to
remediate the defects/vulnerabilities across eight products, the total defects/vulnerabilities remediation expenses
avoided due to fuzz testing over three years is about $1.8 million.
The organization provided a broad range of the number of defects/vulnerabilities that are detected by Defensics
and the amount of time required to remediate those defects/vulnerabilities. To compensate, this benefit was risk-
adjusted and reduced by 5%. The risk-adjusted total benefit resulting from defects/vulnerabilities remediation
expenses avoided due to fuzz testing over the three years was $1.7 million. See the section on Risks for more
detail.
TABLE 3
Defects and Security Vulnerabilities Remediation Expenses Avoided Due To Fuzz Testing
Ref. Metric Calculation Initial Year 1 Year 2 Year 3
C1 Number of defects/vulnerabilities found during first test run
Due to code reuse, the number of
defects/vulnerabilities detected decreases year
over year
40 30 30
C2
Number of labor hours needed to remediate defect/vulnerability in testing stage
25 25 25
C3
Number of labor hours needed to remediate defect/vulnerability in release/maintenance stage
Assumes 10x of remediating in
coding/development stage
50 50 50
C4 Engineer average hourly rate
Source: client interview
$60 $60 $60
C5 Number of products tested annually
8 locations use Defensics annually
8 8 8
C6 Productivity captured
75%; assumes that hours saved may not be
redirected 100% to productive work
75% 75% 75%
Ct Defects/vulnerabilities remediation expenses avoided due to fuzz testing
((C1*C3*C4*C5)-(C1*C2*C4*C5))*C6
$0 $728,970 $548,978 $548,978
Risk adjustment ↓5%
Ctr
Defects/vulnerabilities remediation expenses avoided due to fuzz testing (risk-adjusted)
$0 $692,522 $521,529 $521,529
Source: Forrester Research, Inc.
18
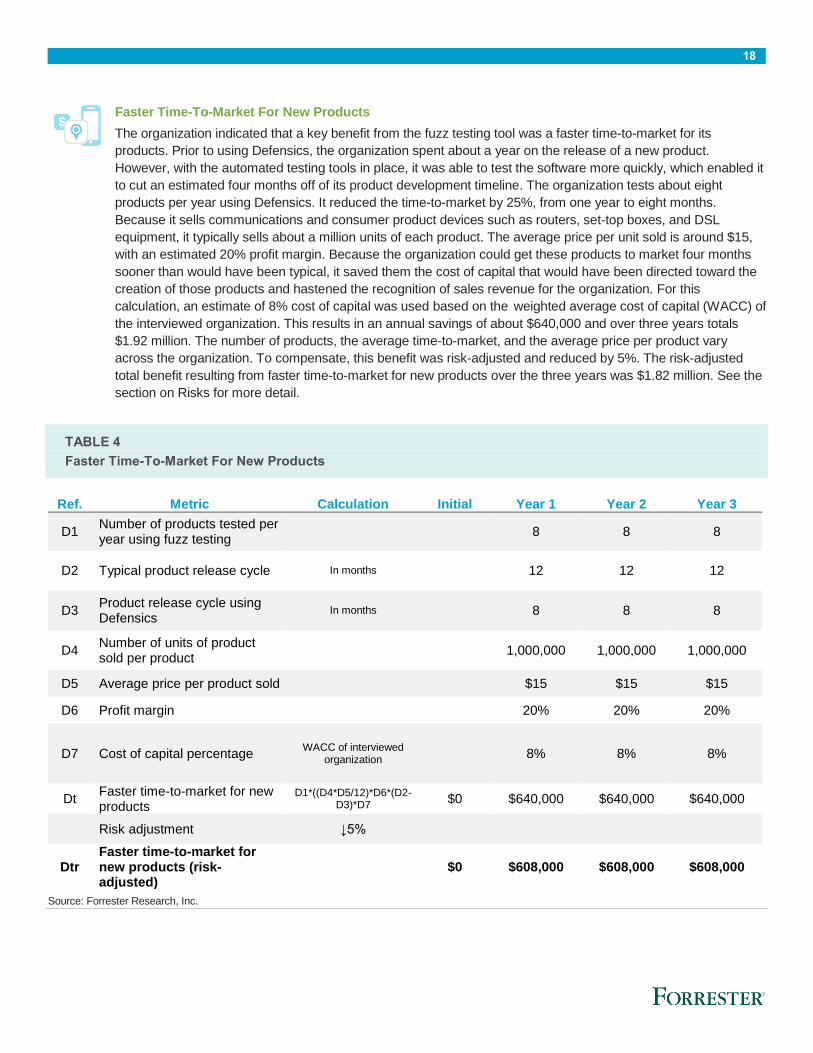
Faster Time-To-Market For New Products
The organization indicated that a key benefit from the fuzz testing tool was a faster time-to-market for its
products. Prior to using Defensics, the organization spent about a year on the release of a new product.
However, with the automated testing tools in place, it was able to test the software more quickly, which enabled it
to cut an estimated four months off of its product development timeline. The organization tests about eight
products per year using Defensics. It reduced the time-to-market by 25%, from one year to eight months.
Because it sells communications and consumer product devices such as routers, set-top boxes, and DSL
equipment, it typically sells about a million units of each product. The average price per unit sold is around $15,
with an estimated 20% profit margin. Because the organization could get these products to market four months
sooner than would have been typical, it saved them the cost of capital that would have been directed toward the
creation of those products and hastened the recognition of sales revenue for the organization. For this
calculation, an estimate of 8% cost of capital was used based on the weighted average cost of capital (WACC) of
the interviewed organization. This results in an annual savings of about $640,000 and over three years totals
$1.92 million. The number of products, the average time-to-market, and the average price per product vary
across the organization. To compensate, this benefit was risk-adjusted and reduced by 5%. The risk-adjusted
total benefit resulting from faster time-to-market for new products over the three years was $1.82 million. See the
section on Risks for more detail.
TABLE 4
Faster Time-To-Market For New Products
Ref. Metric Calculation Initial Year 1 Year 2 Year 3
D1 Number of products tested per year using fuzz testing
8 8 8
D2 Typical product release cycle In months
12 12 12
D3 Product release cycle using Defensics
In months 8 8 8
D4 Number of units of product sold per product
1,000,000 1,000,000 1,000,000
D5 Average price per product sold $15 $15 $15
D6 Profit margin
20% 20% 20%
D7 Cost of capital percentage WACC of interviewed
organization 8% 8% 8%
Dt Faster time-to-market for new products
D1*((D4*D5/12)*D6*(D2-D3)*D7
$0 $640,000 $640,000 $640,000
Risk adjustment ↓5%
Dtr Faster time-to-market for new products (risk-adjusted)
$0 $608,000 $608,000 $608,000
Source: Forrester Research, Inc.
19
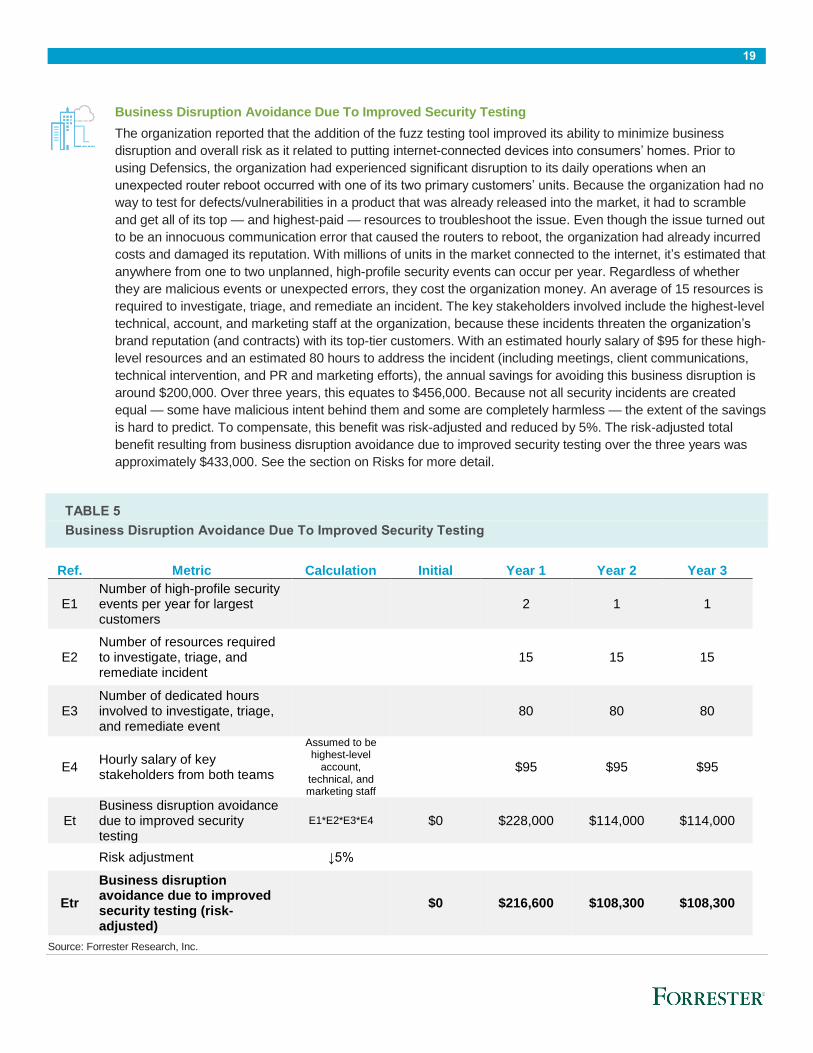
Business Disruption Avoidance Due To Improved Security Testing
The organization reported that the addition of the fuzz testing tool improved its ability to minimize business
disruption and overall risk as it related to putting internet-connected devices into consumers’ homes. Prior to
using Defensics, the organization had experienced significant disruption to its daily operations when an
unexpected router reboot occurred with one of its two primary customers’ units. Because the organization had no
way to test for defects/vulnerabilities in a product that was already released into the market, it had to scramble
and get all of its top — and highest-paid — resources to troubleshoot the issue. Even though the issue turned out
to be an innocuous communication error that caused the routers to reboot, the organization had already incurred
costs and damaged its reputation. With millions of units in the market connected to the internet, it’s estimated that
anywhere from one to two unplanned, high-profile security events can occur per year. Regardless of whether
they are malicious events or unexpected errors, they cost the organization money. An average of 15 resources is
required to investigate, triage, and remediate an incident. The key stakeholders involved include the highest-level
technical, account, and marketing staff at the organization, because these incidents threaten the organization’s
brand reputation (and contracts) with its top-tier customers. With an estimated hourly salary of $95 for these high-
level resources and an estimated 80 hours to address the incident (including meetings, client communications,
technical intervention, and PR and marketing efforts), the annual savings for avoiding this business disruption is
around $200,000. Over three years, this equates to $456,000. Because not all security incidents are created
equal — some have malicious intent behind them and some are completely harmless — the extent of the savings
is hard to predict. To compensate, this benefit was risk-adjusted and reduced by 5%. The risk-adjusted total
benefit resulting from business disruption avoidance due to improved security testing over the three years was
approximately $433,000. See the section on Risks for more detail.
TABLE 5
Business Disruption Avoidance Due To Improved Security Testing
Ref. Metric Calculation Initial Year 1 Year 2 Year 3
E1 Number of high-profile security events per year for largest customers
2 1 1
E2 Number of resources required to investigate, triage, and remediate incident
15 15 15
E3 Number of dedicated hours involved to investigate, triage, and remediate event
80 80 80
E4 Hourly salary of key stakeholders from both teams
Assumed to be highest-level
account, technical, and marketing staff
$95 $95 $95
Et Business disruption avoidance due to improved security testing
E1*E2*E3*E4 $0 $228,000 $114,000 $114,000
Risk adjustment ↓5%
Etr
Business disruption avoidance due to improved security testing (risk-adjusted)
$0 $216,600 $108,300 $108,300
Source: Forrester Research, Inc.
20
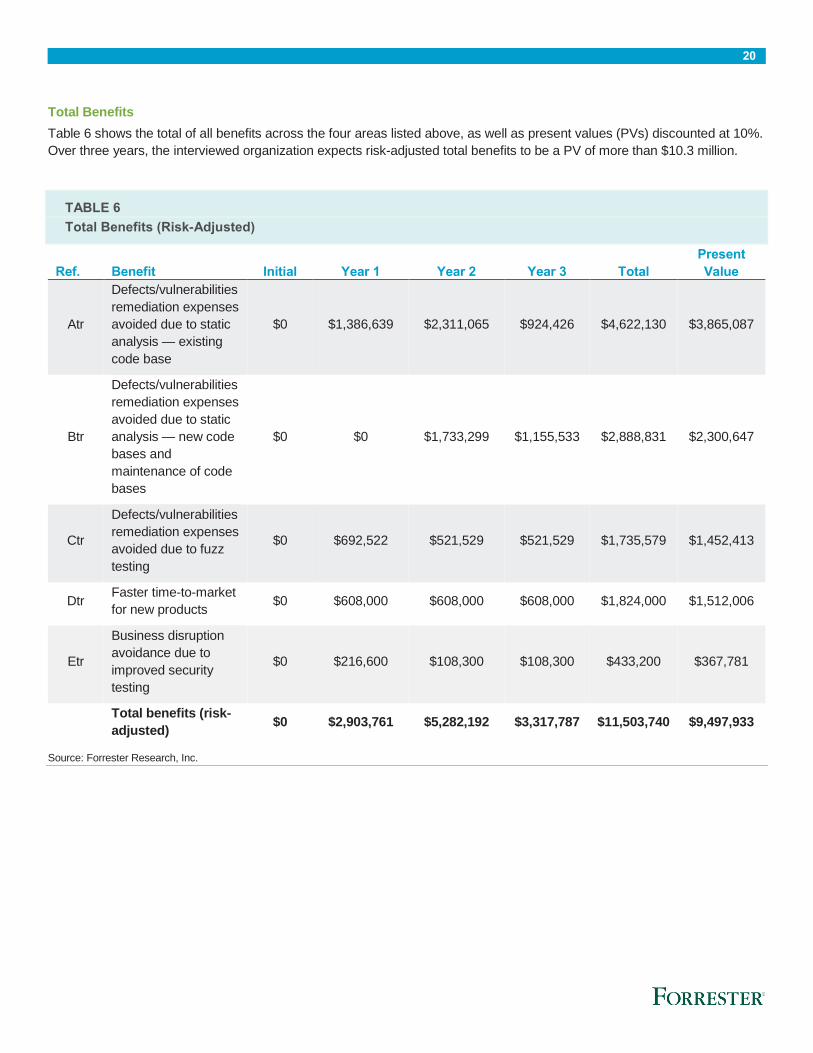
Total Benefits
Table 6 shows the total of all benefits across the four areas listed above, as well as present values (PVs) discounted at 10%.
Over three years, the interviewed organization expects risk-adjusted total benefits to be a PV of more than $10.3 million.
TABLE 6
Total Benefits (Risk-Adjusted)
Ref. Benefit Initial Year 1 Year 2 Year 3 Total
Present
Value
Atr
Defects/vulnerabilities
remediation expenses
avoided due to static
analysis — existing
code base
$0 $1,386,639 $2,311,065 $924,426 $4,622,130 $3,865,087
Btr
Defects/vulnerabilities
remediation expenses
avoided due to static
analysis — new code
bases and
maintenance of code
bases
$0 $0 $1,733,299 $1,155,533 $2,888,831 $2,300,647
Ctr
Defects/vulnerabilities
remediation expenses
avoided due to fuzz
testing
$0 $692,522 $521,529 $521,529 $1,735,579 $1,452,413
Dtr Faster time-to-market
for new products $0 $608,000 $608,000 $608,000 $1,824,000 $1,512,006
Etr
Business disruption
avoidance due to
improved security
testing
$0 $216,600 $108,300 $108,300 $433,200 $367,781
Total benefits (risk-
adjusted) $0 $2,903,761 $5,282,192 $3,317,787 $11,503,740 $9,497,933
Source: Forrester Research, Inc.
21
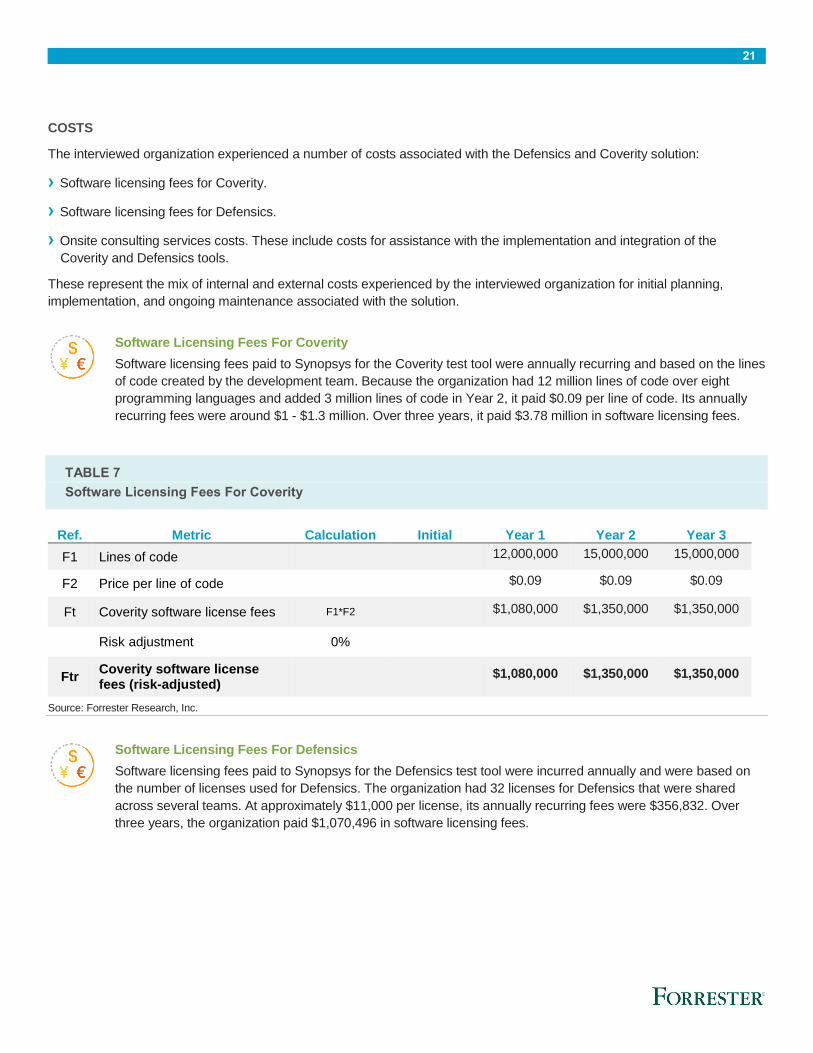
COSTS
The interviewed organization experienced a number of costs associated with the Defensics and Coverity solution:
› Software licensing fees for Coverity.
› Software licensing fees for Defensics.
› Onsite consulting services costs. These include costs for assistance with the implementation and integration of the
Coverity and Defensics tools.
These represent the mix of internal and external costs experienced by the interviewed organization for initial planning,
implementation, and ongoing maintenance associated with the solution.
Software Licensing Fees For Coverity
Software licensing fees paid to Synopsys for the Coverity test tool were annually recurring and based on the lines
of code created by the development team. Because the organization had 12 million lines of code over eight
programming languages and added 3 million lines of code in Year 2, it paid $0.09 per line of code. Its annually
recurring fees were around $1 - $1.3 million. Over three years, it paid $3.78 million in software licensing fees.
TABLE 7
Software Licensing Fees For Coverity
Ref. Metric Calculation Initial Year 1 Year 2 Year 3
F1 Lines of code 12,000,000 15,000,000 15,000,000
F2 Price per line of code
$0.09 $0.09 $0.09
Ft Coverity software license fees F1*F2 $1,080,000 $1,350,000 $1,350,000
Risk adjustment 0%
Ftr Coverity software license fees (risk-adjusted)
$1,080,000 $1,350,000 $1,350,000
Source: Forrester Research, Inc.
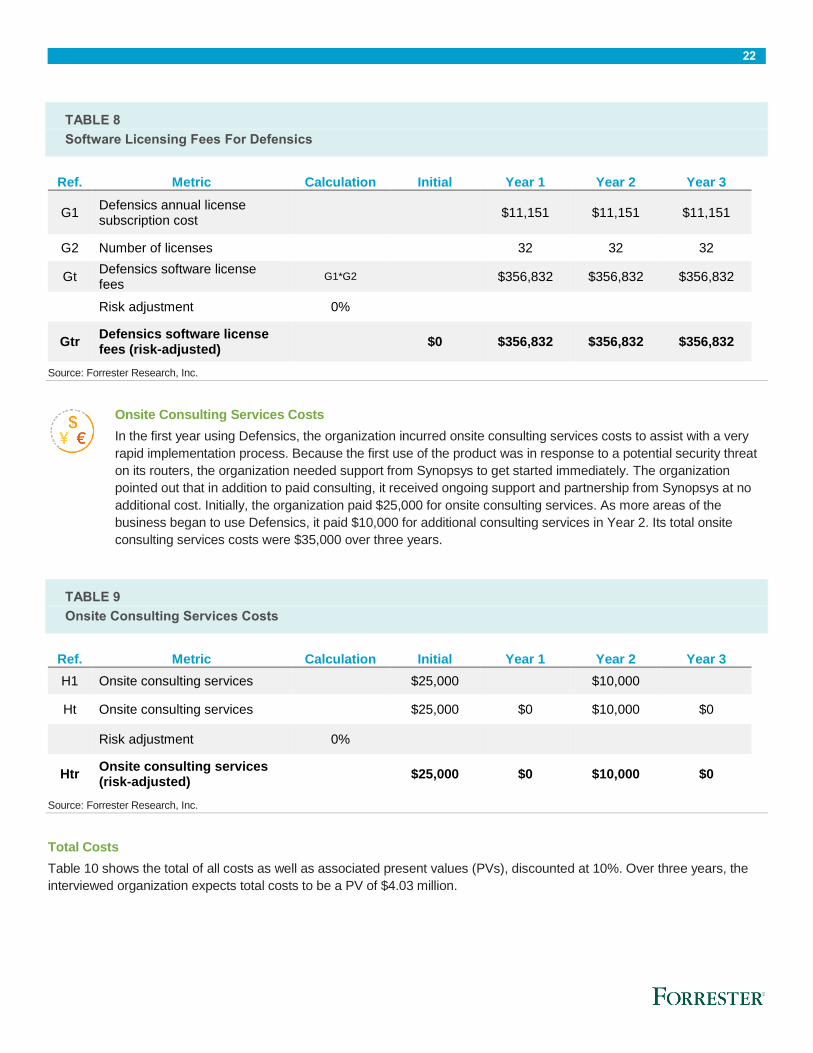
Software Licensing Fees For Defensics
Software licensing fees paid to Synopsys for the Defensics test tool were incurred annually and were based on
the number of licenses used for Defensics. The organization had 32 licenses for Defensics that were shared
across several teams. At approximately $11,000 per license, its annually recurring fees were $356,832. Over
three years, the organization paid $1,070,496 in software licensing fees.
22
TABLE 8
Software Licensing Fees For Defensics
Ref. Metric Calculation Initial Year 1 Year 2 Year 3
G1 Defensics annual license subscription cost
$11,151 $11,151 $11,151
G2 Number of licenses
32 32 32
Gt Defensics software license fees
G1*G2 $356,832 $356,832 $356,832
Risk adjustment 0%
Gtr Defensics software license fees (risk-adjusted)
$0 $356,832 $356,832 $356,832
Source: Forrester Research, Inc.
Onsite Consulting Services Costs
In the first year using Defensics, the organization incurred onsite consulting services costs to assist with a very
rapid implementation process. Because the first use of the product was in response to a potential security threat
on its routers, the organization needed support from Synopsys to get started immediately. The organization
pointed out that in addition to paid consulting, it received ongoing support and partnership from Synopsys at no
additional cost. Initially, the organization paid $25,000 for onsite consulting services. As more areas of the
business began to use Defensics, it paid $10,000 for additional consulting services in Year 2. Its total onsite
consulting services costs were $35,000 over three years.
TABLE 9
Onsite Consulting Services Costs
Ref. Metric Calculation Initial Year 1 Year 2 Year 3
H1 Onsite consulting services $25,000 $10,000
Ht Onsite consulting services
$25,000 $0 $10,000 $0
Risk adjustment 0%
Htr Onsite consulting services (risk-adjusted)
$25,000 $0 $10,000 $0
Source: Forrester Research, Inc.
Total Costs
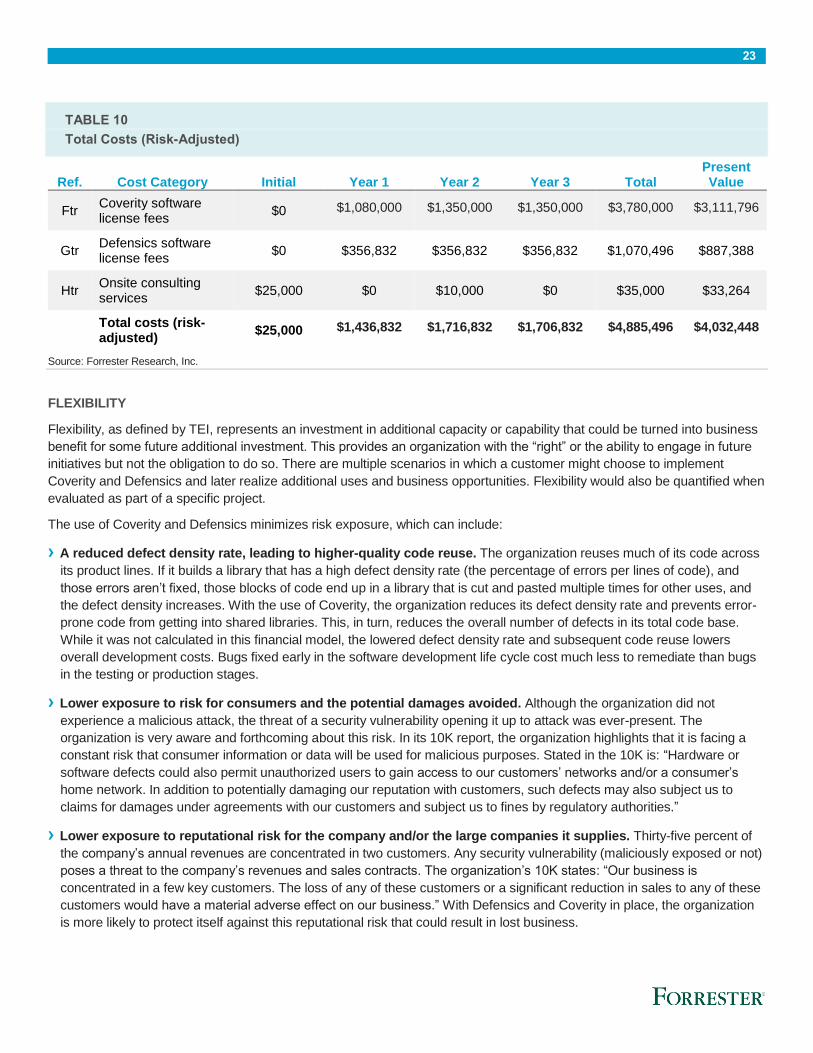
Table 10 shows the total of all costs as well as associated present values (PVs), discounted at 10%. Over three years, the
interviewed organization expects total costs to be a PV of $4.03 million.
23
TABLE 10
Total Costs (Risk-Adjusted)
Ref. Cost Category Initial Year 1 Year 2 Year 3 Total Present Value
Ftr Coverity software license fees
$0 $1,080,000 $1,350,000 $1,350,000 $3,780,000 $3,111,796
Gtr Defensics software license fees
$0 $356,832 $356,832 $356,832 $1,070,496 $887,388
Htr Onsite consulting services
$25,000 $0 $10,000 $0 $35,000 $33,264
Total costs (risk-adjusted)
$25,000 $1,436,832 $1,716,832 $1,706,832 $4,885,496 $4,032,448
Source: Forrester Research, Inc.
FLEXIBILITY
Flexibility, as defined by TEI, represents an investment in additional capacity or capability that could be turned into business
benefit for some future additional investment. This provides an organization with the “right” or the ability to engage in future
initiatives but not the obligation to do so. There are multiple scenarios in which a customer might choose to implement
Coverity and Defensics and later realize additional uses and business opportunities. Flexibility would also be quantified when
evaluated as part of a specific project.
The use of Coverity and Defensics minimizes risk exposure, which can include:
› A reduced defect density rate, leading to higher-quality code reuse. The organization reuses much of its code across
its product lines. If it builds a library that has a high defect density rate (the percentage of errors per lines of code), and
those errors aren’t fixed, those blocks of code end up in a library that is cut and pasted multiple times for other uses, and
the defect density increases. With the use of Coverity, the organization reduces its defect density rate and prevents error-
prone code from getting into shared libraries. This, in turn, reduces the overall number of defects in its total code base.
While it was not calculated in this financial model, the lowered defect density rate and subsequent code reuse lowers
overall development costs. Bugs fixed early in the software development life cycle cost much less to remediate than bugs
in the testing or production stages.
› Lower exposure to risk for consumers and the potential damages avoided. Although the organization did not
experience a malicious attack, the threat of a security vulnerability opening it up to attack was ever-present. The
organization is very aware and forthcoming about this risk. In its 10K report, the organization highlights that it is facing a
constant risk that consumer information or data will be used for malicious purposes. Stated in the 10K is: “Hardware or
software defects could also permit unauthorized users to gain access to our customers’ networks and/or a consumer’s
home network. In addition to potentially damaging our reputation with customers, such defects may also subject us to
claims for damages under agreements with our customers and subject us to fines by regulatory authorities.”
› Lower exposure to reputational risk for the company and/or the large companies it supplies. Thirty-five percent of
the company’s annual revenues are concentrated in two customers. Any security vulnerability (maliciously exposed or not)
poses a threat to the company’s revenues and sales contracts. The organization’s 10K states: “Our business is
concentrated in a few key customers. The loss of any of these customers or a significant reduction in sales to any of these
customers would have a material adverse effect on our business.” With Defensics and Coverity in place, the organization
is more likely to protect itself against this reputational risk that could result in lost business.
24
› Lower test script development and execution costs. Although not captured in this model due to the unique
circumstances of how the tool set was adopted by this organization, other parts of the company may benefit from lowered
test script development and execution costs. If areas of the business are writing test scripts and executing them manually
and then replace those tests with automated static analysis and fuzz testing tools, they will experience additional cost
savings. This organization develops dozens of products across many development teams. It is likely that other teams will
experience this benefit as the adoption and use of these two products continue to grow.
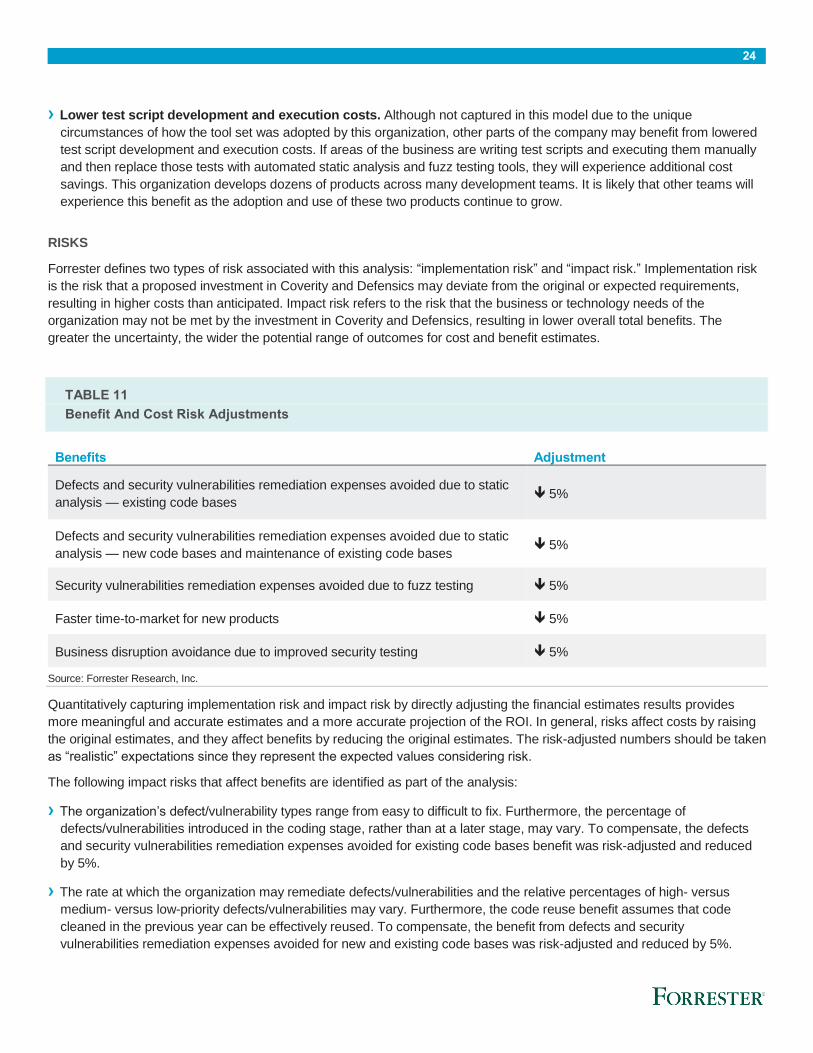
RISKS
Forrester defines two types of risk associated with this analysis: “implementation risk” and “impact risk.” Implementation risk
is the risk that a proposed investment in Coverity and Defensics may deviate from the original or expected requirements,
resulting in higher costs than anticipated. Impact risk refers to the risk that the business or technology needs of the
organization may not be met by the investment in Coverity and Defensics, resulting in lower overall total benefits. The
greater the uncertainty, the wider the potential range of outcomes for cost and benefit estimates.
TABLE 11
Benefit And Cost Risk Adjustments
Benefits Adjustment
Defects and security vulnerabilities remediation expenses avoided due to static
analysis — existing code bases 5%
Defects and security vulnerabilities remediation expenses avoided due to static
analysis — new code bases and maintenance of existing code bases 5%
Security vulnerabilities remediation expenses avoided due to fuzz testing 5%
Faster time-to-market for new products 5%
Business disruption avoidance due to improved security testing 5%
Source: Forrester Research, Inc.
Quantitatively capturing implementation risk and impact risk by directly adjusting the financial estimates results provides
more meaningful and accurate estimates and a more accurate projection of the ROI. In general, risks affect costs by raising
the original estimates, and they affect benefits by reducing the original estimates. The risk-adjusted numbers should be taken
as “realistic” expectations since they represent the expected values considering risk.
The following impact risks that affect benefits are identified as part of the analysis:
› The organization’s defect/vulnerability types range from easy to difficult to fix. Furthermore, the percentage of
defects/vulnerabilities introduced in the coding stage, rather than at a later stage, may vary. To compensate, the defects
and security vulnerabilities remediation expenses avoided for existing code bases benefit was risk-adjusted and reduced
by 5%.
› The rate at which the organization may remediate defects/vulnerabilities and the relative percentages of high- versus
medium- versus low-priority defects/vulnerabilities may vary. Furthermore, the code reuse benefit assumes that code
cleaned in the previous year can be effectively reused. To compensate, the benefit from defects and security
vulnerabilities remediation expenses avoided for new and existing code bases was risk-adjusted and reduced by 5%.
25
› The organization provided a broad range of the number of defects/vulnerabilities that are detected by Defensics and the
amount of time required to remediate those defects/vulnerabilities. To compensate, the defects/vulnerabilities remediation
expenses avoided due to fuzz testing benefit was risk-adjusted and reduced by 5%.
› The number of products, the average time-to-market, and the average price per product vary across the organization. To
compensate, the faster time-to-market for new products benefit was risk-adjusted and reduced by 5%.
› Because not all security incidents are created equal — some have malicious intent behind them and some are completely
harmless — the extent of the savings is hard to predict. To compensate, the business disruption avoidance due to
improved security testing benefit was risk-adjusted and reduced by 5%.
Table 11 shows the values used to adjust for risk and uncertainty in the cost and benefit estimates for the interviewed
organization. Readers are urged to apply their own risk ranges based on their own degree of confidence in the cost and
benefit estimates.
26
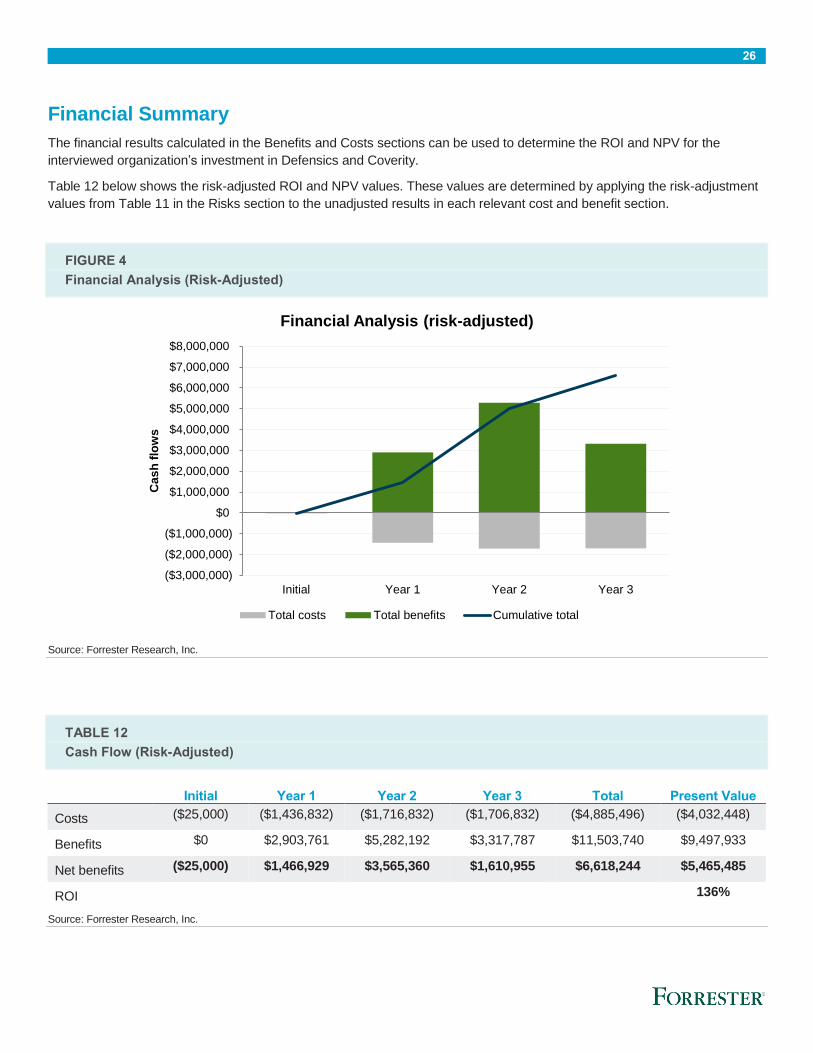
Financial Summary
The financial results calculated in the Benefits and Costs sections can be used to determine the ROI and NPV for the
interviewed organization’s investment in Defensics and Coverity.
Table 12 below shows the risk-adjusted ROI and NPV values. These values are determined by applying the risk-adjustment
values from Table 11 in the Risks section to the unadjusted results in each relevant cost and benefit section.
FIGURE 4
Financial Analysis (Risk-Adjusted)
Source: Forrester Research, Inc.
TABLE 12
Cash Flow (Risk-Adjusted)
Initial Year 1 Year 2 Year 3 Total Present Value
Costs ($25,000) ($1,436,832) ($1,716,832) ($1,706,832) ($4,885,496) ($4,032,448)
Benefits $0 $2,903,761 $5,282,192 $3,317,787 $11,503,740 $9,497,933
Net benefits ($25,000) $1,466,929 $3,565,360 $1,610,955 $6,618,244 $5,465,485
ROI
136%
Source: Forrester Research, Inc.
($3,000,000)
($2,000,000)
($1,000,000)
$0
$1,000,000
$2,000,000
$3,000,000
$4,000,000
$5,000,000
$6,000,000
$7,000,000
$8,000,000
Initial Year 1 Year 2 Year 3
Cas
h f
low
s
Financial Analysis (risk-adjusted)
Total costs Total benefits Cumulative total
27
Product Overview: Coverity
The following information is provided by Synopsys. Forrester has not validated any claims and does not endorse Synopsys
or its offerings.
Coverity® is an accurate and comprehensive static analysis and static application security testing (SAST) platform that finds
critical defects and security weaknesses in code as it’s written and before these defects become vulnerabilities, crashes, or
maintenance headaches.
PRODUCT OVERVIEW
Coverity helps reduce risk and lower the overall project cost by identifying critical quality defects and potential security
vulnerabilities during development. It uses accurate and actionable remediation guidance based on patented techniques, a
decade of research and development, and analysis of over 10 billion lines of proprietary and open source code.
KEY FEATURES
Depth And Accuracy Of Analysis
› Coverity integrates seamlessly with any build system and generates a high-fidelity representation of the source code to
ensure a deep understanding of its behavior.
› Coverity provides full path coverage, ensuring that every line of code and every potential execution path is tested. It utilizes
multiple patented techniques to ensure deep, accurate analysis.
› Through a deep understanding of the source code and the underlying frameworks, the Coverity platform provides highly
accurate analysis results so developers do not waste time managing a large volume of false positive results. This enables
them to effectively build security into the development life cycle.
Speed And Scale Of Analysis
Coverity was built from the ground up to fit into your existing workflow with the following capabilities:
› Parallel analysis allows Coverity to run on up to 16 cores simultaneously and delivers up to a ten-time performance
improvement over serial analysis.
› Incremental analysis enables analysis acceleration by only re-analyzing the code that has changed or been affected by a
change, instead of the entire code base each time.
› Coverity scales to accommodate thousands of developers in geographically distributed environments and can analyze
projects in excess of 100 million lines of code with ease.
Efficient Issue Management And Remediation
› With Coverity Connect, the platform’s collaborative issue management interface, developers gain access to actionable
information and precise remediation guidance, showing them the right way to fix the defect and the best place in the code
to fix it without requiring deep security domain expertise.
› Coverity Connect provides source code navigation to identify the exact path to the defect and automatically identify every
occurrence of the defect across shared code.
› Defects can be automatically assigned to the appropriate developer for resolution, and users can quickly view all
outstanding security issues, OWASP Top 10 issues, and CWE- and PCI-related issues.
28
Software Development Life-Cycle Integration
› The Coverity platform allows rapid integration of critical tools and systems used to support the development process, such
as source control management, build and continuous integration, bug tracking, integrated development environments
(IDEs), and application life-cycle management (ALM) solutions.
› Coverity is an open platform that allows developers to import third-party analysis results into the workflow to view and
manage all types of defects in the same way, with a single view of software defects and risks.
Drive Adoption And Mitigate Risk
Coverity Policy Manager enables organizations to define and enforce a consistent standard for code security as well as
quality and testing across development teams. It provides visibility into which teams, projects, or components are compliant
with these standards and can create measurable stage gates based on predefined criteria regarding defects and testing. The
customizable views in Coverity Policy Manager allow the selection of development metrics and thresholds that align to
specific objectives.
29
Product Overview: Defensics
The following information is provided by Synopsys. Forrester has not validated any claims and does not endorse Synopsys
or its offerings.
Defensics® is a powerful testing platform that enables developers and asset owners to proactively discover and remediate
unknown vulnerabilities in software and devices.
PRODUCT OVERVIEW
The technology at the core of Defensics is fuzz testing, which is an automated technique for detecting unknown
vulnerabilities by systematically sending malformed inputs to a system under test. Fuzz testing exposes software defects and
vulnerabilities more effectively than any other solution in the market. Defensics was used to independently discover
Heartbleed, the infamous OpenSSL vulnerability that affected over 500,000 websites in April 2014.
Key Features
Key features of Defensics include:
› Out-of-the-box functionality. A fully automated testing platform with prebuilt test suites relieves the responsibility and
burden of manual test creation.
› Extensive protocol coverage. Advanced test suites are available for 290-plus network protocols, file formats, and other
interfaces. Test suites are continuously added, improved, and supported by a dedicated team of test developers.
› Advanced test case generation. This feature utilizes various techniques to generate effective test cases, including
“template,” “generational,” and “evolutionary” test engines.
› Failure detection. This feature supports advanced techniques for detecting failures and anomalous behavior, including
valid case or functional response, resource monitoring, dynamic binary analysis, and source code instrumentation.
› Clear paths to remediation. Thorough documentation and reporting features allow Defensics to identify the root causes
of critical failures in such a way that they are repeatable, easy to understand, and can be shared with the stakeholders
involved in the remediation process.
› Ease of use. An intuitive user interface makes advanced testing and remediation easy for nonsecurity professionals.
30
Appendix A: Total Economic Impact™ Overview
Total Economic Impact is a methodology developed by Forrester Research that enhances a company’s technology decision-
making processes and assists vendors in communicating the value proposition of their products and services to clients. The
TEI methodology helps companies demonstrate, justify, and realize the tangible value of IT initiatives to both senior
management and other key business stakeholders. TEI assists technology vendors in winning, serving, and retaining
customers.
The TEI methodology consists of four components to evaluate investment value: benefits, costs, flexibility, and risks.
BENEFITS
Benefits represent the value delivered to the user organization — IT and/or business units — by the proposed product or
project. Often, product or project justification exercises focus just on IT cost and cost reduction, leaving little room to analyze
the effect of the technology on the entire organization. The TEI methodology and the resulting financial model place equal
weight on the measure of benefits and the measure of costs, allowing for a full examination of the effect of the technology on
the entire organization. Calculation of benefit estimates involves a clear dialogue with the user organization to understand
the specific value that is created. In addition, Forrester also requires that there be a clear line of accountability established
between the measurement and justification of benefit estimates after the project has been completed. This ensures that
benefit estimates tie back directly to the bottom line.
COSTS
Costs represent the investment necessary to capture the value, or benefits, of the proposed project. IT or the business units
may incur costs in the form of fully burdened labor, subcontractors, or materials. Costs consider all the investments and
expenses necessary to deliver the proposed value. In addition, the cost category within TEI captures any incremental costs
over the existing environment for ongoing costs associated with the solution. All costs must be tied to the benefits that are
created.
FLEXIBILITY
Within the TEI methodology, direct benefits represent one part of the investment value. While direct benefits can typically be
the primary way to justify a project, Forrester believes that organizations should be able to measure the strategic value of an
investment. Flexibility represents the value that can be obtained for some future additional investment building on top of the
initial investment already made. For instance, an investment in an enterprisewide upgrade of an office productivity suite can
potentially increase standardization (to increase efficiency) and reduce licensing costs. However, an embedded collaboration
feature may translate to greater worker productivity if activated. The collaboration can only be used with additional
investment in training at some future point. However, having the ability to capture that benefit has a PV that can be
estimated. The flexibility component of TEI captures that value.
RISKS
Risks measure the uncertainty of benefit and cost estimates contained within the investment. Uncertainty is measured in two
ways: 1) the likelihood that the cost and benefit estimates will meet the original projections and 2) the likelihood that the
estimates will be measured and tracked over time. TEI risk factors are based on a probability density function known as
“triangular distribution” to the values entered. At a minimum, three values are calculated to estimate the risk factor around
each cost and benefit.
31
Appendix B: Forrester And The Age Of The Customer
Your technology-empowered customers now know more than you do about your products and services, pricing, and
reputation. Your competitors can copy or undermine the moves you take to compete. The only way to win, serve, and retain
customers is to become customer-obsessed.
A customer-obsessed enterprise focuses its strategy, energy, and budget on processes that enhance knowledge of and
engagement with customers and prioritizes these over maintaining traditional competitive barriers.
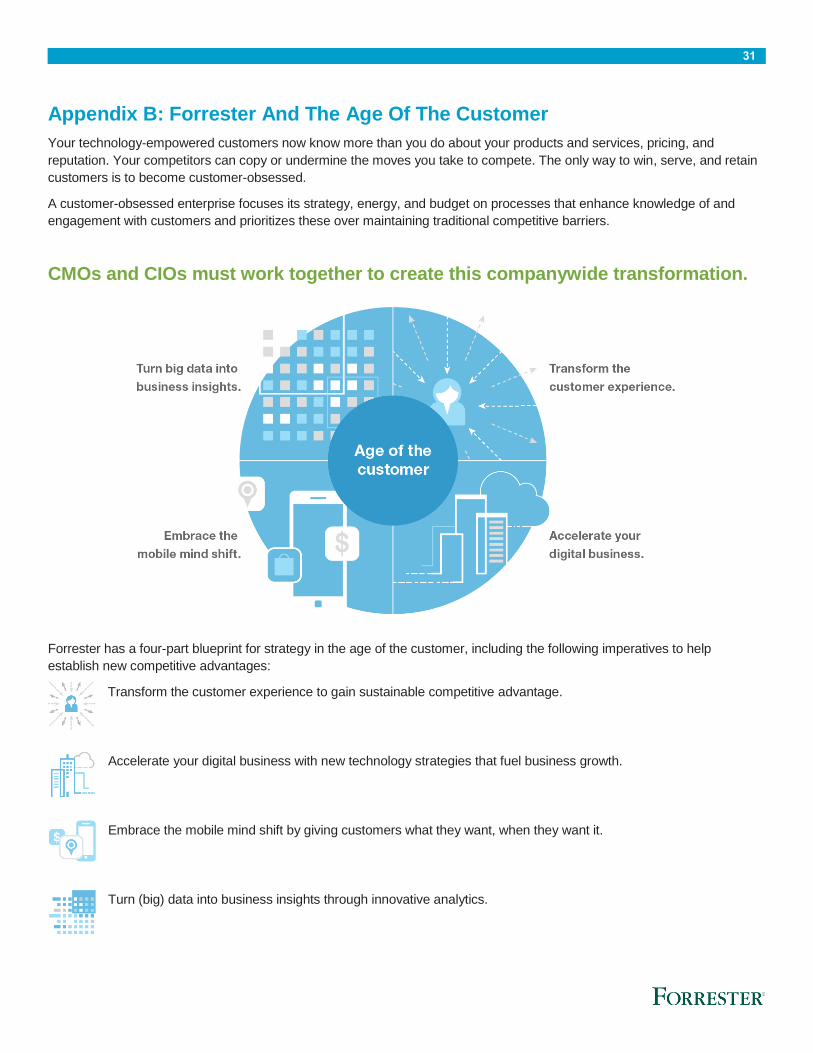
CMOs and CIOs must work together to create this companywide transformation.
Forrester has a four-part blueprint for strategy in the age of the customer, including the following imperatives to help
establish new competitive advantages:
Transform the customer experience to gain sustainable competitive advantage.
Accelerate your digital business with new technology strategies that fuel business growth.
Embrace the mobile mind shift by giving customers what they want, when they want it.
Turn (big) data into business insights through innovative analytics.
32
Appendix C: Glossary
Discount rate: The interest rate used in cash flow analysis to take into account the time value of money. Companies set
their own discount rate based on their business and investment environment. Forrester assumes a yearly discount rate of
10% for this analysis. Organizations typically use discount rates between 8% and 16% based on their current environment.
Readers are urged to consult their respective organizations to determine the most appropriate discount rate to use in their
own environment.
Net present value (NPV): The present or current value of (discounted) future net cash flows given an interest rate (the
discount rate). A positive project NPV normally indicates that the investment should be made, unless other projects have
higher NPVs.
Present value (PV): The present or current value of (discounted) cost and benefit estimates given at an interest rate (the
discount rate). The PV of costs and benefits feed into the total NPV of cash flows.
Payback period: The breakeven point for an investment. This is the point in time at which net benefits (benefits minus costs)
equal initial investment or cost.
Return on investment (ROI): A measure of a project’s expected return in percentage terms. ROI is calculated by dividing
net benefits (benefits minus costs) by costs.
A NOTE ON CASH FLOW TABLES
The following is a note on the cash flow tables used in this study (see the example table below). The initial investment
column contains costs incurred at “time 0” or at the beginning of Year 1. Those costs are not discounted. All other cash flows
in years 1 through 3 are discounted using the discount rate of 10% at the end of the year. PV calculations are calculated for
each total cost and benefit estimate. NPV calculations are not calculated until the summary tables are the sum of the initial
investment and the discounted cash flows in each year.
Sums and present value calculations of the Total Benefits, Total Costs, and Cash Flow tables may not exactly add up, as
some rounding may occur.
TABLE [EXAMPLE]
Example Table
Ref. Metric Calculation Year 1 Year 2 Year 3
Source: Forrester Research, Inc.
33
Appendix D: Endnotes
1 Forrester risk-adjusts the summary financial metrics to take into account the potential uncertainty of the cost and benefit
estimates. For more information, see the section on Risks.
2 Source: “Know Your Code: How Static Analysis Tools Make Applications More Secure,” Forrester Research, Inc.,
November 20, 2009.
3 The assumptions around the relative cost of defect remediation were originally published in a July 2012 study titled, “The
Total Economic Impact Of Codenomicon’s Defensics Security Testing Suite.” The ratios used in the current study are consistent with those used in the previous study in this series.