The Total Economic Impact™ Of Microsoft Azure SQL … · 1 | The Total Economic Impact™ Of...
19
A Forrester Total Economic Impact™ Study Commissioned By Microsoft December 2017 The Total Economic Impact ™ Of The Modern Data Warehouse Improved Analytics At A Lower Cost With Microsoft Azure SQL Data Warehouse
Transcript of The Total Economic Impact™ Of Microsoft Azure SQL … · 1 | The Total Economic Impact™ Of...

A Forrester Total Economic Impact™
Study Commissioned By Microsoft
December 2017
The Total Economic Impact™ Of The Modern Data Warehouse
Improved Analytics At A Lower Cost With Microsoft Azure SQL Data Warehouse

Table Of Contents Executive Summary 1
Key Findings 1
TEI Framework And Methodology 4
The Microsoft Azure Customer Journey 5
Interviewed Organizations 5
Key Challenges 5
Key Results 6
Composite Organization 6
Financial Analysis 7
Improved Analytics And Intelligence 7
Reduced Infrastructure Build-Out 8
Increased IT Team Productivity 10
Unquantified Benefits 11
Flexibility 11
Initial Deployment 12
Ongoing Operations 13
Azure Data Warehouse Fees 13
Financial Summary 15
Microsoft Azure SQL Data Warehouse: Overview 16
Appendix A: Total Economic Impact 17
Project Director:
Jonathan Lipsitz
Project Contributor:
Jon Erickson
ABOUT FORRESTER CONSULTING
Forrester Consulting provides independent and objective research-based
consulting to help leaders succeed in their organizations. Ranging in scope from a
short strategy session to custom projects, Forrester’s Consulting services connect
you directly with research analysts who apply expert insight to your specific
business challenges. For more information, visit forrester.com/consulting.
© 2017, Forrester Research, Inc. All rights reserved. Unauthorized reproduction
is strictly prohibited. Information is based on best available resources.
Opinions reflect judgment at the time and are subject to change. Forrester®,
Technographics®, Forrester Wave, RoleView, TechRadar, and Total Economic
Impact are trademarks of Forrester Research, Inc. All other trademarks are the
property of their respective companies. For additional information, go to
forrester.com.

1 | The Total Economic Impact™ Of Microsoft Azure SQL Data Warehouse
Executive Summary
Microsoft provides Azure SQL Data Warehouse, a cloud-based enterprise
data warehouse solution, that helps its customers achieve scale and better
performance at a lower total cost of ownership (TCO). Microsoft
commissioned Forrester Consulting to conduct a Total Economic Impact™
(TEI) study and examine the potential return on investment (ROI)
enterprises may realize by deploying Azure SQL Data Warehouse (also
referred to as Azure in the study) solutions. The purpose of this study is to
provide readers with a framework to evaluate the potential financial impact
of Azure for data warehouses on their organizations.
To better understand the benefits, costs, and risks associated with this
investment, Forrester interviewed four customers with experience using
Azure for SQL data warehouses.
Prior to moving their data warehouses to Azure, customers typically had a
mix of on-premises and much smaller cloud deployments. However, these
solutions were costly and did not deliver the performance or scale that was
needed. Additionally, it was difficult to generate timely insights because
the data could not easily be aggregated and accessed for analysis, and
also because performance limitations meant lengthy delays.
Key Findings
Quantified benefits. The following risk-adjusted present value (PV)
quantified benefits for a 3,000-employee organization are representative of
those experienced by the companies interviewed:
› Data analytics improved and associated costs reduced as well.
Moving to Azure was not primarily about cost savings. Instead, it was
about improved data warehouse performance (by utilizing more cloud-
based compute power and storage than was available on-premises) and
how that enabled better analytics and business intelligence for both
internal and external use. Additionally, the amount of effort required on
the part of internal data scientists and outside professional services
organizations was reduced. For example, the number of requests made
for a data scientist’s time was cut in half. This and other efficiencies
meant that the amount of resources, equal to five full-time equivalents
(FTEs), was freed up by Year 3 of the study. Since the individual
business benefits, from improved data warehouse performance and
business intelligence, varied greatly across organizations only the cost
savings component is included in the financial analysis. The total three-
year present value (PV) savings was $2.4 million.
› Infrastructure build-out and ongoing maintenance costs were
reduced. By moving to the Azure cloud, companies avoided costly
capex expenditures to build out an on-premises solution approaching
the capabilities they have in Azure. One interviewee estimated it to be
10x their first year spend on the Azure data warehouse. Additionally,
ongoing SQL licenses were 30% lower because fewer processor cores
were required. The total three-year PV savings was $561,435.
› IT team productivity improved from eliminated infrastructure and
database support activities. Both database administrators (DBAs) and
application developers saw improved productivity. Less effort was
required in supporting the infrastructure because additional data
warehouse resources were more quickly available for developers to use.
The result was fewer additional hires to support growth. The total three-
year PV savings was $1.6 million.
Key Benefits
Increase in customer data sets that can be effectively handled:
10x
Reduction in SQL license costs:
30% to 50%
Improved data analytics reporting granularity:
1 day to 15 minutes

2 | The Total Economic Impact™ Of Microsoft Azure SQL Data Warehouse
Unquantified benefits. The interviewed organizations experienced the
following benefits, which are not quantified for this study:
› Organizations improved database security by taking advantage of
features with Azure. As Microsoft began to take care of all software
patching, security was able to improve in several ways. Features such
as always encrypted VNET service and endpoints came to be standard,
with better access control through Active Directory.
› Businesses saw improved results from better data performance
and analytics. Interviewees provided many examples of improved
business outcomes, including: closing more deals, bringing solutions to
market faster, and increasing customer satisfaction. Furthermore, data
democratization has meant that individuals across the organization can
get the answers they need faster, and this has freed up the centralized
data scientist team to work on more strategic and long-term projects.
Costs. The interviewed organizations experienced the following risk-
adjusted PV costs:
› The initial deployment was relatively fast and simple. Interviewees
said that moving to the Azure SQL Data Warehouse environment took a
couple of resources and a few months. One interviewee estimated that
an equivalent on-premises solution would cost six times more than the
Azure solution to build out, in terms of hardware and effort. There were
also some professional services to help configure and integrate the
Azure solution. The total PV cost was $401,500.
› Ongoing operation of the Azure solution was simple to manage.
Interviewees reported that it typically took no more than one FTE to
manage the cloud-based environment and provide services such as
spinning up new databases. There were also some ongoing professional
services to help with optimization and analysis activities. The total PV
cost was $665,855.
› Azure fees paid to Microsoft were predictable and scalable. This
varies greatly depending on the size of the Azure deployment. Moving to
an opex model made for more predictable budgeting. For the composite
organization, the total PV cost over the life of the study was $706,314.
Forrester’s interviews with four existing customers and subsequent
financial analysis found that an organization based on these interviewed
organizations experienced PV benefits of $4.6 million over three years
versus costs of $1.8 million, adding up to a net present value (NPV) of
$2.8 million and an ROI of 158%.
ROI 158%
Benefits PV $4.6 million
NPV $2.8 million
Payback <6 months

3 | The Total Economic Impact™ Of Microsoft Azure SQL Data Warehouse

4 | The Total Economic Impact™ Of Microsoft Azure SQL Data Warehouse
TEI Framework And Methodology
From the information provided in the interviews, Forrester has constructed
a Total Economic Impact™ (TEI) framework for those organizations
considering implementing Microsoft Azure SQL Data Warehouse (Azure
solutions).
The objective of the framework is to identify the cost, benefit, flexibility, and
risk factors that affect the investment decision. Forrester took a multistep
approach to evaluate the impact that Microsoft Azure can have on an
organization:
DUE DILIGENCE Interviewed Microsoft stakeholders and Forrester analysts to gather data relative to Azure SQL Data Warehouse.
CUSTOMER INTERVIEWS Interviewed four organizations using Azure SQL Data Warehouse to obtain data with respect to costs, benefits, and risks.
COMPOSITE ORGANIZATION Designed a composite organization based on characteristics of the interviewed organizations.
FINANCIAL MODEL FRAMEWORK Constructed a financial model representative of the interviews using the TEI methodology and risk-adjusted the financial model based on issues and concerns of the interviewed organizations.
CASE STUDY Employed four fundamental elements of TEI in modeling Microsoft Azure SQL Data Warehouse’s impact: benefits, costs, flexibility, and risks. Given the increasing sophistication that enterprises have regarding ROI analyses related to IT investments, Forrester’s TEI methodology serves to provide a complete picture of the total economic impact of purchase decisions. Please see Appendix A for additional information on the TEI methodology.
The TEI methodology
helps companies
demonstrate, justify,
and realize the
tangible value of IT
initiatives to both
senior management
and other key
business
stakeholders.
DISCLOSURES
Readers should be aware of the following:
This study is commissioned by Microsoft and delivered by Forrester Consulting.
It is not meant to be used as a competitive analysis.
Forrester makes no assumptions as to the potential ROI that other
organizations will receive. Forrester strongly advises that readers use their own
estimates within the framework provided in the report to determine the
appropriateness of an investment in Microsoft Azure SQL Data Warehouse.
Microsoft reviewed and provided feedback to Forrester, but Forrester maintains
editorial control over the study and its findings and does not accept changes to
the study that contradict Forrester’s findings or obscure the meaning of the
study.
Microsoft provided the customer names for the interviews but did not participate
in the interviews.

5 | The Total Economic Impact™ Of Microsoft Azure SQL Data Warehouse
The Microsoft Azure Customer Journey
BEFORE AND AFTER THE AZURE SQL DATA WAREHOUSE INVESTMENT
Interviewed Organizations
For this study, Forrester conducted four interviews with Microsoft Azure
SQL Data Warehouse customers. Interviewed customers include the
following:
Key Challenges
The interviewed organizations faced many challenges around
performance, cost, and usability that led to them seeking a better
solution and eventually choosing Azure for their data analytics needs.
› Existing solutions limited the data analytics that companies could
undertake. The interviewed organizations felt that their previous, on-
premises SQL database solutions hampered their ability to complete
effective and timely data analytics. There were a range of underlying
causes from performance and scalability issues to disparate systems
that did not work well together. One interviewee said: “Our data
infrastructure was haphazard and that meant we couldn’t answer
questions. It would take days to pin data together.”
› Managing the SQL database environment was too costly and
time-consuming. The previous solutions were typically very
heterogeneous, which resulted in complex management processes
and costs that were too high, especially to support future growth. “It
was partially about cost since it is expensive to run a SQL server,” said
one interviewee. “We needed better cost and labor efficiency. We want
everything to run seamlessly with as little touch as possible.” Another
interviewee said: “A huge amount of time was spent on collecting data
and consolidating it. Some people would spend multiple days
consolidating reports.”
› Business operations and go-to-market strategies were hampered
by performance limitations. While cost is always a consideration in
all technology decisions, the interviewed companies stressed that their
biggest concern and why they moved to Azure was to better support
business objectives. One interviewee described it this way: “Cost was
not the main factor. We deal with a lot of big data sets, and as a small
company we are always looking for ways to support our customers
better. We also look for the fastest way to market with new solutions.”
INDUSTRY MAIN OPERATIONS AREA INTERVIEWEE # OF EMPLOYEES
Online media North America Chief technology officer 81
Industrial manufacturing Global Sr. database platform architect 19,000
Workforce solutions Africa and Australia Insight and analytics leader 4,000
Utilities consulting North America Sr. solutions architect 20
“We’ve grown though
acquisition, and that meant we
had a disparate data
architecture and no unified
data model. This was
inherently unstable and could
not deliver what the business
needed.”
Insight and analytics lead,
workforce solutions

6 | The Total Economic Impact™ Of Microsoft Azure SQL Data Warehouse
Key Results The interviews revealed that key results from the Microsoft Azure SQL
Data Warehouse investment include:
› SQL database and associated analytics performance improved
significantly, resulting in better and faster analytics. Interviewed
organizations all described how their SQL performance and analytics
improved, and how this translated into real business benefits. One
interviewee said: “We do modelling for our clients based on their
customers’ past usage. In the time it took us to analyze 10,000 of their
customers, we can now model more than 100,000 because of Azure.
Everything is streamlined and easier, and we can get our clients the
information they need faster.”
› Costs are more predictable and balanced by moving to an opex
model. Previous capex models meant that companies could not build
out cost-effective solutions to meet their peak load requirements and
concentrated expenditures; this resulted in uneven cashflows. With
cloud-based solutions like Azure, cashflows are more evenly spread
and predictable. “The opex model is very important to my management
and makes it easier when I ask for a budget. It provides better
transparency, and I can scale things back down and turn them off if
they don’t deliver the expected business outcomes. That makes it
easier to realize our business cases.”
› Scale is easily achieved to support business growth. Improved
performance, streamlined management, and lower costs mean that
companies can better support future growth from a business process,
data analytics, and SQL database performance perspective. “Scale
used to be a big problem for us. By moving to the Azure cloud, we can
ramp up quicker than before and in ways that were previously cost
prohibitive while using less developer time.”
Composite Organization Based on the interviews, Forrester constructed a TEI framework, a
composite company, and an associated ROI analysis. The composite
organization is representative of the four companies that Forrester
interviewed and is used to present the aggregate financial analysis in the
next section. The composite organization that Forrester synthesized from
the customer interviews has the following characteristics:
Description of composite. The composite organization is a US-based
services company with operations across North America and Europe. It
has approximately 3,000 employees. Prior to consolidating in the Azure
SQL Data Warehouse, it had a mix of on-premises and cloud-based
database solutions. It moved to Azure to simplify operations, control
costs, and achieve better database and data analytics performance.
Deployment characteristics. The organization’s Azure SQL
infrastructure varies based on workload requirements. There are two
data warehouse instances, and the size of each is ten terabytes. Their
average monthly usage is SQL DW500 and peak usage is DW1500. The
overarching goal was to build out a “modern data warehouse” to
leverage platform-as-a-service (PaaS) solutions as much as possible.
The composite organization also wanted to take advantage of
“Microsoft’s investment in cutting-edge technology to get better
performance and features.”
“It was fortuitous that we were
talking to Microsoft about
something else and discussed
what we could do in Azure.
We knew what we wanted to
do, but not how best to do it.
We left our meeting with
Microsoft thinking Azure was
the unicorn we were looking
for.”
CTO, online media

7 | The Total Economic Impact™ Of Microsoft Azure SQL Data Warehouse
The table above shows the total of all benefits across the areas listed below, as well as present values (PVs) discounted at 10%. Over three years, the composite organization expects risk-adjusted total benefits to be a PV
of more than $4.5 million.
Financial Analysis
QUANTIFIED BENEFIT AND COST DATA AS APPLIED TO THE COMPOSITE
Improved Analytics And Intelligence
The most important benefit the interviewees cited was improved and
more agile analytics, which helped the organizations make better
decisions faster, democratize data analysis, and improve business
insights. It also helped reduce costs associated with internal and external
data analysis efforts. Some of what Forrester heard included:
› “Before Azure, a lot of our reporting was done off the live, operational
system, which caused performance problems. That meant some of the
extracts could only be done overnight. Now we can do data transfers
directly into Azure every hour instead of every night with no impact on
operational performance. We plan to reduce this to every half hour
once PowerBI comes fully online.”
› “Our data scientists wanted to run regression analysis against the data,
but our previous solutions couldn’t really do that. It required a
developer working with R script and Python to make it happen, and
this could sometimes take a week. Now our data scientists and
analysts can work in near real time [using T-SQL].”
› “The manual effort to collect, collate, and build reports has been
dramatically reduced. The total effort for 15 to 20 people across the
organization who are doing operational and financial analysis has been
cut in half.”
› “Connecting seamlessly to block storage makes a big difference in
what we can deliver to customers and what we can do around machine
learning and AI.”
› “We have better dashboards and didn’t have to build a central
reporting system in Power BI. We have democratized access to the
data and taught our analysts how to create the reports they want.”
› “There were a lot of things we could not do before because we could
not afford the hardware. Because we can scale up and down with
Azure, we now do the heavy analysis we always wanted to.”
› “Azure allows us to provide customers with more granular data that is
15 minutes old instead of more than one day old. This allows them to
sell more because they can get near real-time data on how they are
performing. In turn, they tell others about this which helps us win new
customers.”
Total Benefits
REF. BENEFIT INITIAL YEAR 1 YEAR 2 YEAR 3 TOTAL PRESENT VALUE
Atr Improved analytics and intelligence
$0 $499,500 $1,116,000 $1,350,000 $2,965,500 $2,390,680
Btr Reduced infrastructure build-out
$360,000 $81,000 $81,000 $81,000 $603,000 $561,435
Ctr Increased IT team productivity $0 $468,000 $702,000 $819,000 $1,989,000 $1,620,947
Total benefits (risk-adjusted) $360,000 $1,048,500 $1,899,000 $2,250,000 $5,557,500 $4,573,062
“The biggest benefit is the
analytics piece. Data scientists
can get their hands on the
data quicker, which helps
them deliver prospective
customer proof of concepts
(PoCs) faster and close deals
faster. It also helps them bring
new solutions to market
faster.”
Sr. solution architect, utilities
consulting

8 | The Total Economic Impact™ Of Microsoft Azure SQL Data Warehouse
Impact risk is the risk that the business or technology needs of the organization may not be met by the investment, resulting in lower overall total benefits. The greater the uncertainty, the wider the potential range of outcomes for benefit estimates.
› “A big savings for us was the amount of effort wasted by our data
scientists trying to complete analyses with the old systems. We were
able to avoid additional hires and free them up to work on more
things.”
› “We had a large outsourcing contract with a consulting company to do
data analysis for us. We were able to eliminate it entirely. Between that
and internal resource savings, we have saved more than [$1.2 million]
per year.”
› “We contract some of our analysis work out to another firm. Their costs
would have doubled had we not moved to Azure.”
Because the business benefits associated with better and faster data
analytics vary so greatly from one firm to the next, e.g., supply chain
optimization versus selling more, the financial component of this study
only includes the savings from less internal and external data analytics
effort. Readers are encouraged to consider the business impacts of
better and more agile analytics, and factor that into their own analysis.
Specific assumptions for the financial analysis include:
› The fully burdened cost for an internal data scientist is $130,000.
› One additional data scientist/analyst hire is avoided in Year 1 of the
study, and the total number grew to five by Year 3 of the study.
› An $850,000 contract for external data analysis work was eliminated.
Half of the benefit is realized in Year 1 of the study.
Because the amount of savings can vary from one organization to the
next depending on the nature of the analytics they are doing, how many
people are involved, and if there are external resources, Forrester
adjusted this benefit downward by 10%, yielding a three-year
risk-adjusted total PV of $2.4 million.
Reduced Infrastructure Build-Out
Moving to Microsoft’s Azure data center greatly reduces or eliminates the
need to build out one’s own infrastructure (both primary and disaster
recovery), either on-premises or in a colocation facility. Furthermore,
interviewees said that moving to Azure reduced the amount and cost of
Microsoft SQL licenses because fewer cores are required, and moving
also provided better disaster recovery (DR) capabilities. Specifically,
Forrester heard from interviewees:
Improved Analytics And Analysis: Calculation Table
REF. METRIC CALC. YEAR 1 YEAR 2 YEAR 3
A1 Eliminated outsourcing contract 50% in Year 1 $425,000 $850,000 $850,000
A2 Reduced internal resources 1.0 3.0 5.0
A3 Fully loaded cost, internal resources $130,000 $130,000 $130,000
At Improved analytics and intelligence A1+A2*A3 $555,000 $1,240,000 $1,500,000
Risk adjustment ↓10%
Atr Improved analytics and intelligence (risk-adjusted) $499,500 $1,116,000 $1,350,000

9 | The Total Economic Impact™ Of Microsoft Azure SQL Data Warehouse
› “It would be impossible for us to build out the equivalent infrastructure
in our own data center because we scale very large a couple of hours
a day — sometimes 10 times our normal capacity. We could never
justify it if were building on-premises. It probably would cost six times
our annual Azure bill just to build it out.”
› “We went from two enterprise and two standard SQL licenses down to
one enterprise license by moving everything to the cloud.”
› “From a SQL licensing perspective, our costs are down 30%.”
› “We are a six-year-old startup, and trying to be pragmatic about what
we do from a DR perspective. We didn’t want to have to run two full
data warehouses in case one went down. With Azure, we avoid doing
that.”
› “We don’t have any downtime. The nice thing is that once we made a
conscious effort into putting out all the fires and having it work in a
reliable way, we can focus on performance and business
improvements. Now we have monitoring across all services and know
early when things start to degrade, which gives us the time needed to
address it. Azure made all of this much easier.”
› “Before Azure, we didn’t have true failover protection. We had backups
in order to stand the infrastructure up again. Now our data is triple
redundant, and our DR capabilities are immeasurably better.”
› “A lot of the implementation in our colocation facility was just bare
metal. To get real redundancy would have taken additional virtualized
hardware and a second cluster with fast failover. It would have taken
us months to put all of that together and replicate the data. It probably
would have cost us $120,000.”
For the composite organization, Forrester assumes that:
› The cost to build out a primary, on-premises data warehouse that met
the basic load requirements was $300,000, and a backup DR data
warehouse would cost $100,000.
› Maintenance on the hardware is calculated at 15%.
› Microsoft SQL license costs were reduced by 30%.
These costs will vary based on data warehouse requirements and the
existing on-premises data warehouse infrastructure. To account for these
risks, Forrester adjusted this benefit downward by 10%, yielding a three-
year risk-adjusted total PV of $561 thousand.
Reduced Infrastructure Build-Out: Calculation Table
REF. METRIC CALC. INITIAL YEAR 1 YEAR 2 YEAR 3
B1 Primary data center $300,000
B2 DR facility $100,000
B3 Hardware maintenance (B1+B2)*15% $60,000 $60,000 $60,000
B4 Reduced SQL license costs $100,000*30% $30,000 $30,000 $30,000
Bt Reduced infrastructure build-out B1+B2+B3+B4 $400,000 $90,000 $90,000 $90,000
Risk adjustment ↓10%
Btr Reduced infrastructure build-out (risk-adjusted) $360,000 $81,000 $81,000 $81,000
“We can scale up on demand
quickly and easily. My
infrastructure team says it is a
fraction of the cost of what it
would be to do all of this on-
premises.”
Insight and analytics lead,
workforce solutions

10 | The Total Economic Impact™ Of Microsoft Azure SQL Data Warehouse
Increased IT Team Productivity
Interviewees reported that DBAs and application developers both
became more productive after moving to Azure SQL Data Warehouse.
For DBAs, this was primarily attributed to less time spent setting up and
optimizing additional data warehouses as well as ongoing patching and
maintenance activities. For developers, better performance and
availability meant that they could do their work faster and better, and also
the self-service capabilities, such as provisioning their own databases,
meant that they did not need to wait on others to complete tasks. This
translated into fewer additional hires to support growth and the ability to
reassign existing people to higher value activities.
Specifically, Forrester heard from interviewees:
› “We had one database developer and one DBA. The DBA left after 12
months because they had nothing left to administer.”
› “We currently have three DBAs and would have needed to hire one
more for dedicated IT activities around patching had we not moved to
Azure.”
› “Provisioning is a lot faster now. If you order a bare metal server and
put on an operating system that would take at least one day. Now, it
only takes us 10 minutes.”
› “We have five application developers. Their lives have become much
easier because they have less stuff to deal with. They are no longer
writing glue or customer components. Azure has massively increased
productivity. I probably would have needed to hire two or three more
people to do everything that we have delivered.”
› “We have seven application developers, and they are all more
productive now.”
For the financial analysis, Forrester included fewer DBA and application
developer hires. Assumptions included:
› Average fully burdened IT FTE cost of $130,000.
› One fewer DBAs added in Year 1, and another avoided in Year 2.
› Three fewer application developers added in Year 1, and growing to
five by Year 3.
The amount of labor and FTE savings will vary based on the size of the
existing team and size of overall operations. To account for these risks,
Forrester adjusted this benefit downward by 10%, yielding a three-year
risk-adjusted total PV of $1.6 million.
Increased IT Team Productivity: Calculation Table
REF. METRIC CALC. YEAR 1 YEAR 2 YEAR 3
C1 DBA savings 1 2 2
C2 Application developer savings 3 4 5
C3 Average fully loaded cost $130,000 $130,000 $130,000
Ct Increased IT team productivity (C1+C2)*C3 $520,000 $780,000 $910,000
Risk adjustment ↓10%
Ctr Increased IT team productivity (risk-adjusted) $468,000 $702,000 $819,000
“Our data warehouse
maintenance overhead went
from two engineers keeping
things up and running to 5% of
one FTE.”
CTO, online media

11 | The Total Economic Impact™ Of Microsoft Azure SQL Data Warehouse
Flexibility, as defined by TEI, represents an investment in additional capacity or capability that could be turned into business benefit for a future additional investment. This provides an organization with the "right" or the ability to engage in future initiatives but not the obligation to do so.
Unquantified Benefits
In addition to the quantified benefits described above, interviewees
described other benefits that could not have a financial value assigned to
them. Readers should also take these into consideration as they may be
as valuable as the ones that were quantified.
Improved SQL Data Warehouse Security
Interviewees used some of the advanced features in Azure SQL Data
Warehouse to improve IT and data security.
› “Managing security across all services is a lot easier. We can give
people what they need to get their job done without the risk of them
doing bad things because we do very low-level permissions in AD.”
› “There was that big ransomware problem this past weekend. We had a
couple of servers on-premises that were affected and had to be
patched. We didn’t have to worry about anything in the Azure cloud.”
› “Security is tighter than it used to be.”
› “We have critical infrastructure data and sensitive customer data. It
needed to be always encrypted and Azure made that very simple.”
Better Business Outcomes
Companies had better business outcomes because of improved data
warehouse performance and agility. In some cases, these benefits may
dwarf the cost savings quantified in the study.
› “We are now able to make changes to our ad software in real time and
see if that improves opt-in rates for a particular product. When we push
out a new campaign, we can see near real-time performance metrics
and fine-tune our offering.”
› “User feedback has been incredibly positive. All managers are of the
opinion that moving to Azure has been very helpful because of the
improved reporting. For the first time, we can look at profitability
companywide across all clients. This allowed us to implement a key
account strategy for our clients that represent 90% of revenue.”
› “We can mock up demos for salespeople faster. Azure has improved
our capabilities to sell.”
› “It used to take us too long to get things done for our biggest
customers. Things that would have taken months now take weeks
since moving to Azure.”
› “For us, moving to Azure was about faster time-to-market, not cost
savings.”
Flexibility
The value of flexibility is clearly unique to each customer, and the
measure of its value varies from organization to organization. There are
multiple scenarios in which a customer might choose to implement
Microsoft Azure SQL Data Warehouse and later realize additional uses
and business opportunities. Flexibility would also be quantified when
evaluated as part of a specific project (described in more detail in
Appendix A).
Interviewees are looking to expand their use of Azure data warehouses.
Some are looking to move Linux servers to Azure, and others are looking
to move more environments over, e.g., development and testing. One is
adapting its Azure environment to create a “true data factory”. None of
these future opportunities are included in the financial analysis.
“Security is much easier to
administer now. It takes a
couple of clicks to encrypt
everything. We are more
secure than when everything
was in the colocation facility.”
Sr. solutions architect, utilities
consulting
“We have had good progress
winning new accounts and
increasing account size by
providing meaningful insights.”
CTO, online media

12 | The Total Economic Impact™ Of Microsoft Azure SQL Data Warehouse
The table above shows the total of all costs across the areas listed below, as well as present values (PVs) discounted at 10%. Over three years, the composite organization expects risk-adjusted total costs to be a PV of more than $1.7 million.
Implementation risk is the risk that a proposed investment may deviate from the original or expected requirements, resulting in higher costs than anticipated. The greater the uncertainty, the wider the potential range of outcomes for cost estimates.
Initial Deployment
Interviewees describe the setup of the Azure SQL Data Warehouse and
subsequent migration as relatively fast and simple. A typical duration
was two to three months.
› “It took us just over two months to build out a new orchestration
pipeline, improve data ingestion through Polybase, refine processes,
and shut down previous data cubes and reports. Two people worked
on this 80% of their time.”
› “We had two people working on this at 10% for two or three months.
We did not need any external resources. My people could figure out
what was needed using Azure documentation.”
› “Our partner set up the environment and created the reports we
needed. It took three months. Their fee was $450,000 and most of that
was for deploy and build.”
For the financial analysis, Forrester conservatively assumed that
deployment required both internal resources and professional services.
The assumptions were:
› Three months total deployment time.
› Two FTEs at an average fully burdened cost of $130,000.
› Professional service fees of $300,000.
Implementation costs may be higher depending on the size and
complexity of the total deployment and if more professional services are
needed. To account for these risks, Forrester adjusted this cost upward
by 10%, yielding a three-year risk-adjusted total PV of $401,500.
Total Costs
REF. COST INITIAL YEAR 1 YEAR 2 YEAR 3 TOTAL PRESENT VALUE
Dtr Initial deployment $401,500 $0 $0 $0 $401,500 $401,500
Etr Ongoing operations $0 $267,750 $267,750 $267,750 $803,250 $665,855
Ftr Azure data warehouse fees $50,313 $201,250 $258,750 $345,000 $855,313 $706,314
Total costs (risk-adjusted) $451,813 $469,000 $526,500 $612,750 $2,060,063 $1,773,668

13 | The Total Economic Impact™ Of Microsoft Azure SQL Data Warehouse
Ongoing Operations
In the Increased IT Productivity benefit section of this study, Forrester
described how the effort to “keep the lights on” has been significantly
reduced. Interviewees reported anywhere from 10% to one FTE working
on maintaining the Azure SQL Data Warehouse estate.
For the financial analysis, Forrester conservatively took the high end of
the range and included one FTE at a fully burdened cost of $130,000 per
year. Forrester also assumed ongoing professional services to assist
with data reporting, analysis, and ongoing data warehouse optimization.
The amount of ongoing effort will vary depending on the size of the
Azure SQL Data Warehouse deployment and to what extent professional
services are used. To account for these risks, Forrester adjusted this
cost upward by 5%, yielding a three-year risk-adjusted total PV of
$665,855.
Azure Data Warehouse Fees
The final cost category is fees paid to Microsoft for use of Azure SQL
Data Warehouse. These fees will vary greatly based on the size of the
deployment, and fees may vary from month to month based on
consumption. For the financial analysis, Forrester used expected costing
with standard discounts for a new deployment with the following
characteristics: Two different data warehouse instances, and the size of
Initial Deployment: Calculation Table
REF. METRIC CALC. INITIAL
D1 Number of months 3
D2 Number of internal FTEs 2
D3 Fully loaded cost, internal resources $130,000/12 months $10,833
D4 Professional services $300,000
Dt Initial deployment D1*D2*D3+D4 $365,000
Risk adjustment ↑10%
Dtr Initial deployment (risk-adjusted) $401,500
Ongoing Operations: Calculation Table
REF. METRIC CALC. INITIAL YEAR 1 YEAR 2 YEAR 3
E1 Internal resources 1 FTE @ $130,000
$130,000 $130,000 $130,000 $130,000
E2 Professional services $125,000 $125,000 $125,000 $125,000
Et Ongoing operations E1+E2 $255,000 $255,000 $255,000 $255,000
Risk adjustment ↑5%
Etr Ongoing operations (risk-adjusted)
$267,750 $267,750 $267,750 $267,750

14 | The Total Economic Impact™ Of Microsoft Azure SQL Data Warehouse
each is ten terabytes. Their average monthly usage is SQL DW500 and
peak usage is DW1500. Costs increase over the life of the study as the
amount of usage increases. Forrester recommends that readers work
with Microsoft or partner account managers to calculate their
organization’s likely usage charges.
The Azure fees may be higher or lower depending on the amount of
services consumed. To account for these risks, Forrester adjusted this
cost upward by 15%, yielding a three-year risk-adjusted total PV of
$706,314.
Azure Data Warehouse Fees: Calculation Table
REF. METRIC CALC. INITIAL YEAR 1 YEAR 2 YEAR 3
F1 Azure fees Initial period prorated $43,750 $175,000 $225,000 $300,000
Ft Azure data warehouse fees =F1 $43,750 $175,000 $225,000 $300,000
Risk adjustment ↑15%
Ftr Azure data warehouse fees (risk-adjusted)
$50,313 $201,250 $258,750 $345,000

15 | The Total Economic Impact™ Of Microsoft Azure SQL Data Warehouse
The financial results calculated in the Benefits and Costs sections can be used to determine the ROI, NPV, and payback period for the composite organization's investment. Forrester assumes a yearly discount rate of 10% for this analysis.
Financial Summary
CONSOLIDATED THREE-YEAR RISK-ADJUSTED METRICS
Cash Flow Chart (Risk-Adjusted)
These risk-adjusted ROI,
NPV, and payback period
values are determined by
applying risk-adjustment
factors to the unadjusted
results in each Benefit and
Cost section.
Cash Flow Table (Risk-Adjusted)
INITIAL YEAR 1 YEAR 2 YEAR 3 TOTAL PRESENT VALUE
Total costs ($451,813) ($469,000) ($526,500) ($612,750) ($2,060,063) ($1,773,668)
Total benefits $360,000 $1,048,500 $1,899,000 $2,250,000 $5,557,500 $4,573,062
Net benefits ($91,813) $579,500 $1,372,500 $1,637,250 $3,497,438 $2,799,393
ROI 158%
Payback period <6 months

16 | The Total Economic Impact™ Of Microsoft Azure SQL Data Warehouse
Microsoft Azure SQL Data Warehouse: Overview The following information is provided by Microsoft. Forrester has not validated any claims and does not endorse
Microsoft or its offerings.
Azure SQL Data Warehouse is the SQL analytics platform that lets you scale compute, and storage elastically
and independently, with massively parallel processing. Seamlessly integrate SQL Data Warehouse with big data
stores, and create a hub to drive highly tailored and enterprise grade performance for your data marts and
cubes, allowing a limitless number of users to interact.
Azure SQL Data Warehouse offers a guaranteed 99.9% availability, regulatory compliance, advanced security
features, and tight integration with upstream and downstream services so you can build a data warehouse that
fits your needs. SQL Data Warehouse is the first service enabling enterprises to replicate data virtually anywhere
around the globe.
Critical capabilities include:
› Lightning-fast provisioning: Provision and scale compute to thousands of cores in under 5 minutes for
incredibly fast performance.
› Elastic compute and storage: SQL Data Warehouse allows you to independently scale compute and storage
to adjust to your unique business needs.
› Advanced security: Built-in features include VNET service endpoints, always-on encryption, audit, and
managed access through Azure Active Directory.
› Cloud-scale data processing: SQL Data Warehouse is built for the massively parallel-processing of large
amounts of data and can handle the most demanding big-data analytics tasks.
› SQL Server foundation: SQL Data Warehouse is built on SQL Server, the industry’s top-performing SQL
engine, with the most comprehensive support for SQL language.
› Limitless concurrency: By integrating with Azure SQL Database and Azure Analysis Services, there is no
limit to how many users can interact.
› Simplicity: SQL Data Warehouse is a fully managed cloud data warehouse that automatically handles
infrastructure, optimization, and more, so that you can focus on driving value from your data.
› Ecosystem integration: Native integration with leading data management and business intelligence vendors,
as well as Microsoft services, to accelerate your time to value for a finished solution.
› Global availability: SQL Data Warehouse is available in more than 30 regions, making it the most
geographically available data warehouse service in the cloud. Keep your data where your users are.
› Industry-leading compliance: SQL Data Warehouse has more than 20 government and industry
certifications, including GDPR and HIPPA, to protect your data and keep it sovereign.
17 | The Total Economic Impact™ Of Microsoft Azure SQL Data Warehouse
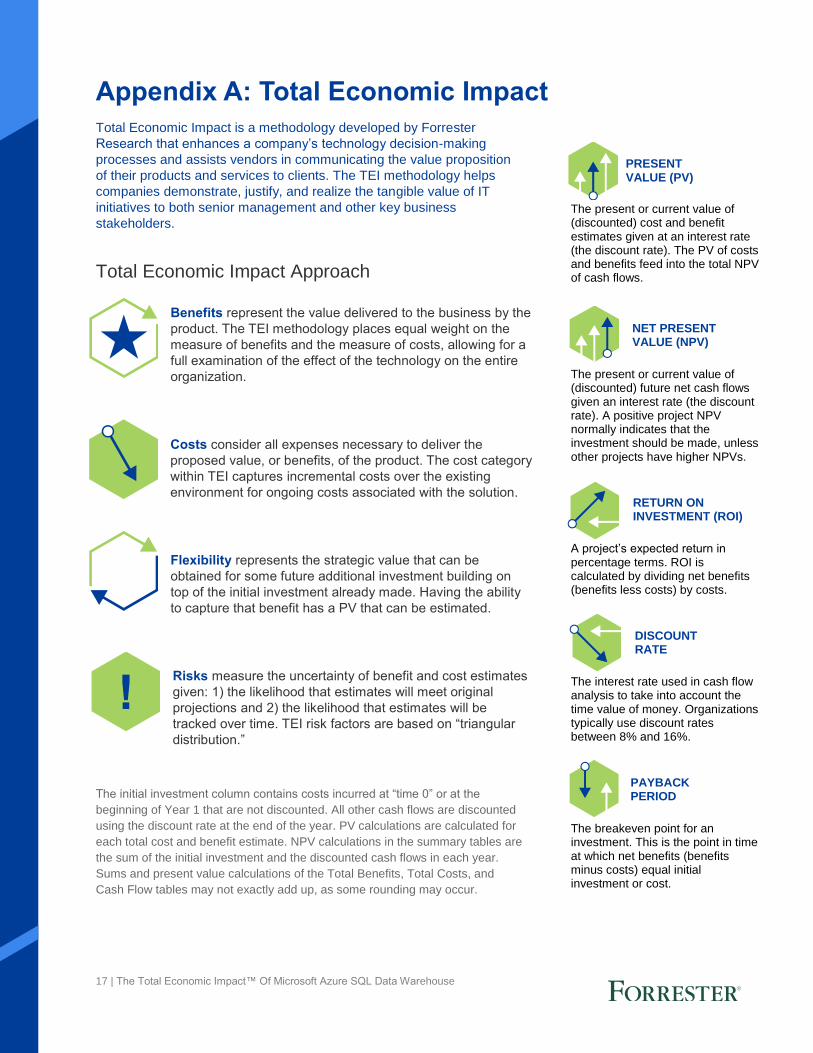
Appendix A: Total Economic Impact
Total Economic Impact is a methodology developed by Forrester
Research that enhances a company’s technology decision-making
processes and assists vendors in communicating the value proposition
of their products and services to clients. The TEI methodology helps
companies demonstrate, justify, and realize the tangible value of IT
initiatives to both senior management and other key business
stakeholders.
Total Economic Impact Approach
Benefits represent the value delivered to the business by the
product. The TEI methodology places equal weight on the
measure of benefits and the measure of costs, allowing for a
full examination of the effect of the technology on the entire
organization.
Costs consider all expenses necessary to deliver the
proposed value, or benefits, of the product. The cost category
within TEI captures incremental costs over the existing
environment for ongoing costs associated with the solution.
Flexibility represents the strategic value that can be
obtained for some future additional investment building on
top of the initial investment already made. Having the ability
to capture that benefit has a PV that can be estimated.
Risks measure the uncertainty of benefit and cost estimates
given: 1) the likelihood that estimates will meet original
projections and 2) the likelihood that estimates will be
tracked over time. TEI risk factors are based on “triangular
distribution.”
The initial investment column contains costs incurred at “time 0” or at the
beginning of Year 1 that are not discounted. All other cash flows are discounted
using the discount rate at the end of the year. PV calculations are calculated for
each total cost and benefit estimate. NPV calculations in the summary tables are
the sum of the initial investment and the discounted cash flows in each year.
Sums and present value calculations of the Total Benefits, Total Costs, and
Cash Flow tables may not exactly add up, as some rounding may occur.
PRESENT VALUE (PV)
The present or current value of (discounted) cost and benefit estimates given at an interest rate (the discount rate). The PV of costs and benefits feed into the total NPV of cash flows.
NET PRESENT VALUE (NPV)
The present or current value of (discounted) future net cash flows given an interest rate (the discount rate). A positive project NPV normally indicates that the investment should be made, unless other projects have higher NPVs.
RETURN ON INVESTMENT (ROI)
A project’s expected return in percentage terms. ROI is calculated by dividing net benefits (benefits less costs) by costs.
DISCOUNT RATE
The interest rate used in cash flow analysis to take into account the time value of money. Organizations typically use discount rates between 8% and 16%.
PAYBACK PERIOD
The breakeven point for an investment. This is the point in time at which net benefits (benefits minus costs) equal initial investment or cost.