The Total Economic Impact Of IBM’s Worklight Platform
20
A Forrester Total Economic Impact™ Study Prepared For IBM The Total Economic Impact Of IBM’s Worklight Platform Cost Savings In The Development And Maintenance Of Multiplatform Mobile Apps Project Director: Jan ten Sythoff Contributor: Jon Erickson April 2013
-
Upload
ibm-software-india -
Category
Business
-
view
596 -
download
2
description
The Total Economic Impact Of IBM’s Worklight Platform
Transcript of The Total Economic Impact Of IBM’s Worklight Platform

A Forrester Total Economic Impact™ Study Prepared For IBM
The Total Economic Impact Of IBM’s Worklight Platform Cost Savings In The Development And Maintenance Of Multiplatform Mobile Apps
Project Director: Jan ten Sythoff
Contributor: Jon Erickson
April 2013
Forrester Consulting
The Total Economic Impact Of IBM’s Worklight Platform
Page 1
TABLE OF CONTENTS Executive Summary ................................................................................................................................................................................. 2
IBM Worklight Decreases The Costs Of Multiplatform App Development, Integration And Maintenance.................. 2
Factors Affecting Benefits And Costs ............................................................................................................................................. 4
Disclosures ........................................................................................................................................................................................... 5
TEI Framework And Methodology ...................................................................................................................................................... 6
Analysis ...................................................................................................................................................................................................... 7
Interview Highlights .......................................................................................................................................................................... 7
Costs ...................................................................................................................................................................................................... 8
Benefits ............................................................................................................................................................................................... 10
Flexibility ............................................................................................................................................................................................ 14
Risk ...................................................................................................................................................................................................... 14
Financial Summary ................................................................................................................................................................................ 16
IBM Worklight: Overview.................................................................................................................................................................... 17
Appendix A: Total Economic Impact™ Overview ........................................................................................................................... 18
Appendix B: Glossary ............................................................................................................................................................................ 19
Appendix C: Endnotes .......................................................................................................................................................................... 19
© 2013, Forrester Research, Inc. All rights reserved. Unauthorized reproduction is strictly prohibited. Information is based on best available resources. Opinions reflect judgment at the time and are subject to change. Forrester®, Technographics®, Forrester Wave, RoleView, TechRadar, and Total Economic Impact are trademarks of Forrester Research, Inc. All other trademarks are the property of their respective companies. For additional information, go to www.forrester.com.
About Forrester Consulting Forrester Consulting provides independent and objective research-based consulting to help leaders succeed in their organizations. Ranging in scope from a short strategy session to custom projects, Forrester’s Consulting services connect you directly with research analysts who apply expert insight to your specific business challenges. For more information, visit www.forrester.com/consulting.

Forrester Consulting
The Total Economic Impact Of IBM’s Worklight Platform
Page 2
Executive Summary
Since the launch of Apple’s iPhone in mid 2007, the use of mobile apps has exploded. Today’s enterprise is increasingly mobile and apps enable employees to have better access to information and customers to access products and services. At the same time the range of devices is widening as tablets become ever more popular, Android goes from strength to strength and other platforms continue to offer important benefits.
The cost of developing and maintaining apps increases with the number of platforms supported, the number of apps and the complexity of the apps; more often than not enterprises have little control over them because they are tied to third party developers. While creating and managing a single app on a single platform might be relatively straightforward in a native environment, doing so across multiple platforms and for multiple apps rapidly becomes cost ineffective. Apps need to:
x Support multiple platforms and form factors.
x Be constantly maintained, improved and upgraded.
x Be secure.
x Have access to content and back-end systems.
IBM Worklight is a mobile application platform (MAP), software which enables cross platform app development and maintenance. In June 2012, IBM commissioned Forrester Consulting to examine the total economic impact and potential return on investment (ROI) enterprises may realize by deploying Worklight. The purpose of this study is to provide readers with a framework to evaluate the potential financial impact of the Worklight platform on their organizations. Our financial analysis compares the cost of creating and managing a single app in native environments and on the Worklight platform. The app is complex, in that it needs to connect to multiple back-end systems, requires a high level of security, has many different user screens and is supported across four platforms.
IBM Worklight Decreases The Costs Of Multiplatform App Development, Integration And Maintenance Our interviews with one existing customer and subsequent financial analysis found that the organization we interviewed experienced the equivalent risk-adjusted ROI, costs, and benefits shown in Table 1. Figure 1 compares the initial and annual costs of developing and maintaining a complex 4-platform app in a native environment and on the Worklight platform.

Forrester Consulting
The Total Economic Impact Of IBM’s Worklight Platform
Page 3
Table 1 Five-Year Risk-Adjusted ROI, Total Benefits, Total Costs And Net Present Value For The First Complex, 4 Platform App1
ROI
Total benefits (PV)
Total costs (PV)
Net present value
363% $1,158,872 ($250,457) $908,415
Source: Forrester Research, Inc.
x Benefits. The organization we interviewed experienced the following benefits:
o Cost savings of multiplatform app development and integration. The Worklight platform enables enterprises to create and integrate apps across multiple platforms with lower costs than doing so in a native environment. These savings come about in a number of ways including the ability to reuse the same code across the different platforms and the fact that the app is created and integrated across different platforms within a single project.
o App maintenance and upgrade cost savings. With Worklight an app can be managed, improved and upgraded quickly and easily across multiple platforms, a process which is complicated and costly in a native environment. Users also benefit because improved apps become available sooner, leading to higher acceptance and usage.
o Content maintenance cost savings. Content maintenance becomes significantly easier on the Worklight platform, with typical savings of 80%. In particular, the middleware layer facilitates security testing, a significant pain point in native environments.
o Sunk costs for additional apps. This analysis has been undertaken for a single app across four platforms. The return on investment for additional apps on top of this first one is higher because various costs including internal staff set-up costs, dedicated platform staff, professional services and hardware are fixed and so do not increase as additional apps are developed. Internal staff has been trained, the platform is in place and it is already being maintained; the present value of these sunk costs amounts to nearly $53,000. It is up to the enterprise to maximize its investment by ensuring that the platform supports as many apps as possible, although this can be a challenge in large companies with different departments using different apps.
o Cost savings from leveraging internal resources. Enterprises can realize cost savings across the life cycle of the app by leveraging internal resources and thus can rely less on external developers. Not only are internal resources typically lower cost, but they also enable a higher degree of control and flexibility.
o PCs are also supported. One of the key factors for the enterprise to choose Worklight over other MAPs was that it is the only one which supports PCs. This was crucial given that the majority of the enterprise’s mobile workforce still predominantly use laptops.
Forrester Consulting
The Total Economic Impact Of IBM’s Worklight Platform
Page 4
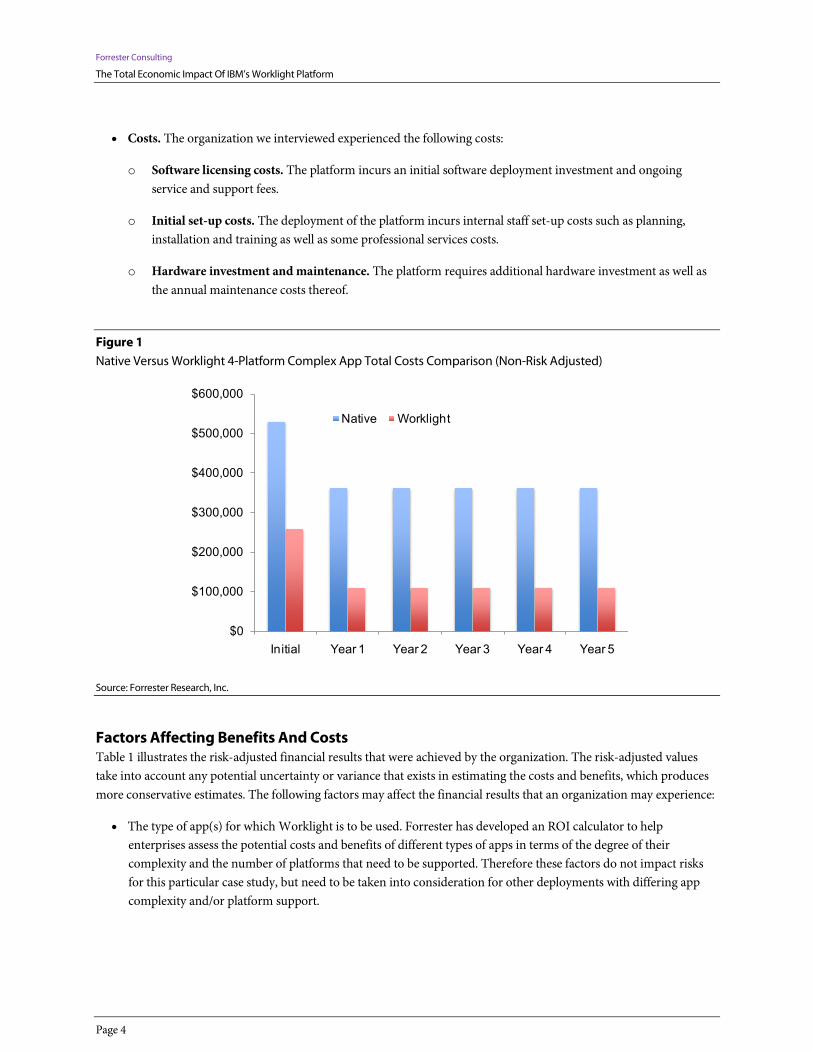
x Costs. The organization we interviewed experienced the following costs:
o Software licensing costs. The platform incurs an initial software deployment investment and ongoing service and support fees.
o Initial set-up costs. The deployment of the platform incurs internal staff set-up costs such as planning, installation and training as well as some professional services costs.
o Hardware investment and maintenance. The platform requires additional hardware investment as well as the annual maintenance costs thereof.
Figure 1 Native Versus Worklight 4-Platform Complex App Total Costs Comparison (Non-Risk Adjusted)
Source: Forrester Research, Inc.
Factors Affecting Benefits And Costs Table 1 illustrates the risk-adjusted financial results that were achieved by the organization. The risk-adjusted values take into account any potential uncertainty or variance that exists in estimating the costs and benefits, which produces more conservative estimates. The following factors may affect the financial results that an organization may experience:
x The type of app(s) for which Worklight is to be used. Forrester has developed an ROI calculator to help enterprises assess the potential costs and benefits of different types of apps in terms of the degree of their complexity and the number of platforms that need to be supported. Therefore these factors do not impact risks for this particular case study, but need to be taken into consideration for other deployments with differing app complexity and/or platform support.
$0
$100,000
$200,000
$300,000
$400,000
$500,000
$600,000
Initial Year 1 Year 2 Year 3 Year 4 Year 5
Native Worklight

Forrester Consulting
The Total Economic Impact Of IBM’s Worklight Platform
Page 5
o Apps vary significantly in terms of their degree of complexity, from very simple ones which have few screens/views, no or limited back-end access requirements and limited security requirements to much more complex apps which need to access multiple back-end systems, have high security requirements and have multiple screens/views. The more complex the app, the higher the benefits of Worklight.
o The number of platforms that need to be supported. The native environment is better suited for an app which only needs to be supported on a single platform, but the more platforms that need to be supported, the higher the Worklight benefits become.
x The degree to which internal staff are used instead of external resources across the app lifecycle, including development, integration and maintenance. The lower the dependence on external resources, the higher the benefits of the Worklight platform. As above, the ROI calculator is able to modify these ratios, and so do not impact the risks associated with this particular case study, but need to be considered for other cases.
x The internal staff set-up costs could be higher if it takes longer to plan the investment, train staff and implement the platform. This depends to some degree on the legacy infrastructure as well as the way in which native apps are implemented and supported.
x The app design and development costs of the first app on the Worklight platform may be higher if it takes longer for internal IT staff to adapt to the platform and learn how it is best used. This might particularly be the case if staff is in different locations and time zones; this risk can be mitigated by good organization and planning.
x The cost saving benefits over the period may be lower because of different internal infrastructure such as back-end systems and legacy app installations.
Disclosures The reader should be aware of the following:
x The study is commissioned by IBM and delivered by the Forrester Consulting group.
x Forrester makes no assumptions as to the potential return on investment that other organizations will receive. Forrester strongly advises that readers should use their own estimates within the framework provided in the report to determine the appropriateness of an investment in Worklight.
x IBM reviewed and provided feedback to Forrester, but Forrester maintains editorial control over the study and its findings and does not accept changes to the study that contradict Forrester’s findings or obscure the meaning of the study.
x The customer names for the interviews were provided by IBM.

Forrester Consulting
The Total Economic Impact Of IBM’s Worklight Platform
Page 6
TEI Framework And Methodology
Introduction From the information provided in the interviews, Forrester has constructed a Total Economic Impact™ framework for those organizations considering implementing Worklight. The objective of the framework is to identify the cost, benefit, flexibility, and risk factors that affect the investment decision.
Approach And Methodology Forrester took a multistep approach to evaluate the impact that Worklight can have on an organization (see Figure 2). Specifically, we:
x Interviewed IBM marketing/sales/consultants personnel and Forrester analysts to gather data relative to Worklight and the marketplace for Worklight.
x Interviewed one organization currently using Worklight to obtain data with respect to costs, benefits, and risks.
x Constructed a financial model representative of the interviews using the TEI methodology. The financial model is populated with the cost and benefit data obtained from the interviews as applied to the composite organization.
Figure 2 TEI Approach
Source: Forrester Research, Inc.
Forrester employed four fundamental elements of TEI in modeling Worklight’s service:
1. Costs.
2. Benefits to the entire organization.
3. Flexibility.
4. Risk.
Given the increasing sophistication that enterprises have regarding ROI analyses related to IT investments, Forrester’s TEI methodology serves the purpose of providing a complete picture of the total economic impact of purchase decisions. Please see Appendix A for additional information on the TEI methodology.
Construct financial model using TEI
framework
Write case study
Perform due diligence
Conduct customer interviews

Forrester Consulting
The Total Economic Impact Of IBM’s Worklight Platform
Page 7
Analysis
Interview Highlights A total of two interviews with the same enterprise were conducted for this study, involving representatives from a large global electronic enterprise which employs around 8,400 staff, and is present in 70 countries. It develops, produces and markets electronic products to a range of clients in different vertical industries including aerospace and defense, communications and broadcasting. As such, the company has a large direct sales force which needs to be optimally equipped to maximize limited time in sales meetings. The IT department enables employees to use mobile devices of different platforms.
Initially an iOS app was developed in a native environment to enable sales staff to have offline access to all product brochures and documentation, but costs quickly escalated largely because a copy of the active directory had to be made available outside their firewall which IT security could not endorse, and resulted in additional resources required for content maintenance which would need to be replicated as different platforms are supported. This was the trigger to look for alternative solutions. This initial app has since then been developed on the Worklight platform and is the basis for our analysis.
Furthermore, there are a number of other apps which are being developed on the Worklight platform including one for tablets to enable clients to download and read their technical magazine, a similar magazine type tablet app but for internal use and an app to support employee use of mobile devices. Further down the line additional use of the Worklight platform will be needed, such as to upgrade a number of simpler apps. It is also worth mentioning that more opportunities with apps become viable as costs have fallen.
The interviews uncovered that:
x There are multiple ways in which the Worklight platform enables cost savings and makes the development, integration and maintenance of a complex, multiplatform app much easier.
“It’s not only the lower development costs but more the ability to address different platforms within a single project at all.”
“The instant update feature not only lowers maintenance costs but is also very helpful in increasing acceptance for the end users because they experience a shorter reaction time in implementing their requirements (sometimes only a few days instead of a few weeks)”
“. . . the dependence to do a maintenance contract with the same specific external resource which implemented the app in the first place is not longer necessary.”
“The unified middleware layer of Worklight allows the creation of an access functionality to backend systems which can be reused for other projects. Meanwhile we see at least 20% reuse of this functionality and a mean of 60% reuse. The middleware layer also facilitates security testing of these access functions because many parts of security tests can be skipped while the platform security is identical.”
x The use of smartphones and tablets is increasing, but PCs are still the preferred device for many.

Forrester Consulting
The Total Economic Impact Of IBM’s Worklight Platform
Page 8
“60% of our employees predominantly use their laptops and support of Adobe AIR was a key reason for choosing Worklight over alternative platforms . . .” (Head of mobile strategy, corporate marketing)
Framework Assumptions Table 2 provides the model assumptions that Forrester used in this analysis.
Table 2 Model Assumptions
Ref. Metric Calculation Value
A1 Hours per week 40
A2 Weeks worked per year 45
A3 External developer hourly cost $130
A4 Fully loaded database administrator salary (rounded) $104,500*1.3 $136,000
A5 Database administrator hourly cost A4/A2/A1 $77
A6 Complex app development hours (native environment) 734
A7 Complex app development costs (native environment) A3*A6 $95,388
A8 Complex app integration hours (native environment) 341
A9 Complex app integration costs (native environment) A3*A8 $44,330
Source: Forrester Research, Inc.
The discount rate used in the PV and NPV calculations is 10% and time horizon used for the financial modeling is 5 years. Organizations typically use discount rates between 8% and 16% based on their current environment. Readers are urged to consult with their respective company’s finance department to determine the most appropriate discount rate to use within their own organizations.
Costs There are four different categories of costs: the software licensing, the internal staff set up cost (as compared to that required in a native environment), the hardware costs (both purchase and maintenance) and the professional services installation costs. The staff set-up and professional services costs are initial upfront costs only, while the licensing and hardware elements incur both initial and ongoing costs.

Forrester Consulting
The Total Economic Impact Of IBM’s Worklight Platform
Page 9
Figure 3 IBM Worklight Platform Cost Breakdown By Category (Risk Adjusted)
Source: Forrester Research, Inc.
Software Licensing These are the licensing fees charged by IBM for the use of its platform. In the case of the Worklight Enterprise Edition, this amounts to $36,600 per server plus $150 per client device installation at the time of writing. In this case study there were a total of around 500 installations initially and so the total upfront licensing cost was $114,100, which includes the first year of subscription and support. There are ongoing service and support maintenance fees for the platform every year of its use, which are equivalent to approximately 20% of the deployment costs, including the cost per device installation. We have assumed a slight increase year on year of the total device installations and so these costs increase gradually from $27,470 in the second year (the first years service and support charges are included in the deployment license) to $30,646 in the fifth. Please note these prices were valid at the time this research was undertaken and prices can change every year. Over the whole of the period software licensing accounts for 78% of the total costs.
Internal Staff Set-Up Costs This category is the difference of all the staff costs incurred in terms of planning, training, installation and pre-configuration for Worklight as compared to working in a native environment. It took 6 man months to complete these tasks in the case of Worklight, but only half of that time in a native environment. It takes more time to plan and install IBM’s platform than to plan and work with outside developers in the native environment as external third parties largely do this. The difference is the equivalent of a quarter of a year’s fully loaded salary of a skilled IT administrator, which amounts to $34,542; this is equivalent to 14% of the total costs.
Software licensing
costs79%
Internal staff set-up costs
14%
Professional services
2%
Hardware5%

Forrester Consulting
The Total Economic Impact Of IBM’s Worklight Platform
Page 10
Professional Services And Additional Hardware Costs The installation of the Worklight platform required 5 days of professional services at a cost of $6,750. Additional hardware investments were also incurred, at an initial cost of $7,500 plus annual hardware maintenance costs of around $1,125. These costs make up the remaining 8% of total costs over the five year period.
Table 3 Total Cost Cash Flows (Risk-Adjusted Estimates)
Cost category Initial Year 1 Year 2 Year 3 Year 4 Year 5 Total Present value
Software licensing costs
($114,100) $0 ($27,470) ($28,478) ($29,535) ($30,646) ($230,229) ($197,400)
Internal staff set-up costs
($34,542) $0 $0 $0 $0 $0 ($34,542) ($34,542)
Professional services
($6,750) $0 $0 $0 $0 $0 ($6,750) ($6,750)
Hardware ($7,500) ($1,125) ($1,125) ($1,125) ($1,125) ($1,125) ($13,125) ($11,765)
Total costs (risk-adjusted)
($162,892) ($1,125) ($28,595) ($29,603) ($30,660) ($31,771) ($284,646) ($250,457)
Source: Forrester Research, Inc.
Total Costs The total present value of all the costs amounts to $250,457, with about 65% incurred upfront and the rest over the five year period. Nearly the initial and ongoing licensing fees account for four-fifths of the costs.
Benefits The quantifiable benefits included in our analysis are the cost savings of developing and maintaining a multiplatform app on the Worklight platform as opposed to a native environment. These costs have been divided into five parts: app design and development; app integration; app maintenance; content maintenance and ongoing staff maintenance. There are additional benefits the platform which we have not included into our financial analysis but should be noted as they mean that the numbers we are providing are conservative and in some cases this can make an important difference.

Forrester Consulting
The Total Economic Impact Of IBM’s Worklight Platform
Page 11
Figure 4 IBM Worklight Platform Benefits Breakdown By Category (Risk Adjusted)
Source: Forrester Research, Inc.
Cost Savings Of Worklight Multiplatform App Development And Maintenance There are four areas wherein the Worklight platform enables costs savings across the lifecycle of a multi-platform app:
x App design and development: In terms of the design and development of the app, there are two important ways in which cost savings are created. First of all the majority of the coding of the app software can be reused across all the different platforms; in a native environment the scope for this is much more limited. Moreover a single multiplatform app is developed in one project on the Worklight platform, while in a native environment the project costs are replicated for each of the platforms. The cost savings of designing and developing a complex app across four platforms in Worklight amount to $117,198 (we estimate that the costs of developing this app in native environments would be around $352,934). These benefits are gained at the initial stage, prior to the launch of the app.
x App integration: The Worklight platform greatly eases the app integration process, and, as for app development, it is done in a single project, whereas in a native environment each of the platforms would require individual integration exercises. The cost savings of integrating the app amount to $138,279 (we estimate that the costs of integrating this app in native environments would be around $177,320). One of the reasons for this significant saving is that much of this work has moved internally. These benefits are gained at the initial stage, prior to the launch of the app.
App design and
development10%
App test, integration, and other
project costs12%
App maintenance/
upgrade31%
App content maintenance
34%
Ongoing IT staff
maintenance13%

Forrester Consulting
The Total Economic Impact Of IBM’s Worklight Platform
Page 12
x Content maintenance: The Worklight platform also facilitates content maintenance for each year of the life of the app. For complex apps, these costs fall by 80% and result in annual cost savings of $102,874. Content maintenance benefits account for 34% of the total benefits, and is the largest category.
x App maintenance: The maintenance of apps, including bug fixing, feature and function additions and other elements of upgrading, are greatly facilitated by the Worklight platform. In a native environment these have to be done separately for the different platforms and typically incur significant third party costs. Annual maintenance cost savings amount to $94,400 for each of the five years (we estimate that the annual maintenance costs of a complex four platform app would amount to around $156,000). These benefits account for 31% of the total benefits.
Staff Maintenance Cost Savings This benefit category captures the difference in ongoing staff costs of maintaining the Worklight platform versus ongoing internal staff costs of managing third parties and/or internal IT requirements in a native environment. In the case of a four platform complex app, this results in annual cost savings of $41,040.
Table 4 Total Benefits Cash Flows (Risk-Adjusted Estimates)
Benefits category
Initial Year 1 Year 2 Year 3 Year 4 Year 5 Total Present value
App design and development
$117,198 $0 $0 $0 $0 $0 $117,198 $117,198
App test and integration
$138,279 $0 $0 $0 $0 $0 $138,279 $138,279
App maintenance/upgrade
$0 $94,400 $94,400 $94,400 $94,400 $94,400 $471,998 $357,848
App content maintenance
$0 $102,874 $102,874 $102,874 $102,874 $102,874 $514,368 $389,972
Ongoing IT staff maintenance
$0 $41,040 $41,040 $41,040 $41,040 $41,040 $205,200 $155,574
Total benefits (risk-adjusted)
$255,477 $238,313 $238,313 $238,313 $238,313 $238,313 $1,447,043 $1,158,872
Source: Forrester Research, Inc.

Forrester Consulting
The Total Economic Impact Of IBM’s Worklight Platform
Page 13
Higher ROI Of Subsequent Apps/Sunk Costs Our analysis includes the costs and benefits associated with the first app developed on the Worklight platform. Any additional apps developed on the platform will enjoy significantly higher ROIs because there are sunk costs which do not increase with the number of apps. These sunk costs amount to $53,057 as a net present value and so can be added to the total benefits amount for subsequent apps developed on the platform.
Faster Time-To-Market/Upgrade By developing and integrating apps across all the different platforms at the same time, typically it becomes available sooner across all the platforms. Furthermore, bug fixes, additional features and functions and improved UIs associated with upgrades and improved versions become available much faster, typically days instead of weeks. This is in large part because once the platform has been internally certified and security cleared all future iterations of the app(s) do not need the same level of security scrutiny. This has the added benefit of driving user acceptance and downloads and usage. Note that these benefits have not been included in our financial analysis.
Lower Dependence On External Resources In a native environment typically enterprises use third parties in the development, integration and maintenance at least to some degree. It is generally uneconomical for companies to have internal resources specialized in writing apps in all the different native languages. Once a third party has developed an app, typically the enterprise will be dependent on this partner for at least some of the integration and maintenance and indeed they will be tied to them for such support, which can incur significant costs. Furthermore third party developers may not always be available and so fixes, updates or other maintenance tasks may take longer/and or incur additional costs. The Worklight platform enables apps to be developed in non-specialized languages (HTML5, CSS and Java) and so leverage in-house developers and furthermore severs the link to third parties (even when enterprises still choose to work with external resources for app development). Note, however, that the platform also supports the use of native and hybrid languages.
Support For PCs One of the key selling points of the Worklight platform was its support for PCs. 60% of the mobile workforce of the enterprise still predominantly use laptops. By making apps available on Adobe AIR in this case, these users were able to benefit from the app using their laptops.
End-To-End Security The Worklight platform lowers security risks associated with the use of mobile apps in native environments and has multiple security capabilities and features including device provisioning, user authentication, app authentication and features which facilitate app upgrades and access to the latest releases. Additional benefits are enabled when Worklight is integrated with IBM’s mobile device management platform IBM Endpoint Manager for Mobile Devices.
Total Benefits The total benefits amount to $255,477, initially, equivalent to the difference in app development and integration between native and Worklight. Once the app is up and running the benefits equate to the difference in annual app maintenance, app content maintenance and ongoing IT staff costs between the native environment and the Worklight

Forrester Consulting
The Total Economic Impact Of IBM’s Worklight Platform
Page 14
platform and amount to $238,313 every year. The total benefits over the whole period equates to $1,158,872 as a net present value.
Flexibility Flexibility, as defined by TEI, represents an investment in additional capacity or capability that could be turned into business benefit for some future additional investment. This provides an organization with the “right” or the ability to engage in future initiatives but not the obligation to do so. There are multiple scenarios in which a customer might choose to implement Worklight and later realize additional uses and business opportunities. Flexibility would also be quantified when evaluated as part of a specific project (described in more detail in Appendix A).
Flexibility is a fundamental element of the Worklight platform. While it does not come into play within this case study, it is very clear that using the platform for additional apps over and above the first as described in this study, results in even higher returns on investment. These are described in the above section (higher ROI of subsequent apps).
Risk Forrester defines two types of risk associated with this analysis: implementation risk and impact risk. “Implementation risk” is the risk that a proposed investment in Worklight may deviate from the original or expected requirements, resulting in higher costs than anticipated. “Impact risk” refers to the risk that the business or technology needs of the organization may not be met by the investment in Worklight, resulting in lower overall total benefits. The greater the uncertainty, the wider the potential range of outcomes for cost and benefit estimates.
Quantitatively capturing investment and impact risk by directly adjusting the financial estimates results in more meaningful and accurate estimates and a more accurate projection of the ROI. In general, risks affect costs by raising the original estimates, and they affect benefits by reducing the original estimates. The risk-adjusted numbers should be taken as “realistic” expectations since they represent the expected values considering risk.
The following implementation risks that affect costs are identified as part of this analysis:
x The internal staff set-up costs could be higher if it takes longer or more effort for the planning, training and installment of the Worklight platform. Some legacy infrastructure may be more difficult to integrate with the platform, while staff to be trained may be less experienced in the use of similar technologies.
x The costs of developing and integrating the first app on the platform may also be higher. Different enterprises have different back-end infrastructures some of which may be harder (or easier) to integrate with the new app.
The following impact risks that affect benefits are identified as part of the analysis:
x The cost savings the Worklight platform enables may be lower, even for a given type of app (i.e., degree of complexity and number of platforms supported). This can come about in many different ways, including:
o The degree to which development, integration and maintenance work is moved internally.
o The make-up of the app, which may require more development effort, but needs not connect to so many back-end systems.

Forrester Consulting
The Total Economic Impact Of IBM’s Worklight Platform
Page 15
o The initial quality of the app, which may have required no fixes or upgrades, therefore lowering the app maintenance cost benefits.
o The make-up of the back-end content, which may not require frequent updating and/or stringent security.
IBM offers Worklight Developer Edition, a try and buy approach which can help enterprises reduce many of these risks by learning and experimenting with it prior to investing.
Table 5 shows the values used to adjust for risk and uncertainty in the cost and benefit estimates. The TEI model uses a triangular distribution method to calculate risk-adjusted values. To construct the distribution, it is necessary to first estimate the low, most likely, and high values that could occur within the current environment. The risk-adjusted value is the mean of the distribution of those points. Readers are urged to apply their own risk ranges based on their own degree of confidence in the cost and benefit estimates.
Table 5 Cost And Benefit Risk Adjustments
Costs Low Most likely High Mean
Internal staff set-up costs 95% 100% 108% 101%
Benefits Low Most likely High Mean
App lifecycle cost savings 78% 100% 105% 94%
Source: Forrester Research, Inc.
Readers are urged to apply their own risk ranges based on their own degree of confidence in the cost and benefit estimates.

Forrester Consulting
The Total Economic Impact Of IBM’s Worklight Platform
Page 16
Financial Summary
The financial results calculated in the Costs and Benefits sections can be used to determine the return on investment, and net present value for the organization’s investment in Worklight. These are shown in Table 6 below.
Table 6 Cash Flow — Risk-Adjusted
Initial Year 1 Year 2 Year 3 Year 4 Year 5 Total Present value
Total costs ($162,892) ($1,125) ($28,595) ($29,603) ($30,660) ($31,771) ($284,646) ($250,457)
Total benefits $255,477 $238,313 $238,313 $238,313 $238,313 $238,313 $1,447,042 $1,158,872
Total $92,585 $237,188 $209,718 $208,710 $207,653 $206,542 $1,162,397 $908,415
ROI 363%
Running total $92,585 $329,774 $539,492 $748,202 $955,855 $1,162,397
Source: Forrester Research, Inc.
Figure 5 Financial Analysis (Risk-Adjusted)
Source: Forrester Research, Inc.
-$400,000
-$200,000
$0
$200,000
$400,000
$600,000
$800,000
$1,000,000
$1,200,000
$1,400,000
Initial Year 1 Year 2 Year 3 Year 4 Year 5
Total costs Total benefits Running total
Forrester Consulting
The Total Economic Impact Of IBM’s Worklight Platform
Page 17
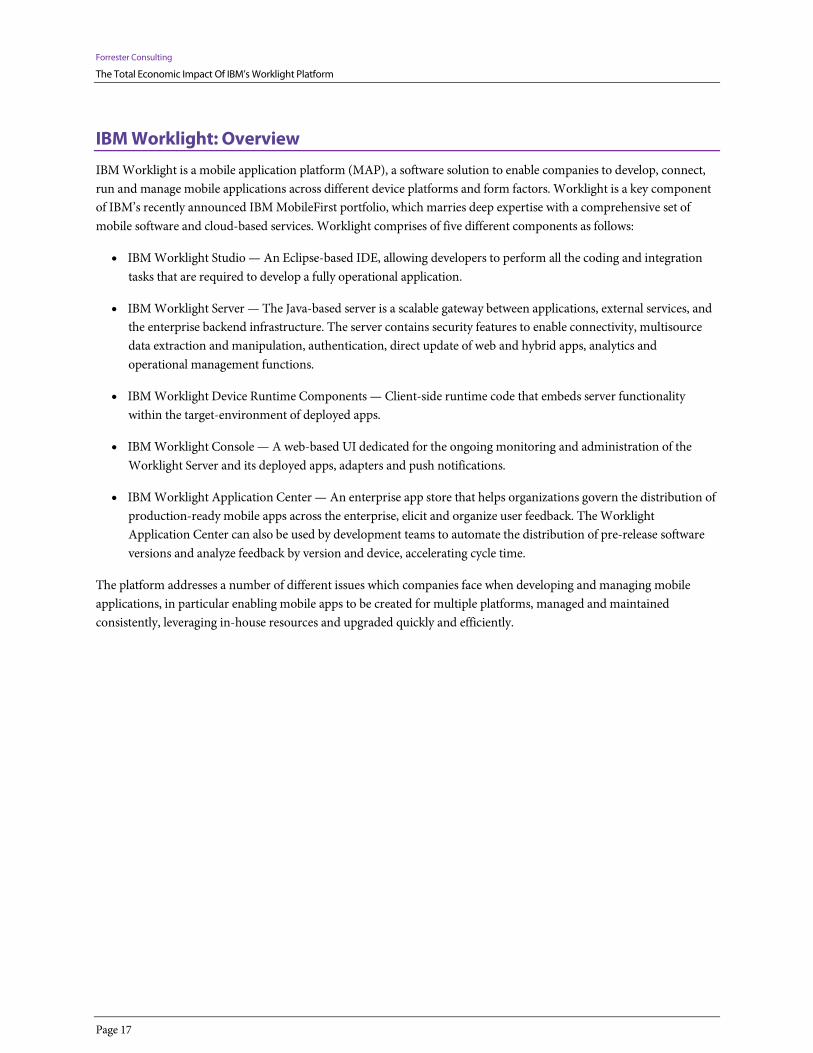
IBM Worklight: Overview
IBM Worklight is a mobile application platform (MAP), a software solution to enable companies to develop, connect, run and manage mobile applications across different device platforms and form factors. Worklight is a key component of IBM’s recently announced IBM MobileFirst portfolio, which marries deep expertise with a comprehensive set of mobile software and cloud-based services. Worklight comprises of five different components as follows:
x IBM Worklight Studio — An Eclipse-based IDE, allowing developers to perform all the coding and integration tasks that are required to develop a fully operational application.
x IBM Worklight Server — The Java-based server is a scalable gateway between applications, external services, and the enterprise backend infrastructure. The server contains security features to enable connectivity, multisource data extraction and manipulation, authentication, direct update of web and hybrid apps, analytics and operational management functions.
x IBM Worklight Device Runtime Components — Client-side runtime code that embeds server functionality within the target-environment of deployed apps.
x IBM Worklight Console — A web-based UI dedicated for the ongoing monitoring and administration of the Worklight Server and its deployed apps, adapters and push notifications.
x IBM Worklight Application Center — An enterprise app store that helps organizations govern the distribution of production-ready mobile apps across the enterprise, elicit and organize user feedback. The Worklight Application Center can also be used by development teams to automate the distribution of pre-release software versions and analyze feedback by version and device, accelerating cycle time.
The platform addresses a number of different issues which companies face when developing and managing mobile applications, in particular enabling mobile apps to be created for multiple platforms, managed and maintained consistently, leveraging in-house resources and upgraded quickly and efficiently.

Forrester Consulting
The Total Economic Impact Of IBM’s Worklight Platform
Page 18
Appendix A: Total Economic Impact™ Overview
Total Economic Impact is a methodology developed by Forrester Research that enhances a company’s technology decision-making processes and assists vendors in communicating the value proposition of their products and services to clients. The TEI methodology helps companies demonstrate, justify, and realize the tangible value of IT initiatives to both senior management and other key business stakeholders.
The TEI methodology consists of four components to evaluate investment value: benefits, costs, risks, and flexibility.
Benefits Benefits represent the value delivered to the user organization — IT and/or business units — by the proposed product or project. Often product or project justification exercises focus just on IT cost and cost reduction, leaving little room to analyze the effect of the technology on the entire organization. The TEI methodology and the resulting financial model place equal weight on the measure of benefits and the measure of costs, allowing for a full examination of the effect of the technology on the entire organization. Calculation of benefit estimates involves a clear dialogue with the user organization to understand the specific value that is created. In addition, Forrester also requires that there be a clear line of accountability established between the measurement and justification of benefit estimates after the project has been completed. This ensures that benefit estimates tie back directly to the bottom line.
Costs Costs represent the investment necessary to capture the value, or benefits, of the proposed project. IT or the business units may incur costs in the form of fully burdened labor, subcontractors, or materials. Costs consider all the investments and expenses necessary to deliver the proposed value. In addition, the cost category within TEI captures any incremental costs over the existing environment for ongoing costs associated with the solution. All costs must be tied to the benefits that are created.
Risk Risk measures the uncertainty of benefit and cost estimates contained within the investment. Uncertainty is measured in two ways: 1) the likelihood that the cost and benefit estimates will meet the original projections, and 2) the likelihood that the estimates will be measured and tracked over time. TEI applies a probability density function known as “triangular distribution” to the values entered. At minimum, three values are calculated to estimate the underlying range around each cost and benefit.
Flexibility Within the TEI methodology, direct benefits represent one part of the investment value. While direct benefits can typically be the primary way to justify a project, Forrester believes that organizations should be able to measure the strategic value of an investment. Flexibility represents the value that can be obtained for some future additional investment building on top of the initial investment already made. For instance, an investment in an enterprise wide upgrade of an office productivity suite can potentially increase standardization (to increase efficiency) and reduce licensing costs. However, an embedded collaboration feature may translate to greater worker productivity if activated. The collaboration can only be used with additional investment in training at some future point in time. However,

Forrester Consulting
The Total Economic Impact Of IBM’s Worklight Platform
Page 19
having the ability to capture that benefit has a present value that can be estimated. The flexibility component of TEI captures that value.
Appendix B: Glossary
Discount rate: The interest rate used in cash flow analysis to take into account the time value of money. Although the Federal Reserve Bank sets a discount rate, companies often set a discount rate based on their business and investment environment. Forrester assumes a yearly discount rate of 10% for this analysis. Organizations typically use discount rates between 8% and 16% based on their current environment. Readers are urged to consult their respective organization to determine the most appropriate discount rate to use in their own environment.
Net present value (NPV): The present or current value of (discounted) future net cash flows given an interest rate (the discount rate). A positive project NPV normally indicates that the investment should be made, unless other projects have higher NPVs.
Present value (PV): The present or current value of (discounted) cost and benefit estimates given at an interest rate (the discount rate). The PV of costs and benefits feed into the total net present value of cash flows.
Payback period: The breakeven point for an investment. The point in time at which net benefits (benefits minus costs) equal initial investment or cost.
Return on investment (ROI): A measure of a project’s expected return in percentage terms. ROI is calculated by dividing net benefits (benefits minus costs) by costs.
A Note On Cash Flow Tables The following is a note on the cash flow tables used in this study (see the example table below). The initial investment column contains costs incurred at “time 0” or at the beginning of Year 1. Those costs are not discounted. All other cash flows in Years 1 through 3 are discounted using the discount rate (shown in Framework Assumptions section) at the end of the year. Present value (PV) calculations are calculated for each total cost and benefit estimate. Net present value (NPV) calculations are not calculated until the summary tables and are the sum of the initial investment and the discounted cash flows in each year.
Appendix C: Endnotes
1 Forrester risk-adjusts the summary financial metrics to take into account the potential uncertainty of the cost and benefit estimates. For more information on Risk, please see page 14.