The total cost of hip-joint replacement; a model for ...
12
Journal of Public Health Medicine Vol. 18, No. 2, pp. 157-168 Printed in Great Britain The total cost of hip-joint replacement; a model for purchasers P. B. Pynsent, S. R. Carter and C. J. K. Bulstrode Summary A computer-based model is used to investigate the total cost of primary total hip-joint replacement. The model takes into account the probability of prosthesis failure, death and re-revision. The results emphasize the importance of age at insertion, demonstrating that the expected life-span of the patient has a major influence on the total cost for a given prosthesis. The discussion considers the idea of a 'lifetime care package' to encapsulate the concept of quality when considering the purchasing of total hip replacements. If it is assumed that a primary replacement episode costs £3500 and revision surgery costs twice as much, then the additional premium on the best implant currently available would be £630. The premium payable on the same patient using the worst design would be £3080. This difference reflects the importance of quality in total hip replacement surgery. Keywords: joint replacement, quality, cost, survival Introduction Total hip replacement (THR) is now a common operation, over 40000 being performed in the UK alone each year. 1 ' 2 It is most often used to relieve the pain of arthritis of the hip in the elderly. It is a dramatically successful operation, initially offering complete relief of pain and greatly increased mobility in over 99 per cent of cases. 3 The operation of THR is still relatively new 4 and the numbers being performed are still rising. Its real value in social terms is probably still not fully appreciated and each year more resources have been made available for more operations. 5 Even when the number of THRs per year reach a plateau (when the backlog is cleared and all patients developing symptoms severe enough to warrant THR do in fact receive one) the number of people with a THR in situ will continue torisefor some time 6 until, eventually, a steady state will be reached when the number of patients receiving THR equals the number dying with THR in place. Hip replacements fail after a period of time by breaking, loosening, wearing or by becoming infected. When they fail they usually become painful and sometimes unstable. Hip-joint replacements can be revised (the old one removed and a replacement fitted securely into the old bone bed) but the operation requires considerable skill and expertise, takes longer to perform than a primary THR and involves a longer stay in hospital for the patient. The overall cost of a revision is approximately twice that of a primary THR and, it should be noted, the operation competes for the same limited resources currently allocated to primary total joint replacement. Revision THRs do not last as long as primary THRs 7 and when they fail they may need to be revised again. As the number of patients with THRs in situ rises, the number failing also rises. This is creating an epidemic of patients requiring revision operations, a veritable iatrogenic tidal wave.' The size of this wave and its timing depend on several factors, in particular, the life expectancy of patients at the age they receive their first hip replacement and the longevity of the implant. There is no evidence that patients are receiving THR any younger today than they were a decade ago but patients are living longer, 5 so the number of patients 'at risk' with hips in place is rising even faster than might be predicted from the number of primary operations being performed. Some THRs appear, as a result of their design, to last longer than others by a very significant amount. 8 The skill, competence and experience of the operating surgeon may also be of great importance, but the magnitude of this effect has not yet been measured. If THRs could be designed to last longer than the life expectancy of the Royal Orthopaedic Hospital, Northfield, Birmingham B31 2AP. P. B. PYNSENT, Director of Research S. R. CARTER, Consulting Orthopaedic Surgeon Nuffield Department of Orthopaedic Surgery, John Radcliffe II Hospital, Oxford OX3 9DU. C. J. K. BULSTRODE, Clinical Reader and Consultant in Trauma and Orthopaedic Surgery Address correspondence to Dr P. B. Pynsent. © Oxford University Press 1996
Transcript of The total cost of hip-joint replacement; a model for ...
Journal of Public Health Medicine Vol. 18, No. 2, pp. 157-168Printed in Great Britain
The total cost of hip-joint replacement;a model for purchasersP. B. Pynsent, S. R. Carter and C. J. K. Bulstrode
SummaryA computer-based model is used to investigate the totalcost of primary total hip-joint replacement. The model takesinto account the probability of prosthesis failure, death andre-revision. The results emphasize the importance of age atinsertion, demonstrating that the expected life-span of thepatient has a major influence on the total cost for a givenprosthesis. The discussion considers the idea of a 'lifetimecare package' to encapsulate the concept of quality whenconsidering the purchasing of total hip replacements. If it isassumed that a primary replacement episode costs £3500and revision surgery costs twice as much, then theadditional premium on the best implant currently availablewould be £630. The premium payable on the same patientusing the worst design would be £3080. This differencereflects the importance of quality in total hip replacementsurgery.
Keywords: joint replacement, quality, cost, survival
Introduction
Total hip replacement (THR) is now a commonoperation, over 40000 being performed in the UKalone each year.1'2 It is most often used to relieve thepain of arthritis of the hip in the elderly. It is adramatically successful operation, initially offeringcomplete relief of pain and greatly increased mobilityin over 99 per cent of cases.3
The operation of THR is still relatively new4 and thenumbers being performed are still rising. Its real valuein social terms is probably still not fully appreciatedand each year more resources have been made availablefor more operations.5 Even when the number of THRsper year reach a plateau (when the backlog is clearedand all patients developing symptoms severe enough towarrant THR do in fact receive one) the number ofpeople with a THR in situ will continue to rise for sometime6 until, eventually, a steady state will be reachedwhen the number of patients receiving THR equals thenumber dying with THR in place.
Hip replacements fail after a period of time bybreaking, loosening, wearing or by becoming infected.
When they fail they usually become painful andsometimes unstable. Hip-joint replacements can berevised (the old one removed and a replacement fittedsecurely into the old bone bed) but the operationrequires considerable skill and expertise, takes longer toperform than a primary THR and involves a longerstay in hospital for the patient. The overall cost of arevision is approximately twice that of a primary THRand, it should be noted, the operation competes for thesame limited resources currently allocated to primarytotal joint replacement. Revision THRs do not last aslong as primary THRs7 and when they fail they mayneed to be revised again. As the number of patients withTHRs in situ rises, the number failing also rises. This iscreating an epidemic of patients requiring revisionoperations, a veritable iatrogenic tidal wave.' The sizeof this wave and its timing depend on several factors, inparticular, the life expectancy of patients at the age theyreceive their first hip replacement and the longevity ofthe implant. There is no evidence that patients arereceiving THR any younger today than they were adecade ago but patients are living longer,5 so thenumber of patients 'at risk' with hips in place is risingeven faster than might be predicted from the number ofprimary operations being performed. Some THRsappear, as a result of their design, to last longer thanothers by a very significant amount.8 The skill,competence and experience of the operating surgeonmay also be of great importance, but the magnitude ofthis effect has not yet been measured. If THRs could bedesigned to last longer than the life expectancy of the
Royal Orthopaedic Hospital, Northfield, Birmingham B31 2AP.P. B. PYNSENT, Director of ResearchS. R. CARTER, Consulting Orthopaedic SurgeonNuffield Department of Orthopaedic Surgery, John Radcliffe IIHospital, Oxford OX3 9DU.C. J. K. BULSTRODE, Clinical Reader and Consultant in Traumaand Orthopaedic Surgery
Address correspondence to Dr P. B. Pynsent.
© Oxford University Press 1996
158 JOURNAL OF PUBLIC HEALTH MEDICINE
Crossboundary
flow
A
Arthritichips
Death
itic if1
Primary hipreplacement
IOther
Crossboundary
flow
ADeath
1Revised hipreplacement
Other
FIGURE 1 Schematic diagram illustrating the possible consequences of hip replacement. The outer (dashed) box represents afinite population such as that cared for by a purchasing authority.
patients receiving them, revision operations would notbe required, apart from the occasional accident, whenan implant is broken by a fall or when infection occurs.The shorter the life expectancy of any THR design inrelation to the longevity of patients receiving it, thegreater the number of patients likely to require revisionTHRs in the future.
In the purchaser-provider environment it is clearlyadvantageous for the purchaser as well as the patientsrepresented by that purchaser to obtain total hipreplacements from a unit which provides hips whichlast as long as possible. Every revision which mustsubsequently be purchased when a primary THR hasfailed is, in effect, the purchaser paying a second time totreat the same condition. There are also costs to thepatient in terms of the distress and pain.
Information on the longevity of many implants is notavailable to purchasers and therefore, at the moment,they can only buy on price and not quality. Theinformation required can in fact only be obtained byproviders and then only after considerable effort, usingclinical audit.
If purchasers decided to buy not just a simple totalhip replacement, but a care package for that hip for therest of the patient's life, the price agreed would have totake account of the chance of the hip failing in thelifetime of the patient. The less the chance of a revisionbeing required, that is, the longer the primary hip lasts,the lower the price which could be quoted would be.This paper explores this model (Fig. 1) using informa-tion already known about the survival of differentdesigns of implant. It attempts to show that the issue ofquality (as measured by the longevity of the implant)has a profound effect on price and could be used to
make purchasing decisions mainly on quality ratherthan simple cost.
Material and methods
The model was developed and tested using the 'Cprogramming language. The program uses a simpleiterative loop to solve this time-dependent problem. Amore formal explanation of the actual calculation maybe found in the Appendix.
Failure rate of the primary replacementThe basis for modelling the failure of the primaryarthroplasty is the authors' own experience withsurvival analysis of Charnley prostheses inserted overthe last 25 years9 and McKee-Farrar prosthesesinserted over the period 1965-197310 (Fig. 2a). Thedata from Ref. 8 have been used to model a hipprosthesis with a poor outcome, namely the Christiansenarthroplasty. The latter prosthesis was commonly usedin Sweden during the period 1967-1987, with resultsthat showed a 62 per cent failure within 10 years ofinsertion.
It should be noted that the survival curve usuallyused in descriptions of replacement surgery represents acumulative probability." For the purposes of thismodel, the probability of failure each individual year,given an arthroplasty survives to a particular year, isrequired (Fig. 2b). In the case of the Christiansenresults, these probabilities have been derived from thesurvival curve published in Ref. 8.

TOTAL COST OF HIP-JOINT REPLACEMENT 159
0 .3 •
0 . 2 • •
0.1 • •
0
Charnley
Christiansen
McKee-Farrar
Extrap. Christiansen
10
Years
12 14 16 18 20
0.45
0.40- •
0.35--
0.30- •
60
11 0 . 2 5 -
I °-2°-"I
0 . 1 5 -
0.10- •
0.05- •
(b)
-O- Charnley- • - Christiansen-o- McKee- • - Extrap. Christiansen
FIGURE 2 (a) Curves representing the cumulative survival data for a variety of hip prostheses. These data are from Carteret a/.,9 August et a/.10 and Ahnfelt et a/.8 for the Charnley, McKee-Farrar and Christiansen prostheses, respectively. Thesurvival data-points are estimated over a period of one year; the time axis represents the end-time of this period. (Note thatthe Christiansen data have been extrapolated from the eleventh to the twentieth year.) (b) The corresponding proportion
of failures in any given year.

160 JOURNAL OF PUBLIC HEALTH MEDICINE
15000 j
14000
13000
12000 •
a 11000
jg IOOOO3
ft 9000
g 8000
| 7000
g_ 6000
•f 5 0 0 °Q 4000
3000
2000
1000
44 46 48 50 52 54 56 58 60 62 64 66 68 70 72 74 76 78 80 82 84
Age (years)
FIGURE 3 Death rates for the population of England and Wales (data supplied by the Office of Population Censuses andSurveys).
— Mean-•- Males-o- Females
Mortality rate
The predicted death rates are based on data kindlysupplied by the Office of Population Censuses andSurveys for England and Wales. The probability ofdeath at a given age for males and females is shown inFig. 3. For simplicity, the sexes are not distinguishedin the model and a mean rate is used.
Some patients have bilateral joint replacements; onaverage, 30 per cent of the populations studied hadbilateral replacements, thus the mortality rate ismultiplied by 1-2 to obtain the number of prosthesesremoved from each pool as a result of patientmortality.
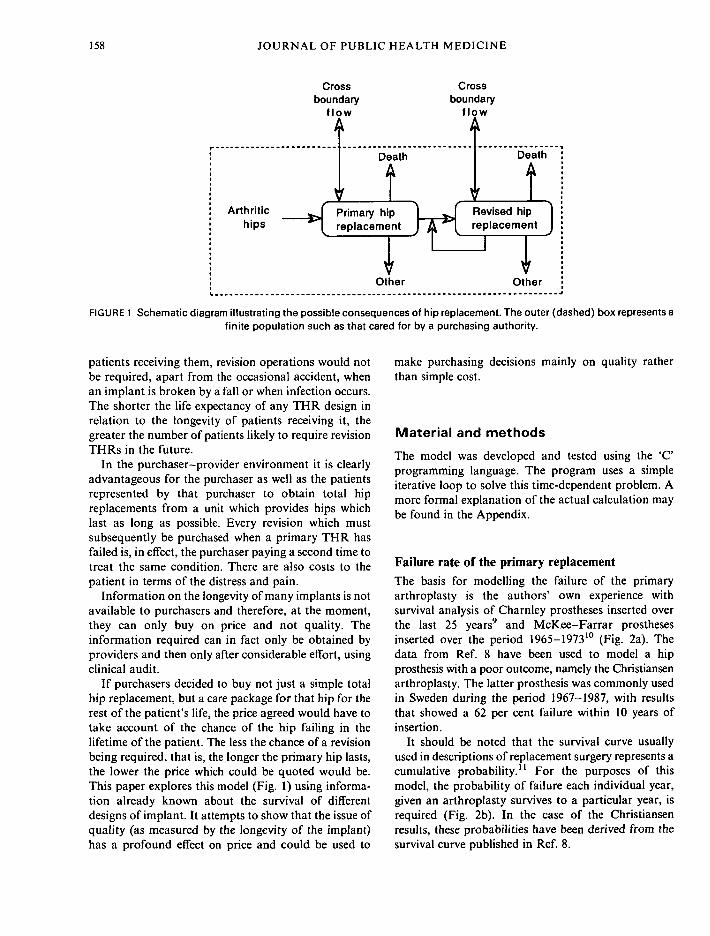
Failure rate for revision surgeryThere is far less published literature on the failure ratesof revision surgery than for primary arthroplasty.Kavanagh and Fitzgerald12 emphasized that four anda half years after revision 45 per cent of patients showevidence of radiographic loosening. Sources consultedfor survival data on revision surgery are summarized inFig. 4. For the model, the re-revision rate is assumed to
be constant with time and with the degree of re-revision(i.e. secondary, tertiary, etc.).
Summary of assumptions
The model has the following known assumptions:(1) A mean death rate from both sexes is used.(2) The sex of the patient does not affect outcome.(3) The re-revision rate is constant.(4) The patient's age at primary insertion does not
affect the failure rate.(5) Cross-boundary outflow is assumed to match
inflow.(6) The Christiansen data have been extrapolated to
20 years.(7) The values for probability of death have been
extrapolated from 86 to 90 years.
Results
The results presented below investigate the effects ofvarying the time-dependent parameters on the finalnumber of revisions.
TOTAL COST OF HIP-JOINT REPLACEMENT 161
0.95
0.9
0.85
S•| 0.8
cg0.75
0.7
0.65
0.6
0.55
0.5
^ * Broughton
o * —Repten x .
- o - k = 0.98
- • - k = 0.99
- * - Kershaw
-*- k = 0.95
« Others
- • - Patterson
—— Marti era/.
1 1 1 1 1 1
V^___^_^ Engelbrecht
Kavanagh
» s . Pellicci
\ -
1 1 1
- Schiiller *~~~ •
6
Years
10 11 12
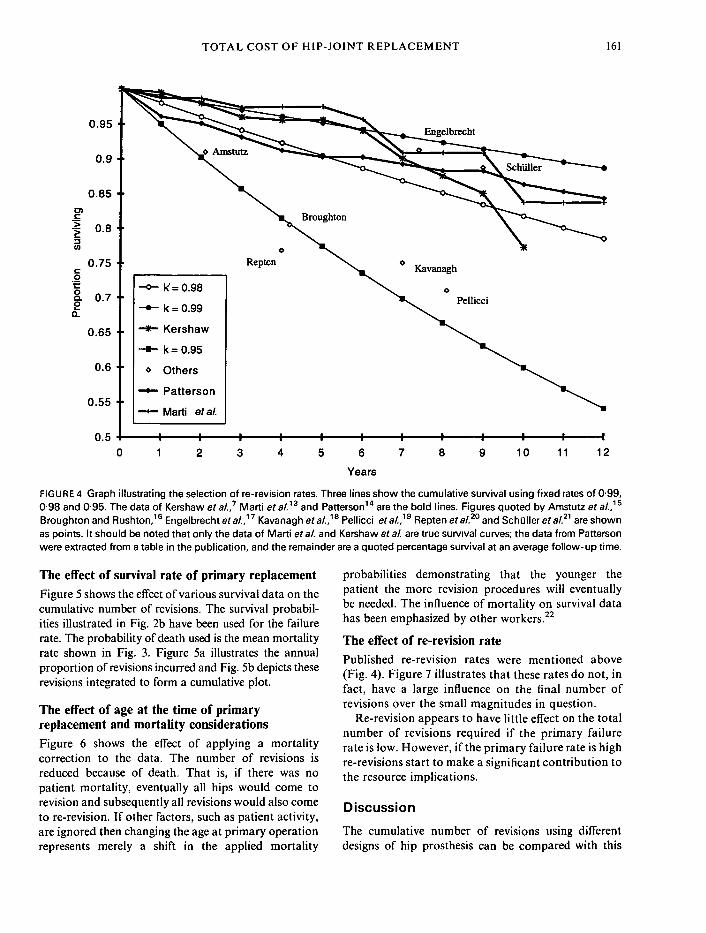
FIGURE 4 Graph illustrating the selection of re-revision rates. Three lines show the cumulative survival using fixed rates of 0-99,0-98 and 0-95. The data of Kershaw et al? Marti et alP and Patterson14 are the bold lines. Figures quoted by Amstutz et a/.,15
Broughton and Rushton,16 Engelbrecht era/.,17 Kavanagh eta/.,'18 Pellicci eta/.,19 Repten et al.20 and Schuller et al." are shownas points. It should be noted that only the data of Marti et al. and Kershaw era/, are true survival curves; the data from Pattersonwere extracted from a table in the publication, and the remainder are a quoted percentage survival at an average follow-up time.
The effect of survival rate of primary replacement
Figure 5 shows the effect of various survival data on thecumulative number of revisions. The survival probabil-ities illustrated in Fig. 2b have been used for the failurerate. The probability of death used is the mean mortalityrate shown in Fig. 3. Figure 5a illustrates the annualproportion of revisions incurred and Fig. 5b depicts theserevisions integrated to form a cumulative plot.
The effect of age at the time of primaryreplacement and mortality considerationsFigure 6 shows the effect of applying a mortalitycorrection to the data. The number of revisions isreduced because of death. That is, if there was nopatient mortality, eventually all hips would come torevision and subsequently all revisions would also cometo re-revision. If other factors, such as patient activity,are ignored then changing the age at primary operationrepresents merely a shift in the applied mortality
probabilities demonstrating that the younger thepatient the more revision procedures will eventuallybe needed. The influence of mortality on survival datahas been emphasized by other workers.22
The effect of re-revision ratePublished re-revision rates were mentioned above(Fig. 4). Figure 7 illustrates that these rates do not, infact, have a large influence on the final number ofrevisions over the small magnitudes in question.
Re-revision appears to have little effect on the totalnumber of revisions required if the primary failurerate is low. However, if the primary failure rate is highre-revisions start to make a significant contribution tothe resource implications.
Discussion
The cumulative number of revisions using differentdesigns of hip prosthesis can be compared with this

162 JOURNAL OF PUBLIC HEALTH MEDICINE
0.1 n (a)
0.08
1 0.06
0.04
0.02
l\ ! j
i
II
: •::: •
:
: •
:
: ;
: ;
1 ;
!' i• i
1 1 •
1 1J 1 •:
::
• 1: 1:: 1: 1
2 3 4 5 6 7 8 9 10 11 12 13 14 15 16 17 18 19 20
Years
0.8
0.7
0.4
0.1
(b)
oc
CharnteyMcKeeChristiansen
6 8 10 12 14 16 18 20Years
FIGURE 5 (a) The modelled proportion of revisions with a primary insertion age of 60 years and a re-revision rate of 002 peryear. Thus if 100 primary hips were inserted at time zero, the number of revisions would be obtained by multiplying the values
on the ordinate axis by 100. (b) The same data plotted in a cumulative form.
model. Comparative data and cost benefits of THRshave been modelled by other groups;23"25 however,specific data from the UK are not known to have beenmodelled. It is estimated that at least 40000 primaryhip prostheses are being inserted annually in England
alone.2 Although more THRs are being performed eachyear,2 it does seem that there is a trend to insertproportionally more into the older age group (Fig. 8)thus reducing the risk of revision (Fig. 6) but increasingthe morbidity.24 If, for example, the age-related data of

TOTAL COST OF HIP-JOINT REPLACEMENT 163
0.25
0.2 •
0.15'
Isa.
0.1
No correctionAge 50 yrsAge 60 yrsAge 70 yrsAge 80 yrs
10 12 14 16 18 20
FIGURE 6 The effect of changing the age of insertion using the Charnley data and a re-revision rate of 002 year per year.
Ref. 2 are used, then the expected number of revisionsat 10 and 20 years can be predicted from the model(Table 1). It should be borne in mind that these resultsrepresent an underestimate, as the mean death rate for
both sexes has been used, whereas, in reality, womenhave more THRs than men. It is not clear whether thisis merely because they live longer or because they havea greater susceptibility to osteoarthritis than men.
73
Iaao1II1
0.2 T
0.15- •
0.05-
0 2 4 6 8 10 12
Years
FIGURE 7 The effect of changing the re-revision rate (per years) using the Charnley data and an age of insertion of 60 years.

164 JOURNAL OF PUBLIC HEALTH MEDICINE
50
4 5 •
40 •
35 •
15
10
Williams et a\.
McKee
Charnley
24 26 28 30 32 34 36 38 40 42 44 46 48 50 52 54 56 58 60 62 64 66 68 70 72 74 76 78 80 82 84 86 88 90 92 94 96
Age group mid point (yrs)
FIGURE 8 The reported age of insertion of primary THRs. The McKee-Farrar and Charnley data relate to operations over 20years up to 1980s; the data from Williams et al.2 are for 1989-1990.
TABLE 1 The application of the model to the age-related data of Williams el al?
Age group
< 4 545-5455-6465-7475-84> 8 4Total
No. of hips
86617645208961394772768
29696
Charnley
10 yr
71141387607409
01614
20 yr
176331794962409
02672
McKee
10yr
88177494809603
02171
20 yr
636112923912173
6030
6933
Christiansen
10yr
340675
183828291801
07483
20 yr
8901663395847011801
013011
The columns indicate the number of revision procedures that may be expected in 10 and 20 years using the survival data forthree different prostheses used at the time of primary THR. Death rates beyond the age of 90 years are not considered, thusonly the first 10 years are used for the 75-84 age group. All those over 84 years are assumed to die before revision.

TOTAL COST OF HIP-JOINT REPLACEMENT 165
401840 1850 18*0 1970 1980 1990
FIGURE 9 The average life expectancy (in England and Wales), according to figures supplied by the Office of PopulationCensuses and Surveys. (Note that life expectancy has increased by two years over the last 10 years.)
Although the possibility of failure is always aconcern to both the surgeon and patient, it is felt thatthe long-term financial consequences beyond the initialcost of the primary procedure have not been previouslyappreciated. The financial costs of a potential cascadeof revision surgery are considerable. One of the factorsthat affect the final cost of hip replacement is the knownsurvival of the implant. Many orthopaedic surgeons areinterested to try new techniques and thus implants
which do not have the benefit of long-term reviews andare of unknown durability. Such implants may be moresuccessful than the current best available implant;certainly this is what the manufacturers would have usbelieve. In fact, many implants have been introducedonto the market only to be withdrawn as it has becomeapparent that they do not have sufficiently goodsurvival to compete with established designs.
A primary hip replacement may be financed as a
TABLE 2 The percentage premium which would have to be added to the primary cost of a THR assuming that a revision THRcosts twice as much as a primary THR; the data are calculated from the 20 year revision figures
Age groups (yr)
< 4 545-5455-6465-7475-84> 8 4AverageAverage excluding under 45 yr
Charnley (%)
4137312090
2319
McKee (%)
1471289245130
7156
Christiansen (%)
20518815298380
11495

166 JOURNAL OF PUBLIC HEALTH MEDICINE
result of a contract between purchaser and provider.The subsequent revisions may well be the subject of asecond contract. Financial provision for the costssubsequent upon a primary hip replacement shouldbe considered at the time of initial referral. Analternative to the purchaser entering a second con-tract would be for the provider to issue a warrantywith the primary arthroplasty contract for the life ofthe patient. If 5 per cent of all primary hiparthroplasties eventually require revision surgery,perhaps 5 per cent of the cost of the revision surgeryshould be included as a premium in the cost of theprimary contract. Thus the total cost of the initialcontract would reflect the success of hip arthroplastiesat that institution. The purchaser could thereforecompare the results of differing surgical techniquesand the use of different prosthetic designs beforeagreeing the initial arthroplasty contract. This wouldintroduce a 'premium on quality' in the purchaser-provider costing process.
This scheme does have the drawback of limiting theuse of prosthetic designs to those with establishedsurvival studies. Currently, newly introduced prostheses,which are therefore experimental in terms of theirsurvival, with unknown financial implications, arefinanced by the purchaser. The use of such implantsshould not be withdrawn, but perhaps the possibleconsequences of untried designs should be made knownto both the patient and the purchaser, with either themanufacturer or the institution performing the arthro-plasty agreeing to fund any excess expenditure beyondthat expected for an established prosthesis. In thesecircumstances, the financial consequences of such surgeryshould be defined and perhaps funded by the provider,the manufacturer and research funding bodies. It wouldbe the responsibility of the institution and financiers toensure that a proper trial was established using reliablemeasures to assess the outcome of the treatment.26
All orthopaedic units would also want up-to-dateinformation on survival of implants, and it would thusbe in everyone's interest to contribute to a nationalregister where each unit alone would know how welltheir implants were surviving. Hence a useful side-effectof a lifetime care package would be a national registerset up by the NHS trusts.
The use of hip arthroplasties in a fitter populationwith an increasing life expectancy (Fig. 8) will havelarge financial consequences in the future. Seriousconsideration should be given to the choice of implantand techniques used.27"29 A successful joint replace-ment is one in which the patient dies with the originalprosthesis in situ. Patients with a long life expectancymay outlive their prosthesis and be condemned to aprocess of possibly recurring revision surgery. It is
suggested that the purchaser could ensure reliablesurgical techniques and appropriate implant designsare used by demanding a lifetime guarantee with thepurchase. The provider would underwrite the guaran-tee by incorporating a proportion of the cost of revisionin the contract for the primary surgery.
If it is assumed that, on average, revision surgerycosts twice as much as primary surgery, then theadditional cost per primary episode can be calculated(Table 2). This shows that for the younger patients (lessthan 45 years) the premium is 41 per cent for Charnleyprosthesis and a staggering 205 per cent for one withthe predicted Christiansen rate of failure. If, on theother hand, a general premium is to be charged for a'lifetime care package', then the same calculation can bedone on the total figures from Table 1. Thus for aCharnley prosthesis after 20 years, 2672 (9 per cent)revision episodes will have occurred in the populationof 29 696 primary replacements. Similarly, in the case ofthe McKee-Farrar and Christiansen-like prosthesesthe values are 23 per cent and 44 per cent, respectively.Currently, the cost of a primary hip procedure carriedout in an NHS hospital in the UK is approximately£3500. At this price for the 'lifetime care package',£4130 should be charged for hip replacement surgerythat uses a prosthesis with the properties of theCharnley design whereas £6580 would need to becharged for the package if a prosthesis followed theChristiansen survival pattern.
Summary
If, when negotiating contracts between purchasers andproviders, a price for a 'lifetime care package' for thehip replacement was calculated, rather than a singleone-off price for the primary replacement, the followingadvantages would result:
(1) The quality of the primary operation (asmeasured in how long the hip would last) would bereflected in the price quoted.
(2) There would also be a strong incentive forproviders to monitor survival of implants within theirown unit to ensure that their figures were as good as, orbetter than, generally published figures so that theycould remain competitive.
(3) The purchaser should demand accurate informa-tion about the survival of the implant so that thepurchase price of the entire package is clearly defined atthe time of the initial contract.
(4) There would be a strong disincentive to publishover-optimistic results, which, although they mightmake the implant or unit appear good, would producepricing levels that would be out of balance with theactual costs incurred by the lifetime package.

TOTAL COST OF HIP-JOINT REPLACEMENT 167
(5) Using current figures for three implants, thepremium payable on quality would vary from 18 per centto 88 per cent of the quoted cost of the primary surgery.In young patients the premium would be between 41 percent and 205 per cent.
References1 Bulstrode CJK. Keeping up with orthopaedic epidemics.
Br MedJ 1987; 295: 514.2 Williams M, Frankel S, Nanchahal K, Coast J, Donovan J.
Total hip replacement DHA Project: research pro-gramme epidemiologically based needs assessment. In:Health Care Evaluation Unit, University of Bristol.Leeds: DHA, 1993.
3 Charnley J. Low Friction Arthroplasty. Theory and Practice.Berlin: Springer, 1979.
4 Charnley J. The long term results of total hip replacementperformed as a primary intervention. J Bone Joint Surg[Br] 1972; 54-B: 61-76.
5 Seagroatt V, Tan HS, Goldacre M, el at. Elective total hipreplacement: incidence, emergency readmission rate,and post-operative mortality. Br Med J 1991; 303:1431-1435.
6 Bulstrode CJK, Carr A, Murray D. Prediction of futureworkload in total joint replacement. In: Wallace W, ed.Joint replacement in the 1990s. Clinical studies, financialimplications and marketing approaches. Nottingham:Institute of Mechanical Engineers. Bury St Edmunds:Mechanical Engineering Publications, 1992: 25-27.
7 Kershaw CJ, Atkins R M , Dodd C A F , Bulstrode CJK.Revision total hip arthroplasty for aseptic failure. Areview of 276 cases. J Bone Joint Surg [Br] 1991; 73-B:564-565.
8 Ahnfelt L, Herbert SP, Malchua H, Andersson GBJ.Prognosis of total hip replacement. A Swedish multi-centre study of 4664 revisions. Ada Orthop Scand Suppl1990; 61: 1-26.
9 Carter SR, Pynsent PB, McMinn DWJ. Greater than tenyear survivorship of Charnley low friction arthroplasty.J Bone Joint Surg [Br] 1991; 73-B(Suppl 1): 71.
10 August AC, Aldam CH, Pynsent PB. The McKee-Far ra rhip arthroplasty, a long term study. J Bone Joint Surg[Br] 1986; 68-B: 520-527.
11 Carr AJ, Morris RW, Murray DW, Pynsent PB. Survivalanalysis in joint replacement surgery. J Bone Joint Surg[Br] 1993; 75-B: 178-182.
12 Kavanagh BF, Fitzgerald RHJ . Multiple revisions forfailed total hip arthroplasty not associated with infection.J Bone Joint Surg [Am] 1987; 69-A: 1144-1149.
13 Mart i RK, Schuller H M , Besselar PP, Haasnoot ELV.Results of revision of hip arthroplasty with cement.J Bone Joint Surg [Am] 1990; 72-A: 346-354.
14 Patterson M. Ring uncemented hip replacements: theresults of revision. J Bone Joint Surg [Br] 1987; 69-B:374-380.
15 Amstutz H, Ma SM, Jinah RH, Mai L. Revision of asepticloose total hip arthroplasties. Clin Orth 1982; 170:21-33.
16 Broughton N , Rushton N. Revision hip arthroplasty. AdaOrthop Scand 1982; 53: 923-928.
17 Engelbrecht DJ , Weber FA, Sweet MBE, Jakim I. Longterm results of revision total hip arthroplasty. J BoneJoint Surg [Br] 1990; 72-B: 41 -45 .
18 Kavanagh BF, Ilstrup D M , Fitzgerald RHJ. Revision totalhip arthroplasty. J Bone Joint Surg [Am] 1985; 67-A:517-526.
19 Pellicci PM, Wilson PDJ, Sledge CB, et al. Long termresults of revision total hip arthroplasty. A follow-upreport. J Bone Joint Surg [Am] 1985; 67-A: 513-516.
20 Repten JB, Varmarken JE, Siitrup J, et al. Clinical resultsafter revision total hip replacement and primary total hipreplacement. Ada Orthop Scand 1988; 59(Suppl 227):37-38.
21 Schuller H M , Marti RK, Besselaar PP. Aseptic failure inrevision hip replacement. Ada Orthop Scand 1988;59(Suppl 227): 34-35 .
22 Verheul H A , Dekker E, Bossuyt P, Moulijn A C , Dunn ingAJ. Background mortality in clinical survival studies.Lancet 1993; 341: 872-875.
23 Morscher E, Schmassmann A. Failures of total hiparthroplasty and probable incidence of revision surgeryin the future. Arch Orthop Trauma Surg 1983; 10: 137-143.
24 Jacobsson S-A, Rehnberg C, Djerf K. Risks, benefits andeconomic consequences of total hip ar throplasty in anaged populat ion. Scand. J Soc Med 1991; 19: 7 2 - 7 8 .
25 Daellenbach H G , Gillespie WJ, Crosbie P, DaellenbachUS. Economic appraisal of new technology in theabsence of survival data - the case of total hipreplacement. Social Sci Med 1990; 31: 1287-1293.
26 Mur ray D W . The hip. In: Pynsent PB, Fai rbank J C T , Car rAJ , eds. Outcome measures in orthopaedics. Oxford:Butterworth Heinemann, 1993.
27 Villars R. Failed hip replacements (editorial). Br Med J1992; 304: 3 - 4 .
28 Treacy R, Car ter SR, Grigoris P, Pynsent PB. Failed hipreplacements (letter). Br MedJ 1992; 304: 317.
29 Bulstrode C, Mur ray D , Carr AJ, Pynsent PB, Car te r SR.Designer hips. Br MedJ 1993; 306: 732-733.
Accepted on 7 November 1995
Appendix
We consider the model to be in two parts: Stage 1, thechanges to the population of primary hips; Stage 2, thechanges to the revised population. It would, of course, be
Alive unrevised (Au. ) •
probability ofdeath (pj.)probability ofrevision (pr)
Alive unrevised (Au.)
Alive revised (Ar.)
Dead unrevised (Du.)
Dead revised (Dr.)
FIGURE A1

168 JOURNAL OF PUBLIC HEALTH MEDICINE
Alive revised -
probability ofdeathprobability ofre-revision
Alive revisedAlive re-revisedDead revisedDead re-revised
FIGURE A2
possible to have additional stages reflecting secondary,tertiary, etc. revisions; however, as no data are availableon the survival, it is assumed the probabilities are thesame for all re-revisions.
Stage 1Figure Al summarizes the stochastic process applied tothe primary-hip population.
We let Au,_] be the number of hips alive andunrevised at the start of an interval i; then AUi is thenumber of hips alive and unrevised at the end of theinterval i [that is, at the start of the next (/+1)interval]. DUi is the number of hips unrevised butdead at the end of interval /, Z)r_ the number of hipsrevised but dead at the end of interval i, pr< theprobability of revision during interval /', pdi theprobability of death at the age in interval /. Forconvenience, we let Tdj and Ta> denote the totalnumber of hips dead and total alive, respectively, atthe end of the interval i; thus,
4., . , = Td, + Ta,
Then the outcome of the AUil hips during interval /' isas follows:
Td, = Au,.s x Pd,
We assume that of those hips who die in the rth intervalonly half will be exposed to the risk of failure; thus
A-, = Tdi x pr. x 0-5
and therefore
Now,
Du, = Tdi - Dri
Ta, = AUil — Tdi
\ = Tai x pr<
4 — T — Ait, — * a, r,
where AFi represents the number of hips alive andrevised at the end of interval /.
Stage 2This stage has exactly the same form of stochasticmodel but with the probabilities adjusted for the re-revision situation (see Fig. A2).
The situation is more complicated, from a computa-tional point of view, when dealing with this stage. Asthe probabilities are time dependent, for each iterationwhere a re-revision occurs a new iteration must bestarted, and from within this new iteration for everyre-revision that occurs a further sequence of iterationsmust be started again. This type of problem isresolved computationally by recursive calls to theStage 2 calculations.