THE TECHNICAL AND FINANCIAL ADVANTAGES OF USING U.S ...
12
THE TECHNICAL AND FINANCIAL ADVANTAGES OF USING U.S. COTTON RICH YARNS IN KNITTED FABRIC AND GARMENT MANUFACTURING TO LEARN MORE, PLEASE CONTACT YOUR LOCAL CCI REPRESENTATIVE. CLICK HERE TO VIEW THE LIST OF REPRESENTATIVES BY REGION.
Transcript of THE TECHNICAL AND FINANCIAL ADVANTAGES OF USING U.S ...

THE TECHNICAL AND FINANCIAL ADVANTAGES OF USING U.S. COTTON RICH YARNS IN KNITTED FABRIC AND GARMENT MANUFACTURING
TO LEARN MORE, PLEASE CONTACT YOUR LOCAL CCI REPRESENTATIVE. CLICK HERE TO VIEW THE LIST OF REPRESENTATIVES BY REGION.

In the spring of 2017, Cotton Council International (CCI) commissioned an independent study to compare the use of cotton rich yarns spun from cottons grown in India, the CIS and the United States in the manufacture of knitted fabric and garments. The research demonstrates that U.S. cotton outperforms competitors at every stage of the yarn manufacturing (spinning) process, highlighting the potential financial damage of purchasing cotton solely on price.
Breakthrough studies like these are critical for the continued success of mills and manufacturers, whether they result in new practices that are cost effective, time- or resource-saving, or that improve quality and processing. This is why we developed COTTON USA SOLUTIONS®, a multi-program consultancy that is complimentary for licensees with a U.S. Cotton Trust Protocol® membership. With COTTON USA SOLUTIONS®, mills and manufacturers can utilize our global network of experts and big data to take their business to the next level through on-site consultations, technical seminars, mill studies and more.
At the request of CCI, the consultants selected for the project (TriBlend Consultants based in Charlotte, North Carolina) focused the study in Bangladesh. All the cotton fiber used in Bangladesh is imported - there is no indigenous cotton crop grown in the country. At the time of the study, Indian cotton was probably the fiber of choice in the country, with a market share of just over 50 percent. This predominance was based primarily on the geographical proximity of India to Bangladesh and an historical price advantage enjoyed by Indian cotton over U.S. Upland cottons in that country. Based on the already known fact that U.S. cotton normally performed very well during manufacturing, the hope was that the study could be used to educate local mills that buying cotton based primarily on price would prove to be a mistake.
The consultants chose as their partner for the project a well-established, vertical textile manufacturer that was a leader in the field of knitted garments and was already a supplier to many of the major brands and retailers in Europe and North America and was familiar with the high standards of quality and on-time delivery demanded by those customers.

The garment chosen for comparison in the study was a circular knitted polo shirt, knitted with a 100% cotton, carded ring spun yarn in the yarn count Ne 30/1. The partner mill purchased the three cottons to be compared in the study from their normal sources with a particular emphasis on trying to ensure that the fiber characteristics and properties of the three fibers not only were as equal as possible but also met their normal quality standards for a 30’s single, carded yarn to be knitted for the chosen end product.
To minimize potential other variables that could be introduced during the manufacturing process, the same machines, machine settings, speed, operating procedures, dyestuff recipes, etc. were used to process each of the three different fibers at every stage in manufacturing. The consultants who carried out the project spent nine weeks living in the mill’s guesthouse so that they could personally monitor and control each stage of the process.

Any decisions required with regard to both fabric and garment quality during the study, such as “seconds” and reject levels, were made solely by the mill management based on their own standards and knowledge of their customers.
The yarns produced during the study were tested in both the mill’s own testing laboratory and in an independent testing facility in the United States. In both cases, the results showed that the yarn spun from U.S. cotton had marginally more minor imperfections and was more uneven than either the Indian or CIS yarns but performed much better during the manufacturing process. Of most significance were the yield levels during yarn manufacturing. The U.S cotton produced a waste loss from blow-room to winding of 14.63% compared to 16.96% for the Indian cotton and 13.65% for the CIS fiber. The CIS fiber performed very well in ring spinning and had less yarn breaks than the U.S. cotton with a resulting advantage of 0.36% less Pneumafil waste. The minor imperfections in the U.S. yarn referred to earlier during laboratory testing also impacted marginally in winding where the waste lost by the CIS fiber was 0.07% lower than the waste measured for the U.S. cotton yarn.
At every stage of the yarn manufacturing (spinning) process, the Indian fiber was outperformed significantly in all the key parameters by U.S. cotton.
In knitting, the procedure of using the same machine to process the yarns of all three cottons was repeated. The U.S. cotton yarn had the highest machine efficiency and the lowest frequency of yarn breaks. More importantly, the fiber loss during knitting from the U.S. yarn was significantly lower than the losses from the other fibers. The U.S yarn had a fiber loss of only 0.36% during the process compared to 0.69% for the CIS yarn and 0.99% for the Indian fiber.
The lost fibers (“fly”) generated during knitting had a significant impact not only on the frequency of machine stops, but also the position of where the stops occurred. With the Indian cotton yarn, there was a build-up of “fly” in the yarn creel that caused machine stops in the creel tension devices. All of the U.S. cotton breaks occurred in the knitting zone of the machine itself. Yarn breaks that occur in the creel take significantly longer to repair and re-thread than those that break in the knitting zone. This difference resulted in a repair time for Indian cotton yarn breaks that was 23% longer than those measured for the U.S. cotton yarn.
In Bangladesh and in many countries in the region, where the application of basic industrial engineering techniques is confined to garment manufacturing and not found in the primary textile sector, the negative impact of such factors on both machine and labour productivity and most importantly cost, are not measured or calculated.
This pattern of fiber loss during processing continued in dyeing and finishing. The knitted fabric was jet dyed in three colors: white, a light pink and a dark navy-blue. The navy-blue fabric was divided into two separate lots, one of which was enzyme treated during finishing.
After dyeing and finishing, all the four lots of fabric were inspected by the mill partner’s head of quality control with the object of marking any defects in the finished fabric to minimize fabric losses during cutting and sewing. The mill used the traditional “Four Point” system of inspection for that operation applied with the experience of the standards expected by their most critical customer, a major U.S. based, international fashion brand.

All the four lots of both the Indian and CIS cotton fabrics were quality challenged. The Indian fabrics contained an average of 2.62 defect points per kg, compared to 1.11 per kg in the CIS fabric and only 0.16 in the U.S. lots. The enzyme treated lot of dark navy-blue fully exposed the major problems of neps and “dead” cotton in both the Indian and CIS fabrics, but the real damage came from the high levels of polypropylene contamination they contained. The finished fabric knitted from the U.S. fiber was not nep free and had very faint patches of yarn irregularity (thick & thin) but the levels of both were considered by the partner’s QC chief to be acceptable for this very critical customer. All the four lots of the Indian and CIS yarn fabric were considered unacceptable for shipment to this customer. All the colors of the U.S. yarn fabric met the standards of the customer with the exception of the non-enzyme treated dark navy-blue lot. The U.S. yarn fabric was completely free of foreign fiber contamination.
In the dyeing and finishing of knitted fabric, fiber lost during the process is a key issue. For the fabric being produced in the trial, a target weight after finishing of 160 GSM was expected. A loss of 3% in the GSM during D&F would have been acceptable to the partner mill. The Indian fabric was outside this tolerance at 3.9% lost, the CIS fabric just crept inside at 2.9%. The loss in GSM after finishing for the U.S. fabric was only 0.6%.
57% CIS yarns
67%
10%
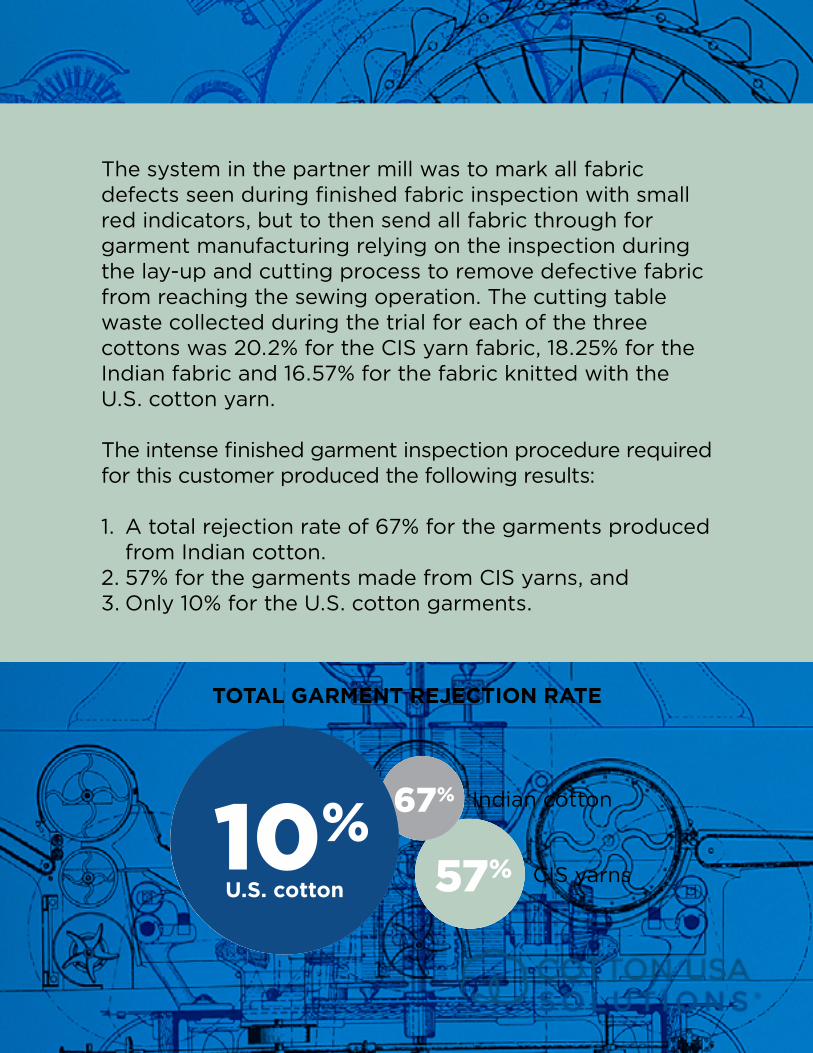
The system in the partner mill was to mark all fabric defects seen during finished fabric inspection with small red indicators, but to then send all fabric through for garment manufacturing relying on the inspection during the lay-up and cutting process to remove defective fabric from reaching the sewing operation. The cutting table waste collected during the trial for each of the three cottons was 20.2% for the CIS yarn fabric, 18.25% for the Indian fabric and 16.57% for the fabric knitted with the U.S. cotton yarn.
The intense finished garment inspection procedure required for this customer produced the following results:
1. A total rejection rate of 67% for the garments produced from Indian cotton.
2. 57% for the garments made from CIS yarns, and3. Only 10% for the U.S. cotton garments.
U.S. cotton
Indian cotton
TOTAL GARMENT REJECTION RATE
The QC head rejected seven of the nine U.S. cotton garments for oil spots and were subsequently recovered. In terms of finished garment rejection rates, the recovery operation reduced the rejection rate for the Indian cotton garments from 67% to 31%, from 57% to 37% for the CIS cotton garments and to only 2% for the U.S. cotton garments, obviously a worthwhile exercise.
On the negative side, the time spent in the recovery of the rejected garments meant that the partner mill missed the on-time delivery target specified by their U.S. customer and suffered the consequential charge-back. This charge was not included in the financial evaluations included in the study.
To evaluate the financial impact of the differing manufacturing performance of the three cottons, TriBlend used a simple methodology of calculating the “clean cost” at the exit of every process. This takes the cost of each fiber at the entry point of a process and the “value” of the fiber at the exit point, after the added cost of the fiber lost in a process is added back to the original input cost.

The partner mill had purchased the cottons used in the research from their normal merchants and had obtained the U.S. cotton at a price that did not reflect the historic relationship between it and the fibers from India and the CIS. The actual purchased price would have skewed the financial results in favor of U.S. cotton and so for the financial comparison the consultants used the average, published landed price for each fiber in Bangladesh during the first semester of 2017. These were: US$ 0.84 cents per pound for Indian cotton, US$ 0.92 cents per pound for the CIS fiber and US$ 0.87 cents per pound for U.S. cotton.
Based on the methodology described above, by the time the garments had been manufactured, U.S. cotton represented an equivalent cost of 21 cents per pound lower than initially cheaper Indian cotton. The advantage over the already more expensive CIS cotton had risen to an equivalent 31 cents per pound after garments were produced.
Without the ability to recover the previously rejected Indian and CIS garments, the equivalent price advantage of U.S. cotton over the Indian and CIS fibers would have been 37 cents per pound and 38 cents per pound respectively.
None of these figures consider the financial advantages that would result from the higher efficiency and improved operating performance attributable to U.S. cotton.
The research clearly demonstrates the potential financial damage of purchasing cotton solely on price.
COTTON USA’s team of experts has visited over one hundred mills worldwide, conducting similar research, offering our partners something that will truly elevate their business – our COTTON USA SOLUTIONS® program. Learn more here.
To contact a COTTON USA representative for more information about U.S. cotton or to become a COTTON USA licensee, click here.
CCI is an equal opportunity employer and provider.
CONCLUSION
BROUGHT TO YOU BY: