The Tax System in India: Could Reform Spur Growth? · The Tax System in India: Could Reform Spur...
24
WP/06/93 The Tax System in India: Could Reform Spur Growth? Hélène Poirson
Transcript of The Tax System in India: Could Reform Spur Growth? · The Tax System in India: Could Reform Spur...

WP/06/93
The Tax System in India: Could Reform Spur Growth?
Hélène Poirson


© 2006 International Monetary Fund WP/06/93
IMF Working Paper
Asia and Pacific Department
The Tax System in India: Could Reform Spur Growth?
Prepared by Hélène Poirson1
Authorized for distribution by Jerald Schiff
April 2006
Abstract
This Working Paper should not be reported as representing the views of the IMF. The views expressed in this Working Paper are those of the author(s) and do not necessarily represent those of the IMF or IMF policy. Working Papers describe research in progress by the author(s) and are published to elicit comments and to further debate.
This paper assesses the effects of India’s tax system on growth, through the level and productivity of private investment. Comparison of India’s indicators of effective tax rates and tax revenue productivity with other countries shows that the Indian tax system is characterized by: (1) a high dependence on indirect taxes, (2) low average effective tax rates and tax productivity, and (3) high marginal effective tax rates and large tax-induced distortions on investment and financing decisions. The paper finds that the most recently proposed package of reforms would improve tax productivity and lower the marginal tax burden and tax-induced distortions. But firms that rely on internal sources of funds or face problems borrowing would continue to face high marginal tax rates. JEL Classification Numbers: E62, H20, O40 Keywords: Growth, Tax Policy, Tax Reform Author(s) E-Mail Address: [email protected]
1 I would like to thank Mark De Broeck, Catriona Purfield, and Jerald Schiff for useful comments.

- 2 -
Contents Page I. Introduction and Overview ...........................................................................................3 II. The Indian Tax System: Stylized Facts and Issues.......................................................5 III. Priorities for Reforms .................................................................................................15 Boxes 1. Empirical Evidence on Taxation and Growth...............................................................4 2. Main Features of the Tax System (December 2005) ....................................................5 3. Kelkar 2002 Reports’ Proposals ...................................................................................7 Figures 1. India: Tax Burden, 1974/75–2004/05 ...........................................................................6 2. Selected Asian Countries: AETRs on Labor, Capital, and Consumption.....................9 Tables 1. India: Structure of General Government Tax Revenue, 2004/05 .................................6 2. Average Effective Tax Rates Comparison, 1990–2000................................................8 3a. Revenue Productivity of the Corporate Income Tax (CIT), 2001 ..............................10 3b. Revenue Productivity of the Corporate Income Tax (CIT), 2003 ..............................11 4a. Marginal Effective Tax Wedge by Investment Type..................................................13 4b. Marginal Effective Tax Wedge by Financing Source.................................................13 5. Statutory and Effective Tax Rates on Corporations ...................................................14 6. India: Tax Wedges under Current vs. Reformed Tax System ....................................17 Annexes I. Average Effective Tax Rates (AETRs) Based on Macroeconomic Data ...................18 II. Tax Parameter Data, December 2005 .........................................................................19 References...............................................................................................................................20

- 3 -
I. INTRODUCTION AND OVERVIEW
While the ratio of tax revenue to GDP in India is low by international standards, marginal rates are high. Economic theory suggests that high tax rates may depress employment, investment, and growth. The empirical evidence is mixed. Cross-country studies generally confirm the negative impact of a high tax burden on economic activity, but their results are not robust. Firm-level evidence and simulation results are more conclusive, supporting the view that high tax rates have an adverse effect on growth and distort financing and investment decisions (Box 1). High tax rates may also contribute to the growth of the “shadow economy,” carrying costs in terms of foregone tax receipts and lower productivity growth (Farrel, 2004; Schneider and Klinglmair, 2004).
To improve the tax intake and savings and investment rates, which are low by regional standards,2 a series of tax reforms have been considered in India.3 Their main thrust is to combine lower statutory rates with base broadening, to realize more revenues while lowering the marginal tax burden and removing distortions. This in turn should foster growth, leading to an “expansionary” fiscal adjustment.
This paper assesses the effects of India’s tax system on growth. Section II establishes stylized facts about the tax system: (i) a high dependence on indirect taxes, (ii) low average effective tax rates (AETRs) and tax productivity, and (iii) high marginal tax rates and tax-induced distortions on investment and financing decisions. Section III finds that the proposed tax reforms would improve tax productivity and lower the marginal tax burden and tax-induced distortions. But firms that rely on internal sources of funds or face problems borrowing would continue to face high marginal tax rates.
2 National savings during 1999–2004 in India reached 24 percent of GDP on average annually, compared to 43 percent in China, 34 percent in Malaysia, and 32 percent in Korea.
3 For a history of reforms, see Ministry of Finance (1982, 2001, and 2004), Patel (1995), Muhleisen (1998), Burgess, Howes and Stern (1997), and Shome (2004).
- 4 -
Box 1. Empirical Evidence on Taxation and Growth
High labor taxation can negatively affect employment and growth by pushing up labor costs. In the presence of strong and decentralized labor unions, labor taxes are shifted into real wages, reducing labor demand; this in turn leads to substitution away from labor and downward pressure on the marginal product of capital, reducing investment and growth. Empirical evidence for European Union (EU) countries confirms this view.1 High marginal effective tax rates (due to the combination of tax and benefit systems) can also affect labor supply decisions by affecting the choice between additional work and leisure.2
Consumption taxes should not in theory affect savings and investment decisions since future and current consumption are treated equally, and they remain neutral with respect to various sources of income. Empirical evidence is mixed, however. Some studies find that such taxes indeed have no impact on employment and growth,3 but others find that—like income taxes, although to a lesser extent—they have a negative impact on growth by distorting the choice between labor and leisure, and also could depress savings.4
Corporate taxes raise the required rate of return on investment and thereby depress investment. In addition, corporate taxes tend to favor debt over equity financing or retained earnings, potentially leading to an inefficient allocation of resources, higher insolvency risks, and discrimination against smaller companies that face more difficulties borrowing. Corporate taxes are also non-neutral given the widespread use of rebates, exemptions, and special regimes for specific sectors or regions. This also benefits large companies which can bear a lower tax burden through tax planning and fiscal engineering.5 Cross-country studies confirm a negative link between the tax burden (measured by tax revenue to GDP) and growth for high-income countries. However, the result does not hold for low- and middle-income countries, perhaps reflecting measurement problems.6 Firm-level empirical results, as well as simulation results using computable general equilibrium models, in contrast support the view that higher taxes negatively affect growth.7
Taxation of capital income—even when at a low level—appears to have a distortionary effect on savings. Cross-country studies find little evidence for EU member countries that taxes affect the aggregate level of savings, but they appear to influence its composition and location. Many EU countries tend to grant favorable treatment to specific savings instruments, such as retirement schemes and housing investment. Moreover, they generally apply a preferential treatment to non-residents, thus distorting saving flows and potentially enhancing tax evasion possibilities associated with cross-border investment.8
___________________________ 1See Daveri and Tabellini (2000). 2For example, see Organization for Economic Cooperation and Development (2001). 3See Daveri and Tabellini (2000) and Kneller, Bleaney, and Gemmel (1999). 4For example, see Milesi-Ferretti and Roubini (1995) and Tanzi and Zee (2000). 5See Rao and Lukose (2002); Organization for Economic Cooperation and Development (2001); Joumard (2002); and Nicodeme (2002). 6See Blankenau, Nicole, and Tomljanovich (2004). The marginal or effective tax rate on corporates ideally should be used. 7See Fishman and Svensson (2000) and Feltenstein and Shah (1995). 8See Organization for Economic Cooperation and Development (2001).

- 5 -
II. THE INDIAN TAX SYSTEM: STYLIZED FACTS AND ISSUES
The Tax System The authority to levy taxes in India is divided between the central government and the state governments. The central government levies direct taxes such as personal income tax (PIT) and corporate tax (CIT); indirect taxes such as customs and excise duties and a service tax; and a sales tax on inter-state transactions (CST). States levy a VAT on goods, state sales taxes, and various local taxes. As in other developing countries, tax incentives feature prominently in India, with tax holidays being the preferred form of incentives (see Flanagan, 2005). Such incentives may be important for some companies to offset other costs of doing business in India—such as still relatively high import duties, restrictive labor laws, and inadequate public infrastructure—but an unfortunate outcome has been to thin out the overall direct and indirect tax bases (Shome, 2004).
Since 1991, the tax structure has been substantially rationalized. Changes at the central government level include reducing customs and excise duties, lowering CIT rates, extending a form of VAT to some industries, and broadening the tax base to some services (Box 2). At the state level, the main reform has been the introduction in 2005 of the VAT in 24 states and union territories, after ten years of delay.
Box 2. Main Features of the Tax System, December 2005
The principal direct taxes include PIT and CIT, state taxes on agricultural income, wealth tax, and various withholding taxes. The PIT is levied on non-agricultural income at rates of 10 percent–31.5 percent. It applies to Indian residents and foreigners, on income earned in India. The exemption threshold of Rs. 111,250 (US$2,472) results in a relatively narrow tax base of about 40 million taxpayers. States levy some taxes on agricultural income (land revenue tax and agricultural income tax), but their combined incidence is considerably less than that of the PIT. A wealth tax is levied on net assets in excess of Rs. 1.5 million (US$33,333). The CIT is levied at a rate of 33.66 percent for domestic companies (including surcharges), but with significant exemptions. Other corporate taxes include a 12.75 percent tax (including surcharges) on dividend distribution, a minimum alternative tax on profits, a tax on fringe benefits, and various withholding taxes on interest, royalties, etc.
The main indirect taxes are the state VAT and sales taxes, central customs and excise duties, central service tax, and CST. The state VAT and sales taxes are levied on intrastate trade and the CST on interstate trade, at a rate that varies depending on the type of transaction and good. In VAT-implementing states, the VAT rates are 1 percent, 4 percent, and 12.5 percent. Sales taxes are also levied on specific items (e.g., petroleum products). The 5 states that have not implemented VAT continue to levy state sales taxes. The center levies customs duties and a basic excise duty (CENVAT) on goods manufactured or produced in India. The CENVAT base is truncated to manufacturing and eroded by a complex and extensive system of exemptions, including for small-scale industries and Special Economic Zones. Special central excise duties are levied on specific items. A service tax is levied by the center on some 71 services. Other minor taxes and duties imposed at both center and state level include stamp duty, taxes on land and buildings, and taxes on motor vehicles.

- 6 -
Stylized Facts After declining below 14 percent of GDP in 2001/02, India’s general government tax revenue rebounded to 15¾ percent of GDP in 2004/05. This exceeds the average for Asian emerging market countries by over 1 percentage point, but is 3¾ percentage points below the average for all emerging market countries. The decline in revenue in the 1990s occurred as major tax reforms were implemented, aimed at improving the buoyancy of revenues and increasing the share of direct taxes in total revenues. Direct tax revenues increased, but indirect tax collections declined, mainly due to tariff reductions (Figure 1).
Recent reforms have had some success in reversing the declining trend of revenues. The peak tariff reduction for non-agricultural imports advocated by the 2002 Kelkar committee reports (Box 3) was fully implemented but the revenue loss was more than offset by buoyant corporate tax collections. Excise and PIT revenues rose, but only marginally, reflecting the extension of further exemptions, deductions, and rebates. The states succeeded in raising sales tax collections, and a VAT was introduced in 2005.
Despite reforms, the tax structure remains dominated by indirect taxes. State taxes on commodities and services are the prominent source of general government revenue (representing nearly a third of the total tax intake), followed by central government excises (one-fifth of the total) (Table 1). The share of revenue from indirect taxes exceeds two-thirds, slightly above the average for emerging Asian economies, and significantly above the average for all emerging market countries (54 percent).
Figure 1. India: Tax Burden, 1974/75–2004/05 (In percent of GDP)
0.0
2.0
4.0
6.0
8.0
10.0
12.0
14.0
16.0
18.0
1974
A1
1976
A1
1978
A1
1980
A1
1982
A1
1984
A1
1986
A1
1988
A1
1990
A1
1992
A1
1994
A1
1996
A1
1998
A1
2000
A1
2002
A1
2004
A1
Total tax burden
Indirect taxes
Direct taxes
Sources: Indian authorities; and staff projections.
Billions of Percent of Percent ofRupees GDP Total
Central government 3,049.8 9.8 62.4Corporate tax 835.7 2.7 17.1Income tax 483.1 1.6 9.9Excises 991.6 3.2 20.3Customs 576.6 1.9 11.8Other 1/ 162.9 0.5 3.3
States and union territories 2/ 1,834.7 5.9 37.6Taxes on income 16.4 0.1 0.3Taxes on property and capital transactions 215.3 0.7 4.4Taxes on commodities and services 1,602.9 5.2 32.8
Total 4,884.5 15.7 100.0
Sources: Indian authorities; and staff estimates.
1/ Mostly service tax. 2/ Staff estimates based on projected GDP growth and historical elasticities.
Table 1. India: Structure of General Government Tax Revenue, 2004/05

- 7 -
Box 3. Kelkar 2002 Reports’ Proposals
As part of its overall reform agenda, the government in 2002 set up a tax reform task force (Kelkar task force) to propose a far-reaching reform agenda for direct and indirect taxes.1 Proposals centered around the following elements: • A change in the exemption level and rate structure of the PIT and broadening of the base,
as well as the elimination of most exemptions and replacement of allowances by credits. A constitutional amendment would allow the government to tax agricultural income. The general exemption would be increased, the number of brackets reduced, and the highest marginal rate reduced to 30 percent. A range of special deductions would be eliminated with some converted into credits. The report also proposed changes to the taxation of capital income, specifically exempting dividends from Indian companies and long-term capital gains on equity.
• A reduction in the rate and in the large number of deductions and exemptions of the CIT. The rate would be reduced from 35 percent (net of 2 percent surcharge) to 30 percent for domestic companies and from 40 percent to 35 percent for foreign companies. The minimum alternate tax would be eliminated.
• A rationalization of the import tariff structure and export promotion schemes. The existing 20 tariff rates, ranging up to 182 percent, would be reduced to a range of 0-20 percent for most goods, with higher rates—up to 150 percent—for certain agricultural products and “demerit” goods. Exemptions would be significantly narrowed.
• Broadening the base of the CENVAT and moving it further toward a VAT.
___________________________ 1 See Ministry of Finance (2002a and 2002b).
The overall tax burden, as measured by the AETR, is low compared to advanced economies and higher-income emerging markets in the region.4 The AETR on labor, at 2 percent in 2001, is much lower than in the European Union, United States, or Japan, which range from
4 The AETR is a standard indicator of the effective tax burden on categories of income or consumption. It summarizes various tax effects, including statutory tax rates, the effective tax base (accounting for tax evasion, exemptions, and the extent of informal activity), and the quality of tax administration. It is measured as the ratio of tax collections to the notional tax base derived from national accounts. See Annex I for details on the calculation of AETRs in India.

- 8 -
21–36 percent (Table 2).5 This reflects India’s narrow tax base and the lack of a social security system. The AETR on capital income is also low, owing to the wide coverage of tax incentives, low personal taxes on capital income, and a large informal sector. The operating surplus of unincorporated enterprises (a proxy for the share of the informal sector) accounted for three quarters of the operating surplus of the economy in 2000/01. India’s low AETRs on capital and labor match those of other low-income countries in the region (Sri Lanka and China), but are much below those of higher-income emerging market countries like Korea and Thailand (Figure 2). These results suggest ample room for AETRs on capital and labor to increase further in India as income levels rise, without adversely affecting competitiveness. India’s AETR on consumption is broadly average, despite a tax base that largely excludes services. As in other countries in Asia, it has declined over time.
5 Estimates for countries that are not members of the Organization for Economic Cooperation and Development (OECD) are not publicly available.
(In percent)
Total Tax WedgeLabor Capital Consumption on Labor 1/
India 2/ 1.6 5.2 15.0 15.9
Australia 20.9 30.7 12.1 30.5Austria 39.6 24.3 16.2 51.2Belgium 41.3 32.7 15.0 51.7Canada 29.6 36.8 13.9 39.4Czech Republic 41.5 21.6 13.0 47.2Denmark 39.9 39.5 20.6 56.0Finland 45.0 26.0 18.7 58.0France 40.5 33.2 15.1 51.3Germany 35.0 21.2 13.4 44.9Greece 34.9 12.9 15.5 46.5Hungary ... 14.7 22.2 ... Ireland 26.3 ... 21.2 41.9Italy 37.7 31.0 13.9 47.9Japan 24.1 27.9 6.4 29.4Korea 9.9 16.7 15.8 24.2Netherlands 36.4 32.7 18.0 47.9New Zealand 25.1 ... 18.5 38.9Norway 36.2 24.7 25.7 52.5Poland ... 20.9 17.1 ... Portugal 23.9 17.6 19.9 39.0Spain 30.7 20.0 14.5 40.8Sweden 49.6 35.7 19.8 59.6Switzerland 30.9 27.1 9.3 37.3United Kingdom 22.6 34.0 15.7 34.8United States 23.4 27.3 6.4 28.3
Unweighted average 32.4 26.5 15.9 43.4EU15 average 38.0 28.7 17.8 48.9
Sources: Carey and Rabesona (2002); and staff estimates for India.
1/ Combined effective tax rate on labor and consumption. 2/ Average 1993-2000, based on data availability.
Table 2. Average Effective Tax Rates Comparison, 1990–2000
Average Effective Tax Rate

- 9 -
Figure 2. Selected Asian Countries: AETRs on Labor, Capital, and Consumption
AETRs on Labor, 1975–2003(In percent)
0
2
4
6
8
10
12
1975 1980 1985 1990 1995 2000
India
Korea
ChinaSri Lanka
Thailand
0
4
8
12
16
20
1975 1980 1985 1990 1995 2000
Korea
India
AETRs on Capital, 1975–2003(In percent)
ChinaSri Lanka
Thailand
AETRs on Consumption, 1975–2003 (In percent)
0
4
8
12
16
20
24
28
1975 1980 1985 1990 1995 2000
Korea
India
China
Thailand
Sri Lanka
Source: Staff estimates.

- 10 -
AETRs are relatively low in India mainly owing to low tax productivity.6 For example, CIT tax productivity is much below the average for both OECD and non-OECD countries, reflecting a tax base thinned-out by exemptions and widespread tax evasion (Tables 3a and 3b).7 This suggests ample scope for increasing revenue without raising rates, via expansion of the taxpayer net, lifting of exemptions, and stepped up tax administration. During the period 1993-2001, India increased AETRs on labor and capital despite reductions in statutory rates and continued widespread exemptions. This suggests that improved tax administration and compliance were the main factors underlying the improvement in tax productivity and resulting rise in AETRs.
The Burden of Taxation on Investors This section assesses to what extent the Indian income tax code affects incentives to invest. We calculate two standard indicators, the marginal effective tax wedge (METW) between the pre- and post-tax return on capital, and the marginal effective tax rate (METR), defined as
6 Tax productivity measures the extent to which revenues that should be received—given the rate and potential base of the tax—are actually being realized. It captures all the factors that influence the AETR, other than the statutory tax rates. It is measured as the ratio of the effective to statutory tax rate (Kraemer and Zhang, 2004).
7 In Table 3a, following the Kraemer-Zhang approach, we use the operating surplus of the economy (from national accounts) as the potential tax base. In Table 3b, in the absence of such data for non-OECD countries, we use nominal GDP.
Table 3a. Revenue Productivity of the Corporate Income Tax (CIT), 2001
(In percent)
India 35.9 3.5 9.7
France 33.3 8.9 26.8Germany 38.9 2.1 5.3Italy 37.0 6.7 18.2Japan 40.9 8.7 21.2Korea 29.7 9.6 32.4United Kingdom 30.0 9.9 32.9United States 2/ 45.8 5.3 11.6
OECD average 32.3 9.6 29.7
1/ Ratio of effective CIT rate to statutory CIT rate. 2/ As of 2000.
Sources: Standard & Poor's; and staff estimates for India and Korea.
Statutory CIT Rate
Effective CIT Rate
Revenue Productivity 1/

- 11 -
Statutory Corporate RevenueCIT Rate 1/ Taxes/GDP 2/ Productivity 3/
India 35.9 2.3 6.4
Argentina 35.0 2.7 7.7Bolivia 25.0 1.8 7.2Chile (2001) 17.0 4.6 27.2China 33.0 2.5 7.5Colombia 35.0 4.7 13.4Hungary 16.0 8.0 49.8Indonesia 30.0 1.7 5.5Mexico (2000) 33.0 5.0 15.3Pakistan 35.0 3.6 10.2Peru 30.0 3.4 11.4Philippines 32.0 2.6 8.2Poland 19.0 4.9 25.6Russia 24.0 4.0 16.6Singapore (2001) 22.0 8.0 36.5South Africa 37.8 5.5 14.4Thailand 30.0 3.0 10.0Turkey 33.0 2.5 7.6Ukraine 25.0 5.0 20.0Uruguay 35.0 2.6 7.4Venezuela 34.0 14.7 43.1
All: Mean 29.0 4.5 17.2
1/ As of January 1, 2004. 2/ Used as proxy for the effective CIT rate. For 2003, unless otherwise indicated. 3/ Ratio of corporate tax/GDP to statutory CIT rate.
Sources: KPMG; IMF Government Finance Statistics ; IMF International Financial Statistics ; and various country databases.
Table 3b. Revenue Productivity of the Corporate Income Tax (CIT), 2003
(In percent)
the ratio of the METW to the real required pre-tax rate of return.8 By summarizing various tax effects, including the statutory CIT and personal tax rates on capital income, depreciation allowances, and inventory valuation method, the METW measures the potential cost of taxation to investors, which in turn affects their decision to invest. The AETR, although commonly used for this purpose, does not accurately reflect incentives, as it is backward 8 See Annex II for tax parameters used. See OECD (1991) for further details on the methodology and parameters. Indirect taxes impose additional costs on investment, but the METR approach focuses on direct taxation, thus understating the tax burden on investors. Comparable estimates have been published for OECD countries.

- 12 -
looking and measures the average rather than marginal tax burden. Moreover, international comparisons using the AETR are difficult to interpret due to differences in accounting definitions and the timing of tax payments. Further, it does not incorporate personal tax provisions. The marginal tax burden in India is lower than the OECD average, but tax-induced distortions tend to be high. Firms that rely on internal financing are particularly penalized, as they face a marginal tax wedge more than ½ percentage point higher than the OECD average (Tables 4.a. and 4.b.):
• The marginal tax wedge (1.4 percent) is slightly below the OECD average. This reflects low personal taxes, including the elimination of tax on long-term capital gains in 2004/05.
• However, the standard deviation of the marginal tax wedge across investment assets is three times higher than the OECD average. Inventory investment is treated more harshly than investments in machinery and buildings, so that firms that need to carry more inventories are penalized, more so than in other countries. The use of the FIFO (first in first out) method for inventory valuation also entails a higher tax burden, as increases in the value of inventories due solely to inflation are taxed.
• The standard deviation of the marginal tax wedge across financing sources is nearly twice as high as the OECD average. The negative tax wedge enjoyed by debt financing means that the government is effectively subsidizing marginal debt-financed investments, more so than in other countries. Investments financed by new equity face a below-average tax wedge, thanks to relatively low dividend taxation. However, investments financed by retained earnings face a tax wedge in excess of 2½ percent (compared to the OECD average of 2 percent). Smaller firms that face problems in borrowing and tend to be more dependent on internal sources of funds are thus disadvantaged compared to larger firms (Rao and Lukose, 2002; Joseph et al., 1998). The relatively large tax advantage of debt finance may also have contributed to relatively high financial leverage in India, exacerbating firms’ vulnerability. The average debt-to-equity ratio for Indian companies is high relative to their counterparts in Asian countries and elsewhere, and has risen recently to 1.4 in 2002 from a low of 1.2 in 1996 (Topalova, 2004).
A related result is that corporates that have only limited access to debt financing, particularly smaller firms, face a high effective marginal tax rate. The METR for investments financed by retained earnings or equity is nearly 33 percent, compared to the OECD average of 22 percent, reflecting a relatively high CIT rate (Table 5).9
9 The METR calculated here follows the methodology of Devereux, Griffith, and Klem (2002) and ignores any personal taxes, focusing on the marginal tax burden at the firm level.
- 13 -
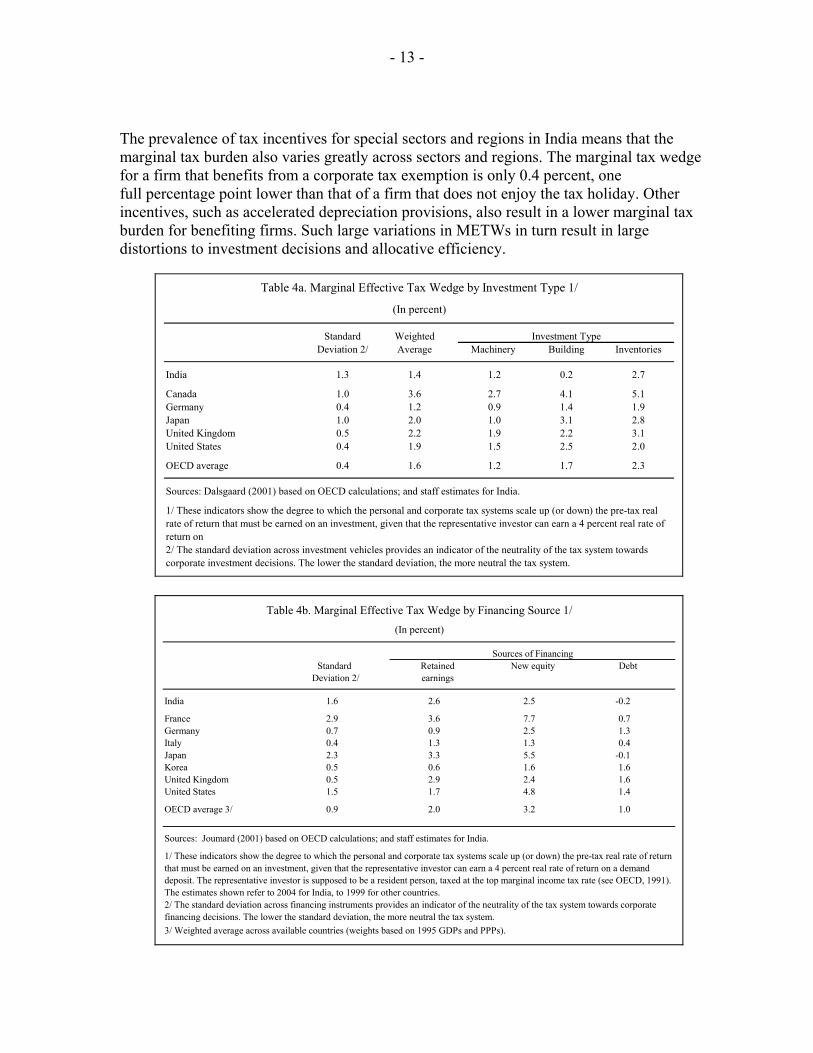
The prevalence of tax incentives for special sectors and regions in India means that the marginal tax burden also varies greatly across sectors and regions. The marginal tax wedge for a firm that benefits from a corporate tax exemption is only 0.4 percent, one full percentage point lower than that of a firm that does not enjoy the tax holiday. Other incentives, such as accelerated depreciation provisions, also result in a lower marginal tax burden for benefiting firms. Such large variations in METWs in turn result in large distortions to investment decisions and allocative efficiency.
Standard WeightedDeviation 2/ Average Machinery Building Inventories
India 1.3 1.4 1.2 0.2 2.7
Canada 1.0 3.6 2.7 4.1 5.1Germany 0.4 1.2 0.9 1.4 1.9Japan 1.0 2.0 1.0 3.1 2.8United Kingdom 0.5 2.2 1.9 2.2 3.1United States 0.4 1.9 1.5 2.5 2.0
OECD average 0.4 1.6 1.2 1.7 2.3
Sources: Dalsgaard (2001) based on OECD calculations; and staff estimates for India.
Table 4a. Marginal Effective Tax Wedge by Investment Type 1/
(In percent)
Investment Type
1/ These indicators show the degree to which the personal and corporate tax systems scale up (or down) the pre-tax real rate of return that must be earned on an investment, given that the representative investor can earn a 4 percent real rate of return on2/ The standard deviation across investment vehicles provides an indicator of the neutrality of the tax system towards corporate investment decisions. The lower the standard deviation, the more neutral the tax system.
Standard Retained New equity DebtDeviation 2/ earnings
India 1.6 2.6 2.5 -0.2
France 2.9 3.6 7.7 0.7Germany 0.7 0.9 2.5 1.3Italy 0.4 1.3 1.3 0.4Japan 2.3 3.3 5.5 -0.1Korea 0.5 0.6 1.6 1.6United Kingdom 0.5 2.9 2.4 1.6United States 1.5 1.7 4.8 1.4
OECD average 3/ 0.9 2.0 3.2 1.0
Sources: Joumard (2001) based on OECD calculations; and staff estimates for India.
3/ Weighted average across available countries (weights based on 1995 GDPs and PPPs).
2/ The standard deviation across financing instruments provides an indicator of the neutrality of the tax system towards corporate financing decisions. The lower the standard deviation, the more neutral the tax system.
Table 4b. Marginal Effective Tax Wedge by Financing Source 1/(In percent)
Sources of Financing
1/ These indicators show the degree to which the personal and corporate tax systems scale up (or down) the pre-tax real rate of return that must be earned on an investment, given that the representative investor can earn a 4 percent real rate of return on a demand deposit. The representative investor is supposed to be a resident person, taxed at the top marginal income tax rate (see OECD, 1991). The estimates shown refer to 2004 for India, to 1999 for other countries.

- 14 -
(In percent)
Statutory Corporate Statutory Corporate Marginal EffectiveTax Rate, 2004 1/ Tax Rate, 1999 Tax Rate 2/
India 35.9 ... 32.9
Australia 30.0 ... ... Austria 34.0 34.0 17.4Belgium 34.0 40.2 25.6Canada 36.1 34.6 24.0Czech Republic 28.0 ... ... Denmark 30.0 ... ... Finland 29.0 29.0 19.5France 34.3 36.4 29.9Germany 38.3 38.3 28.3Greece 35.0 37.5 27.7Hungary 18.0 ... ... Ireland 12.5 10.0 6.6Italy 37.3 40.3 9.2Japan 42.0 40.9 31.8Korea 29.7 ... ... Luxembourg 30.4 ... ... Netherlands 34.5 35.0 24.3New Zealand 33.0 ... ... Norway 28.0 ... ... Poland 19.0 ... ... Portugal 27.5 35.2 20.3Spain 35.0 35.0 29.5Sweden 28.0 28.0 16.1Switzerland 24.1 ... ... United Kingdom 30.0 30.0 20.3United States 40.0 39.3 23.8
Unweighted average 30.3 33.6 22.0EU15 average 32.2 34.4 22.3
1/ As of January 1, 2004.
Table 5. Statutory and Effective Tax Rates on Corporations
Sources: KPMG for 2004 statutory tax rate; staff estimates for India; Devereux, Griffifth and Klemm (2002) for 1999 statutory tax rate; and for effective tax rates for other countries.
2/ Based on investment in plant and machinery, financed by equity or retained earnings (but not debt). Taxation at the shareholder level is not included (hence no distinction is made between new equity and retained earnings). Other assumptions include: real post-tax required rate of return fixed at 10 percent. The estimate is for the current tax system for India, the 1999 tax system for all other countries.
- 15 -
III. PRIORITIES FOR REFORMS
The facts highlighted above suggest that a tax reform combining lower statutory rates with base broadening could help achieve a pro-growth fiscal adjustment in India. AETR and tax productivity estimates suggest ample scope for raising direct tax revenue through the removal of exemptions and improved tax administration and compliance. In addition to reducing tax-induced distortions, the removal of exemptions would create room for further lowering statutory rates, which in turn would enhance the return of the tax system and further improve the neutrality of the tax system. Meanwhile, the planned introduction of a national VAT on goods and services (GST) would help improve the revenue productivity of domestic indirect taxes, helping recoup expected trade revenue losses, and also enhance economic efficiency. These broad directions for tax reform were highlighted in the government’s 2004 road map to meet the deficit targets of its Fiscal Responsibility and Budget Management Act (FRBMA) (Ministry of Finance, 2004).
An Assessment of the FRBMA Road Map Tax Proposals The road map proposes a number of changes to income taxation and the introduction of a GST.
• Direct tax measures include further reductions in statutory rates. The road map proposes a reduction of the CIT rate to 30 percent and elimination of the surcharge; reduction of the general depreciation rate to 15 percent; elimination of the withholding tax on distribution of dividends; and elimination of the long-term capital gains tax. Several measures, including the reduction in the CIT and depreciation rates and the elimination of the long-term capital gains tax, have been implemented over the last two years. This has contributed to lowering the marginal tax wedge and reducing its variation across investment assets, thus increasing the return on investment and contributing to economic efficiency. The implementation of remaining measures in the 2006/07 budget would help consolidate those gains.
• Introduction of the GST and further reduction in customs duties are the hallmarks of proposed indirect tax reforms. The GST would replace the existing state VAT, CST, central excise duties, and central service tax. Tariffs have already dropped in the last two budgets and the government envisages further cuts in coming years to bring them down to levels in member countries of the Association of Southeast Asian Nations.
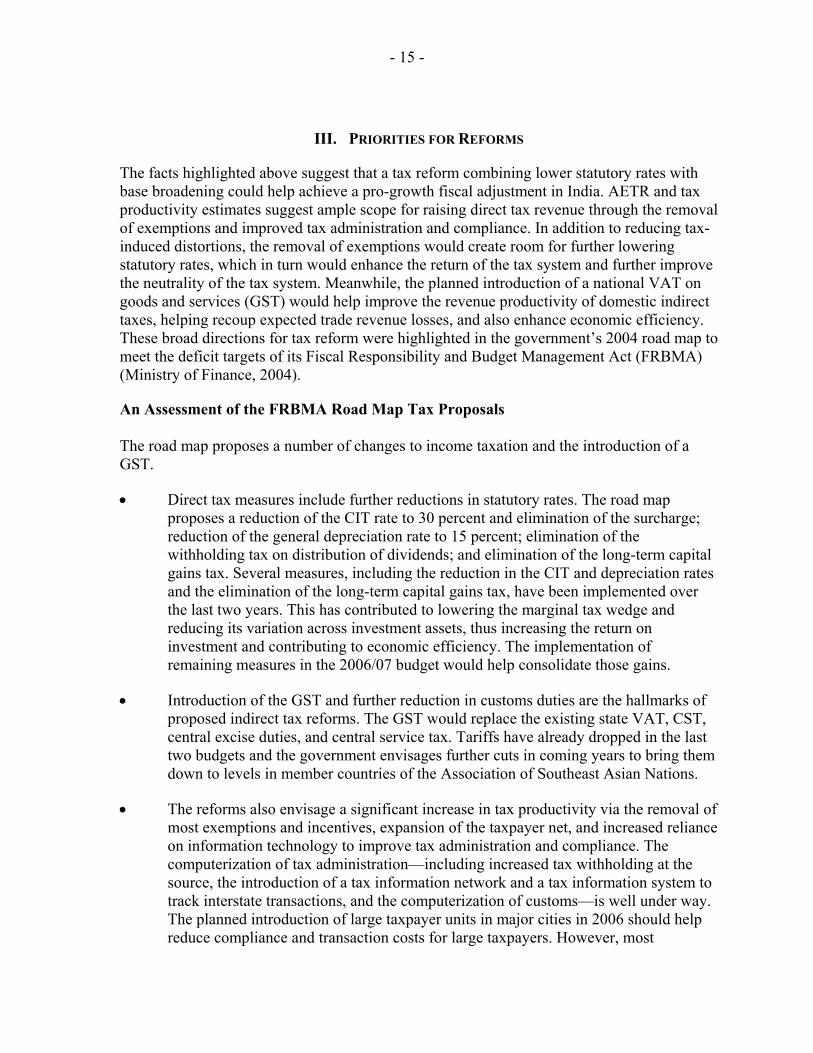
• The reforms also envisage a significant increase in tax productivity via the removal of most exemptions and incentives, expansion of the taxpayer net, and increased reliance on information technology to improve tax administration and compliance. The computerization of tax administration—including increased tax withholding at the source, the introduction of a tax information network and a tax information system to track interstate transactions, and the computerization of customs—is well under way. The planned introduction of large taxpayer units in major cities in 2006 should help reduce compliance and transaction costs for large taxpayers. However, most

- 16 -
exemptions remain in place. The government announced that it would let existing corporate tax exemptions lapse, but extended sunset clauses in some cases, and introduced new incentives in the context of the 2005 Special Economic Zones Act. New services have been added to the tax net over the last two years, but the move toward a GST will require further expansion of the service tax base and the removal of most excise exemptions, including for small-scale industries and selected areas.
Implementation of remaining tax reforms would further decrease the marginal tax burden on investment and reduce tax-induced distortions. The METW would decrease further to 1.2 percent, thanks to lower personal taxes (Table 6). Neutrality with respect to sources of financing would improve, but firms that rely on internal financing (mainly smaller firms) would remain relatively penalized. The marginal tax wedge faced by such firms would remain ¼ percentage point above the OECD average. Neutrality with respect to investment patterns would also improve, but the standard deviation of the METW across investment assets would remain more than double the OECD average, suggesting scope for further improvements.
To mitigate potentially excessive reliance on debt finance and help further improve the neutrality of the tax system, additional measures can be considered. These include (see International Monetary Fund, 2004): limiting the deductibility of interest to a percentage of net taxable income; limiting debt for the purposes of income tax (e.g., debt-to-equity ratios in Canada are limited to 2, in Germany to 1.5, and in Japan to 3); limiting interest to a referential rate (e.g., in Portugal, the 12-month Euribor plus 1.5 percent); or introducing an allowance for corporate equity.10
The recent introduction of a state VAT is a major step toward the GST. By allowing full integration of goods and services taxation at the national level, a GST should help secure further gains in economic efficiency, with favorable effects on investment and exports. However, successful introduction will require bringing remaining states into the VAT, phasing-out the CST, and reaching agreement with states on the sharing of GST revenues.11
Base-broadening measures envisaged by the road map would imply a significant increase in tax productivity and economic efficiency gains as tax-induced distortions are reduced. For example, corporate tax revenue is projected to nearly double from 2.3 percent of GDP
10 The notional rate of return on invested equity is deductible under the CIT in Croatia (1994–2001), and imputed equity return is taxed at a reduced rate in Austria and Italy (until 2001).
11 The Indian constitution currently gives the center the exclusive right to tax services, while precluding it from taxing sales. To introduce the GST, a “grand bargain” therefore needs to be struck between the center and the states. Specifically, the latter would agree to let the center tax sales, in exchange for a share of GST revenues.

- 17 -
in 2003/04 to 4.2 percent of GDP by 2008/09, despite a lower CIT rate, as most exemptions are eliminated. CIT tax productivity would more than double to 14 percent by 2008/09 (nearing the non-OECD average). The removal of most tax incentives would also result in lower variation of the marginal tax burden across sectors and regions, contributing to higher economic efficiency. Meanwhile, the proposed introduction of a GST with few exemptions should help enhance indirect tax productivity and improve economic efficiency by harmonizing tax rates across states. Moreover, a truly destination-based GST would allow the emergence of a single Indian market, greatly enhancing India’s attractiveness as an investment destination.
Retained New Debt Weighted StandardType of Investment earnings equity average Deviation 1/
Machinery 2.4 2.3 -0.4 1.2 1.644.0 42.8 -13.5 27.6
Buildings 1.3 1.2 -1.3 0.2 1.530.3 28.6 -74.5 4.8
Inventories 4.1 3.9 0.9 2.7 1.857.1 56.3 23.7 46.7
Weighted average 2.6 2.5 -0.2 1.4 1.646.4 45.3 -6.6 31.1
Standard deviation 1/ 1.4 1.4 1.1 1.3
Machinery 2.1 2.1 -0.3 1.0 1.339.9 39.9 -9.9 24.9
Buildings 1.1 1.1 -1.1 0.1 1.326.7 26.7 -56.1 4.4
Inventories 3.5 3.5 0.9 2.4 1.553.1 53.1 22.6 43.2
Weighted average 2.3 2.3 -0.1 1.2 1.442.3 42.3 -4.0 28.2
Standard deviation 1/ 1.2 1.2 1.0 1.1
Source: IMF staff estimates.
2/ Corresponding marginal effective tax rates are reported in italics.
1/ The standard deviation measures the neutrality of the tax system with respect to corporate financing and investment decisions. The lower the standard deviation, the more neutral the tax system.
Table 6. India: Tax Wedges under Current vs. Reformed Tax System
(In percent)
Mode of Financing
Tax System, 2005/06 2/
Tax System, FRBMA Road Map 2/
- 18 - ANNEX I
Average Effective Tax Rates (AETRs) Based on Macroeconomic Data
The AETR on labor is derived in two steps. First, the effective tax rate on total household income is calculated as the ratio of individual income tax and household income. including: operating surplus of unincorporated enterprises (OSPUE), property income (PEI), and wage income (CE). Second, the AETR on labor is calculated by dividing the sum of taxes paid on labor income (tax on wages and salaries—calculated by applying the household income AETR to wage income1—social security contributions, and other payroll taxes) by the sum of wages and salaries and employer-paid social security contributions.
The AETR on capital is obtained by dividing the sum of taxes paid by capital (corporate income tax, household taxes on capital income, and various property taxes) by the net operating surplus of the economy.
The AETR on consumption is calculated as the sum of domestic taxes on goods and services, export, and import duties, divided by the sum of private and government nonwage consumption, net of indirect taxes. Indirect taxes are excluded in the denominator to reflect the common practice of expressing indirect tax rates as a percentage of the price before tax.
More recent studies however have argued that it is preferable to express the consumption tax base in gross terms (i.e., including indirect tax rates in the denominator), to improve comparability with the tax ratios on labor and capital and facilitate calculating a combined AETR on labor and consumption (Carey and Rabesona, 2002). We therefore also present this alternative (revised) estimate together with the original Mendoza et al. (1994) estimate.
1 Labor and capital income of households are assumed to be taxed at the same rate.

- 19 - ANNEX II
Tax Parameter Data, December 2005
(In percent) A. Corporate Tax System Corporate tax rate on retained earnings 33.66 Inventory valuation FIFO Long-term capital gains tax rate 0 Dividend distribution tax rate 12.75 B. Personal Tax System Interest income tax rate 10.71 Dividend income tax rate 0 Short-term capital gains tax rate 10.2 Long-term capital gains tax rate 0 Proportion of assets realized each period 10 C. Tax Depreciation Rates Machinery Buildings Depreciation method Declining balance Declining balance Rate for declining balance 15 10

- 20 -
References
Blankenau, W., S. Nicole, and M. Tomljanovich, 2004, “Public Education Expenditures, Taxation, and Growth,” Journal of Development Economics, Vo. 73, Issue 2, pp. 583–605.
Burgess, Robin, Stephen Howes, and Nicholas Stern, 1997, “The Reform of Indirect Taxes in
India,” in India: the Future of Economic Reform, ed. by R. Cassen and V. Joshi (New York: Oxford University Press).
Carey, David and Josette Rabesona, 2002, “Tax Ratios on Labour and Capital Income and on
Consumption,” OECD Economic Studies, No. 35, Vol. 2, pp. 129–174. Dalsgaard, Thomas, 2001, “The Tax System in New Zealand: An Appraisal and Options for
Change,” Economics Department Working Paper No. 7 (Paris: Organization for Economic Cooperation and Development).
Daveri, F., and G. Tabellini, 2000, “Unemployment, Growth, and Taxation in Industrial
Countries,” Economic Policy, Vol. 15, Issue 30, pp. 47–104, April. Devereux, Michael, Rachel Griffith, and Alexander Klemm, 2002, “Corporate Income Tax
Reforms and Tax Competition,” Economic Policy, Vol. 17, Issue 35, pp. 451–95, October.
Farrel, Diana, 2004, “Boost Growth by Reducing the Informal Economy,” The Asian Wall
Street Journal, October 18. Feltenstein, A. and A. Shah, 1995, “General Equilibrium Effects of Investment Incentives in
Mexico,” Journal of Development Economics, Vol. 46, pp. 253–69. Fishman, R. and J. Svensson, 2000, “Are Corruption and Taxation Really Harmful to
Growth? Firm Level Evidence,” (unpublished; New York: Columbia University). International Monetary Fund, 2004, “Taxation and the Financing Structure of the Firm,”
paper presented at the IMF-Singapore Regional Training Institute and the Fiscal Affairs Department (unpublished; Washington).
Joseph, Mathew, Rupa Nitsure, L. Bhagirathi, and Madan Sabnavis, 1998, “India’s Economic
Reforms: Private Corporate Sector Response,” paper presented at the 1998 ABAS International Conference on Emerging Economies, Budapest, Hungary.
Joumard, Isabelle, 2002, “Tax Systems in European Union Countries,” OECD Economic
Studies, Vol. 34, pp. 91–151

- 21 -
Kneller, R., M. F. Bleaney, and N. Gemmel, 1999, “Fiscal Policy and Growth: Evidence from OECD Countries,” Journal of Public Economics, Vol. 74, Issue 2, pp. 171–190.
KPMG, 2004, Corporate Tax Rate Survey. Available via the Internet at
http://www.kpmg.com. Kraemer, Moritz, and Eileen Zhang, 2004, “Flexibility in Taxing Times—A New Index of
Governments’ Revenue-Raising Potential” (London: Standard & Poor’s). Mendoza, Enrique, Assaf Razin, and Linda Tesar, 1994, “Effective Tax Rates in
Macroeconomics, Cross-Country Estimates of Tax Rates on Factor Incomes and Consumption,” Journal of Monetary Economics, No. 34, pp. 297–323.
Milesi-Ferretti, Gian-Maria, and Nouriel Roubini, 1995, “Growth Effects of Income and
Consumption Taxes: Positive and Normative Analysis,” NBER Working Paper 5317 (Cambridge, Massachusetts: National Bureau of Economic Research).
Ministry of Finance, 2004, Report of the Taskforce on Implementation of the Fiscal
Responsibility and Budget Management Act, 2003 (New Delhi: Government of India). ———, 1982, “Economic Reforms Two Years After and the Task Ahead,” Department of
Economic Affairs Discussion Paper (New Delhi: Government of India). ———, 2001, Economic Survey 2000–2001 (New Delhi: Government of India). ———, 2002a, Report of the Task Force on Indirect Taxes (New Delhi: Government of
India). ———, 2002b, Report of the Task Force on Direct Taxes (New Delhi: Government of
India). Muhleisen, Martin, 1998, “Tax Revenue Performance in the Post-Reform Period,” India—
Selected Issues, IMF Country Report No. 98/112 (Washington: International Monetary Fund).
Nicodeme, G., 2002, “Sector and Size Effects on Effective Corporate Taxation,” Economic
Papers No. 175 (Brussels: European Commission). Organization for Economic Cooperation and Development, 1991, Taxing Profits in a Global
Economy (Paris). ———, 2001, Tax and the Economy: A Comparative Assessment of OECD Countries,
(Paris).

- 22 -
Patel, Urjit, 1995, “State Indirect Taxes: Present System and Scope for Reform,” India—Background Papers, IMF Country Report No. 95/87 (Washington: International Monetary Fund).
Rao, S. Narayan, and Jijo Lukose, 2002, “An Empirical Study on the Determinants of the
Capital Structure of Listed Indian Firms,” (unpublished; Mumbai: Indian Institute of Technology).
Schneider, Friedrich, and Robert Klinglmair, 2004, “Shadow Economies Around the World:
What Do We Know,” CESifo Working Paper Series No. 1167 (Munich: Center for Economic Studies and Institute for Economic Research).
Shome, Partha, 2004, “India: Resource Mobilization through Taxation,” (unpublished;
Washington: International Monetary Fund). Tanzi, Vito, and Howell Zee, 2000, “Taxation and the Household Saving Rate: Evidence
from OECD Countries,” Banca Nazionale del Lavoro Quarterly Review, Vol. 53, pp. 31–43.
Topalova, Petia, 2004, “Overview of the Indian Corporate Sector: 1989–2002,” IMF
Working Paper No. 04/64 (Washington: International Monetary Fund).