
The Syndicate Structure of Securitized Corporate...
36
The Syndicate Structure of Securitized Corporate Loans Zhengfeng Guo 1* and Shage Zhang 2 Feb 6th, 2015 Abstract Using a large panel dataset of syndicated corporate loan facilities, we empirically identify the factors that influence the likelihood of securitization and the determinants of syndicate structure. The evidence reveals that facilities with higher credit risk and less information asymmetry are more likely to be securitized, while the percentage of a facility being securitized decreases with credit risk. We also find that securitization is associated with smaller lead arranger and total bank shares, but larger shares held by non-CLO institutional investors. Such a relationship exists in Term A, Term B, and leveraged facilities, suggesting that the relationship between securitization and syndicate structure is not entirely driven by the practice of bank and institutional participants targeting different segments of the syndicated loan market. Further analysis shows that the negative relationship between securitization and lead arranger share is stronger in the presence of greater information asymmetry. Key words: Collateralized Loan Obligations; Securitization; Lead Arranger Share; Information Asymmetry; Syndicate Structure JEL classification: G21; G23; G32 1 * Corresponding author. Credit Risk Analysis Division, Office of the Comptroller of the Currency, 400 7th Street Southwest, Washington, DC 20024, Phone: 001-202-649-7255, Email: [email protected] 2 School of Business, Trinity University, One Trinity Place, San Antonio, TX 78212, Phone: 001-210-999-7083, Email: [email protected]
Transcript of The Syndicate Structure of Securitized Corporate...
The Syndicate Structure of Securitized Corporate Loans
Zhengfeng Guo1* and Shage Zhang2
Feb 6th, 2015
Abstract
Using a large panel dataset of syndicated corporate loan facilities, we empirically identify the
factors that influence the likelihood of securitization and the determinants of syndicate structure.
The evidence reveals that facilities with higher credit risk and less information asymmetry are
more likely to be securitized, while the percentage of a facility being securitized decreases with
credit risk. We also find that securitization is associated with smaller lead arranger and total bank
shares, but larger shares held by non-CLO institutional investors. Such a relationship exists in
Term A, Term B, and leveraged facilities, suggesting that the relationship between securitization
and syndicate structure is not entirely driven by the practice of bank and institutional participants
targeting different segments of the syndicated loan market. Further analysis shows that the
negative relationship between securitization and lead arranger share is stronger in the presence of
greater information asymmetry.
Key words: Collateralized Loan Obligations; Securitization; Lead Arranger Share; Information
Asymmetry; Syndicate Structure
JEL classification: G21; G23; G32
1* Corresponding author. Credit Risk Analysis Division, Office of the Comptroller of the Currency, 400 7th Street
Southwest, Washington, DC 20024, Phone: 001-202-649-7255, Email: [email protected] 2 School of Business, Trinity University, One Trinity Place, San Antonio, TX 78212, Phone: 001-210-999-7083,
Email: [email protected]

1. Introduction
Collateralized Loan Obligations (CLOs) are structured financial products primarily
backed by syndicated loans.1 Despite a significant decrease in volume during the financial crisis,
the issuance of CLOs was resurrected before long. According to S&P Capital IQ/LCD, CLO
issuance in the U.S. in April 2014 hit $11.8 billion. In the wake of a large CLO market, finance
researchers including Bord and Santos (2011), Shivdashani and Wang (2011), Benmelech et al.
(2012), Wang and Xia (2014), and others, have recently sought to better understand the influence
of CLO market on syndicated corporate loans by analyzing the effects of securitization on lead
bank incentives, syndicated loan performance, and the cost of borrowing.
In this paper, we examine the syndicate structure of securitized corporate loans. The
syndicate structure plays an important role in determining loan yields (Ivashina, 2009), allowing
lending banks to credibly commit to loans they originate, and leveraging bank’s private
information to the benefit of borrowing firms (Narayanan et al., 2004). Thus, our study offers
another important dimension to better understand the role of securitization. With our rich dataset,
we are able to clearly identify a large sample of securitized loan facilities and observe their
syndicate structure over time. This allows us to address the following questions: (1) what are the
factors that influence the likelihood of a loan facility being securitized? (2) Upon a decision of
securitization, what proportion of the loan facility in question will be securitized? (3) How does
securitization affect the syndicate structure and shares held by different parties, such as the lead
arranger, bank participants and institutional participants?
1A syndicated loan facility is considered as securitized if a fraction of the loan facility is sold to CLO entities that
issue CLOs using loans as collaterals.

1
Our main results indicate that a facility is more likely to be securitized as the facility
amount and maturity increase, as information about the borrower becomes more transparent, as
the borrower becomes larger, and as the facility’s observable risk measured by credit and
performance ratings increase. Consistent with the argument that the pursuit of riskier loans is to
seek high returns to suffice CLO manager’s financing cost (Benmelech and Dlugosz, 2009), our
finding suggests that CLO entities have a strong preference towards investing in riskier but more
transparent loan facilities.
We document that the total percentage share held aggregately by all CLO entities in a
facility (termed as percentage of securitization) varies a lot among securitized facilities. Our
analysis reveals that although credit risk increases the likelihood of securitization, it is negatively
associated with the percentage of securitization in a loan facility. Less information asymmetry,
on the other hand, is associated with higher percentage of securitization. The percentage of
securitization is significantly higher if the borrower is a public firm with more transparent
financial information available, and if the lead arranger is extending a credit to a distant borrower
who presumably has a less severe asymmetric information problem (Petersen and Rajan, 2002).
Consistent with Bord and Santos (2012), we find that both lead arranger share and total
bank share are significantly smaller in securitized loan facilities. In contrast, the aggregate share
held by all non-CLO institutional investors (such as hedge fund, private equity fund, mutual fund,
insurance companies and financial companies) is much larger in securitized loan facilities. The
average difference in lead arranger share and the aggregate share by all non-CLO institutional
investors between securitized and non-securitized facilities are around -9 to -11 percentage
points and 17 to 19 percentage points, respectively, after controlling for facility, borrower and
lead arranger characteristics.

2
One potential explanation of lower lead arranger and total bank shares is that institutional
investors crowd out the fund contributed by the lead arranger and other bank participants, given
the observation that institutional investors often invest in Term B facilities and securitization also
occurs more often among Term B facilities. We investigate this possibility by looking at
subsamples of Term A and Term B facilities separately. The evidence reveals that securitization
is associated with lower lead arranger and total bank shares in both subgroups and the magnitude
is slightly larger among Term B facilities. Moreover, we include the number of institutional
participants (including both CLO and non-CLO institutions) in a syndicate to explicitly control
the demand effect from institutional investors. We still find both lead arranger and total bank
shares to be considerably smaller in securitized facilities. These results suggest that institutional
demand can’t fully explain the lower lead arranger and total bank shares in securitized facilities.
In other words, having CLO entities in a syndicate has a distinct impact on the bank shares
beyond the number of institutional investors involved.
Because the majority of securitized facilities are issued by borrowers with speculative-
grade credit ratings, the capital regulations of bank participants can also result in lower bank
shares in securitized facilities. To explore this possibility, we look at the subsample of leveraged
loan facilities. We find that both lead arrangers and bank participants can hold large proportions
of speculative loan facilities, and even the entire facilities in some cases. The lead arranger share
ranges from 0% to 57% and the total bank share ranges from 0% to 100% among leveraged loan
facilities. Moreover, securitization is again associated with lower lead arranger and bank shares
in this subsample, suggesting that our results are not entirely due to bank regulations.
Finally, lower lead arranger and bank shares can be indicative of a potential adverse
selection problem. Theory suggests that lead arrangers’ exposure to loans they originate induces

3
proper ex ante screening and ex post monitoring effort; hence, it is an important mechanism to
reduce asymmetric information between the borrower and outside lenders (Holmstrom and
Tirole, 1997). Securitization can change such incentives because originating banks can sell off
the loans to CLO entities that have a high demand for loans in order to underwrite CLOs. The
incentive of securitization can be stronger when the lead arranger possesses negative private
information on the quality of the loan, leading to a more severe adverse selection issue. Our
finding that a lead arranger holds an even smaller proportion of a securitized facility when the
issuer is a private company or when a public issuer lacks a credit rating suggests a potential
adverse selection problem.
We find non-CLO institutional investors play a unique role in the syndicated loan market
by supplying capital to risky loans. While lead arranger, bank participants and even CLO
participants tend to hold significantly lower shares in risky facilities, non-CLO institutions invest
significantly more in these facilities, and their share increases with a facility’s credit risk.
Our paper contributes to the extant literature in many important aspects. First of all, this
paper adds to the literature that examines syndicate structure (e.g. Dennis and Mullineaux, 2000;
Lee and Mullineaux, 2004; Jones et al., 2005; Sufi, 2007). To the best of our knowledge, our
study is the first to study the syndicate structure of securitized corporate loans. Relying on the
richness of our dataset, we not only identify the factors that influence the likelihood of
securitization, but also explore the determinants of the percentage of securitization in a facility,
given such a large variation of this percentage among securitized loan facilities.
Moreover, the panel structure of the data allows us to track each facility from origination
to several years afterwards. Compared to most of the existing studies with only cross-sectional

4
data at loan origination, our analysis is conducted in a panel structure, exploring both cross-
sectional and over-time variations in riskiness, information asymmetries, the decision of
securitization and changes in syndicate structure.
Lastly, by linking the Shared National Credit (SNC) program data with Computat, our
data on securitized facilities is much more comprehensive than most of the existing studies. We
are able to clearly identify a much larger sample of securitized term loans with 4,199 facilities
(7,841 facility-year observations) originated during the long period between 1999-2010,
compared to 302 securitized facilities in Benmelech et al. (2012) and 331 in Nadauld and
Weisbach (2012). Bord and Santos (2014) use the same database and approach to identify
securitized facilities with a focus on a shorter period of 2004-2008.
The rest of the paper is organized as follows. In section 2, we detail our sample
construction and provide some relevant summary statistics. Section 3 presents our analysis of the
decision of securitization and the percentage of securitization. Section 4 presents our results on
the relationship between securitization and syndicate structure. Section 5 concludes our study.
2. Data Construction and Summary Statistics
2.1 Data source and identification of securitized loan facilities
Our loan information is obtained from Shared National Credit (SNC) program run by the
Federal Deposit Insurance Corporation (FDIC), the Federal Reserve Board, and the Office of the
Comptroller of the Currency (OCC). CLO entities almost always have a preference of term loans

5
over revolving credit lines;2 hence we only keep term loan facilities which are then grouped into
Term A facilities (usually is amortized) and Term B facilities (usually is “bullet”). 3
For each loan facility that exceeds $20 million and is jointly held by three or more
federally supervised institutions, the following information is collected and updated at the end of
every year: the identity of the borrower, type of credit (i.e., Term A or Term B), purpose of the
loan (i.e., merger and acquisition, business recapitalization/dividends, project finance and so on),
principal amount, maturity date, credit rating, names of the lead arranger and syndicate
participants, and shares held by the lead arranger and each participant.4 We have panel data on
14,370 unique facilities with 29,478 facility-year observations. The borrowers’ firm level
information is obtained from Compustat and then merged to our sample by matching borrower
names in SNC with company names in Compustat.
We identify loan facilities sold to CLO entities either at origination or later on by filtering
the syndicate participants’ names. We identify 1,579 unique CLO entities if the participant’s
name contains “CLO” or “CDO” letters. We then get a list of CLO entities from CLO databank
at structuredcreditinvestor.com (SCI) as well as Moody’s CDO deal library. By doing so, we are
able to obtain additional 458 unique CLO entities. We then compare the list of these entities to
the syndicate participants’ names to identity which participants are CLO entities. We consider
2See Benmelech and Dlugosz (2009), Benmelech et al. (2012), Nadauld and Weisbach (2012), and Wang and Xia
(2014). 3Following Lim et al. (2014), we treat facilities with B or higher designation letters (e.g., C, D, and etc.) as Term B
facilities, and treat term loan facilities without letter designation as Term B facilities as well. 4We have more Term A facilities than Term B facilities in the sample. This is mainly due to the large proportion of
Term A facilities during the 1999-2005 period. The representation of Term B facilities in SNC increases after 2005,
and they make up about 60% of all facilities in our sample after 2006. In robustness, we conduct all our tests using
only the sub sample period during 2006-2010, and all results stay qualitatively the same. The results are available
upon request.

6
facilities with at least one CLO participant as being securitized. The rest are classified as non-
securitized facilities.
Securitization occurs rather frequently. Out of our 14,370 loan facilities originated during
1999-2010, 4,199 facilities (about 29%) are securitized either at origination or later on.
Securitization occurs around 38% of the time in the Term B facilities that institutional investors
often target (Nandy and Shao, 2010), and about 27% of the time in Term A facilities that are
often considered bank facilities.5 Moreover, securitization can occur for both leveraged loans
and loans with investment grade ratings, although it primarily concentrates on leveraged loans.
Our data suggest that about 30% of the leveraged facilities are securitized, compared to 14% of
investment grade loan facilities. Once a facility is securitized, the proportion sold to CLO
entities can vary a lot. The percentage of credit being sold to CLO entities ranges from 0.59% to
68.82%, among all securitized facilities in our sample.
2.2 Loan characteristics
Our sample has 4,199 unique CLO facilities (with 7,841 facility-year observations) from
1999 to 2010, 84% of these facilities are sold to CLO entities at origination and the rest are
securitized afterwards. The 4,199 CLO facilities are issued by 2,055 unique borrowers, and we
are able to match 715 of them to Compustat companies. In comparison, there are 10,817 non-
CLO facilities (with 21,637 facility-year observations) during the sample period. These facilities
are issued by 6,508 unique borrowers, and we are able to match 1,351 of them to Compustat
firms.
5This is different from studies on loan securitization that exclude Term A facilities, such as Benmelech et al. (2012),
and Wang and Xia (2014).

7
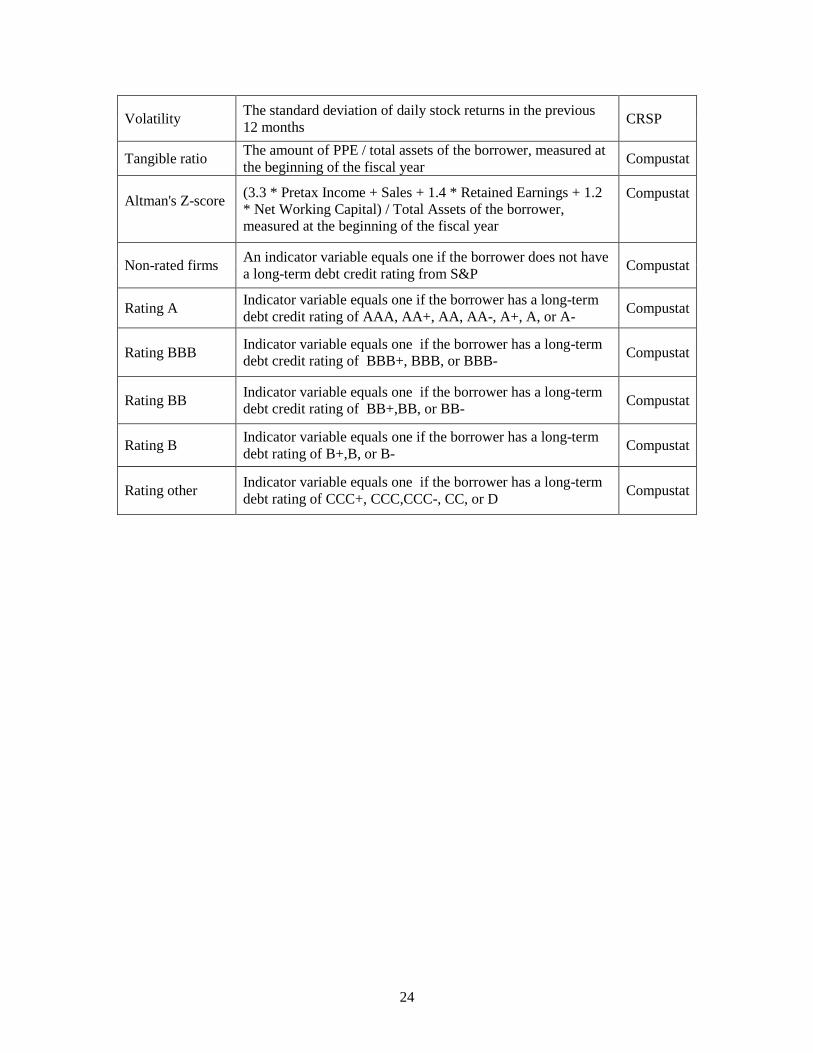
Table 1 compares the characteristics of securitized and non-securitized facilities. The
average size of securitized facility is 2.6 times larger than the average non-securitized one. The
average maturity of securitized facility is also 0.54 year longer. The average lead arranger share
in securitized facilities is 4.70%, considerably smaller than the 24.28% of non-securitized
facilities.
Securitized Term B facilities are slightly larger and of longer maturity than securitized
Term A facilities. Both lead arranger share and total bank share are larger in securitized Term A
facilities than securitized Term B facilities. The percentage of securitization is higher in Term B
facilities once a facility is securitized.
Following Nadauld and Weisbach (2012) and Wang and Xia (2014), we define leveraged
loan facilities as those issued by borrowers with ratings below BBB- as well as non-rated
borrowers. About 98% of securitized facilities are leveraged facilities, and the percentage of
securitization is larger for leveraged loan facilities than that of the investment grade facilities
once securitized.
2.3. Borrower characteristics and statistics on syndicate participants
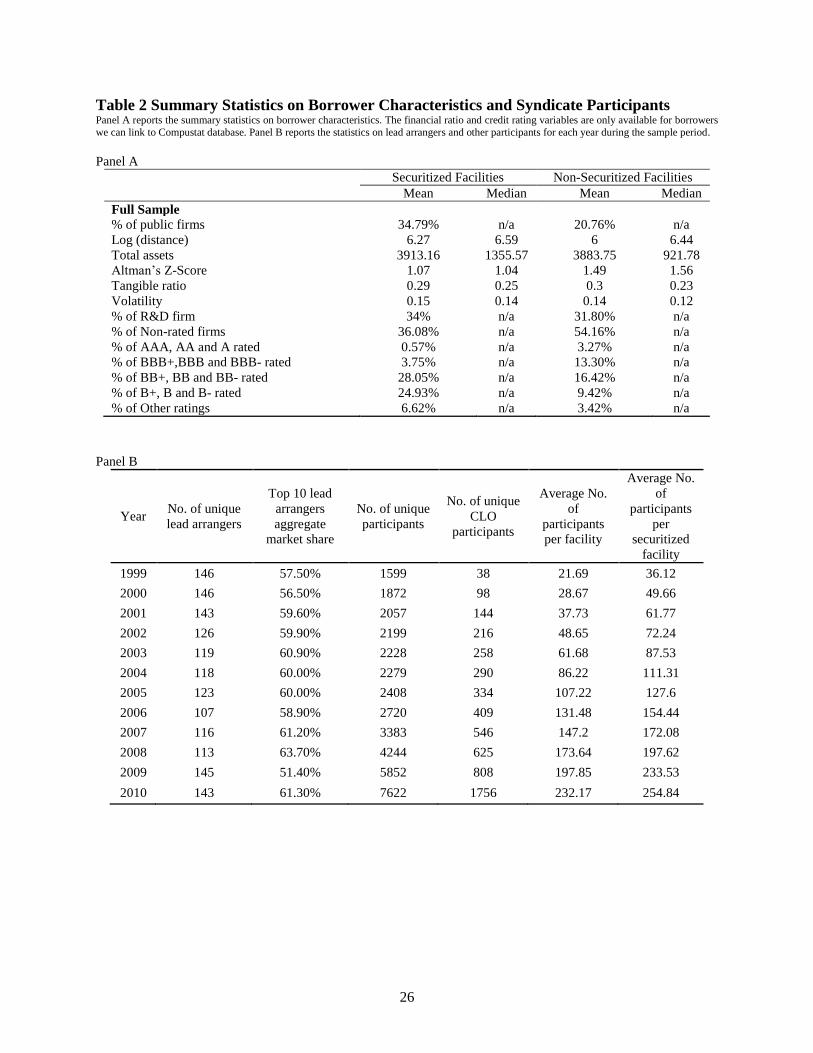
Table 2A reports borrower characteristics. 34.79% of securitized facilities are issued to
public borrowers, compared to 20.76% of non-securitized facilities. On average, securitized
facilities are issued by companies with larger total assets. The average Altman’s Z-score for
securitized facility borrowers is lower than non-securitized facility borrowers, suggesting that
borrowers of securitized facilities are more likely to be in financial distress. The average
distance between the borrower and the lead arranger is slightly longer for securitized facilities
than non-securitized ones. There is no significant difference in stock volatility of borrowers

8
across the two groups. However, their credit rating distributions are quite different. 36.08% of
the securitized credit borrowers do not have S&P long-term debt ratings, while a much higher
54.16% of non-securitized credit borrowers do not have S&P long-term debt ratings. Securitized
facilities tend to concentrate on borrowers with BB ratings (including BB, BB+ and BB -) and B
ratings (including B, B+, B-), only about 4.43% of the securitized facility borrowers have
investment grade ratings (BBB- or above). On the other hand, 16.58 % of the non-securitized
credit borrowers are rated as investment grade.
Table 2B shows that the number of lead arrangers per year over the sample period stays
relatively stable. It is noteworthy that the number of syndicated loans held by these banks is
concentrated in the top 10 largest banks, who jointly underwrite more than 50% of the loans. On
the other hand, the number of unique participants, especially CLO entities is increasing rapidly
over years. The number of CLO entities is only 38 in year 1999 and it dramatically increases to
1,756 entities by the year 2010. The average number of participants in a syndicate loan facility
also increases significantly from about 21 participants in 1999 to about 232 participants in 2010.
The average number of participants in securitized facilities is even larger than the sample
average each year. By 2010, the average securitized facility has about 254 participants.
2.4 Key variables in the empirical estimation
Syndicate structure. We examine the syndicate structure by first looking at the lead
arranger share, which is measured by the dollar amount of capital contributed by the lead
arranger over the total proceeds of this loan facility. The second dimension we look at is total
bank share, which is the aggregate dollar amount of capital contributed by all bank participants
9
as a percentage of the total loan facility proceeds.6 For securitized facilities, we also examine the
percentage of securitization, calculated as the percentage of capital contributed by all CLO
participants over the total facility proceeds. We then examine the non-CLO institutional shares,
calculated as the aggregate dollar amount of capital contributed by all non-CLO institutional
investors over total proceeds of the loan facility. Using our panel data structure, we are able to
observe both cross-sectional and time-series changes in these variables.
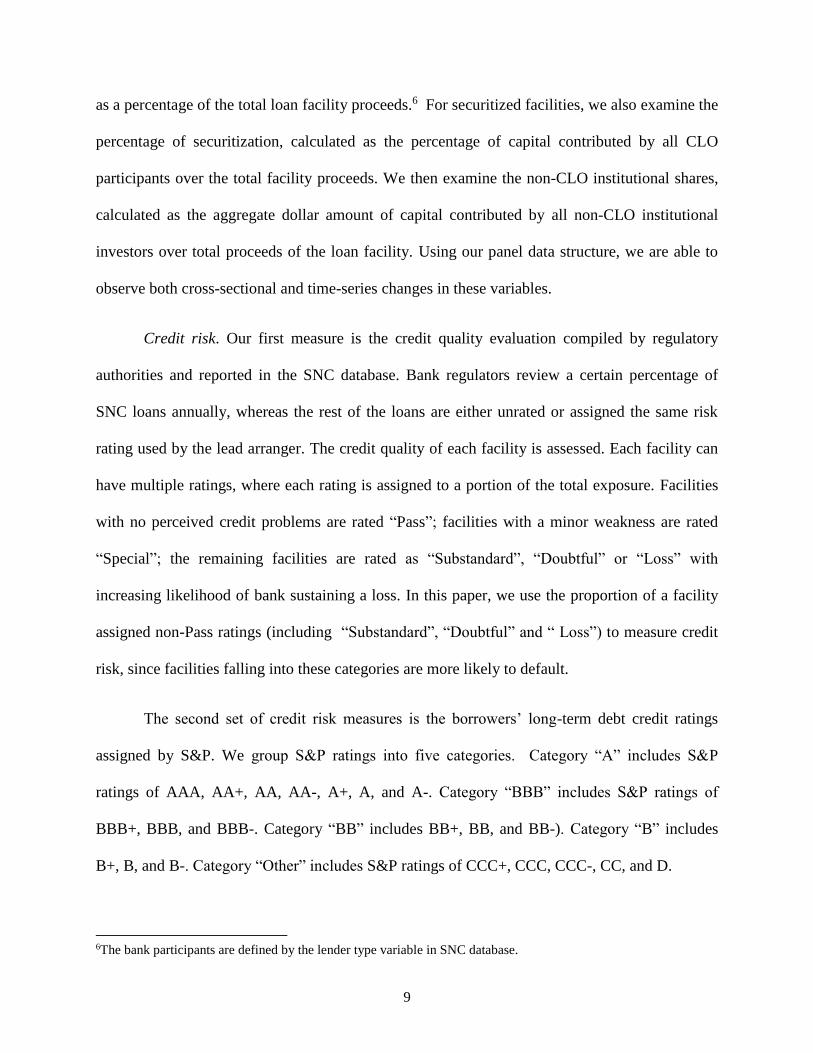
Credit risk. Our first measure is the credit quality evaluation compiled by regulatory
authorities and reported in the SNC database. Bank regulators review a certain percentage of
SNC loans annually, whereas the rest of the loans are either unrated or assigned the same risk
rating used by the lead arranger. The credit quality of each facility is assessed. Each facility can
have multiple ratings, where each rating is assigned to a portion of the total exposure. Facilities
with no perceived credit problems are rated “Pass”; facilities with a minor weakness are rated
“Special”; the remaining facilities are rated as “Substandard”, “Doubtful” or “Loss” with
increasing likelihood of bank sustaining a loss. In this paper, we use the proportion of a facility
assigned non-Pass ratings (including “Substandard”, “Doubtful” and “ Loss”) to measure credit
risk, since facilities falling into these categories are more likely to default.
The second set of credit risk measures is the borrowers’ long-term debt credit ratings
assigned by S&P. We group S&P ratings into five categories. Category “A” includes S&P
ratings of AAA, AA+, AA, AA-, A+, A, and A-. Category “BBB” includes S&P ratings of
BBB+, BBB, and BBB-. Category “BB” includes BB+, BB, and BB-). Category “B” includes
B+, B, and B-. Category “Other” includes S&P ratings of CCC+, CCC, CCC-, CC, and D.
6The bank participants are defined by the lender type variable in SNC database.

10
Information transparency/opaqueness. We use several variables to capture the degree of
information asymmetry in a facility. First of all, required SEC filing for public firms significantly
reduces the information asymmetry between the borrower and outside financers, compared to
private firms (Sufi, 2007). Credit ratings provided by rating agencies contain valuable
information and hence are an important mechanism to reduce information friction (Bosch and
Steffen, 2011). Therefore, we view public borrowers with an S&P debt rating to be more
transparent than those without such a rating. Second, a lead arranger can learn a significant
amount of information about the borrower from repeated interactions over time, reducing the
information asymmetry between the borrower and the bank (Boot, 2000). Moreover, the
existence of a prior relationship between the borrower and the lead arranger also exposes more
information to other participants in the syndicate. The third proxy of information asymmetry is
the geographic distance between a borrower and its lead arranger. Petersen and Rajan (2002)
argue that borrowers with good credit quality and more transparency can borrow from a distant
lender, whereas more opaque companies with low quality rely more heavily on local lenders who
can take advantage of collecting borrower information due to close proximity; thus, the
geographic distance between the borrower and its lead arranger can be inversely related to the
degree of information asymmetry. Lastly, Aboody and Lev (2000) find that firms with R&D
investments can have higher information asymmetry. Following their approach, we construct an
R&D firm indicator variable for firms that have reported R&D expenditures during our sample
period.
3. The Decision of Securitization

11
This section presents two analyses: (1) what factors are related to the likelihood of certain
facilities being securitized? (2) Upon securitization, what factors are related to the percentage of
a facility being securitized?
Given that a large number of facilities are not securitized, factors explaining the
likelihood of securitization may not be the same or have similar effects as those affecting the
percentage of securitization. Following Ramalho and Silva (2009) and Papke and Wooldridge
(1996), we use a two-part fraction model to estimate these two separate analyses. The first part is
a probit model estimating the securitization likelihood using the full sample, while the second
part is a generalized linear model estimating the percentage of securitization in the subsample of
securitized facilities.
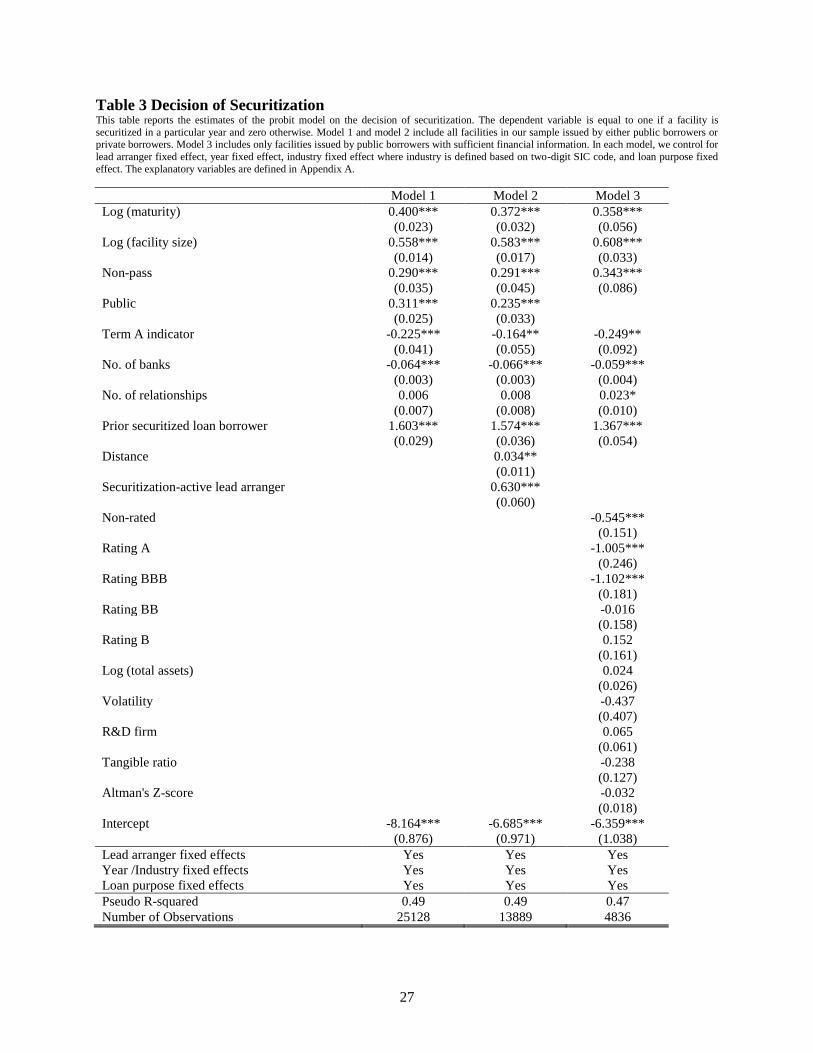
Table 3 reports the estimation of the likelihood of being securitized. The dependent
variable equals one if there is a CLO entity participating in the facility for that year. Because of
the panel structure, we are able to estimate the likelihood of securitization at any given year
during the life of a loan facility. To control for potential industry and overall economic-wide
shocks, all estimations include borrower industry, year, and lead arranger fixed effects.
From our regression results, large loan facilities with longer maturities are much more
likely to be securitized. Loan type also matters. Term A facilities are significantly less likely to
be securitized than term B facilities, perhaps because CLO entities prefer bullet payment in order
to match the cash flows of the CLOs they underwrite. The identity of lead arrangers also has an
impact on the process of securitization. Securitization-active lead arrangers are associated with a
higher likelihood of securitization.

12
Riskier facilities are more likely to be securitized. For example, a higher proportion of the
facility being assigned non-Pass ratings is associated with a higher likelihood of being
securitized. Higher S&P credit ratings also lead to higher likelihoods of securitization. These
results are consistent with the notion that CLO managers strategically invest in collaterals to
achieve certain ratings and provide sufficient returns for their investors. Indeed, Benmelech and
Dlugosz (2009) document that the majority of the CLOs have collateral pools with a weighted
average credit rating of B or BB.
More importantly, we find that transparent loan facilities are much more likely to be
securitized than opaque facilities that potentially have greater information asymmetry problems.
For instance, public firm borrowers are associated with a much higher likelihood of
securitization; on the other hand, non-rated borrowers are associated with a lower likelihood of
securitization. Well established prior lending relationships between the borrower and the lead
arranger also increase the likelihood of securitization. The geographic distance between the lead
arranger and the borrower is positively associated with the chance of securitization. Moreover, if
the company was a securitized facility borrower in the past, its new loan is also more likely to be
securitized. One potential explanation of these findings is that CLO entities tend to avoid opaque
facilities to minimize potential adverse selection issue, due to their very limited access to
borrower information compared to the lead arrangers and other bank participants.
We then estimate the percentage of securitization conditional on a facility being
securitized. According to Benmelech and Dlugosz (2009), most CLOs have restrictions on the
level of concentration in loans from a single issuer, which is typically around 2%. By
construction, the credit share held by any single CLO participant is very small; therefore,
examining the aggregate percentage share of all CLO participants in a syndicate can reveal more

13
information on the process of securitization. Interestingly, we find that although higher risk
leads to a higher chance of being securitized, it does not necessarily lead to higher percentage of
securitization. On the contrary, we find that the percentage of securitization decreases with the
proportion of the facility assigned non-Pass ratings and increases with the borrower’s Altman Z-
score. Moreover, although securitization tends to occur more often among speculative loan
facilities, better rated facilities attract significantly more CLO participants and thus have higher
percentage of securitization.
The percentage of securitization is higher in less opaque facilities. We find that both
public borrowers and distant borrowers, two measures indicating less asymmetric information,
are positively and significantly associated with the percentage of securitization. This again
suggests that CLO entities tend to prefer more transparent facilities due to their disadvantages in
getting access to borrower information.
Consistent with the argument that lead arrangers need to solicit more heavily from
institutional investors when bank capital is not sufficient to fill up the facility (Ivashina and Sun,
2011; Lim et al, 2014), we find that Term A facilities have a significantly smaller percentage of
securitization, conditional on a facility being securitized. Moreover, the number of bank
participants in a syndicate is also negatively and significantly related to both the likelihood of
securitization and the percentage of securitization. Our finding that the percentage of
securitization is significantly higher if the facility is securitized at loan origination is also
consistent with such a syndication process.
4. Securitization and the Syndicate Structure

14
4.1 Baseline analysis
Table 5 presents the analysis on the relationship between securitization and lead arranger
share as well as the relationship between securitization and total bank share. We include
variables capturing important characteristics of loan facilities and borrowing firms, as well as
fixed effects of year, borrower industry, lead arranger and loan purpose in the regressions. The
securitization indicator is always negative and significant, suggesting that both lead arranger
share and total bank share are significantly lower in securitized facilities than non-securitized
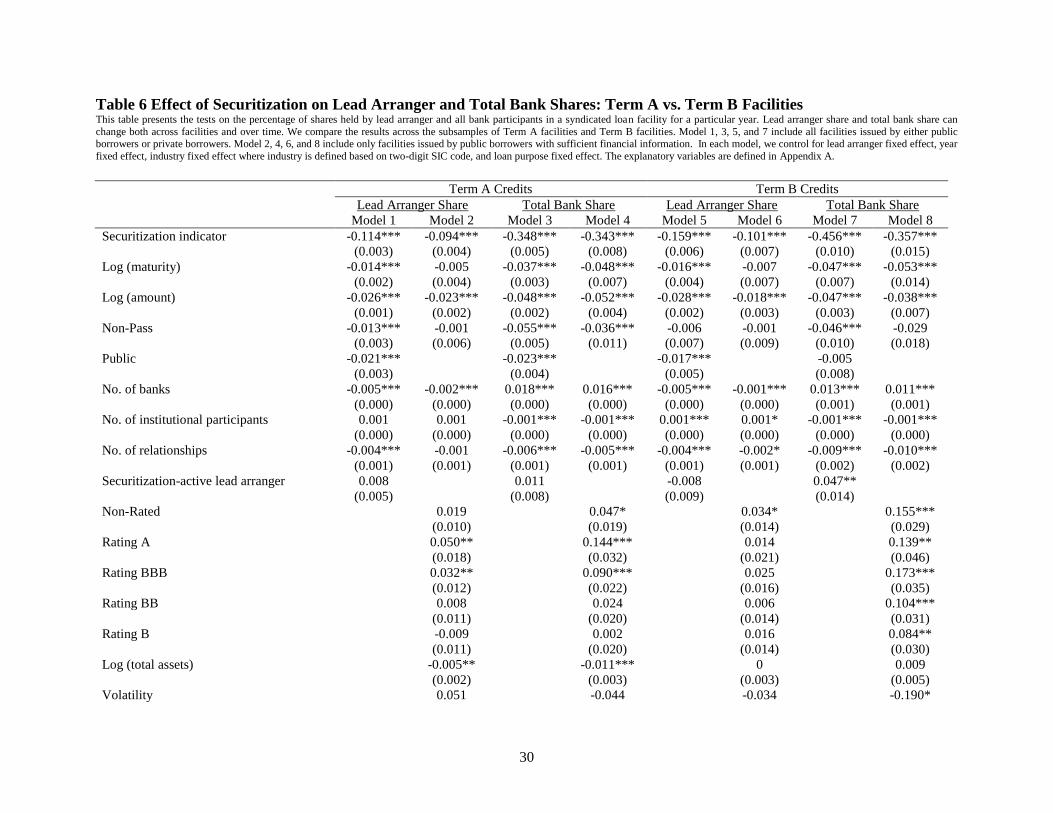
ones. We run additional regressions in the subgroup of Term A facilities with the majority of
participants being banks, and in the subgroup of Term B facilities with many non-bank
participants. Results are reported in Table 6. Securitized facilities have significantly lower lead
arranger and total bank shares in both subgroups, and the marginal effect is slightly higher in
Term B subgroup. Explicit controlling for the number of institutional participants (including both
CLO and non-CLO institutions) does not change the results. This suggests that even in
institutional investor-dominated credit facilities, CLO entities’ subscription in a syndicate has a
unique impact on the structure of the syndicate, and the effect can’t be simply explained by the
coincidence of having many institutional investors participating in the syndicates.
Other notable results are as follows: (1) both lead arranger and other bank participants
tend to hold smaller shares in facilities with longer maturity, and in facilities with higher
percentage of non-Pass ratings. In contrast, they tend to hold larger shares when the borrower has
an investment grade credit rating; (2) lead arranger and other bank participants tend to hold
larger proportions when there is greater information asymmetry, such as when the borrower is a
private firm or when the borrower is not rated by S&P. They hold smaller proportions when
there are previous lending relationships between the borrower and the lead arranger.

15
Table 7 reports our analysis on the shares held by non-CLO institutional investors, such
as insurance companies, financial companies, hedge funds, mutual funds, private equity funds
and others. The securitization indicator is positive and significant, suggesting that securitized
facilities have significantly larger non-CLO institutional shares. The same result holds in both
bank-dominated Term A facilities and institutional Term B facilities. Similar to CLO entities,
non-CLO institutional investors are also more likely to invest in transparent facilities. The non-
CLO institutional share is significantly larger when the borrower is a public firm with a credit
rating, and when a prior lending relationship exists between the borrower and the lead arranger.
Different from CLO entities, these non-CLO institutional investors hold large proportions
of risky facilities, while banks and CLO entities tend to hold relatively smaller shares. The non-
CLO institutional share is higher when a facility has a larger portion assigned non-Pass ratings,
and when the borrower has a lower credit rating or higher stock return volatility. This suggests
that institutional investors, such as hedge fund, private equity fund, insurance companies and
finance companies, play a significant role in supplying capital to riskier borrowers when both
banks and CLO entities tend to invest less.
Whether the lead arranger is actively involved in the securitization business also affects
the structure of the loan syndicates. We find that securitization-active lead arrangers hold
significantly larger shares and they can also obtain more capital from bank participants, leading
to higher total bank shares. On the other hand, securitization-active lead arrangers are associated
with significantly lower contribution from institutional investors including both CLO entities and
other financial institutions.
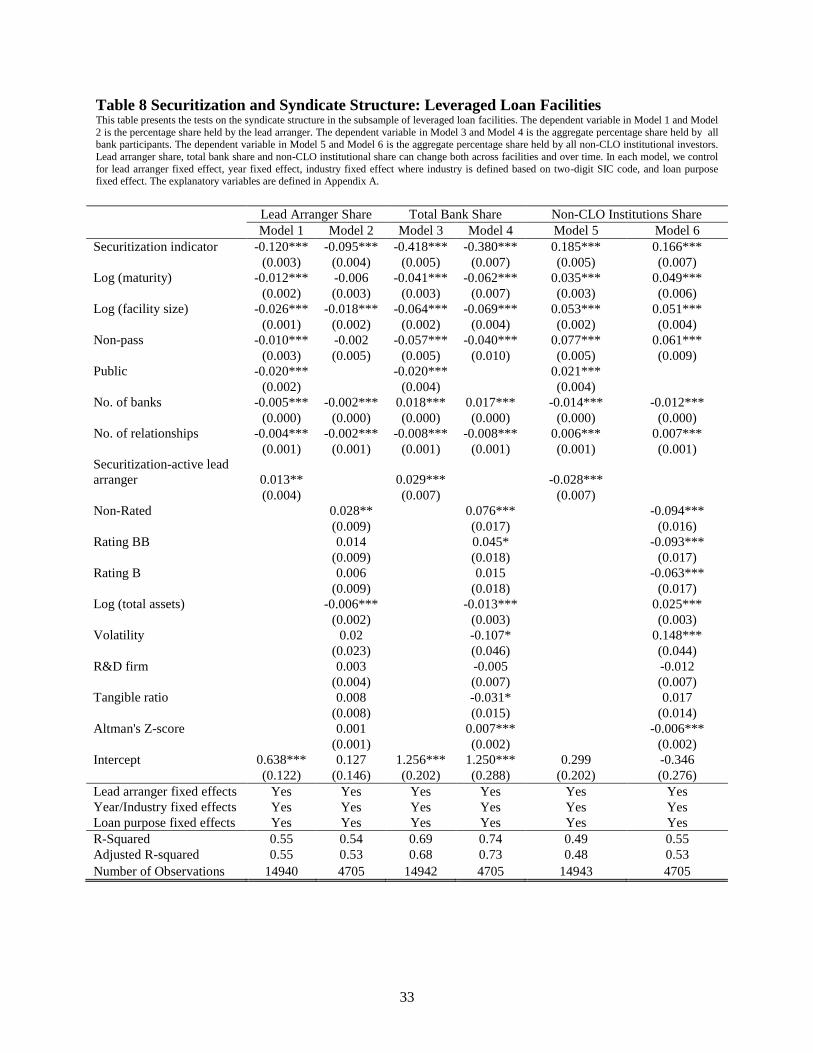
4.2. The syndicate structure of leveraged loan facilities

16
Institutional investors mainly participate in the leveraged loan segment of the syndicated
loan market, due to the higher yield arising from higher level of risk. On the other hand, banks
are generally discouraged from investing heavily in leveraged loans due to stricter bank
regulations. In this section, we examine whether the distinct features in the syndicate structure of
securitized loans is due to preference towards different market segments. More specifically, the
concern is that the differences in syndicate structure between securitized and non-securitized
facilities can reflect the differences between leveraged and investment grade facilities. Our
approach to address this issue is to focus on the subsample of leveraged facilities. Having CLO
entities investing in the syndicate again significantly lowers the lead arranger and total bank
shares, and significantly increases the shares held by non-CLO institutional investors in this
subsample. The difference remains statistically and economically significant after we control for
observable borrower, facility and lead arranger characteristics. The results suggest that
differences in the syndicate structure between securitized and non-securitized facilities are not
entirely driven by the partition of the syndicated loan market into low risk segment and
speculative high risk segment.
4.3 The effect of information asymmetry
To test the existence of a potential adverse selection issue, we examine the syndicate
structure of securitized facilities, conditional on the degree of information asymmetry in the
syndicate. We find that the interaction term of the securitization indicator and public borrower
indicator is positive and significant in determining lead arranger share, while the securitization
indicator itself is negative and significant. This result suggests that the difference in lead arranger
share between securitized and non-securitized facilities becomes significantly smaller if the
borrower is a public firm which has to disclose a great deal of information periodically and

17
presumably has less information asymmetry. On the other hand, we find the interaction term of
the securitization indicator and the non-rated firm indicator is negative and significant,
suggesting that the difference in lead arranger share between securitized and non-securitized
facilities is larger for these public borrowers without a S&P credit rating.
We interpret the above evidence as consistent with the notion of adverse selection due to
information asymmetry: lead arrangers lower their shares even more in the facilities they
originate and securitize in the presence of greater information asymmetry, precisely when lead
arranger monitoring is more valuable and mostly needed.
5. Conclusion
Using a comprehensive panel data set of 14,370 syndicated loan facilities, we examine
the key factors related to the decision of securitization and the syndicate structure of securitized
corporate loans.
Our evidence reveals that the level of riskiness and the degree of information
transparency are the two key factors driving the decision of securitization and the percentage of a
facility being securitized. We find that the syndicate structure of securitized facilities differs
significantly from non-securitized facilities. More specifically, they tend to have lower lead
arranger and total bank shares, but higher shares held by non-CLO institutional investors. This
difference is not entirely driven by participants self-selecting into different segments of the
syndicated loan market. The difference still exists even after taking into account the demand
from institutional investors. Holding the number of institutional participants (including both

18
CLOs and non-CLO institutions) and bank participants constant, the presence of CLO entities
among institutional participants has significant impact on the syndicate structure.
We find some suggestive evidence for the notion of adverse selection in the securitized
corporate loan market. For instance, our results indicate that lead arrangers tend to hold even
smaller shares in securitized facilities if the information asymmetry is greater, suggesting that
lead arrangers have stronger incentive to securitize the loans if they are in possession of some
negative private information.

19
Acknowledgement
We are very appreciative of the insightful comments and suggestions from Larry Cordell. We
also thank the participants at OCC seminar and the Interagency Risk Quantification Forum
Conference. The views expressed in this paper are those of the authors and do not necessarily
reflect the views of the Office of the Comptroller of the Currency (OCC), or the US Treasury
Department.

20
Reference
Aboody, David, and Baruch Lev, 2000, Information asymmetry, R&D, and insider gains, The
Journal of Finance 55, 2747-2766.
Benmelech, Efraim, and Jennifer Dlugosz, 2009, The alchemy of CDO credit ratings, Journal of
Monetary Economics 56, 617-634.
Benmelech, Efraim, Jennifer Dlugosz, and Victoria Ivashina, 2012, Securitization without
adverse selection: The case of CLOs, Journal of Financial Economics 106, 91-113.
Boot, Arnoud W.A., 2000, Relationship banking: What do we know? Journal of Financial
Intermediation 9, 7-25
Bord, Vitaly, and Joao AC Santos, 2014, Does securitization of corporate loans lead to riskier
lending?, Working paper
Bord, Vitaly M, and João AC Santos, 2012, The rise of the originate-to-distribute model and the
role of banks in financial intermediation, Federal Reserve Bank of New York Economic
Policy Review 18, 21-34.
Bosch, Oliver, and Sascha Steffen, 2011, On syndicate composition, corporate structure and the
certification effect of credit ratings, Journal of Banking & Finance 35, 290-299
Dennis, Steven A, and Donald J Mullineaux, 2000, Syndicated loans, Journal of Financial
Intermediation 9, 404-426.
Holmstrom, Bengt, and Jean Tirole, 1997, Financial intermediation, loanable funds, and the real
sector, The Quarterly Journal of Economics 663-691.
Ivashina, Victoria, 2009, Asymmetric Information Effects on Loan Spreads, Journal of Financial
Economics 92, 300–319
Ivashina, Victoria, and Zheng Sun, 2011, Institutional demand pressure and the cost of corporate

21
loans, Journal of Financial Economics 99, 500-522.
Jones, Jonathan D, William W Lang, and Peter J Nigro, 2005, Agent bank behavior in bank loan
syndications, Journal of Financial Research 28, 385-402.
Lee, Sang Whi, and Donald J Mullineaux, 2004, Monitoring, financial distress, and the structure
of commercial lending syndicates, Financial Management 107-130.
Lim, Jongha, Bernadette A. Minton, and Michael S. Weisbach, 2014, Syndicated loan spreads
and the composition of the syndicate, Journal of Financial Economics 111, 45-69.
Nadauld, Taylor D, and Michael S Weisbach, 2012, Did securitization affect the cost of
corporate debt?, Journal of Financial Economics 105, 332-352.
Nandy, Debarshi K. and Pei Shao, 2010, Institutional Investment in Syndicated Loans, working
paper
Narayanan, Rajesh P., Kasturi P. Rangan, and Nanda K. Rangan, 2004, The role of syndicate
structure in bank underwriting, Journal of Financial Economics 72, 555-580.
Papke, Leslie E., and Jeffrey M. Wooldridge, 1996, Econometric methods for fractional response
variables with an application to 401 (k) plan participation rates, Journal of Applied
Econometrics 11, 619-32.
Petersen, Mitchell A., and Raghuram G. Rajan, 2002, Does distance still matter? The
information revolution in small business lending, The Journal of Finance 57, 2533-2570.
Ramalho, Joaquim, and Jacinto Vidigal da Silva, 2009, A two-part fractional regression model
for the financial leverage decisions of micro, small, medium and large firms, Quantitative
Finance 9, 621-636.
Shivdasani, Anil, and Yihui Wang, 2011, Did structured credit fuel the LBO boom?, The Journal
of Finance 66, 1291-1328.

22
Sufi, Amir, 2007, Information asymmetry and financing arrangements: Evidence from
syndicated loans, The Journal of Finance 62, 629-668.
Wang, Yihui, and Han Xia, 2014, Do lenders still monitor when they can securitize loans?
Review of Financial Studies, forthcoming

23
Appendix A: Variable Definitions
Variable Definition Source
Facility level
Facility size The total proceeds of a loan facility in thousand dollars SNC
Maturity Number of years before a facility matures SNC
Non-pass
The proportion of the facility rated as "Substantial”,
“Doubtful" or "Loss" SNC
No. of banks Number of bank participants in a facility SNC
No. of
institutional
participants
Number of institutional investors including CLO entities in a
facility SNC
Lead arranger
share The proportion of the facility retained by the lead arranger SNC
Total bank share The aggregate proportion of the facility held by all bank
participants SNC
Securitization
indicator
Indicator variable equals one if there is at least one CLO entity
participating in the facility
Percentage of
securitization
The aggregate proportion of the facility held by all CLO
entities in the syndicate SNC
Non-CLO
institutional
share
The aggregate proportion of the facility held by all non-CLO
institutional investors, such as hedge funds, mutual funds,
private equity funds, insurance companies and financial
companies
SNC
Securitization-
active lead
arranger
An indicator variable equals one if the lead arranger is
securitization active. A bank is considered as securitization-
active if its CLO underwriting amount in the loan
origination year is above the mean value of all sample banks
SNC
Borrower level
Public Indicator variable equals one for public borrowers Compustat
No. of
relationships
Number of syndicated loans the firm borrowed from the same
lead arranger within previous five years SNC
Prior securitized
loan borrower Indicator variable equals one if the borrower issued loan
facilities that were securitized in previous five years
Distance
The physical distance between the headquarter of the borrower
and the location of the lead arranger. If the lead arranger is a
branch of a bank, we use the address of that branch
SNC
Compustat
search
Total assets
The amount of borrower total book assets, measured at the
beginning of the fiscal year
Compustat
R&D firm
An indicator variable equals one if Compustat reports R&D
expenditure for this borrowing firm during the sample period,
and zero otherwise (based on Aboody and Lev, 2000)
Compustat
24
Volatility The standard deviation of daily stock returns in the previous
12 months CRSP
Tangible ratio The amount of PPE / total assets of the borrower, measured at
the beginning of the fiscal year Compustat
Altman's Z-score
(3.3 * Pretax Income + Sales + 1.4 * Retained Earnings + 1.2
* Net Working Capital) / Total Assets of the borrower,
measured at the beginning of the fiscal year
Compustat
Non-rated firms An indicator variable equals one if the borrower does not have
a long-term debt credit rating from S&P Compustat
Rating A Indicator variable equals one if the borrower has a long-term
debt credit rating of AAA, AA+, AA, AA-, A+, A, or A- Compustat
Rating BBB Indicator variable equals one if the borrower has a long-term
debt credit rating of BBB+, BBB, or BBB- Compustat
Rating BB Indicator variable equals one if the borrower has a long-term
debt credit rating of BB+,BB, or BB- Compustat
Rating B Indicator variable equals one if the borrower has a long-term
debt rating of B+,B, or B- Compustat
Rating other Indicator variable equals one if the borrower has a long-term
debt rating of CCC+, CCC,CCC-, CC, or D Compustat
25
Table 1 Summary Statistics on Loan Characteristics This table provides summary statistics for securitized and non-securitized loan facilities originated between 1999 and 2010. We typically have a
few years of observations for each facility, and hence our data is an unbalanced panel. Variables are defined in Appendix A.
Securitized Loans Non-Securitized Loans
Mean Median Mean Median
All Facilities (N=14,370) (N=4199) (N=10,171)
Facility size at origination (in thousand $) 346774.8 160875 134514.3 49000
Maturity in years at origination 6 6.16 5.46 5
Lead arranger share 4.70% 0.66% 24.28% 22.22%
Total bank share 13.82% 23.82% 80.81% 89.00%
% of securitization 22.52% 19.81% 0% 0%
Term A Facilities (N=11,075) (N=2,942) (N=8,133)
Facility size at origination (in thousand $) 301062.5 150000 121449.5 46000
Maturity in years at origination 6.13 6 5.52 5
Lead arranger share 5.50% 1.54% 24.03% 22.10%
Total bank share 27.07% 16.98% 80.98% 89.01%
% of securitization 22.79% 20.00% 0% 0%
Term B Facilities (N=3,295) (N=1,257) (N=2,038)
Facility size at origination (in thousand $) 484195.5 222750 189954 64515
Maturity in years at origination 6.35 7 5.46 5
Lead arranger share 2.91% 0 25.36% 23.34%
Total bank share 16.62% 9.61% 80.08% 88.89%
% of securitization 32.81% 33.77% 0 0
Leveraged Facilities (N=13902) (N=4,132) (N=9,770)
Facility size at origination (in thousand $) 340621.2 158000 120745.8 46000
Maturity in years at origination 6.17 6 5 5.50
Lead arranger share 4.69% 0.64% 24.62% 22.86%
Total bank share 23.61% 13.74% 80.58% 88.91%
% of securitization 26.01% 24.15% 0% 0%
26
Table 2 Summary Statistics on Borrower Characteristics and Syndicate Participants Panel A reports the summary statistics on borrower characteristics. The financial ratio and credit rating variables are only available for borrowers
we can link to Compustat database. Panel B reports the statistics on lead arrangers and other participants for each year during the sample period.
Panel A
Securitized Facilities Non-Securitized Facilities
Mean Median Mean Median
Full Sample
% of public firms 34.79% n/a 20.76% n/a
Log (distance) 6.27 6.59 6 6.44
Total assets 3913.16 1355.57 3883.75 921.78
Altman’s Z-Score 1.07 1.04 1.49 1.56
Tangible ratio 0.29 0.25 0.3 0.23
Volatility 0.15 0.14 0.14 0.12
% of R&D firm 34% n/a 31.80% n/a
% of Non-rated firms 36.08% n/a 54.16% n/a
% of AAA, AA and A rated 0.57% n/a 3.27% n/a
% of BBB+,BBB and BBB- rated 3.75% n/a 13.30% n/a
% of BB+, BB and BB- rated 28.05% n/a 16.42% n/a
% of B+, B and B- rated 24.93% n/a 9.42% n/a
% of Other ratings 6.62% n/a 3.42% n/a
Panel B
Year No. of unique
lead arrangers
Top 10 lead
arrangers
aggregate
market share
No. of unique
participants
No. of unique
CLO
participants
Average No.
of
participants
per facility
Average No.
of
participants
per
securitized
facility
1999 146 57.50% 1599 38 21.69 36.12
2000 146 56.50% 1872 98 28.67 49.66
2001 143 59.60% 2057 144 37.73 61.77
2002 126 59.90% 2199 216 48.65 72.24
2003 119 60.90% 2228 258 61.68 87.53
2004 118 60.00% 2279 290 86.22 111.31
2005 123 60.00% 2408 334 107.22 127.6
2006 107 58.90% 2720 409 131.48 154.44
2007 116 61.20% 3383 546 147.2 172.08
2008 113 63.70% 4244 625 173.64 197.62
2009 145 51.40% 5852 808 197.85 233.53
2010 143 61.30% 7622 1756 232.17 254.84
27
Table 3 Decision of Securitization This table reports the estimates of the probit model on the decision of securitization. The dependent variable is equal to one if a facility is
securitized in a particular year and zero otherwise. Model 1 and model 2 include all facilities in our sample issued by either public borrowers or private borrowers. Model 3 includes only facilities issued by public borrowers with sufficient financial information. In each model, we control for
lead arranger fixed effect, year fixed effect, industry fixed effect where industry is defined based on two-digit SIC code, and loan purpose fixed
effect. The explanatory variables are defined in Appendix A.
Model 1 Model 2 Model 3
Log (maturity) 0.400*** 0.372*** 0.358***
(0.023) (0.032) (0.056)
Log (facility size) 0.558*** 0.583*** 0.608***
(0.014) (0.017) (0.033)
Non-pass 0.290*** 0.291*** 0.343***
(0.035) (0.045) (0.086)
Public 0.311*** 0.235***
(0.025) (0.033)
Term A indicator -0.225*** -0.164** -0.249**
(0.041) (0.055) (0.092)
No. of banks -0.064*** -0.066*** -0.059***
(0.003) (0.003) (0.004)
No. of relationships 0.006 0.008 0.023*
(0.007) (0.008) (0.010)
Prior securitized loan borrower 1.603*** 1.574*** 1.367***
(0.029) (0.036) (0.054)
Distance
0.034**
(0.011)
Securitization-active lead arranger 0.630***
(0.060)
Non-rated
-0.545***
(0.151)
Rating A
-1.005***
(0.246)
Rating BBB
-1.102***
(0.181)
Rating BB
-0.016
(0.158)
Rating B
0.152
(0.161)
Log (total assets)
0.024
(0.026)
Volatility
-0.437
(0.407)
R&D firm
0.065
(0.061)
Tangible ratio
-0.238
(0.127)
Altman's Z-score
-0.032
(0.018)
Intercept -8.164*** -6.685*** -6.359***
(0.876) (0.971) (1.038)
Lead arranger fixed effects Yes Yes Yes
Year /Industry fixed effects Yes Yes Yes
Loan purpose fixed effects Yes Yes Yes
Pseudo R-squared 0.49 0.49 0.47
Number of Observations 25128 13889 4836

28
Table 4 Percentage of Securitization This table presents the tests on the percentage of shares held by all CLO entities in a syndicated loan facility for a particular year. We only focus
on facilities with at least one CLO participant (securitized loan facilities). The percentage share held by all CLO entities can change both across facilities and over time. Model 1 and model 2 include all facilities in our sample issued by either public borrowers or private borrowers. Model 3
includes only facilities issued by public borrowers with sufficient financial information. In each model, we control for lead arranger fixed effect,
year fixed effect, industry fixed effect where industry is defined based on two-digit SIC code, and loan purpose fixed effect. The explanatory variables are defined in Appendix A.
Model 1 Model 2 Model 3
Log (maturity) 0.118*** 0.126*** 0.137**
(0.026) (0.033) (0.044)
Log (facility size) 0.091*** 0.109*** 0.104***
(0.012) (0.015) (0.024)
Securitized at origination 0.589*** 0.656*** 0.514***
(0.038) (0.051) (0.060)
Non-pass -0.393*** -0.357*** -0.309***
(0.030) (0.038) (0.056)
Public 0.074*** 0.01
(0.021) (0.026)
Term A indicator -0.03 -0.003 -0.179**
(0.031) (0.038) (0.057)
No. of banks -0.050*** -0.049*** -0.056***
(0.002) (0.003) (0.004)
No. of relationships 0.003 -0.001 0.007
(0.004) (0.005) (0.006)
Distance
0.024*
(0.010)
Securitization-active lead arranger -0.002
(0.049)
Non-rated
0.184
(0.105)
Rating A
0.413*
(0.191)
Rating BBB
0.158
(0.131)
Rating BB
0.348**
(0.106)
Rating B
0.309**
(0.105)
Log (total assets)
-0.074***
(0.019)
Volatility
-0.295
(0.241)
R&D firm
0.164***
(0.038)
Tangible ratio
0.078
(0.077)
Altman's Z-score
0.024*
(0.011)
Intercept -3.087*** -4.593*** -1.971***
(0.239) (0.182) (0.324)
Lead arranger fixed effects Yes Yes Yes
Year/Industry fixed effects Yes Yes Yes
Loan purpose fixed effects Yes Yes Yes
Log likelihood 3998.501 2556.612 1543.09
Number of observations 7648 4473 2301

29
Table 5 Effect of Securitization on Lead Arranger and Total Bank Shares: Full Sample This table presents the tests on the percentage of shares held by lead arranger and all bank participants in a syndicated loan facility for a particular
year. Lead arranger share and total bank share can change both across facilities and over time. Model 1 and model 3 include all facilities in our sample issued by either public borrowers or private borrowers. Model 2 and model 4 include only facilities issued by public borrowers with
sufficient financial information. In each model, we control for lead arranger fixed effect, year fixed effect, industry fixed effect where industry is
defined based on two-digit SIC code, and loan purpose fixed effect. The explanatory variables are defined in Appendix A.
Lead Arranger Share Total Bank Share
Model 1 Model 2 Model 3 Model 4
Securitization indicator -0.120*** -0.094*** -0.423*** -0.390***
(0.003) (0.004) (0.005) (0.007)
Log (maturity) -0.013*** -0.006 -0.044*** -0.060***
(0.002) (0.003) (0.003) (0.006)
Log (facility size) -0.026*** -0.019*** -0.061*** -0.066***
(0.001) (0.002) (0.002) (0.003)
Non-pass -0.011*** -0.003 -0.059*** -0.041***
(0.003) (0.005) (0.005) (0.009)
Public -0.019***
-0.015***
(0.002)
(0.004)
No. of banks -0.005*** -0.002*** 0.017*** 0.016***
(0.000) (0.000) (0.000) (0.000)
No. of relationships -0.004*** -0.002** -0.008*** -0.008***
(0.001) (0.001) (0.001) (0.001)
Securitization-active lead arranger 0.011**
0.025***
(0.004)
(0.007)
Non-rated
0.028**
0.076***
(0.009)
(0.017)
Rating A
0.051***
0.170***
(0.014)
(0.027)
Rating BBB
0.034***
0.129***
(0.010)
(0.020)
Rating BB
0.013
0.045**
(0.009)
(0.017)
Rating B
0.005
0.013
(0.009)
(0.017)
Log (total assets)
-0.003*
-0.009**
(0.001)
(0.003)
Volatility
0.02
-0.113*
(0.023)
(0.044)
R&D firm
0.004
-0.011
(0.003)
(0.007)
Tangible ratio
0.001
-0.032*
(0.007)
(0.014)
Altman's Z-score
0.001
0.007***
(0.001)
(0.002)
Intercept 0.789*** 0.979*** 1.383*** 1.524***
(0.122) (0.124) (0.205) (0.242)
Lead arranger fixed effects Yes Yes Yes Yes
Year/Industry fixed effects Yes Yes Yes Yes
Loan purpose fixed effects Yes Yes Yes Yes
R-squared 0.55 0.53 0.69 0.74
Adjusted R-squared 0.54 0.51 0.68 0.73
Number of observations 15455 5262 15456 5262
30
Table 6 Effect of Securitization on Lead Arranger and Total Bank Shares: Term A vs. Term B Facilities This table presents the tests on the percentage of shares held by lead arranger and all bank participants in a syndicated loan facility for a particular year. Lead arranger share and total bank share can
change both across facilities and over time. We compare the results across the subsamples of Term A facilities and Term B facilities. Model 1, 3, 5, and 7 include all facilities issued by either public borrowers or private borrowers. Model 2, 4, 6, and 8 include only facilities issued by public borrowers with sufficient financial information. In each model, we control for lead arranger fixed effect, year
fixed effect, industry fixed effect where industry is defined based on two-digit SIC code, and loan purpose fixed effect. The explanatory variables are defined in Appendix A.
Term A Credits Term B Credits
Lead Arranger Share Total Bank Share Lead Arranger Share Total Bank Share
Model 1 Model 2 Model 3 Model 4 Model 5 Model 6 Model 7 Model 8
Securitization indicator -0.114*** -0.094*** -0.348*** -0.343*** -0.159*** -0.101*** -0.456*** -0.357***
(0.003) (0.004) (0.005) (0.008) (0.006) (0.007) (0.010) (0.015)
Log (maturity) -0.014*** -0.005 -0.037*** -0.048*** -0.016*** -0.007 -0.047*** -0.053***
(0.002) (0.004) (0.003) (0.007) (0.004) (0.007) (0.007) (0.014)
Log (amount) -0.026*** -0.023*** -0.048*** -0.052*** -0.028*** -0.018*** -0.047*** -0.038***
(0.001) (0.002) (0.002) (0.004) (0.002) (0.003) (0.003) (0.007)
Non-Pass -0.013*** -0.001 -0.055*** -0.036*** -0.006 -0.001 -0.046*** -0.029
(0.003) (0.006) (0.005) (0.011) (0.007) (0.009) (0.010) (0.018)
Public -0.021***
-0.023***
-0.017***
-0.005
(0.003)
(0.004)
(0.005)
(0.008)
No. of banks -0.005*** -0.002*** 0.018*** 0.016*** -0.005*** -0.001*** 0.013*** 0.011***
(0.000) (0.000) (0.000) (0.000) (0.000) (0.000) (0.001) (0.001)
No. of institutional participants 0.001 0.001 -0.001*** -0.001*** 0.001*** 0.001* -0.001*** -0.001***
(0.000) (0.000) (0.000) (0.000) (0.000) (0.000) (0.000) (0.000)
No. of relationships -0.004*** -0.001 -0.006*** -0.005*** -0.004*** -0.002* -0.009*** -0.010***
(0.001) (0.001) (0.001) (0.001) (0.001) (0.001) (0.002) (0.002)
Securitization-active lead arranger 0.008
0.011
-0.008
0.047**
(0.005)
(0.008)
(0.009)
(0.014)
Non-Rated
0.019
0.047*
0.034*
0.155***
(0.010)
(0.019)
(0.014)
(0.029)
Rating A
0.050**
0.144***
0.014
0.139**
(0.018)
(0.032)
(0.021)
(0.046)
Rating BBB
0.032**
0.090***
0.025
0.173***
(0.012)
(0.022)
(0.016)
(0.035)
Rating BB
0.008
0.024
0.006
0.104***
(0.011)
(0.020)
(0.014)
(0.031)
Rating B
-0.009
0.002
0.016
0.084**
(0.011)
(0.020)
(0.014)
(0.030)
Log (total assets)
-0.005**
-0.011***
0
0.009
(0.002)
(0.003)
(0.003)
(0.005)
Volatility
0.051
-0.044
-0.034
-0.190*

31
(0.027)
(0.050)
(0.042)
(0.090)
R&D firm
0.003
-0.003
0.014*
0.002
(0.004)
(0.007)
(0.006)
(0.014)
Tangible ratio
0.013
-0.01
-0.028
-0.059
(0.008)
(0.015)
(0.014)
(0.031)
Altman's Z-score
0.001
0.006**
0.003
0.014***
(0.001)
(0.002)
(0.002)
(0.004)
Intercept 0.638*** 1.082*** 0.799*** 1.683*** 0.707*** 0.377*** 0.662** 1.004***
(0.122) (0.146) (0.197) (0.270) (0.137) (0.096) (0.211) (0.205)
Lead arranger fixed effects Yes Yes Yes Yes Yes Yes Yes Yes
Year /Industry fixed effects Yes Yes Yes Yes Yes Yes Yes Yes
Loan purpose fixed effects Yes Yes Yes Yes Yes Yes Yes Yes
R-Squared 0.54 0.53 0.68 0.75 0.63 0.59 0.79 0.80
Adjusted R-squared 0.53 0.51 0.67 0.74 0.61 0.56 0.78 0.79
Number of Observations 11936 4084 11936 4084 3519 1178 3519 1178

32
Table 7 Effect of Securitization on Non-CLO Institutional Shares This table presents the tests on the percentage of shares held by all non-CLO institutional investors in a syndicated loan facility for a particular
year. Non-CLO institutional share can change both across facilities and over time. Model 1 and Model 2 use the full sample. Model 3 and Model 4 report the results in the subsample of Term A facilities, while model 5 and model 6 report the results in the subsample of Term B facilities. In
each model, we control for lead arranger fixed effect, year fixed effect, industry fixed effect where industry is defined based on two-digit SIC
code, and loan purpose fixed effect. The explanatory variables are defined in Appendix A.
Full Sample Term A Facilities Term B Facilities
Model 1 Model 2 Model 3 Model 4 Model 5 Model 6
Securitization indicator 0.191*** 0.176*** 0.195*** 0.194*** 0.172*** 0.106***
(0.004) (0.007) (0.005) (0.008) (0.009) (0.014)
Log (maturity) 0.038*** 0.048*** 0.035*** 0.043*** 0.045*** 0.052***
(0.003) (0.006) (0.003) (0.006) (0.007) (0.014)
Log (facility size) 0.051*** 0.049*** 0.050*** 0.051*** 0.051*** 0.045***
(0.002) (0.003) (0.002) (0.004) (0.003) (0.006)
Non-pass 0.079*** 0.063*** 0.069*** 0.051*** 0.104*** 0.099***
(0.005) (0.009) (0.005) (0.010) (0.011) (0.018)
Public 0.017***
0.020***
0.005
(0.004)
(0.004)
(0.008)
No. of banks -0.013*** -0.011*** -0.014*** -0.012*** -0.009*** -0.007***
(0.000) (0.000) (0.000) (0.000) (0.001) (0.001)
No. of relationships 0.006*** 0.006*** 0.005*** 0.004** 0.009*** 0.009***
(0.001) (0.001) (0.001) (0.001) (0.002) (0.002)
Securitization-active lead arranger -0.024***
-0.011
-0.037*
(0.007)
(0.008)
(0.015)
Non-rated
-0.093***
-0.042*
-0.190***
(0.016)
(0.019)
(0.029)
Rating A
-0.201***
-0.157***
-0.236***
(0.026)
(0.031)
(0.045)
Rating BBB
-0.157***
-0.107***
-0.247***
(0.019)
(0.022)
(0.035)
Rating BB
-0.092***
-0.048*
-0.162***
(0.017)
(0.020)
(0.031)
Rating B
-0.061***
-0.013
-0.140***
(0.017)
(0.020)
(0.030)
Log (total assets)
0.020***
0.022***
0.007
(0.003)
(0.003)
(0.005)
Volatility
0.154***
0.107*
0.091
(0.042)
(0.049)
(0.089)
R&D firm
-0.004
-0.003
-0.014
(0.006)
(0.007)
(0.013)
Tangible ratio
0.025
0.006
0.046
(0.013)
(0.015)
(0.031)
Altman's Z-score
-0.006***
-0.005**
-0.015***
(0.002)
(0.002)
(0.004)
Intercept -0.053 -0.382 -0.432* -0.607* 0.242 -0.291
(0.198) (0.231) (0.197) (0.261) (0.206) (0.199)
Lead arranger fixed effects Yes Yes Yes Yes Yes Yes
Year/Industry fixed effects Yes Yes Yes Yes Yes Yes
Loan purpose fixed effects Yes Yes Yes Yes Yes Yes
R-Squared 0.49 0.55 0.48 0.57 0.56 0.59
Adjusted R-squared 0.48 0.53 0.47 0.55 0.54 0.56
Number of Observations 15455 5262 11936 4084 3519 1178
33
Table 8 Securitization and Syndicate Structure: Leveraged Loan Facilities This table presents the tests on the syndicate structure in the subsample of leveraged loan facilities. The dependent variable in Model 1 and Model
2 is the percentage share held by the lead arranger. The dependent variable in Model 3 and Model 4 is the aggregate percentage share held by all bank participants. The dependent variable in Model 5 and Model 6 is the aggregate percentage share held by all non-CLO institutional investors.
Lead arranger share, total bank share and non-CLO institutional share can change both across facilities and over time. In each model, we control
for lead arranger fixed effect, year fixed effect, industry fixed effect where industry is defined based on two-digit SIC code, and loan purpose fixed effect. The explanatory variables are defined in Appendix A.
Lead Arranger Share Total Bank Share Non-CLO Institutions Share
Model 1 Model 2 Model 3 Model 4 Model 5 Model 6
Securitization indicator -0.120*** -0.095*** -0.418*** -0.380*** 0.185*** 0.166***
(0.003) (0.004) (0.005) (0.007) (0.005) (0.007)
Log (maturity) -0.012*** -0.006 -0.041*** -0.062*** 0.035*** 0.049***
(0.002) (0.003) (0.003) (0.007) (0.003) (0.006)
Log (facility size) -0.026*** -0.018*** -0.064*** -0.069*** 0.053*** 0.051***
(0.001) (0.002) (0.002) (0.004) (0.002) (0.004)
Non-pass -0.010*** -0.002 -0.057*** -0.040*** 0.077*** 0.061***
(0.003) (0.005) (0.005) (0.010) (0.005) (0.009)
Public -0.020***
-0.020***
0.021***
(0.002)
(0.004)
(0.004)
No. of banks -0.005*** -0.002*** 0.018*** 0.017*** -0.014*** -0.012***
(0.000) (0.000) (0.000) (0.000) (0.000) (0.000)
No. of relationships -0.004*** -0.002*** -0.008*** -0.008*** 0.006*** 0.007***
(0.001) (0.001) (0.001) (0.001) (0.001) (0.001)
Securitization-active lead
arranger 0.013**
0.029***
-0.028***
(0.004)
(0.007)
(0.007)
Non-Rated
0.028**
0.076***
-0.094***
(0.009)
(0.017)
(0.016)
Rating BB
0.014
0.045*
-0.093***
(0.009)
(0.018)
(0.017)
Rating B
0.006
0.015
-0.063***
(0.009)
(0.018)
(0.017)
Log (total assets)
-0.006***
-0.013***
0.025***
(0.002)
(0.003)
(0.003)
Volatility
0.02
-0.107*
0.148***
(0.023)
(0.046)
(0.044)
R&D firm
0.003
-0.005
-0.012
(0.004)
(0.007)
(0.007)
Tangible ratio
0.008
-0.031*
0.017
(0.008)
(0.015)
(0.014)
Altman's Z-score
0.001
0.007***
-0.006***
(0.001)
(0.002)
(0.002)
Intercept 0.638*** 0.127 1.256*** 1.250*** 0.299 -0.346
(0.122) (0.146) (0.202) (0.288) (0.202) (0.276)
Lead arranger fixed effects Yes Yes Yes Yes Yes Yes
Year/Industry fixed effects Yes Yes Yes Yes Yes Yes
Loan purpose fixed effects Yes Yes Yes Yes Yes Yes
R-Squared 0.55 0.54 0.69 0.74 0.49 0.55
Adjusted R-squared 0.55 0.53 0.68 0.73 0.48 0.53
Number of Observations 14940 4705 14942 4705 14943 4705

34
Table 9 Role of Information Asymmetry This table reports the effect of securitization on lead arranger share conditional on whether the borrower is a public or private firm, and whether
the public borrower has S&P credit ratings on its existing long-term debt. Model 1 use all facilities issued by either public borrowers or private borrowers. Model 2 uses only facilities issued by public borrowers. In each model, we control for lead arranger, year, industry fixed effect where
the industry is defined based on two-digit SIC code. The explanatory variables are defined in Appendix A.
Lead Arranger Share
Model 1 Model 2
Securitization indicator -0.140*** -0.076***
(0.004) (0.005)
Public -0.033***
(0.003)
Securitization indicator * Public 0.041***
(0.005)
Non-rated 0.033** 0.052***
(0.011) (0.011)
Securitization indicator*non-rated
-0.034***
(0.006)
Log (maturity) -0.014*** -0.005
(0.002) (0.003)
Log (facility size) -0.025*** -0.019***
(0.001) (0.002)
Non-pass -0.011*** -0.002
(0.003) (0.005)
No. of banks -0.005*** -0.002***
(0.000) (0.000)
No. of relationships -0.004*** -0.002**
(0.001) (0.001)
Securitization-active lead arranger 0.011**
(0.004)
Rating A
0.063***
(0.015)
Rating BBB
0.009
(0.011)
Rating BB
0.02
(0.011)
Rating B
0.048***
(0.012)
Volatility
0.015
(0.023)
R&D firm
0.003
(0.003)
Tangible ratio
0.002
(0.007)
Log (total assets)
-0.003*
(0.001)
Altman's Z-score
0.001
(0.001)
Intercept 0.633*** 0.943***
(0.123) (0.124)
Lead arranger fixed effects Yes Yes
Year/Industry fixed effects Yes Yes
Loan purpose fixed effects Yes Yes
R-Squared 0.55 0.53
Adjusted R-squared 0.55 0.52
Number of Observations 15452 5262


![SECURITIZED MORTGAGE TRUSTS [Condedential] (Pandoras Box?)](https://static.fdocuments.us/doc/165x107/55cf8efd550346703b97c411/securitized-mortgage-trusts-condedential-pandoras-box.jpg)


