The Swedish national innovation system and its relevance...
46
c Paper no. 2010/09 The Swedish national innovation system and its relevance for the emergence of global innovation networks Cristina Chaminade ([email protected] ) Circle, Lund University, Sweden Jon Mikel Zabala ([email protected] ) Circle, Lund University, Sweden Adele Treccani (Adele Treccani ([email protected] ) Circle, Lund University, Sweden This paper has been accepted for publication in Knell, M. “National Innovation systems and global innovation networks”. This version: June 2010 Centre for Innovation, Research and Competence in the Learning Economy (CIRCLE) Lund University P.O. Box 117, Sölvegatan 16, S-221 00 Lund, SWEDEN http://www.circle.lu.se/publications ISSN 1654-3149
Transcript of The Swedish national innovation system and its relevance...

c
Paper no. 2010/09
The Swedish national innovation system and its relevance for the emergence of
global innovation networks
Cristina Chaminade ([email protected])
Circle, Lund University, Sweden
Jon Mikel Zabala ([email protected])
Circle, Lund University, Sweden
Adele Treccani (Adele Treccani ([email protected])
Circle, Lund University, Sweden
This paper has been accepted for publication in Knell, M. “National Innovation systems and global innovation networks”.
This version: June 2010
Centre for Innovation, Research and Competence in the Learning Economy (CIRCLE)
Lund University
P.O. Box 117, Sölvegatan 16, S-221 00 Lund, SWEDEN
http://www.circle.lu.se/publications
ISSN 1654-3149

WP 2010/09 The Swedish national innovation system and its relevance for the emergence of global innovation networks Cristina Chaminade, Jon Mikel Zabala and Adele Treccani
Abstract
Sweden is considered to be one of the most advanced countries in terms of innovation worldwide. Sweden always ranks high in all international reports on Science and Technology indicators such as the ones regularly published by the OECD or Eurostat. As many small countries, the Sweden economy has a strong international orientation and this is also reflected in the national innovation system. The NIS is dominated by internationally oriented industrial firms and universities. Furthermore, since 1988, the country has experienced a growing trend of mergers and acquisitions of technology intensive firms by foreign companies (Vinnova, 2006) whose presence, particularly in certain industries, is very noticeable. The aim of this paper is to explore the links between the NIS in Sweden and the participation of Swedish firms and Swedish universities in Global Innovation Networks. More specifically, it attempts to answer the following questions: a) To what extent are Swedish actors participating in GINs? b) To what extent is the Swedish NIS attracting GINs? c) What is the role of the Swedish NIS in supporting the participation of Swedish Universities and Swedish firms in GINs? d) What is the role of the Swedish NIS in attracting actors in GINs into Sweden?. The paper is based on secondary sources and has a rather descriptive nature. In its current form (June 2010) is a report submitted to the EU Commission as part of the deliverables of the INGINEUS project.
Keywords: globalization, innovations systems, Sweden
Disclaimer: All the opinions expressed in this paper are the responsibility of the individual
author or authors and do not necessarily represent the views of other CIRCLE researchers.

1
THE SWEDISH NATIONAL INNOVATION SYSTEM AND ITS RELEVANCE FOR
THE EMERGENCE OF GINs
Cristina Chaminade1 ([email protected])
Jon Mikel Zabala
Adele Treccani ([email protected])
1 Corresponding author. CIRCLE, Lund University. PO Box 117, 22100 Lund, Sweden. Tel: +46-462229893.

2
1. Introduction
Sweden is considered to be one of the most advanced countries in terms of innovation
worldwide. Sweden always ranks high in all international reports on Science and Technology
indicators such as the ones regularly published by the OECD or Eurostat. In 2009 Sweden invested a
3,75% of the GDP in R&D well above US (2,77 %) and slightly higher than Japan (2,44 %2) (OECD,
2010). The number of full time R&D employees per 1000 employees was 17,0 in 2000, only below
that of Finland (22,4) and Iceland (17,5) in the ranking of OECD countries.
As we will argue in this paper, the high performance in terms of innovation is due, among
other things to the industrial structure of Sweden, dominated by large R&D intensive multinational
groups (such as Ericsson) as well as a strong specialization in high-tech industries and services. Both
the National Innovation System as well as the Global Innovation Networks in which Sweden
participate are highly influenced by the industrial structure of Sweden.
The outstanding performance in terms of S&T has not been in parallel to an equally high
performance in terms of growth, productivity and competitiveness (Marklundet al.2004) for the whole
economy. This mismatch between innovation performance and growth has been labeled the Swedish
Paradox and it is still today the focus of many discussions on the innovation system of Sweden and its
performance (Edquist et al., 2008; Ejermo et al 2008; Kander and Ejermo, 2009). Among the possible
reasons for the relatively poor economic performance is the dominance of large R&D intensive
multinational groups, the lack of support for SMEs or the strong focus on basic research3.
As many small countries, the Sweden economy has a strong international orientation and this
is also reflected in the national innovation system. The NIS is dominated by internationally oriented
industrial firms and universities. Furthermore, since 1988, the country has experienced a growing
trend of mergers and acquisitions of technology intensive firms by foreign companies (Vinnova, 2006)
whose presence, particularly in certain industries, is very noticeable.
The aim of this paper is to explore the links between the NIS in Sweden and the participation
of Swedish firms and Swedish universities in Global Innovation Networks. More specifically, it
attempts to answer the following questions: a) To what extent are Swedish actors participating in
2 Data of 2008 3 While it is not the objective of this paper to discuss the relationship between innovation and economic performance in Sweden, the previous discussion in important to highlight why, in this paper, we will try to move beyond R&D indicators (and other S&T-based indicators) to try to provide an accurate picture of the NIS and its relationship with GINs.

3
GINs? b) To what extent is the Swedish NIS attracting GINs? c) What is the role of the Swedish NIS
in supporting the participation of Swedish Universities and Swedish firms in GINs? d) What is the role
of the Swedish NIS in attracting actors in GINs into Sweden?
GINs in this paper are defined as “globally organized networks of interconnected and
integrated functions and operations by firms and non-firm organizations engaged in the development
or diffusion of innovations” (Chaminade, 2009:12). GINs embrace three forms of globalization of
innovations: global research collaboration, global sourcing of technology and innovations and global
generation of innovations (technology based FDI) (Archibugi and Mitchie, 1995; Plechero and
Chaminade, 2010). The global research collaboration alludes to the collaboration of different partners
from different countries in the development of know-how or innovation. This collaboration can take a
variety of forms, including R&D joint-ventures, R&D alliances, contractual R&D, etc. and can involve
a variety of organizations, including firms, research centers, universities, government, etc. The global
sourcing of technology refers to the acquisition or import of technology (machinery, patents, know-
how, etc) from a different country. The global generation of innovations refers mainly to the location
of R&D activities in a different country and it is associated with R&D related foreign direct
investment.
In this paper, we also make a distinction between global innovation networks (GINs) and
regional innovation networks (RINs) (Chaminade, 2009). GINs have a global geographical spread and
engage actors beyond the traditional Triad (in our case, we are interested in the involvement of
organizations from BICS). RIS are international networks confined to a specific supra-national region
– for example, within the European Union. In this paper, we consider North-North networks –that is,
networks within the Triad as RINs and those involving actors outside the Triad as GINs.
A final note on the data used in this paper. For the tables and graphs presented in this paper
we have tried to use the latest data available, which is 2008 for most of the statistics produced in
Sweden and 2004-2006 for international statistics, such as the Community Innovation Survey
(Eurostat) or those published by the OECD.
2. Main actors in NIS and their international dimension
In international comparison, one could say that Sweden industrial structure is characterized
by a comparatively large knowledge-intensive and export-oriented manufacturing sector, a relatively
small private service sector but a comparatively large public service sector. Both the public and the
private sector are dominated by large organizations.

4
The Swedish National Innovation System (NIS) is quite polarized into two main groups of
actors: on the one hand a small number of large multinational groups –about 10- and, on the other
hand, a similar number of universities. These two groups are responsible for a larger part of the R&D
performed in Sweden (Marklund et al, 2004).
2.1. Firms
In relation to the size of its economy Sweden has a broad industrial structure with world-
leading international companies such as Ericsson (ICT), AstraZeneca (Pharmaceuticals), Volvo,
Scania and Autoliv (Automotive), Industrial machinery (ABB), Packing (Tetrapack), Household
appliances (Electrolux). These large multinational companies have a great impact on the functioning
of the NIS and, at the same time, are responsible for the high degree of participation of the Swedish
innovation system in GINs, They use extensively GINs in their innovation strategy, including global
collaboration, sourcing and generation of innovations, as we will discuss later.
In 2004, the number of foreign affiliates in Sweden was 9273 which represents barely a 1,2 % of the
national total. They are concentrated in Telecommunications (15% of the units) followed by air
transport (10% of the units) and electricity, gas and water supply. Despite their marginal importance in
terms of number, they contribute significantly to the country’s turnover, as plotted next.
Graph 1. – Percentage distribution of national turnover of domestic and foreign-affiliated companies in services and manufacturing (2004).
Source: OECD (2008)
28,6%
39,9%
71,4 %
60,1%
0
10
20
30
40
50
60
70
80
Services Manufacturing
Foreign‐owned
Domestic

5
Around 7217 firms have introduced product or process innovation in the period 2004-2006
(Eurostat, 2007), which represents 44,6 percent of the sampled population. The proportion of
innovative firms is higher in manufacturing than in services, reflecting also the presence of large
multinational companies in manufacturing.
Graph 2. - Enterprises in Sweden – percentage (2004-2006).
* Excluding public administration - Source: Eurostat (2007) – CIS (2004-2006)
As it would be expected the proportion of innovative firms to total population is directly
related to the size of the firm. The proportion of innovative firms in large firms is higher than in small
firms. Yet the proportion of SMEs that are innovative in Sweden is quite high, particularly in
manufacturing and next graph shows.
44,6%
51,6%
38,7%
29,2%
32,6%
24,6%
8,6% 8,4%
0
10
20
30
40
50
60
All NACE Manufacturing Services*
Enterprises with innovation activities
Enterprise is part of a group
Head office in other countries

6
Graph 3. – Enterprises with innovation activities in Sweden, percentage distribution by size of the firm (2004- 2006).
Source: Eurostat (2007) – CIS (2004-2006)
2.2. Universities and research centers
Similarly to the business sector, the university sector is dominated by approximately 10
universities which are responsible for almost all R&D performance in the country: The Karolinska
Institute, Chalmers University of Technology, Uppsala University, Lund University, Gothenborg
University, the Royal Institute of Technology (KTH), Stockholm University, Linköping University
and Luleå University being the most important ones. The size of the universities in terms of the
number of students (FTE) in 2008 is plotted next:
40,5%
46,3%
36,7%
56,9%
64,1%
46,9%
74,2%
64,1%
60,6%
0
10
20
30
40
50
60
70
80
Total Manufacturing Services
10‐49
50‐249
More 250

7
Table 1. - Number of students enrolled in the 10 largest Swedish Universities (2008).
University Number of Students FTE
Lund University 24600
Gothenburg University 24100
Stockholm University 22400
Uppsala University 19900
Linköping Univ. 16900
Umeå 15600
Linnaeus Univ. 15000
Royal Institute of Technology (KTH) 11700
Chalmers 8471
Source: Swedish Higher Education Authority (2009)
With few exceptions (Karolinska Institute and the Royal Institute of Technology), most of
the funding of Swedish Universities comes from the public sources (regional and national government
and EU) and only a small proportion (approximately 11%) is funded by private firms and foundations,
as shown next:
Graph 4. - Sources of funding of Swedish universities.
Source: Authors’ with data from SNAHE (2010).
Additionally, Sweden has a number of University Colleges (Swedish Högskola) that provide
degrees at graduate (University diplomas and Bachelor degrees) and post-graduate level (Master and
Doctorate). In comparison with Universities, University colleges are usually specialized in just one
academic discipline. For example, Blekinge Institute of Technology and Mälardalen University are
Government80%
Other public funding7%
Companies and non‐profit
11%
Financial revenues
2%

8
specialized in Engineering, while Stockholm School of Economics is in Business and Economics and
Malmö University (although is currently diversifying) has a strong focus on Medicine.
With regards to Research Institutes, the Swedish R&D institute sector is one of the smallest
in the OECD, mostly due to the fact that almost all public R&D investments go to the Universities in
Sweden (Marklund et al, 2004). Despite their small size, they are active in a variety of industries.
Some of the most important ones are the Swedish Defense Research Agency (FOI) (aprox. 1250
employees), the industrial research institutes (jointly owned by the government and industrial
associations, employing aprox. 2100 employees) and other government research institutes and
agencies like the Swedish Institute for Infectious Disease Control or the National Institute for Working
Life, employing aprox. 430 researchers full time (VINNOVA, 2006).
3. Competences in the Swedish NIS and their potential role in GINs
3.1. Human capital and its international dimension
3.1.1. Tertiary education in Sweden
Although the proportion of higher educated people in Sweden is high, Sweden is not at the
top of the OECD rankings that measure the proportion of higher educated people to the total
population. Table 2 summarizes the number of students participating in tertiary education in 2006 in
total and as a proportion of the population between 20-26.
Table 2. - Number of students enrolled in Tertiary education (all cycles) and number of Graduates (2006) Students enrolled in tertiary education Graduates 2006
Total numbers % population 20-29 Total numbers % population 20-29
In any field 422614 39,1 60762 5,6
In Science, Maths and
Computing
43910 3,8 -- --
In Engineering,
Manufacturing and
Construction
68846 6,4 -- --
Source: Eurostat (2009)
Since 2008, tertiary education in Sweden has been divided into three cycles: Bachelor,
Master and PhD, which is showing different trends over time. While the number of degrees awarded to
9
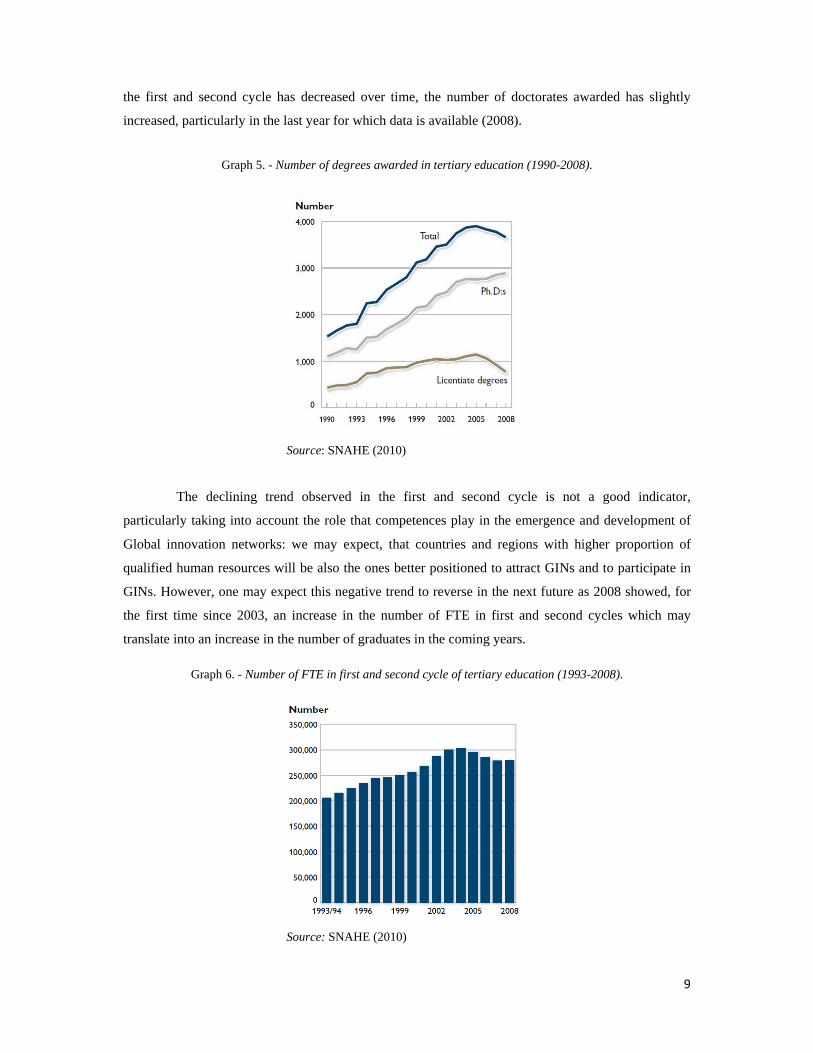
the first and second cycle has decreased over time, the number of doctorates awarded has slightly
increased, particularly in the last year for which data is available (2008).
Graph 5. - Number of degrees awarded in tertiary education (1990-2008).
Source: SNAHE (2010)
The declining trend observed in the first and second cycle is not a good indicator,
particularly taking into account the role that competences play in the emergence and development of
Global innovation networks: we may expect, that countries and regions with higher proportion of
qualified human resources will be also the ones better positioned to attract GINs and to participate in
GINs. However, one may expect this negative trend to reverse in the next future as 2008 showed, for
the first time since 2003, an increase in the number of FTE in first and second cycles which may
translate into an increase in the number of graduates in the coming years.
Graph 6. - Number of FTE in first and second cycle of tertiary education (1993-2008).
Source: SNAHE (2010)

10
3.1.2. International mobility of students
The higher education system in Sweden has very strong international linkages. About 13%
of the Swedish students enrolled in tertiary education studied abroad in 2008 (SNAHE, 2010). In the
same year, more than 31000 foreign students came to Sweden, almost tripling the amount of foreign
students one decade ago. The result is that since 2005/2006 the number of foreign students coming to
Sweden has exceeded the number of outward students (Swedish students going abroad).
Graph 7. - Number of Outgoing/Incoming students (1997/98-2007/2008)
Source: SNAHE, 2010.
The geographical spread of the student exchange has also varied over the last years.
Although still two out of three Swedish students that go abroad travel to Europe, the proportion of
students that chose to go to Asia in the last year is six times higher than in 2001/02. Similarly, about
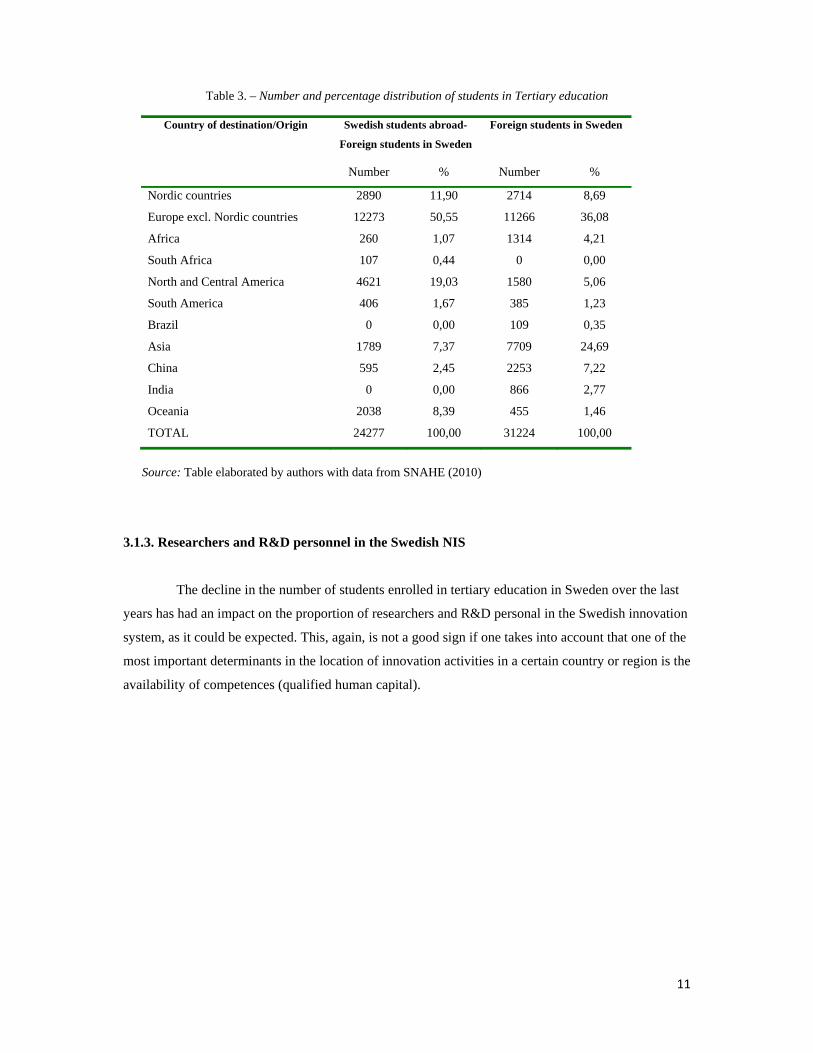
35 per cent of the students that had arranged their own studies in Sweden came from Asia. Table 3
summarizes the countries of origin and destination of students in Tertiary education. The proportion of
students to and from the BICSs countries is also included when available.
11
Table 3. – Number and percentage distribution of students in Tertiary education
Country of destination/Origin Swedish students abroad-
Foreign students in Sweden
Foreign students in Sweden
Number % Number %
Nordic countries 2890 11,90 2714 8,69
Europe excl. Nordic countries 12273 50,55 11266 36,08
Africa 260 1,07 1314 4,21
South Africa 107 0,44 0 0,00
North and Central America 4621 19,03 1580 5,06
South America 406 1,67 385 1,23
Brazil 0 0,00 109 0,35
Asia 1789 7,37 7709 24,69
China 595 2,45 2253 7,22
India 0 0,00 866 2,77
Oceania 2038 8,39 455 1,46
TOTAL 24277 100,00 31224 100,00
Source: Table elaborated by authors with data from SNAHE (2010)
3.1.3. Researchers and R&D personnel in the Swedish NIS
The decline in the number of students enrolled in tertiary education in Sweden over the last
years has had an impact on the proportion of researchers and R&D personal in the Swedish innovation
system, as it could be expected. This, again, is not a good sign if one takes into account that one of the
most important determinants in the location of innovation activities in a certain country or region is the
availability of competences (qualified human capital).

12
Graph 8. - Total Researchers and R&D personnel per thousand total employment 2004/2008).
Source: Authors’ own elaboration with data from OECD (2010)
The business sector has traditionally the most important employer of R&D personnel in
general and of researchers in particular and its importance in relative terms has increased over time, as
next graphs show:
Graphs 9. - Percentage distribution of R&D personnel (FTE) between Business enterprises, Higher Education and Government in Sweden (2004 and 2008).
Source: Authors’ own elaboration with data from OECD (2010)
0
2
4
6
8
10
12
14
16
18
20
2004 2005 2006 2007 2008
Total researchers per thousand total employment
Total R&D personnel per thousand total employment
Total Business
Enterprise R&D
personnel (FTE)65%
Higher Education
Total R&D
personnel (FTE)31%
Government Total R&D
personnel (FTE)
4%
2004
Total Business
Enterprise R&D
personnel (FTE)76%
Higher Education
Total R&D
personnel (FTE)20%
Government Total R&D
personnel (FTE)
4%
2008

13
3.2. Knowledge base in firms
3.2.1. Human capital in firms
One of the most important sources of innovation for any firm is its employees and one of the
most conventional indicators of the qualification of human resources in firms is the proportion of
employees with a university degree. People with a higher education degree in Sweden are to be found
mainly on the high-tech manufacturing groups (usually the large MNCs that dominate the Swedish
NIS), some knowledge intensive services (KISs) and Universities, once again reflecting the polarized
structure of the system of innovation. The proportion of scientists and engineers that are currently
employed in KISs has increased very rapidly in the last years and currently employ more scientist and
engineers than in the manufacturing industry (Marklund et al, 2004).
Next table 4, provides information on the country of origin of the R&D personnel employed
in major Swedish groups. It is worth pointing out at the increase in the number of R&D personnel
from China between 1997 and 2007- from 2 to 2046 R&D employees. None of the other groups have
experienced such a dramatic increase.
Table 4. Number R&D person-years (full-time annual equivalents) in major international Swedish groups
Country/region R&D person-year 1997 1999 2001 2003 2005 2007
Total in world 45135 38846 40037 30803 38204 45614
Sweden 27517 22022 20923 19085 21720 23239
Abroad 17618 16824 19114 11718 16484 22375
EU15 10013 8814 10475 7053 8902 11983
China 2 107 313 388 974 2046
India 30 9 286 2 120 429
South America 332 216 401 256 323 398
USA 3865 4440 4249 1814 3421 3838
Source: ITPS (2007)
The level of education provides an indication of the stock of knowledge but not about how
the firm uses that knowledge. In a recent study, Lorenz and Lundvall (Forthcoming) discuss the
proportion of creative workers in a selection of European firms and its impact in innovation. As it can
be observed, the Scandinavian countries, who are also the ones that perform better in terms of
innovation in Europe, are also the ones showing a higher proportion of firms with creative workers in
striking contrast with countries in the South and East of Europe. This is particularly relevant, when

14
one sees that the proportion of creative workers seem to be positively correlated with the innovation
performance of firms (Lorenz and Lundvall, Forthcoming).
Table 5. - National differences in types of learners in firms (EU 27) (percent of occupied persons by country and type of learner)
Creative Worker
Routine problem solvers
Taylorized workers
Total
NORTH
Sweden 82 10 8 100
Denmark 70 15 14 100
Finland 66 21 13 100
SOUTH
Greece 39 33 28 100
Italy 37 29 34 100
Spain 35 30 36 100
EAST
Lithuania 35 27 38 100
Romania 35 38 27 100
Slovakia 33 22 35 100
EU-27 51 24 25 100
Source: Lorenz and Lundvall (forthcoming)
3.2.2. R&D in firms
As indicated earlier, the R&D system in Sweden is concentrated in a small number of large
multinationals and some of the oldest universities in the country. Furthermore, the industry is, by far,
the main financing and performing actor when it comes to gross domestic expenditure in R&D
(GERD) as next graph shows:
Graph 10. - R&D expenditure; Performing and Financing (2007)

15
Source: Authors’ based on OECD (2010)
Foreign firms have traditionally played a major role in the R&D expenditures of the country
(GERD) however their importance has been diminishing over time. The country of origin of the
largest R&D investors in Sweden is USA and the United Kingdom. The statistics do not provide
specific information on the R&D investment of MNCs from any of the BICS countries part of
INGINEUS however, the amount of investments that comes from MNCs whose headquarter is in
USA and Europe is barely 1,9 % of the total R&D investments of foreign firms in Sweden, giving an
indication of the regionalization (and not globalization) of inward R&D.
Graph 11. - R&D expenditure of domestic vs foreign affiliates. Percentage (2005 and 2007).
Source: Authors’ based on OECD (2010)
Industry74%
Higher Education
21%
Government
5%Non-profit
private0%
Performing
Industry64%
Government
22%
Other national sources
5%
Abroad9%
Financing
42,25835,48
57,74264,52
0%
10%
20%
30%
40%
50%
60%
70%
80%
90%
100%
2005 2007
R&D expenditure of domestic firms as percentage of R&D expenditures enterprises
R&D expenditure of foreign affiliates as a percentage of R&D expenditures of enterprises

16
3.2.3. Specialization/clusters
Global innovation and production activities are attracted to certain regions or clusters which
have accumulated competences in a particular industrial area. It is therefore important to understand
which are the clusters in which the country (and the national innovation system) is specialized. In the
case of Sweden, those areas of specialization are cleantech, automotive, ICT, materials science and life
sciences (ISA, 2009):
Cleantech: One of the newest clusters in Sweden is the one of Clean or Green Technologies
(Cleantech) and, particularly of Biofuels, wind power and solar cell manufacturing. Somehow, the
cleantech cluster has built upon the accumulation of competences of Sweden in engineering. The
cluster is located in Stockholm (including Uppsala) to the north.
Automotive: Sweden has a long tradition in automotive innovation which is built on a long
specialization in the production of passenger and commercial vehicles. Although the industry is
currently under re-structuration (Volvo cars has been acquired by the Chinese Geely and Saab by the
dutch Spyker), some of the most innovative companies worldwide in car safety (for example Autoliv)
and Intelligent transport systems have their headquarters in Sweden, like Autoliv. The cluster has
attracted production and innovation activities worldwide, including MNCs subsidiaries from BICS
countries like Bharat Forge from India. The cluster is located around Gothenburg.
Information and Communication Technologies (ICT): One of the most important clusters
in Sweden is that of ICT, particularly mobile communications, media (IPTV) and computer games.
Three are the main factors that explain the specialization of Swedish NIS in ICTs: the presence of
world leaders in communication technologies, like Ericsson; the pool of qualified human resources in
related communication technologies; and the demand of the customers. One of the main drivers of
innovation in the ICT industries is the proximity to the customer (Pavitt, 1984). Swedish customers are
among the quickest in the world to adopt new applications and services (ISA; 2009: 8), which makes
Sweden a good test market for new applications. This clusters has attracted a large number of R&D
centers from MNCs all over the world, including some from BICS countries, like TCS and Infosys
from India or ZTE, Huawei and Lenovo from China. The cluster is mainly located in Kista, in the
outskirts of Stockholm although there are two emerging clusters in Skåne (for computer games) and
Linköping (for web servers and IPTV).
Materials science: The specialization of the Swedish NIS in materials science can be
explained by the combination of research specialization at the University and the accumulation of

17
industrial know-how in paper and pulp and packaging technologies based on cellulose fiber –like
Tetrapack- (another offspring of the forestry past of Sweden). Sweden will be hosting the largest
European research facility for materials research – the European Spallation Source (ESS). In contrast
with the previous clusters, the materials science cluster is spread all over the country: e.g. materials
research on packaging in Lund and Stockholm and material research related to textiles in Borås (close
to Gothenburg).
Life sciences: As in the previous case, the specialization in life sciences is based on the
combination of world class research institutions (for example. The Karolinksa Institute in Stockholm)
and medical universities and a cluster of large multinational companies in biotechnology (including
biomed) and pharmaceuticals like Astra Zeneca, Elektra, Gambro or Pharmacia. There are two main
clusters in Life Sciences, one in the South of Sweden – the Medicon Valley- and another one in
Stockholm, which have specialized in biotech tools, diagnostics, medical devices, biomaterials and
regenerative medicine.
3.3. Knowledge base in Universities and Research centers
Higher education institutions are responsible of 20% of the R&D performed in Sweden as
shown in Graph 9. Although it is not possible to find the breakdown of that R&D investment by
subject areas, it is possible to have a rough idea by looking at the distribution of R&D employees by
subject areas in Swedish Universities. As can be observed, most R&D personnel are concentrated in
medicine, engineering and live sciences.
Graph 12. - Proportion of R&D man-years (FTE) at Swedish universities in 2003distributed by subjects.
Source: SCB, ”Forskning och utveckling inom universitet och högskolesektorn 2005”

18
4. Innovation networks and their international dimension
As indicated in the introduction to this report, we distinguish between 3 forms of
globalization of innovation and, as a consequence, global innovation networks: global research
collaboration, global sourcing of technology and global generation of innovations. For analyzing these
three forms, we use the information on collaboration in innovation from the innovation survey, the
imports of high-tech products and the R&D FDI respectively.
4.1. Global research collaboration
The innovation survey provides information on the collaboration in innovation by partner
and by the country of origin of the partner separately. As can be observed in Graph 13, about 78 % of
Swedish innovative firms have cooperated with suppliers in their innovation process and 64% have
done so with clients and customers. This result is different from the average in Europe at least in one
respect: the most important partner for collaboration in innovation in Europe is the customer, while in
Sweden is the supplier. This difference can be explained by the industrial specialization of Sweden in
industries in which suppliers of technology play a fundamental role in the innovation process:
automotive, clean tech, ICT, etc. These are also the industries that concentrate a larger proportion of
the R&D in manufacturing and host some of the largest companies as well.
Graph 13. - Percentage of innovative firms that have collaborated in innovation by partner (2004-2006).
Source: Authors’ with CIS data (Eurostat, 2007)
0 10 20 30 40 50 60 70 80 90
Cooperation with suppliers of equipment, materials, components or software
Cooperation with clients or customers
Cooperation with Universities or higher education institutions
Cooperation with consultants, commercial labs or private R&D institutes

19
Looking at the origin of the partners, we can see that most of the research & innovation
networks are either national or European; that is, we are mainly talking about regional innovation
networks (RINs) and not about global ones (GINs). However it is worth mentioning that about 20% of
the SMEs (less than 250 employees) and 30% of the large firms have some form of collaboration in
innovation with China and India.
Table 6. - Percentage of firms that cooperate in innovation by size and location of the partner.
Total Sweden Other Europe USA China and India Other
Below 10 employees 40 94 63 30 18 22
10-49 employees 37 94 58 28 16 21
50-249 employees 43 96 69 29 20 23
More 250 employees 65 95 83 43 31 28
Source: Authors’ own elaboration with CIS data (Eurostat, 2007)
Graph 14. - Cooperation in innovation by origin of the partner
Source: Authors’ own elaboration with CIS data (Eurostat, 2007)
4.2. Global sourcing of technology
As a proxy of the global sourcing of technology we will use the technology balance of
payments (TBP) data published by the OECD (2009). The TBP informs about the trade of
disembodied technology between one country and the rest of the world. It includes the receipts and
payments for the transfer of techniques (through patents, licenses, know-how), the transfer of designs,
Same country (94%)
Same country (89%)
Partner EU(61%)
Partner US and other countries
(28%)
Abroad (11%)
0
500
1000
1500
2000
2500
3000
3500
Manufacturing (total=1586) Services (total=1574)
Cooperation in innovation

20
trademarks and patterns, trade of services with a technical content (like technical and engineering
studies or technical assistance) and industrial R&D. It does not include information on the acquisition
of embodied technology, such as machinery.
As it can be observed in Graph 15, Sweden has a positive TBP, receiving more
payments for technology licensing and services abroad than what the country pays for technology and
services acquired from abroad. The global sourcing of (disembodied) technology in Sweden4 is
relatively small as compared to USA, Germany, Ireland and the United Kingdom but still quite
superior to many other European countries5.
Graph 15. - Main Science and Technology Indicators (2009).
Source: OECD (2010)
4 Measured by the payments
5 Regretfully, the data published by the OECD does not include information on the origin and destination of the technology payments to assess the geographical spread of the global sourcing of technology.
0 20000 40000 60000 80000 100000
Greece
Luxembourg
Portugal
Czech Republic
Norway
Hungary
Italy
Poland
Austria
Japan
Spain
Finland
Belgium
Sweden
United Kingdom
Ireland
Germany
United States
Payments (million current dollars)
Receipts (million current dollars)

21
4.3. Global generation of technology
4.3.1. Inward R&D
Inward R&D investment is measured by the R&D expenditure of foreign-owned affiliates in
a certain country. As shown in Graph XX, in 2007 foreign affiliates were responsible for about 35,48
% of the total R&D expenditure in Sweden, which is very high. However, inward R&D has decreased
in the past few years, both in absolute terms (expenditure in million SEK) as well as a percentage of
the R&D expenditures of the business sector, as graph 16 shows.
Graph 16. - Inward R&D – R&D expenditure by foreign-owned affiliates in Sweden (1990-2007).
Source: OECD (2010)
The latest available data on the distribution of R&D expenditures of foreign enterprises in
Sweden by country of origin which is dated in 2005, shows the predominance of R&D investments
from UK and USA foreign affiliates as compared to affiliates from other parts of the world. Once
again, the predominance of European affiliates is clear.
0
5
10
15
20
25
30
35
40
45
50
R&D expenditure of foreign affiliates as a percentage of R&D expenditures of enterprises

22
Graph 17. - Distribution of R&D expenditures of foreign affiliates in Sweden by country of origin (2005).
Source: ITPS (2007)
4.3.2. Outward R&D – country of destination
The distribution of outward R&D by country of destination is very similar to inward R&D
interms of the predominance of Europe. However, it is important to note that about 3% of the outward
R&D is to China and another 3% to India.
Graph 18. – Outward R&D in Sweden (2005).
Source: ITPS (2007)
UK 36%
USA 34%
Switzerland 6%
Netherlands 6%
Germany 4%
Finland 5%
Norway 2%
France 1%
Denmark 1%
Canada 1%
Other countries
4%
Inward R&D 2005
EU48%
North America
26%
China3%
India3%
South America
5%
Other15%
Outward R&D 2005

23
In sum, Sweden has strong international linkages in innovation, particularly with regards to
global scientific collaboration and global generation of innovations. However, the geographical spread
of these networks is still more regional (confined to Europe and USA) than truly global. With the data
available, it is too early to say if this trend will reverse in the near future, although we can see a
growing role of China as partner in research and innovation as well as a destination of global R&D
which could be interpreted as an increasing globalization (as opposed to regionalization) of Swedish
firms.
5. Institutional frameworks and GINs
In Sweden the private sector is the main source of R&D funding. Public funds for R&D are
usually directed towards Higher Education Institutions (HEIs) or through research councils, publics
foundations or sectoral agencies (Forskning.se, 2009). Public research institute play a minor role
except in the area of Defense (Vinnova, 2006).
As in many other countries the Ministry of Research and Education and the Ministry of
Industry (in Sweden called Ministry of Enterprise, Energy and Communications) are responsible for
most of the public agencies and research council that finance research in Sweden. The Swedish
innovation policy went through a major reorganization in the year 2000, with the creation of new
agencies and the reorganization of some of the sectorial research funding agencies like NUTEK. One
of this new agencie was VINNOVA.
VINNOVA’s main task is to “promote sustainable growth and development for the business
community, society and individuals by developing effective innovation systems …” (VINNOVA,
2001). The general objective is translated into three main functions (Jacobs, 2004): Advising the
Government on innovation policy issues; Commissioning and conducting in-house research on
innovation related issues; Design and implement (national, regional and sectoral) policy programmes
to support and stimulate innovation.
VINNOVA has adopted very specifically the system of innovation approach in policy making.
Policy actions deployed by VINNOVA aim at promoting problem solving research and develop
effective innovation systems. VINNOVA defines effective innovation systems “as consisting of actors
from science, business and politics, which interact to develop, exchange and apply new technologies
and new knowledge in order to promote sustainable growth by means of new products, services and
processes” (VINNOVA, 2002:3). VINNOVA aims to promote the effective interaction of these actors

24
to facilitate the transformation of new knowledge into products, services and processes as well as
ensuring the effective links with other innovation systems (national, regional and sectoral).
The regional programme VINNVÄXT is the best example of how network problems are being
addressed by VINNOVA. All initiatives funded at the regional level have to involve all relevant actors
at that level, including policy-makers. To increase the cooperation between the organisations
VINNOVA trains “innovation system developers”, that is, facilitators that can “mobilise the level of
commitment and resources needed to create efficient groups and processes which will produce
concrete results” (VINNOVA, 2001:11)
Graph 19. - Structure of the Swedish research funding system.
Source: Adapted (and updated) from Roos et al (2005).
The industrial research institutes focus on applied research and are jointly funded by the
government and the industry. The institutes were created with the aim of providing some research
capabilities to industries that were fundamentally dominated by SMEs (Arnold et al, 2007). The
institutes, therefore, in principle tackle two of the problems of the Swedish NIS- the low participation
of SMEs in R&D investments and the focus on basic research. However, in contrast to some other
countries, the industrial research institutes (often called IRECO institutes) play a minor role in the
Government
Ministry of Education & Research
Ministry of Enterprise, Energy and
Communications
OtherMinistries
The Swedish Research Council
VINNOVA ITPS Swedish Agency for Economic & Regional Growth
R&D Funding Agencies
Public & Private Research
Foundations
Higher Education
GovernmentalInstitutes& Agencies
Industrial Research Institutes
BusinessSector

25
Swedish innovation system, with even decreasing budgets over time (Vinnova, 2006). An
example of some of the industrial research institutes are the Institute for Electronic, Optics and
Communication Technologies (ACREO), the Institute for Manufacturing Technology (SWEREA
IVF) or the Swedish Institute for Food and Bio-Technology (SIK).
A very particular feature of the Swedish NIS is that university teachers have the right to own
their inventions (the so-called teacher’s exemption). Currently a new IPR system is being discussed,
which places in the Universities the right to commercialize the patents generated by their researchers.
The purpose of this measure is solving what is considered a systemic problem which is the extreme
focus of the system in basic research and the low level of commercialization of research results.
Sweden has a series of programs supporting R&D in certain strategic areas that are
particularly targeted to foreign actors. For example, in the automotive sector, the Swedish government
has the Strategic Vehicle Research and Innovation Initiative that supports applied research in energy
and the environment, transport efficiency, vehicle and traffic safety, vehicle development and
sustainable production (ISA, 2009). Funding is eligible to any foreign company with subsidiary in
Sweden and with an established agreement with a Swedish company or to any university or research
institute from abroad that have unique competences not available in Sweden.
6. Performance of the system or impact of the NIS on GINs?
This paper has focuses upon the major features of the Swedish National Innovation System and the
influence it has had on the emergence of Global Innovation Networks in the country. This last section
is intended to provide an overall perspective on these two issues, providing a set of indicators related
to the performance of an innovation system on the one hand, and other related to the characteristics of
Global Innovation Networks. Regarding the performance, we distinguish between two different types:
economic performance and Science, Technology and Innovation (STI) performance (see Table 7).
The main purpose of an innovation system is to pursue innovation processes; to develop and diffuse
innovations, which includes introducing and diffusing them not only in the firms but also on the
market. During the last years, and as a matter of increasing interests from policy-makers concerning
public accountability a long stream of literature has emerged in relation to the measurement,
management, or evaluation of innovation systems performance. Several related concepts have popped
up regarding the propensity of territories to innovate, such as ’innovative capacity’, ’innovation
potential‘, ’innovation capabilities‘, ‘innovation intensity’ or ’innovativeness‘. Despite all these
different notions, all of them are oriented to capture the performance in innovation. According to
Spronk and Vermeulen (2003: 482) “performance refers to the result(s) of an activity (or set of

26
activities)”, that is to the results achieved once the activity has taken place, which translated to the
innovation systems framework, drives us to talk about these two types of performance.
Indeed, it is not possible to say whether certain innovation intensities are high or low in a concrete
system if there are no comparisons with those from other systems. This has to do with the fact that we
cannot identify optimal or ideal innovation intensities (or optimal innovation systems). Hence, and in
order to address the measurement of the performance, it is necessary to make comparisons among
systems. Such comparisons can be made between the same systems over time, or between different
existing systems. In this case, since the focus of the paper is the Swedish NIS, we have tried to provide
both views. On the one hand, we aim at offering a dynamic view of its performance, by analyzing its
major trends as illustrated by several indicators, while on the other we also aim to offer a comparative
perspective with regard to the other two Scandinavian countries, Denmark and Norway.
First, and regarding the economic performance of the Swedish NIS, we have included three indicators
that provide an overall view about this. Concerning the population between 25-64 years with tertiary
education (as a percentage of total population) we can observe that the three countries have very
similar values. However, despite Sweden is the country with the lowest values during the last 2004-
2006 period, it seems that the growth in terms of Swedish tertiary educated people (8,7%) is much
higher than those observed in the neighbor countries. Interestingly, when compared to the 2006-1996
period, one can observe that the growth on both Denmark and Norway (29,96 and 14,12%
respectively) are much higher than those for Sweden. Accordingly, it is possible to conclude that both
Denmark and Norway have had a more sudden growth during the last 10 years than Sweden, who
clearly shows a much more stable pattern. As to the employment rates observed, the three countries
seem to have very similar and high patterns during the last 10 years considered. Finally, and in relation
to the GDP per capital and its relative growth, Sweden is the country with the lowest GDP per capita
and the lowest growth rates.
Second, we aim to characterize the STI performance by means of five indicators: R&D expenditure
growth, R&D personnel growth, innovation expenditures, patent applications to the EPO (per million
inhabitants) and triadic patent families6. Concerning the first of these measures, we have calculated the
growth of the R&D expenditures executed by the different sectors (business enterprise, government
and higher education). From an overall perspective it seems that during the 2004.2006 period, Norway
is the country who has in relative terms increased more its R&D expenditures. However, this is
probably related to the fact that Norway does not invest as much as Sweden and Denmark on R&D
activities. Concerning the Swedish case, interestingly enough, it can be observed a clear differentiation
in the pattern of R&D expenses. During the 1996-2006 period, the government sector was the main
6 The data concerning STI performance need to be complemented with a set of new indicators we are still collecting and processing: publications per million inhabitants, % of turnover due to new to the firm products and % of turnover due to new to the market products.

27
driver of the growth in R&D activities, in the latter 2004-2006 period, this sector shows decreasing
growth rates. However, the business enterprise sector shows a more stable pattern. This outline is
followed in parallel by the growth observed in terms of R&D personnel and number of researchers
employed in these sectors. Finally and as to the patents are concerned, Sweden shows the highest
values both in terms of triadic patent families and EPO patent applications, with a clear relative
advantage compared the its neighbor countries.
Finally, our last block of measures is intended to characterize the Global Innovation Networks by
means of the following indicators: firms that cooperated in innovation, R&D executed by source of
funds and job-to-job mobility of Human Resources in Science and Technology (HRST)7. Concerning
the cooperation in innovation activities, Swedish firms (both in the manufacturing and services
sectors) seem to cooperate much more than those in Denmark and Norway respectively. As to those in
the services sector, some mention is needed. Despite during the 1996-2006 period the services sector
in Sweden did not cooperate to the extent observed in the neighbor countries, between 2004-2006, the
firms in this sector caught up in this sense, not only taking over those values observed in the other
countries but also approaching the ones in the Swedish manufacturing sector. When analyzing thee
cooperation patterns depending on the geographical level of the cooperation, the three countries show
a clear tendency to cooperate with other organizations within their own countries or within the EU,
rather than establishing cooperation agreements with organizations in the USA or Japan. However, we
also consider that these dynamics will require further investigation, since as its has been illustrated
along the paper, the impact of GINs, particularly in Sweden, has changed a lot during the last years.
The second of our measures aims to capture the amount of R&D expenditures executed in-house but
which are funded by foreign organizations. In this sense, the Swedish NIS seems to be the one that has
a clearer tendency towards supporting open innovation activities, not only within the business
enterprise sector but also among higher education organizations. Finally, and a propos the job-to-job
mobility of HRST, the only data available for Sweden refer to the 1996-2006 period. In this sense, we
can observe something already pointed out before. The efforts done within the services sector in order
to increase its level of cooperation is also reflected in this particular indicator. Next, and quite
logically, firms within the knowledge-intensive sectors are those that higher mobility rates show
within the Swedish economy.
In this section we have tried to complement the information and evidence included in the previous
sections as to the main characteristics of the Swedish NIS, not only in terms of its performance, but
also in terms of the role played by the GINs as one of the main determinants of innovation activities.
As it is well known from the literature, the Swedish NIS has traditionally had an structural
7 The data concerning Global Innovation Networks need to be complemented with a set of new indicators we are still collecting and processing: co-authored patents (% of all patents) and Co-authored publications (% of all publications).

28
characteristic by which the very high values of input indicators for innovation do not correspond with
the low values achieved for output indicators. A feature than has been labeled by several scholars as
the “Swedish Paradox” (Edquist and Hommen, 2008; Kander and Ejermo, 2009). In this paper we
have not addressed this issue directly. However, we think that the structural change that is being
observed in the Swedish economy towards smaller and more service oriented firms, and the relevance
that during the last years are taking the GINs may have a direct impact on this paradox. This is a
matter of further research. Related to it, the entrepreneurial properties of the new firms should also be
considered. In fact, new firms in Sweden tend to be smaller, more diversified, employing a
considerable part of the creative workers in the country, and with a clear view of their GINs. We
consider that these aspects briefly addressed here should be analysed more in-depth in order to get a
more comprehensive understanding about the new dynamics observed within the Swedish NIS.

29
Table 7. Main features of the Swedish NIS and its GINs 2006-2004 2006-1996
Denmark Norway Sweden Denmark Norway SwedenEconomic performance Population between 25-64 years with tertiary education (% of total population) [in brackets the growth of the population with tertiary ed. in %]
18,9
(4,54)
17,7
(2,16)
16,1
(8,70)
14,5*
(29,96)
15,5*
(14,12)
14,9*
(8,56) Employment rate [in brackets the growth of the employment rate in %]
77,4 (2,25)
73,1 (0,40)
75,4 (1,39)
73,8 (4,88)
- 70,3 (3,98)
GDP per capita in € [in brackets the growth of GDP pc in %]
40200 (10,14)
57600 (26,87)
35000 (8,02)
27600 (45,65)
28800 (100)
24600 (42,28)
STI performance R&D expenditure growth (%)**
All sectors Business enterprise sector Government sector Higher education sector
3,66 5,95 -50
13,33
8,55 7,32 4,16 10,64
0,27 1,53 -5,55 -2,53
32,81 50,85 -73,33 58,14
1,23 -4,35 -7,41 20,93
3,74 2,31 41,66 2,66
R&D personnel growth (%) [in brackets researchers growth]** All sectors Business enterprise sector Government sector Higher education sector
7,33 (7,22) 9,18 (8,20) -45,45 (-42,86)
17,5 (13,79)
6,25 (8,79) 4,48 (11,11) 4,54 (14,29) 12,82 (9,68)
-3,63 (-15,38) -2,52 (-17,95) -12,5 (-33,33) -5,26 (-3,12)
31,97 (67,74) 50,70 (144,4) -70 (-69,23) 62,07 (50)
- - - -
7,43 (19,28)
17,17 (36,17) -12,5 (-33,33) -12,19 (3,33)
Innovation expenditures (% of GDP) 5,689,209 -
11,970,62 3,044 1,242 12,930
Patent applications to the EPO per million inhabitants [in brackets the growth of patent applications to EPO in %]
210,15 (10,03)
111,3 (30,34)
271,28 (10,48)
118,22 (77,76)
61,83 (80,01)
204,16 (32,88)
Triadic patents families [in brackets the growth of triadic patents]
277,08 (8,15)
131,42 (19,27)
847,15 (13,40)
226,22 (22,48)
75,26 (74,63)
913,93 (-7,31)
Global Innovation Networks Firms that have cooperated in innovation *** [in brackets the % of firms that have cooperated in innovation activities as a % of enterprises with innovation activities]
Cooperation with partner in the same country Cooperation with partner in the EU Cooperation with partner in the US Cooperation with partner in Japan Cooperation with partner elsewhere
961/790 (37/31)
757/555 416/452
298/394**** - -
509/384 (33/26)
407/279 216/143
109/134**** - -
1586/1574 (42/35)
1494/1400
962/- 441/-****
- -
1243/963 (57/66)
1036/834 829/461 192/228 76/80
290/179
553/540 (49/61)
513/503 294/188 111/88 35/20 47/48
1217/878 (59-48)
1115/834 684/262 378/78 104/54 148/59

30
R&D executed by sources of funds** Business enterprise sector (execute) – abroad (funded) Government sector (execute) – abroad (funded) Higher education sector (execute) – abroad (funded)
5,26 -50 0
11,11
0 0
16,66
- 0
100
0 300
42,86
0 0
211,11
- 66,66
Job-to-job mobility of HRST, employed, 25-64 years old (% of job-to-job mobile HRST)**
All sectors Manufacturing sectors Services sectors Knowledge Intensive sectors
34,29 41,75 34,61 22,86
- - - -
- - - -
60,23 131,75 52,17 35,79
46,57 - - -
-
-3,77 50,68 48,57
Notes: * The last available data at Eurostat is 1999. ** The period of reference is 2007 – 2005 and 2007-1997 respectively. *** The data refer to the manufacturing and services sectors correspondingly. **** For CIS 2006, the data regarding the cooperation in innovation only considers the cooperation within the same country, within Europe and “within US and other countries”.

31
7. The Swedish NIS and GINs – final reflections
The Swedish innovation system is highly internationalized in terms of global research
collaboration, global generation of innovation and global sourcing. Firms as well as universities are
very active internationally in terms of their research and innovation activities. However, the
geographical analysis of the flows of knowledge shows a high preponderance of USA and Europe as
the origin and destination of those knowledge flows. That is, the innovation networks in which
Swedish firms and universities are engaged are, as of today, more regional than global.
However, this is gradually changing. The percentage of students from BICSs countries in
Swedish Universities has increased dramatically over the last decade. The same can be said for
innovation collaboration and for offshoring of R&D activities by Swedish multinational. In that
respect, one could argue that the Swedish Innovation System is gradually engaging in innovation
activities and networks with BICSs countries, more specifically, China and India. This is true for the
large enterprises (that dominate the Swedish Innovation System) as well as for SMEs: about 20% of
Swedish SMEs have engaged in some form of collaboration in innovation with partners of China and
India.
The data presented in this report also points out to some challenges for the future. If GINs
are attracted by the accumulation of competences in certain regions and countries worldwide, Sweden
may be in danger of losing its attractiveness, as the amount of students in tertiary education decreases
over time. This could partly explain the gradual decrease in inward R&D in Sweden. As other regions
in the world rapidly accumulate research and innovation capabilities while maintaining relatively
lower costs, they become more attractive for the location of R&D activities which may move from
Sweden to other parts of the world. The challenge for the Swedish Innovation System and GINs is to
continue investing in world-class research and innovation capabilities beyond large multinational
companies (i.e. supporting SMEs), to continue the support of certain industries which attract a large
proportion of knowledge intensive activities into the country (for example, the industries/clusters in
which Sweden is specialized) and to facilitate the mobility of highly qualified workers into Sweden.

32
REFERENCES
Archibugi, D., Michie, J. (1995), “The globalisation of technology: a new taxonomy.” Cambridge Journal of Economics 19(1), 121-140.
Arnold, E., Brown, N., Eriksson, A., Jansson, T., Muscio, A., Nählinder, J. and Zaman, R. (2007) The Role of Industrial Research Institutes in the National Innovation System, Stockholm: VINNOVA.
Chaminade (2009), “On the concept of Global Innovation Networks and its use in INGINEUS” CIRCLE electronic working paper, 2009/05
Edquist, C. and Hommen, L. (2008), “Comparing National Systems of Innovation in Asia and Europe: Theory and Comparative Framework”, pg. 1-28 in Edquist, C. and Hommen, L. (2008) Small Country Innovation Systems: Globalisation, Change and Policy in Asia and Europe. Edward Elgar Publishing Limited, Cheltenham.
Edquist, C., Bitard, P., Hommen, L., Rickne, A. (2008), “Reconsidering the paradox of high R&D input and low innovation: Sweden”, pg. 237-280 in Edquist, C., Hommen, L. (2008) Small Country Innovation Systems: Globalisation, Change and Policy in Asia and Europe. Edward Elgar Publishing Limited, Cheltenham.
Ejermo, O., Kander, A., Svensson, H. M (2008), ”The Swedish Paradox arises in Fast-Growing Sectors” CIRCLE electronic working paper, 2008/07
EUROSTAT (2007), Comunity Innovation Survey 2004-2006. http://epp.eurostat.ec.europa.eu/portal/page/portal/eurostat/home
EUROSTAT (2009), “Pocketbooks, Science, technology and innovation in Europe 2009”, http://epp.eurostat.ec.europa.eu/cache/ITY_OFFPUB/KS-30-09-148/EN/KS-30-09-148-EN.PDF
Forskning.se (2009) Swedish Research. Main financing bodies. www.forsning.se.
ISA (Invest in Sweden Agency) Automotive: vehicle innovation the Swedish way. www.isa.se/automotive. Accessed May 2010.
ITPS (2007), Forskning och utveckling i internationella företag 2007 (Research and Development in International Enterprises 2007), tillväxtanalys, Statistik 2009:03. http://www.tillvaxtanalys.se/tua/export/sv/filer/statistik/internationella/Statistik_2009_02_ny.pdf
Jacobs, M. (2006), “Utilization of Social Science knowledge in Science Policy: Systems of Innovation, Triple Helix and VINNOVA” Social Science Information, Vol 45(3), pp. 431–462 Kander, A. and Ejermo, O. (2009), ”The Swedish paradox revisited”, p 48-76, in Karlsson, C., Johansson, B. and Stough, R. (eds), (2009) Entrepreneurship and Innovation in Functional Regions. Edgar Elgar
Lorenz, E. ; Lundvall, B-A. (forthcoming), “Accounting for Creativity in the European Union A multi-level analysis of individual competence, labour market structure, and systems of life-long learning.” Forthcoming in Cambridge Journal of Economics.

33
Marklund, G., Nilsson, R., Sandgren, P., Thorslund, J.G., Ulström, J. (2004), The Swedish National Innovation System 1970-2003. Vinnova Analysis VA 2004:1. www.vinnova.se
OECD (2008), Activities of multinationals, volume II, Paris: OECD
OECD (2010), Main Science and Technology Indicators Vol 2009 release 02. Paris: OECD.
Pavitt, K. (1984) "Sectoral patterns of technical change: towards a taxonomy and a theory", Research Policy,13: 343–373
Plechero, M., Chaminade, C. (2010), “Different competences, different modes in the globalization of innovation? A comparative study of the Pune and Beijing regions”, CIRCLE electronic working paper, 2010/03
Roos, G., Fernström, L., Gupta. O. (2005) National innovation systems: Finland, Sweden & Australia compare, Australian Business Foundation.
Spronk. J. and Vermeulen, E.M. (2003) “Comparative performance evaluation under uncertainty”. European Journal of Operational Research, 150, pp. 482–495.
Swedish Higher Education Authority (Högskoleverket) (2009), Statistics for 2008 (Swedish)
Swedish National Agency for Higher Education (SNAHE) (2010), Swedish Universities and Universities Colleagues Annual Report 2009. http://www.hsv.se/download/ 18.211928b51239dbb43167ffe973/ 0923R.pdf
VINNOVA (2001), Regional Growth through Dynamic Innovation Systems, Vinnova. www.vinnova.se
VINNOVA (2002), Effective Innovation Systems and Problem-oriented Research for Sustainable Growth, Vinnova Strategic Plan 2003-2007. Stockholm, VINNOVA. on www.vinnova.se
VINNOVA (2006), Vinnova and its role in the Swedish Innovation System- Accomplishments since the start in 2001 and ambitions forward, Presentation by Per Ericsson. http://www.rieti.go.jp/en/events/bbl/06090501.pdf

34
ADDITIONAL TABLES
Turnover by Industry (2002/2004)
Source: Authors based on OECD (2008)
2002 2003 2004 2002 2003 2004 2002 2003 2004
01/05 Agriculture, hunting, forestry, fishing 99693 100000 106708 8773 8900 9497 8,8 8,9 8,9
15/37 Total manufacturing 1402717 1475706 1558266 549865 612418 621748 39,2 41,5 39,9
45 Construction industry 269173 270734 284871 27994 25449 28772 10,4 9,4 10,1
50/93 TOTAL SERVICES 2843170 2941671 3092535 736381 850143 884465 25,9 28,9 28,6
50/52 Wholesale and retail trade, repair 1566883 1596621 1686803 510804 555624 565079 32,6 34,8 33,5
50 Sales and repair establishments for motor vehicles and motorcycles; petrol stations 276254 290000 302596 79285 87580 104093 28,7 30,2 34,4
51 Wholesale trade and commission trade 782489 877470 937124 348990 390474 377661 44,6 44,5 40,3
52 Retail trade, repair shops for personal and household good 426872 428564 443218 46529 77570 83325 10,9 18,1 18,8
55 Hotels and restaurants 67777 69360 70959 11861 13664 13837 17,5 19,7 19,5
60/64 Transport and communications 416316 454207 471234 93671 144892 171058 22,5 31,9 36,3
60/63 Transport and storage 305260 339242 357049 78757 126198 129966 25,8 37,2 36,4
60 Land transport companies 41673 54568 58232 11210 15279 15082 26,9 28,0 25,9
70/74 Real estate, renting & business act 611073 613426 640530 108160 115324 118498 17,7 18,8 18,5
70 Real estate companies 186661 197625 209552 11013 15810 18231 5,9 8,0 8,7
72 Data consultancy and data service companies 117173 123964 135846 36675 44379 38852 31,3 35,8 28,6
74 Other business services companies 180917 178671 183971 39440 39665 43785 21,8 22,2 23,8
80/93 Community, social & personal serv 182846 198281 203155 11885 12690 14424 6,5 6,4 7,1
92 Recreational, cultural and sporting establishments 72451 76708 79807 6593 5523 7023 9,1 7,2 8,8
01/93 GRAND TOTAL 4810181 4999114 5266668 1380522 1584719 1632667 28,7 31,7 31,0
Turnover by Industry Foreign As a % of national totalNational Turnover by Industry

35
R&D expenditure and R&D person-years in foreign, international Swedish and domestic enterprises in Sweden
by business sector (2005-2007)- SEK million.
Source: ITPS (2007)
Business sector Enterprise category
2007 2005 2007 2005
Knowledge intensive
Manufacturing industry Foreign controlled enterpreises 21819 20377 13503 15346
Swedish controlled international enterprises 30196 24577 20112 18952
Doestic enterprises 1140 912 942 872
Total 53156 45866 34557 35171
Services Foreign controlled enterpreises 3950 4720 3504 4266
Swedish controlled international enterprises 11466 7668 6910 5616
Doestic enterprises 3665 3508 3285 3203
Total 19081 15896 13699 13084
Capital Intensive
Manufacturing industry Foreign controlled enterpreises 2206 2304 1777 1720
Swedish controlled international enterprises 2043 1930 1724 1518
Doestic enterprises 124 94 170 108
Total 4374 4328 3672 3345
Services Foreign controlled enterpreises 121 161 77 40
Swedish controlled international enterprises 546 209 554 177
Doestic enterprises 42 103 45 78
Total 709 473 676 295
Labour Intensive
Manufacturing industry Foreign controlled enterpreises 486 596 378 544
Swedish controlled international enterprises 752 713 705 718
Doestic enterprises 231 167 215 233
Total 1468 1476 1298 1495
Services Foreign controlled enterpreises 1233 1694 839 1277
Swedish controlled international enterprises 106 1392 849 948
Doestic enterprises 170 248 160 213
Total 2463 3334 1849 2438
Other activities
Foreign controlled enterpreises 35 36 33 34
Swedish controlled international enterprises 93 215 91 186
Doestic enterprises 68 78 65 57
Total 195 329 189 278
Business sector
Foreign controlled enterpreises 29850 29888 20111 23227
Swedish controlled international enterprises 46156 36704 30945 28115
Doestic enterprises 5440 5109 4883 4763
Total 81445 71701 55940 56106
R&D espeditur, SEK
millionR&D person‐years

CIRCLE ELECTRONIC WORKING PAPERS SERIES (EWP) CIRCLE (Centre for Innovation, Research and Competence in the Learning Economy) is a multidisciplinary research centre set off by several faculties at Lund University and Blekinge Institute of Technology. CIRCLE has a mandate to conduct multidisciplinary research and education on the following issues: Long-term perspectives on innovation, structural change and economic growth, Entrepreneurship and venture capital formation with a special focus on new ventures, The dynamics of R&D systems and technological systems, including their impact on entrepreneurship and growth, Regional innovation systems in different national and international contexts and International comparative analyses of national innovation systems. Special emphasis is done on innovation policies and research policies. 10 nationalities and 14 disciplines are represented among the CIRCLE staff. The CIRCLE Electronic Working Paper Series are intended to be an instrument for early dissemination of the research undertaken by CIRCLE researchers, associates and visiting scholars and stimulate discussion and critical comment. The working papers present research results that in whole or in part are suitable for submission to a refereed journal or to the editor of a book or have already been submitted and/or accepted for publication. CIRCLE EWPs are available on-line at: http://www.circle.lu.se/publications Available papers: 2010 WP 2010/01 Innovation policies for development: towards a systemic experimentation based approach Cristina Chaminade, Bengt-Ake Lundvall, Jan Vang-Lauridsen and KJ Joseph WP 2010/02 From Basic Research to Innovation: Entrepreneurial Intermediaries for Research Commercialization at Swedish ‘Strong Research Environments’ Fumi Kitagawa and Caroline Wigren WP 2010/03 Different competences, different modes in the globalization of innovation? A comparative study of the Pune and Beijing regions Monica Plechero and Cristina Chaminade WP 2010/04 Technological Capability Building in Informal Firms in the Agricultural Subsistence Sector In Tanzania: Assessing the Role of Gatsby Clubs Astrid Szogs and Kelefa Mwantima WP 2010/05 The Swedish Paradox – Unexploited Opportunities! Charles Edquist

WP 2010/06 A three-stage model of the Academy-Industry linking process: the perspective of both agents Claudia De Fuentes and Gabriela Dutrénit WP 2010/07 Innovation in symbolic industries: the geography and organisation of knowledge sourcing Roman Martin and Jerker Moodysson WP 2010/08 Towards a spatial perspective on sustainability transitions Lars Coenen, Paul Benneworth and Bernhard Truffer WP 2010/09 The Swedish national innovation system and its relevance for the emergence of global innovation networks Cristina Chaminade, Jon Mikel Zabala and Adele Treccani 2009 WP 2009/01 Building systems of innovation in less developed countries: The role of intermediate organizations. Szogs, Astrid; Cummings, Andrew and Chaminade, Cristina WP 2009/02 The Widening and Deepening of Innovation Policy: What Conditions Provide for Effective Governance? Borrás, Susana WP 2009/03 Managerial learning and development in small firms: implications based on observations of managerial work Gabrielsson, Jonas and Tell, Joakim WP 2009/04 University professors and research commercialization: An empirical test of the “knowledge corridor” thesis Gabrielsson, Jonas, Politis, Diamanto and Tell, Joakim WP 2009/05 On the concept of global innovation networks Chaminade, Cristina WP 2009/06 Technological Waves and Economic Growth - Sweden in an International Perspective 1850-2005 Schön, Lennart WP 2009/07 Public Procurement of Innovation Diffusion: Exploring the Role of Institutions and Institutional Coordination Rolfstam, Max; Phillips, Wendy and Bakker, Elmer

WP 2009/08 Local niche experimentation in energy transitions: a theoretical and empirical exploration of proximity advantages and disadvantages Lars Coenen, Rob Raven, Geert Verbong WP 2009/9 Product Development Decisions: An empirical approach to Krishnan and Ulrich Jon Mikel Zabala, Tina Hannemann WP 2009/10 Dynamics of a Technological Innovator Network and its impact on technological performance Ju Liu, Cristina Chaminade WP 2009/11 The Role of Local Universities in Improving Traditional SMEs Innovative Performances: The Veneto Region Case Monica Plechero WP 2009/12 Comparing systems approaches to innovation and technological change for sustainable and competitive economies: an explorative study into conceptual commonalities, differences and complementarities Coenen, Lars and Díaz López, Fernando J. WP 2009/13 Public Procurement for Innovation (PPI) – a Pilot Study Charles Edquist WP 2009/14 Outputs of innovation systems: a European perspective Charles Edquist and Jon Mikel Zabala 2008 WP 2008/01 R&D and financial systems: the determinants of R&D expenditures in the Swedish pharmaceutical industry Malmberg, Claes WP 2008/02 The Development of a New Swedish Innovation Policy. A Historical Institutional Approach Persson, Bo WP 2008/03 The Effects of R&D on Regional Invention and Innovation Olof Ejermo and Urban Gråsjö WP 2008/04 Clusters in Time and Space: Understanding the Growth and Transformation of Life Science in Scania Moodysson, Jerker; Nilsson, Magnus; Svensson Henning, Martin

WP 2008/05 Building absorptive capacity in less developed countries The case of Tanzania Szogs, Astrid; Chaminade, Cristina and Azatyan, Ruzana WP 2008/06 Design of Innovation Policy through Diagnostic Analysis: Identification of Systemic Problems (or Failures) Edquist, Charles WP 2008/07 The Swedish Paradox arises in Fast-Growing Sectors Ejermo, Olof; Kander, Astrid and Svensson Henning, Martin
WP 2008/08 Policy Reforms, New University-Industry Links and Implications for Regional Development in Japan Kitagawa, Fumi
WP 2008/09 The Challenges of Globalisation: Strategic Choices for Innovation Policy Borrás, Susana; Chaminade, Cristina and Edquist, Charles
WP 2008/10 Comparing national systems of innovation in Asia and Europe: theory and comparative framework Edquist, Charles and Hommen, Leif
WP 2008/11 Putting Constructed Regional Advantage into Swedish Practice? The case of the VINNVÄXT initiative 'Food Innovation at Interfaces' Coenen, Lars; Moodysson, Jerker WP 2008/12 Energy transitions in Europe: 1600-2000 Kander, Astrid; Malanima, Paolo and Warde, Paul WP 2008/13 RIS and Developing Countries: Linking firm technological capabilities to regional systems of innovation Padilla, Ramon; Vang, Jan and Chaminade, Cristina WP 2008/14 The paradox of high R&D input and low innovation output: Sweden Bitarre, Pierre; Edquist, Charles; Hommen, Leif and Ricke, Annika
WP 2008/15 Two Sides of the Same Coin? Local and Global Knowledge Flows in Medicon Valley Moodysson, Jerker; Coenen, Lars and Asheim, Bjørn

WP 2008/16 Electrification and energy productivity Enflo, Kerstin; Kander, Astrid and Schön, Lennart WP 2008/17 Concluding Chapter: Globalisation and Innovation Policy Hommen, Leif and Edquist, Charles
WP 2008/18 Regional innovation systems and the global location of innovation activities: Lessons from China Yun-Chung, Chen; Vang, Jan and Chaminade, Cristina WP 2008/19 The Role of mediator organisations in the making of innovation systems in least developed countries. Evidence from Tanzania Szogs, Astrid WP 2008/20 Globalisation of Knowledge Production and Regional Innovation Policy: Supporting Specialized Hubs in the Bangalore Software Industry Chaminade, Cristina and Vang, Jan WP 2008/21 Upgrading in Asian clusters: Rethinking the importance of interactive-learning Chaminade, Cristina and Vang, Jan 2007 WP 2007/01 Path-following or Leapfrogging in Catching-up: the Case of Chinese Telecommunication Equipment Industry Liu, Xielin WP 2007/02 The effects of institutional change on innovation and productivity growth in the Swedish pharmaceutical industry Malmberg, Claes WP 2007/03 Global-local linkages, Spillovers and Cultural Clusters: Theoretical and Empirical insights from an exploratory study of Toronto’s Film Cluster Vang, Jan; Chaminade, Cristina WP 2007/04 Learning from the Bangalore Experience: The Role of Universities in an Emerging Regional Innovation System Vang, Jan; Chaminade, Cristina.; Coenen, Lars. WP 2007/05 Industrial dynamics and innovative pressure on energy -Sweden with European and Global outlooks Schön, Lennart; Kander, Astrid.

WP 2007/06 In defence of electricity as a general purpose technology Kander, Astrid; Enflo, Kerstin; Schön, Lennart WP 2007/07 Swedish business research productivity – improvements against international trends Ejermo, Olof; Kander, Astrid WP 2007/08 Regional innovation measured by patent data – does quality matter? Ejermo, Olof WP 2007/09 Innovation System Policies in Less Successful Developing countries: The case of Thailand Intarakumnerd, Patarapong; Chaminade, Cristina 2006 WP 2006/01 The Swedish Paradox Ejermo, Olof; Kander, Astrid WP 2006/02 Building RIS in Developing Countries: Policy Lessons from Bangalore, India Vang, Jan; Chaminade, Cristina WP 2006/03 Innovation Policy for Asian SMEs: Exploring cluster differences Chaminade, Cristina; Vang, Jan. WP 2006/04 Rationales for public intervention from a system of innovation approach: the case of VINNOVA. Chaminade, Cristina; Edquist, Charles WP 2006/05 Technology and Trade: an analysis of technology specialization and export flows Andersson, Martin; Ejermo, Olof WP 2006/06 A Knowledge-based Categorization of Research-based Spin-off Creation Gabrielsson, Jonas; Landström, Hans; Brunsnes, E. Thomas WP 2006/07 Board control and corporate innovation: an empirical study of small technology-based firms Gabrielsson, Jonas; Politis, Diamanto

WP 2006/08 On and Off the Beaten Path: Transferring Knowledge through Formal and Informal Networks Rick Aalbers; Otto Koppius; Wilfred Dolfsma WP 2006/09 Trends in R&D, innovation and productivity in Sweden 1985-2002 Ejermo, Olof; Kander, Astrid WP 2006/10 Development Blocks and the Second Industrial Revolution, Sweden 1900-1974 Enflo, Kerstin; Kander, Astrid; Schön, Lennart WP 2006/11 The uneven and selective nature of cluster knowledge networks: evidence from the wine industry Giuliani, Elisa WP 2006/12 Informal investors and value added: The contribution of investors’ experientially acquired resources in the entrepreneurial process Politis, Diamanto; Gabrielsson, Jonas WP 2006/13 Informal investors and value added: What do we know and where do we go? Politis, Diamanto; Gabrielsson, Jonas WP 2006/14 Inventive and innovative activity over time and geographical space: the case of Sweden Ejermo, Olof 2005 WP 2005/1 Constructing Regional Advantage at the Northern Edge Coenen, Lars; Asheim, Bjørn WP 2005/02 From Theory to Practice: The Use of the Systems of Innovation Approach for Innovation Policy Chaminade, Cristina; Edquist, Charles WP 2005/03 The Role of Regional Innovation Systems in a Globalising Economy: Comparing Knowledge Bases and Institutional Frameworks in Nordic Clusters Asheim, Bjørn; Coenen, Lars WP 2005/04 How does Accessibility to Knowledge Sources Affect the Innovativeness of Corporations? Evidence from Sweden Andersson, Martin; Ejermo, Olof

WP 2005/05 Contextualizing Regional Innovation Systems in a Globalizing Learning Economy: On Knowledge Bases and Institutional Frameworks Asheim, Bjørn; Coenen, Lars WP 2005/06 Innovation Policies for Asian SMEs: An Innovation Systems Perspective Chaminade, Cristina; Vang, Jan WP 2005/07 Re-norming the Science-Society Relation Jacob, Merle WP 2005/08 Corporate innovation and competitive environment Huse, Morten; Neubaum, Donald O.; Gabrielsson, Jonas WP 2005/09 Knowledge and accountability: Outside directors' contribution in the corporate value chain Huse, Morten, Gabrielsson, Jonas; Minichilli, Alessandro WP 2005/10 Rethinking the Spatial Organization of Creative Industries Vang, Jan WP 2005/11 Interregional Inventor Networks as Studied by Patent Co-inventorships Ejermo, Olof; Karlsson, Charlie WP 2005/12 Knowledge Bases and Spatial Patterns of Collaboration: Comparing the Pharma and Agro-Food Bioregions Scania and Saskatoon Coenen, Lars; Moodysson, Jerker; Ryan, Camille; Asheim, Bjørn; Phillips, Peter WP 2005/13 Regional Innovation System Policy: a Knowledge-based Approach Asheim, Bjørn; Coenen, Lars; Moodysson, Jerker; Vang, Jan WP 2005/14 Face-to-Face, Buzz and Knowledge Bases: Socio-spatial implications for learning and innovation policy Asheim, Bjørn; Coenen, Lars, Vang, Jan WP 2005/15 The Creative Class and Regional Growth: Towards a Knowledge Based Approach Kalsø Hansen, Høgni; Vang, Jan; Bjørn T. Asheim WP 2005/16 Emergence and Growth of Mjärdevi Science Park in Linköping, Sweden Hommen, Leif; Doloreux, David; Larsson, Emma

WP 2005/17 Trademark Statistics as Innovation Indicators? – A Micro Study Malmberg, Claes