The Sustainability of Ethanol Fuel in the United...
30
The Sustainability of Ethanol Fuel in the United States Dan Wesolowski 10.391J Term Paper Spring 20005 E-mail: [email protected] ? ?
Transcript of The Sustainability of Ethanol Fuel in the United...
The Sustainability of Ethanol Fuel in the United States
Dan Wesolowski
10.391J Term Paper
Spring 20005
E-mail: [email protected]
??
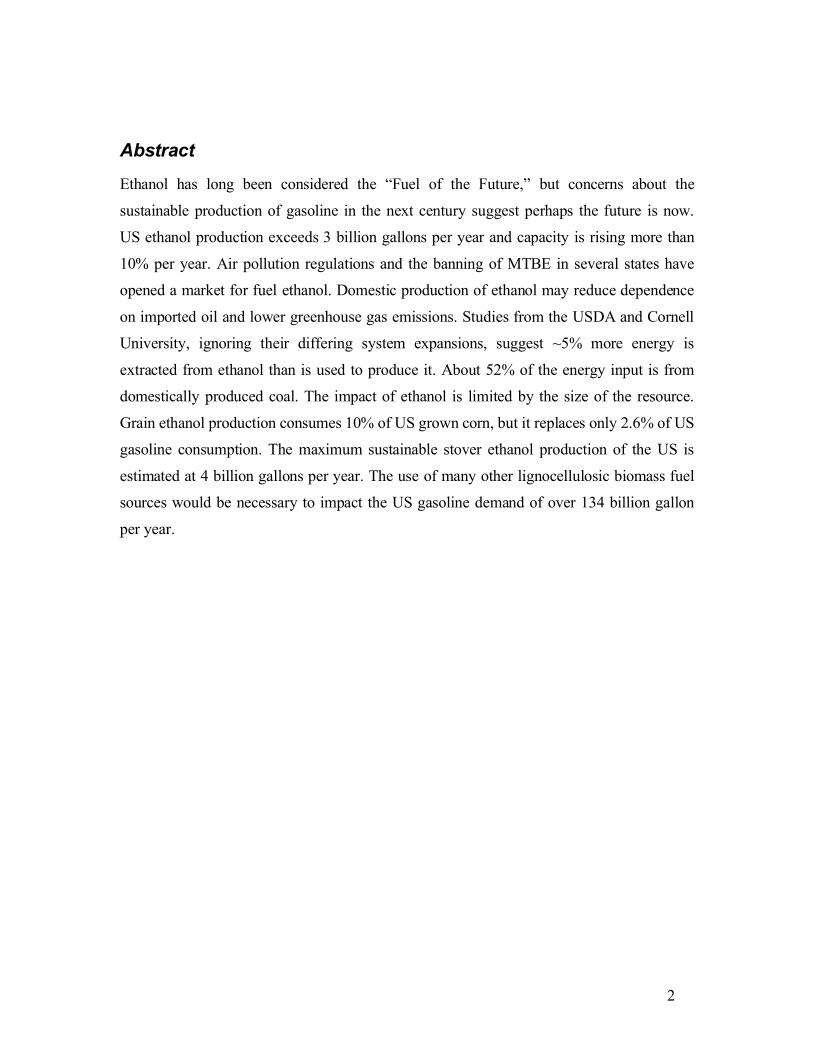
Abstract
Ethanol has long been considered the “Fuel of the Future,” but concerns about the
sustainable production of gasoline in the next century suggest perhaps the future is now.
US ethanol production exceeds 3 billion gallons per year and capacity is rising more than
10% per year. Air pollution regulations and the banning of MTBE in several states have
opened a market for fuel ethanol. Domestic production of ethanol may reduce dependence
on imported oil and lower greenhouse gas emissions. Studies from the USDA and Cornell
University, ignoring their differing system expansions, suggest ~5% more energy is
extracted from ethanol than is used to produce it. About 52% of the energy input is from
domestically produced coal. The impact of ethanol is limited by the size of the resource.
Grain ethanol production consumes 10% of US grown corn, but it replaces only 2.6% of US
gasoline consumption. The maximum sustainable stover ethanol production of the US is
estimated at 4 billion gallons per year. The use of many other lignocellulosic biomass fuel
sources would be necessary to impact the US gasoline demand of over 134 billion gallon
per year.
2
Contents
The Sustainability of Ethanol Fuel in the United States.........................................................1Abstract..............................................................................................................................2Contents..............................................................................................................................3Introduction........................................................................................................................4
“The Fuel of the Future”............................................................................................5Ethanol Today............................................................................................................6
Ethanol as a Fuel................................................................................................................7Ethanol Production.............................................................................................................9
Fermentation and Distillation.........................................................................................9Bioethanol Feedstock...................................................................................................10
Corn grain.................................................................................................................10Domestic Alternatives to Corn Grain.......................................................................10Lignocellulosic Biomass..........................................................................................11
Industrial Scale Production of Ethanol.........................................................................12Ethanol from Corn Starch.........................................................................................12Ethanol from Lignocellulosic Biomass....................................................................13
Life Cycle Analysis of the Corn Ethanol Resource..........................................................15Grain Ethanol LCA.......................................................................................................16
Transportation and Distribution................................................................................17Corn Cultivation.......................................................................................................17Ethanol and Byproduct Production...........................................................................20Assessment of the Studies........................................................................................22
Lignocellulosic Ethanol LCA.......................................................................................22Corn Stover LCA.....................................................................................................23Soil Health................................................................................................................24Climate Change and Energy Security......................................................................26
Conclusion........................................................................................................................27References........................................................................................................................29
3

Introduction
The “End of Oil” has been hyped since the 1950’s when Hubbert released his forecasts for
US oil production. The oil shortages of the 1970’s only served to heighten the cries of
doomsayers, but the real oil crisis was actually decades away. The result of decades of
crying wolf has been a public skeptical of forecasts and the radicalization of the concept of
sustainability. Sustainability, properly defined, is a not a radical concept: “the ability of
humanity to ensure that it meets the needs of the present without compromising the ability
of future generations to meet their own needs” [1,36].
The focus of this paper is the sustainability of ethanol as a gasoline replacement. A
corollary to the above definition of sustainability could be that a sustainable fuel can be
produced in adequate amounts at economical costs essentially forever. “Adequate
amounts” implies economical prices for the fuel. Costs should reflect externalities- that is,
the long-term damage to the environment that fuel use and production causes should be
built into the cost. Externalities are difficult to quantify, but are important when assessing
the true cost of a fuel. “Essentially forever” means long enough to provide fuel until a
significantly better technology and infrastructure is developed.
The time frame over which gasoline’s replacement needs to be produced in a
sustainable way is unknown. Gasoline has been the dominant transportation fuel for a
century with few noticeable deleterious effects. Few today would consider gasoline a
sustainable resource, but from the perspective of automakers in the early 20th century it has
been extremely sustainable. It has been used for five generations with a barely noticeable
effect on global climate and an extremely positive impact on standard of living. The
sustainability of gasoline fuel in the next 100 years is much more questionable, with
accelerating climate change, pollution, and rapidly declining supplies endangering the
standard of living gains made using the fuel. These factors make this an appropriate time to
look at alternatives.
A benchmark often improperly used for judging the sustainability of a resource is
the “net energy balance.” Net energy balance refers to the amount of energy extracted from
a resource vs. how much we get out. The net energy balance of fossil fuels can be
calculated as a benchmark. 7.1 quads of energy in 1998 were used in the manufacture of
petroleum products [2]. 36.9 quads of petroleum products were consumed in 1998 [3]. The
4
net energy balance was therefore (36.9-7.1)/36.1 = 80.8%, which is considered “negative”
because less energy is output from the system then the total energy that was put in.
Sustainable energy production, by a proper definition, does not require a zero or positive
net energy balance. Zero net energy balance is a requirement for a fuel choice that will be
used literally forever. This is not a realistic time frame for human planning. Instead, some
non-renewable resource “mining” is allowable as long a replacement can be found before
mining becomes unsustainable. This is how gasoline has been sustainable energy for the
last century, and why it probably won’t be in the next one.
Ethanol as fuel has shown promise since the dawn of the automotive era. Whether that
promise is ever fulfilled depends not only on its technical and sustainability merits, but also
a great deal on politics. An examination of the history of ethanol in the automotive age
helps reveal the problems of adopting ethanol fuel.
“The Fuel of the Future”
"The fuel of the future is going to come from fruit like that sumach out by the road,
or from apples, weeds, sawdust -- almost anything. There is fuel in every bit of vegetable
matter that can be fermented. There's enough alcohol in one year's yield of an acre of
potatoes to drive the machinery necessary to cultivate the fields for a hundred years” [4].
Henry Ford wasn’t alone in his glowing assessment of ethanol’s future when he spoke
those words in 1925. Thomas Midgley, the head of the research lab at GM that developed
leaded gasoline, also stated ethanol was “the fuel of the future” and championed its use as
an anti-knock additive until GM partnered with Standard Oil to create the lead-additive
monopoly Ethyl Corp [4].
The small, but not inconsequential, difference in cost of production between ethanol and
oil fuels as well as effective lobbying by the petroleum industry has kept ethanol out of the
fuel market for decades. Ethanol’s virtue as a safe octane booster was buried by a concerted
effort in the 1920’s on the part of Ethyl. A government investigation headed by then
Treasury Secretary Andrew Mellon concluded tetra-ethyl lead (TEL) was a safe additive,
despite overwhelming historical evidence to the contrary. Mellon was owner of Gulf Oil,
the exclusive distributor of leaded gasoline in the South. A number of ethanol-blended fuel
companies sprang up in the Midwest during 1930’s, but a concerted public relations effort
on the part of the American Petroleum Institute and Ethyl Corp crushed these ventures.
5

Ethyl Corp was found guilty of anti-trust violations in 1940, but by then the “threat” of
ethanol had waned [4].
Ethanol’s role as a fuel additive began in the 1970’s, when federal subsidies lowered the
cost of production in line with gasoline and air quality regulations demanded oxygen
additions to fuel [5]. The political climate today has become more accepting, with methyl
tert-butyl ether (MTBE) bans in place in 15 states and ethanol blending requirements in
several Midwestern states [6,7]. Ethanol production capacity has grown 109% since 2000
and exceeds 3.5 billion gpy [7]. Despite this recent success, ethanol production by volume
is only 2.6% of US gasoline, and 1.7% of US petroleum use in transportation [3].
Ethanol Today
A fierce debate over the wisdom of ethanol blending in gasoline exists today.
Detractors suggest ethanol additives do little to stop urban smog [8] and that ethanol
production requires more energy than it releases [9]. Some question the use of food
producing land for fuel production. A few suggest that the federal ethanol and corn
subsidies are little more than corporate welfare for big agribusiness [9, 10]. Supporters of
ethanol tout it as a “green” route to increased domestic energy security [11, 7]. Some also
see it as the savior of the family farm, with the majority the profits from new ethanol
production going directly to farmer cooperatives [5]. Statistics in the hands of such
partisans can become more propaganda than science.
The debate on the virtue of ethanol-blended fuel exists almost completely outside
the debate on global climate change, but if ethanol is to become the fuel of the future,
questions about its global impact are relevant. There is no longer serious scientific debate
that carbon dioxide causes global warming [12]. Ethanol is a renewable fuel that is carbon
neutral, i.e. the carbon dioxide released by its burning is equal to the amount removed from
the atmosphere during the growth of the plant that it is made from. However, some energy
has to be put into growing biomass for ethanol, transporting it, fermenting and distilling it.
The net energy and carbon balances of ethanol are difficult to obtain and rely a great deal of
assumptions that are fiercely debated.
Ethanol is still the “fuel of the future” and it is not clear whether that future will
ever come. This paper examines ethanol, as a fuel and its production techniques, and the
direction of ethanol production will take in the future. Finally, life cycle analyses of the
economics and sustainability of ethanol will be discussed.
6

Ethanol as a Fuel
Ethanol is an organic compound (C2H5OH) also called ethyl alcohol and often abbreviated
EtOH. It is the simplest primary alcohol and can be synthesized through a variety of routes.
Industrial ethanol is often produced from petroleum feedstock using ethene (a.k.a. ethylene)
as a precursor. Ethene reacts with water in an acid environment to produce ethanol.
Commonly this is performed on silica aerogels substrates using phosphoric acid as a
catalyst. Compounds not fit for human consumption are added the resulting ethanol to
avoid the excise taxes placed on distilled spirits [13]. 170 million gpy of industrial ethanol
are produced via synthetic routes at two facilities in the US [14]. This represents over 60%
of ethanol used in manufacturing.
The vast majority of US ethanol is used in fuel. Nationwide, about 30% of US gasoline has
some ethanol blended in it [7] Unmodified engines can withstand up to 30% ethanol in
gasoline without damage, but at higher ethanol concentrations various rubber and plastic
engine components will deteriorate over time [15]. Ethanol blended gasoline is sold at two
grades. E10 fuel is 10% ethanol and can be used in unmodified gasoline engines. E10 is
sold as “reformulated” gasoline in locations where MTBE is banned and oxygenated fuel is
required [7]. All US car manufacturers currently offer “Flexible Fuel Vehicles” (FFVs) that
can run on an 85% ethanol blend called E85 [16]. FFVs can run on any blend of gasoline
from 0% to 85% ethanol, but most run on 0 or 10% ethanol blends since E85 is hard to
find. Only 222 service stations around the country offer E85, mostly in Minnesota. The
public gas station closest to Boston offering the fuel is 380 miles away in Maryland [17].
Ethanol is about 30% oxygen by weight [15]. This reduces ethanol’s energy density when
used in combustion. The low heating value (LHV) of ethanol is about 76330 Btu/gal, or
3.2x10⁶ Btu/bbl; gasoline is closer to 115000 Btu/gal (5x10⁶ Btu/bbl). [18] Pure ethanol has
an octane rating of 113, so adding it to gasoline can boost horsepower and prevent
“knocking” [19]. Ethanol advocates in the 1920’s noted 20% ethanol blends with gasoline
could boost octane rating 24 points for the same cost as a lead addition that would boost
octane only half as much. Refinery owners responded that the heating value, and thus
dollar value, of ethanol was only 60% that of leaded gasoline [4]. Gas mileage in FFVs
today drops commensurate with this heating value difference [11], but E85 prices in
Minnesota are roughly 75% that of gasoline, compensating consumers [20].
7
Today ethanol is not used to boost octane levels but rather to add oxygen to the fuel
[4]. Oxygenated fuel burns cleaner, producing less CO and particulates. Air pollution
regulations demand oxygenated fuels in much of the country. Ethanol competes with
MTBE as an oxygenating additive in reformulated gasoline. MTBE is inexpensive to
produce from fossil fuels, but it is water soluble and toxic. Groundwater contamination
from MTBE containing gasoline is a multi-billion dollar problem in California alone [21].
MTBE advocates counter than ethanol is ineffective at eliminating ozone and difficult to
use. A California study comparing areas with ethanol containing fuel vs. areas with MTBE
containing fuel showed a doubling of ozone exceedances in areas using ethanol but a
reduction in exceedances in areas using ethers [8]. Ethanol is hydroscopic, so pipelines
cannot be used because latent water in the lines would contaminate the fuel. Ethanol is
typically “splash-blended” in tankers at terminals before transport to service stations to
avoid this problem [8,15].
Ethanol has been shown to reduce a myriad of air pollutants, most notably
particulates and benzene [22]. Its effect on ozone, which forms through complex reactions
with VOCs, NOx, and CO, is less clear. 10% ethanol additions increase the vapor pressure
of gasoline by about 1 psi, and therefore VOC emissions [22, 23]. The VOC emission
problem is a consequence of blending ethanol and gasoline. Pure ethanol has a vapor
pressure of 2.4 psi [24], much lower than the 7-15 psi range of conventional gasoline [25].
E10 has been considered ozone “neutral” because the fuel reduces CO emissions much
more than MTBE thanks mostly to improved catalytic converter performance [22].
Gasoline producers can reduce VOC emissions from ethanol blends by removing high
vapor pressure hydrocarbons [25].
An alternative gasoline oxygenate is ethyl tert-butyl ether (ETBE). ETBE has a
much lower solubility in water than MTBE, mostly solving the groundwater contamination
problem. It is also not hydroscopic, so reformulated gasoline with ETBE can be transported
by pipeline. It does not increase gasoline vapor pressure. ETBE is derived from ethanol, so
it has the same benefits to farmers, the environment, and domestic energy security [25].
This promising alternative will probably not be widely adopted because legislation has
often dictated ethanol must be added to fuel.
Ethanol has many virtues as a fuel that made it the choice of many automotive
pioneers as “the fuel of the future.” However, its technical virtue is not enough for its
8
widespread adoption. The production of ethanol must be economically competitive with
gasoline for anyone to buy it. Furthermore, ethanol production must be sustainable at levels
that match demand for its widespread adoption to make sense.
Ethanol Production
Fermentation and Distillation
Fermentation and distillation have been used for thousands of years to produce ethanol
from sugar, but it wasn’t until the mid-18th century that the process was fully explained.
Decades of research have optimized this biological route to ethanol as an industrial scale
process for the production of liquid fuels. Today the vast majority of ethanol in the US is
produced from corn grain [27, 14].
Fermentation is the anaerobic digestion of sugars by yeast or bacteria to produce
ethanol and carbon dioxide. The overall reaction is:
(1) C6H12O6 2 C→ 2H5OH + 2 CO2 ∆G° = -227 kcal/mol C6H12O6
The reaction must proceed in the absence of oxygen because the respiration of glucose
releases much more energy and is therefore preferred by the organism.
(2) C6H12O6 + 6 O2 6 H→ 2O + 6 CO2 ∆G° = -686 kcal/mol C6H12O6
Only 15 kcal of the energy released during fermentation is actually captured in the form of
ATP, a molecule that the cell can use as a source of energy. This is an efficiency of 6.6%
[28], compared to 39.4% efficiency for direct respiration [29].
The cells themselves are not necessary for the production of ethanol. Enzymes
produced by the organisms are used to break down glucose, the basic component of sugar.
Enzymes are produced on an industrial scale using genetically modified organisms, and are
an important part of commercial ethanol production from non-sugar feedstock [27].
However, fermentation itself is universally performed via the cellular route, using yeast in
much the same way it has been done for millennia.
Yeast will die at 12-15vol% ethanol concentrations, the concentration of alcohol in wine.
Fermented liquor (called “beer”) is distilled to extract the ethanol. The distillation raises the
concentration of ethanol to around 95vol%. Distillation is unable to remove the final 5% of
latent water because the mixture boils at a lower temperature than either of the pure
9

components (a minimum-boiling
azeotropic mixture), as shown in the
Fig. 1 [30]. Molecular sieves are used
to produce the final, 200-proof product
[19].
Bioethanol Feedstock
Corn grain
The source of fuel ethanol in the
United States is almost exclusively corn
grain. Corn is approximately half grain
and half residuals (stalk, leaves, cob,
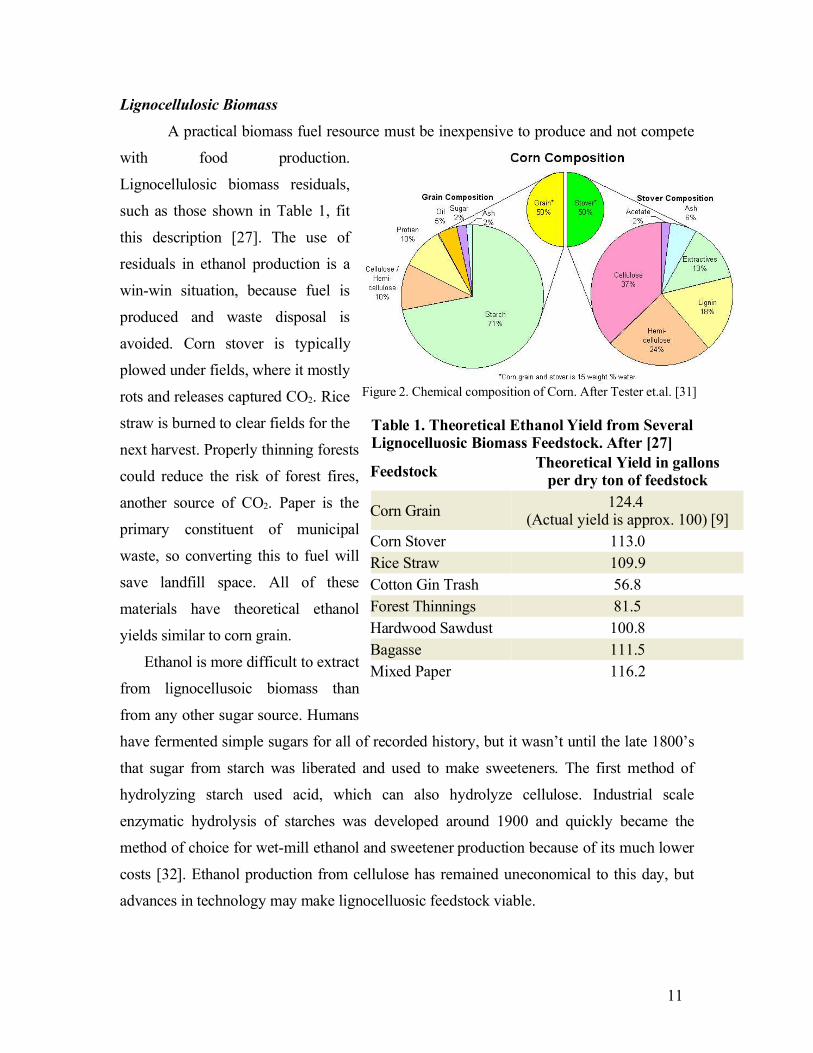
etc) that collectively are called stover. Only 1% of the plant is sugar that can be directly
fermented (Fig. 2), but about 72% of the plant consists of sugar-based polymers that have
the potential to ferment following processing [31]. The open, amorphous structure of starch
makes it easy to decompose using enzymes in a process called saccharification [27]. The
relative simplicity of the process accounts for both its early discovery (production of
ethanol from starch was being performed before 1900) and universal adoption [27].
However, cornstarch ethanol production wastes over 65% of the plant.
Domestic Alternatives to Corn Grain
Limited availability of corn grain as an ethanol feedstock makes the search for
alternatives imperative. Raw sugarcane is about 7% sugar, but dry it is almost 50% sugar.
The remainder, called bagasse, can be burned to provide heat for drying, ethanol
production, and electricity. Ethanol from sugarcane has been produced in Brazil at only
$0.63/gal, which is near or below the cost of gasoline production [15]. However, sugarcane
does not grow well in the cooler climate of the US. Sugar beets are a more promising
ethanol crop for the US, thanks to a high sugar content and better performance in the
climate of the US breadbasket [15]. Even so, domestic sugar production cannot compete
with foreign sugar cane prices, so growing sugar crops for fuel production is probably too
expensive to be practical in the US.
10
Figure 1. The Water-Ethanol Phase Diagram. Mixing two fluidscan create a mixture with a lower boiling point than eithercomponent. This sets the upper limit for the purity of distilledethanol at 95.6vol%. A similar diagram could be drawn withgasoline and ethanol, with the minimum near 10vol% ethanol.From [30].
Lignocellulosic Biomass
A practical biomass fuel resource must be inexpensive to produce and not compete
with food production.
Lignocellulosic biomass residuals,
such as those shown in Table 1, fit
this description [27]. The use of
residuals in ethanol production is a
win-win situation, because fuel is
produced and waste disposal is
avoided. Corn stover is typically
plowed under fields, where it mostly
rots and releases captured CO2. Rice
straw is burned to clear fields for the
next harvest. Properly thinning forests
could reduce the risk of forest fires,
another source of CO2. Paper is the
primary constituent of municipal
waste, so converting this to fuel will
save landfill space. All of these
materials have theoretical ethanol
yields similar to corn grain.
Ethanol is more difficult to extract
from lignocellusoic biomass than
from any other sugar source. Humans
have fermented simple sugars for all of recorded history, but it wasn’t until the late 1800’s
that sugar from starch was liberated and used to make sweeteners. The first method of
hydrolyzing starch used acid, which can also hydrolyze cellulose. Industrial scale
enzymatic hydrolysis of starches was developed around 1900 and quickly became the
method of choice for wet-mill ethanol and sweetener production because of its much lower
costs [32]. Ethanol production from cellulose has remained uneconomical to this day, but
advances in technology may make lignocelluosic feedstock viable.
11
Figure 2. Chemical composition of Corn. After Tester et.al. [31]
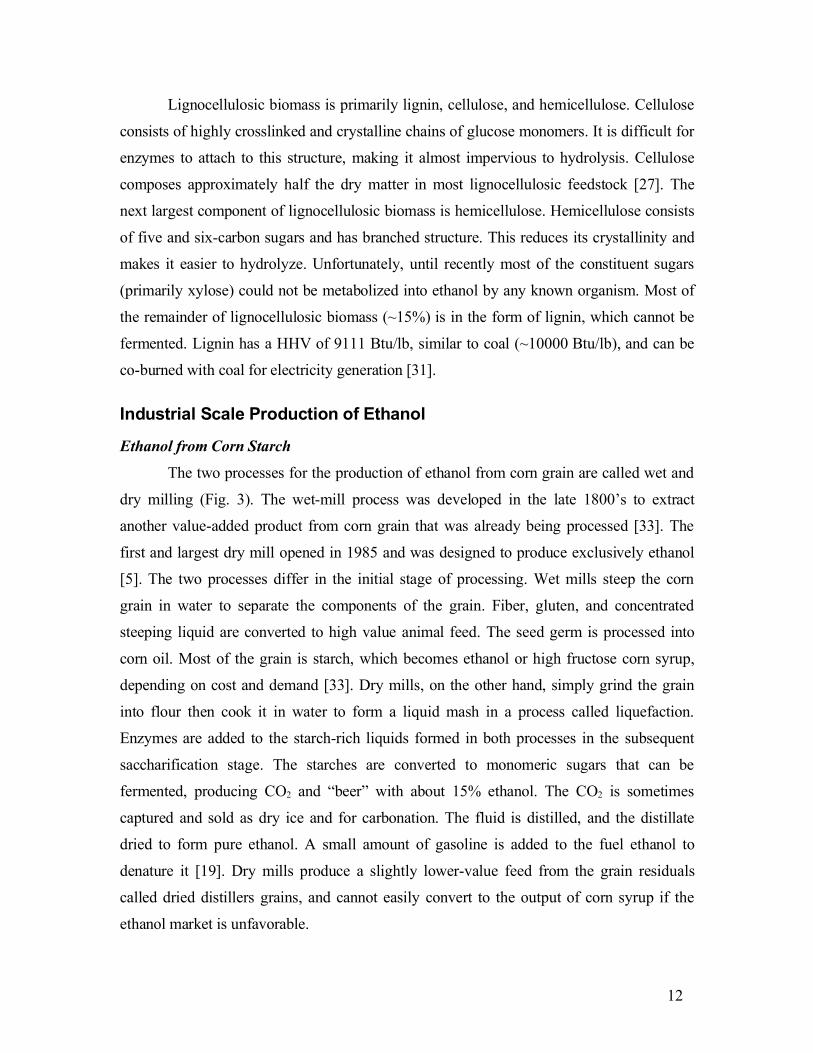
Table 1. Theoretical Ethanol Yield from SeveralLignocelluosic Biomass Feedstock. After [27]
FeedstockTheoretical Yield in gallons
per dry ton of feedstock
Corn Grain124.4
(Actual yield is approx. 100) [9]Corn Stover 113.0Rice Straw 109.9Cotton Gin Trash 56.8Forest Thinnings 81.5Hardwood Sawdust 100.8Bagasse 111.5Mixed Paper 116.2
Lignocellulosic biomass is primarily lignin, cellulose, and hemicellulose. Cellulose
consists of highly crosslinked and crystalline chains of glucose monomers. It is difficult for
enzymes to attach to this structure, making it almost impervious to hydrolysis. Cellulose
composes approximately half the dry matter in most lignocellulosic feedstock [27]. The
next largest component of lignocellulosic biomass is hemicellulose. Hemicellulose consists
of five and six-carbon sugars and has branched structure. This reduces its crystallinity and
makes it easier to hydrolyze. Unfortunately, until recently most of the constituent sugars
(primarily xylose) could not be metabolized into ethanol by any known organism. Most of
the remainder of lignocellulosic biomass (~15%) is in the form of lignin, which cannot be
fermented. Lignin has a HHV of 9111 Btu/lb, similar to coal (~10000 Btu/lb), and can be
co-burned with coal for electricity generation [31].
Industrial Scale Production of Ethanol
Ethanol from Corn Starch
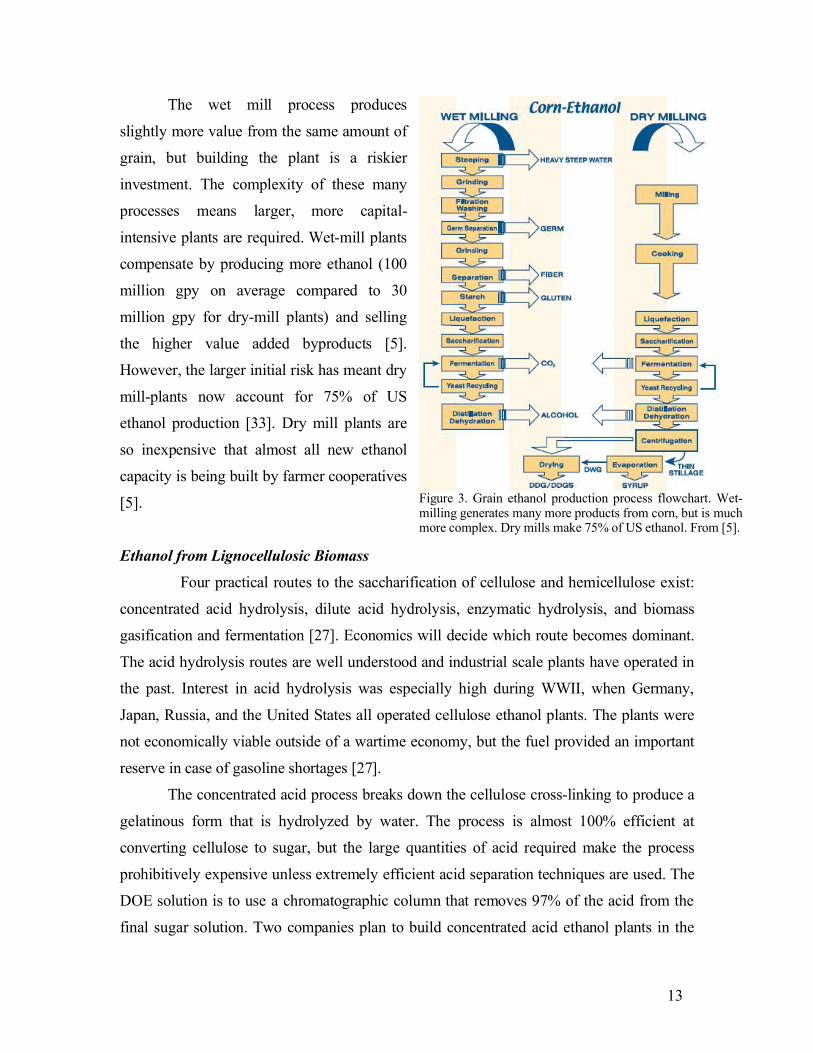
The two processes for the production of ethanol from corn grain are called wet and
dry milling (Fig. 3). The wet-mill process was developed in the late 1800’s to extract
another value-added product from corn grain that was already being processed [33]. The
first and largest dry mill opened in 1985 and was designed to produce exclusively ethanol
[5]. The two processes differ in the initial stage of processing. Wet mills steep the corn
grain in water to separate the components of the grain. Fiber, gluten, and concentrated
steeping liquid are converted to high value animal feed. The seed germ is processed into
corn oil. Most of the grain is starch, which becomes ethanol or high fructose corn syrup,
depending on cost and demand [33]. Dry mills, on the other hand, simply grind the grain
into flour then cook it in water to form a liquid mash in a process called liquefaction.
Enzymes are added to the starch-rich liquids formed in both processes in the subsequent
saccharification stage. The starches are converted to monomeric sugars that can be
fermented, producing CO2 and “beer” with about 15% ethanol. The CO2 is sometimes
captured and sold as dry ice and for carbonation. The fluid is distilled, and the distillate
dried to form pure ethanol. A small amount of gasoline is added to the fuel ethanol to
denature it [19]. Dry mills produce a slightly lower-value feed from the grain residuals
called dried distillers grains, and cannot easily convert to the output of corn syrup if the
ethanol market is unfavorable.
12
The wet mill process produces
slightly more value from the same amount of
grain, but building the plant is a riskier
investment. The complexity of these many
processes means larger, more capital-
intensive plants are required. Wet-mill plants
compensate by producing more ethanol (100
million gpy on average compared to 30
million gpy for dry-mill plants) and selling
the higher value added byproducts [5].
However, the larger initial risk has meant dry
mill-plants now account for 75% of US
ethanol production [33]. Dry mill plants are
so inexpensive that almost all new ethanol
capacity is being built by farmer cooperatives
[5].
Ethanol from Lignocellulosic Biomass
Four practical routes to the saccharification of cellulose and hemicellulose exist:
concentrated acid hydrolysis, dilute acid hydrolysis, enzymatic hydrolysis, and biomass
gasification and fermentation [27]. Economics will decide which route becomes dominant.
The acid hydrolysis routes are well understood and industrial scale plants have operated in
the past. Interest in acid hydrolysis was especially high during WWII, when Germany,
Japan, Russia, and the United States all operated cellulose ethanol plants. The plants were
not economically viable outside of a wartime economy, but the fuel provided an important
reserve in case of gasoline shortages [27].
The concentrated acid process breaks down the cellulose cross-linking to produce a
gelatinous form that is hydrolyzed by water. The process is almost 100% efficient at
converting cellulose to sugar, but the large quantities of acid required make the process
prohibitively expensive unless extremely efficient acid separation techniques are used. The
DOE solution is to use a chromatographic column that removes 97% of the acid from the
final sugar solution. Two companies plan to build concentrated acid ethanol plants in the
13
Figure 3. Grain ethanol production process flowchart. Wet-milling generates many more products from corn, but is muchmore complex. Dry mills make 75% of US ethanol. From [5].

US, both taking advantage of waste disposal problems. New California regulations prohibit
the burning of rice straw, forcing a paradigm shift in rice farming. Arkenol plans to build a
plant in Sacramento County using this feedstock to help farmers with the disposal problem.
The Masada Resource Group plans to build a plant in New York to convert cellulose in
municipal solid waste to ethanol. High dumping fees in the area make this economical [27].
Dilute acid hydrolysis is a two-step process where dilute sulfuric acid is added to a
biomass pulp, breaking down hemicellulose in the first step and cellulose in the second
step. Liquids are recovered after each step, neutralized, and fermented. The process suffers
cost and efficiency problems. No attempts are made to recover the acid used, although
much less is required than in the concentrated acid process. Dilute acid is unable to
hydrolyze all the cellulose to sugar, limiting yield to around 50%. Several companies are
building commercial plants despite these inherent problems. BC International operates a
pilot scale dilute acid ethanol plant in Louisiana using 500 tons/year bagasse feedstock
[34], and Tembec and Georgia Pacific are planning plants utilizing forest product residuals
[27].
The most promising process for cellulose saccharification is enzymatic hydrolysis.
Enzymes are relatively inexpensive to produce, once a properly engineered organism has
been developed, and the industry currently uses them extensively. Saccharification and
fermentation can be performed in one step if appropriate organisms and conditions are used,
lowing capital costs and increasing throughput. Research on cellusase began during WWII
with the goal of stopping the deterioration of soldiers’ uniforms in tropical climates. Three
groups of enzymes work together to break down crystalline cellulose. Engineering cost-
effective organisms to produce these enzymes and finding a strategy for using them to
produce high yields has prove extremely challenging. One company, Iogen, has developed
a proprietary enzyme cocktail that they will use in the first cellulose ethanol plant using
enzymatic hydrolysis [27]. A successful pilot plat producing ethanol from wheat straw has
operated in Ottawa since April 2004. The pilot achieved 81gal/ton straw, or almost 75%
efficiency. A full-scale 50 million gpy facility is expected to be online by 2008 [35].
Bioengineering may improve the yields of lignocellulosic ethanol conversion. Yeasts can
only metabolize glucose. Cellulose and starch are essentially polymerized glucose and can
easily be fermented once hydrolyzed. Hemicellulose is easier to hydrolyze than cellulose,
but a large fraction of the product is the sugars that yeast cannot ferment, such as xylose,
14

mannose, galactose, and arabinose. BC International has engineered a strain of E. Coli that
is capable of fermenting xylose, and adapted a pilot plant to separate the xylose fraction
from the glucose fraction of hydrolyzed lignocellulosic biomass. BCI claims conversion
efficiencies of over 90% with the combined process [34]. Research is underway by several
companies to develop organisms capable of fermenting the remaining pentose sugars.
NREL has developed a strain of the yeast Saccharomyces cerevisiae that is capable of
fermenting all 6-carbon sugars (glucose, galactose, and mannose) with 90% efficiency [11].
The laboratory also has patented an engineered bacterium Zymomonas mobilis capable of
fermenting all five biomass sugars [27]. Most organisms used in ethanol production are
modified to produce useful enzymes or to withstand conditions that improve efficiency. An
innovative idea developed by Agrivida, Inc. is to modify the feedstock plant itself to be
more amenable to saccharification. Corn has been modified to produce thermally activated
enzymes that aid in cellulose saccharification [31].
Biomass gasification is an altogether different route to ethanol production. Carbon
oxidized by moisture at elevated temperatures produces carbon monoxide and hydrogen.
This mixture is called synthesis gas, because it can be used to synthesize a number of
useful liquid fuels though a Fischer-Tropsch catalytic process. Methanol can be directly
synthesized in this way [36]. Ethanol can be produced from synthesis gas via
“fermentation” with anaerobic bacteria such as Clostridium ljungdahlii [27].
Bioengineering Resources, Inc. has developed the concept and is planning to build a pilot
plant [27]. Many biomass gasification plants have been built around the world for the
production of electricity [37].
Life Cycle Analysis of the Corn Ethanol Resource
The research described above details the technical feasibility of ethanol production, but is
says nothing about its economic and environmental sustainability. Life cycle analysis
(LCA) is one tool that can be used to better judge sustainability. Many ethanol LCAs
determine the net energy balance and assume, explicitly or otherwise, that ethanol
production is not sustainable if more energy must be put into its manufacture than is
obtained by burning it. This is not entirely valid, as previously discussed, but it forms the
backbone of the grain ethanol debate. All agree fossil fuels dominate energy expenditures
for the cultivation and manufacture of ethanol. This makes the claim that ethanol is
15
“carbon-neutral” essentially bogus. A car burning pure ethanol derived from a process with
break-even energy return is in fact burning fossil fuels (although certainly not petroleum) at
a rate identical to a car running on pure gasoline.
The remainder of this paper is devoted to examination of life cycle analyses for two
ethanol feedstock sources: corn grain and corn stover. Grain ethanol is already an important
transportation fuel. Lignocellulosic biomass such as corn stover seems to hold immense
promise as a domestic energy resource. These analyses help determine not if ethanol could
be the fuel of the future, but if it should be.
Grain Ethanol LCA
The energy balance of ethanol production is determined by examining the energy inputs of
each phase of production and comparing to the energy value of the products. Four phases of
production are usually considered: cultivation, transportation, and fermentation/distillation,
and blending/distribution. The products produced are ethanol and the various types of
animal feed produced from dry and wet milling.
The result needs to be placed in context. Grain ethanol currently competes with MTBE as
the primary oxygenating compound in gasoline. MTBE is a petroleum product but requires
more energy to produce than gasoline, which is reflected in its higher cost. The net energy
balance of MTBE is therefore somewhat less than the 80% average for the petroleum
industry. The primary energy inputs to ethanol are coal and natural gas. Neither requires
significant reforming, and transportation/extraction energy expenditures are generally a
small fraction of heating value. Thus, they have net energy balances near 100%. It follows
that if the net energy balance of ethanol is greater than ~80%, ethanol is a less fossil-fuel
intensive additive than MTBE.
The LCAs by Hosein Shapouri of the USDA [38] have consistently given ethanol a
positive net energy balance. The latest report (2004), places the balance at 167% (30528
Btu/gal), perhaps the highest value any study of the industry [38]. The consistently lowest
estimates of ethanol energy balance come from David Pimentel [9] of Cornell University.
His 2002 report gives ethanol a 77.6% energy balance (99119 Btu/gal). He is a vocal critic
of the ethanol subsidy program, calling the system unethical because in light of its
diversion of agricultural resources away from food and akin to corporate welfare for ADM
[9]. The USDA report is not clearly biased, despite Pimentel’s claims; other independent
16

studies have produced net energy balances as high as 156% [39]. Large errors are
associated with some estimates, and the model definition has a huge impact on the results
[40]. The following discussion will compare Shapouri to Pimentel to indicate the extent of
the error and the importance of model definition in these assessments.
The amount of grain required to make a gallon of ethanol is a critically important value for
an LCA because it forms the connection between the farm and the distillery. The current
(2004) dry-mill process requires 2.7 gal / dry bushel [5]. Pimentel quotes 2.54 gal/bushel;
Shapouri’s data suggests 2.64gal/bushel. The deviation from actual values is probably due
to the use of outdated data. Correcting both to 2.7 gal/bushel, Shapouri’s data indicates an
energy balance of 200% (38000 Btu/gal) and Pimentel indicates 82% (93000 Btu/gal). The
theoretical maximum grain ethanol efficiency is 3.2 gal/bushel [10]. Advances in ethanol
conversion technology alone could therefore push Pimentel’s assessment of ethanol’s net
energy balance to 97%.
Transportation and Distribution
The feedstock transportation and fuel distribution stages of the LCA have almost
negligible contributions to ethanol energy inputs. Shapouri and Pimentel both derive their
own estimates for feedstock transportation energy consumption. Shapouri estimates 2120
Btu/gal ethanol while Pimentel believes it is twice that. Ethanol cannot be transported via
pipeline, so less efficient tanker distribution is required [8]. Moreover, ethanol is
manufactured at distributed sites while MTBE is manufactured at the refinery and requires
almost no transportation to get it to the fuel terminals. Shapouri estimates the ethanol
distribution penalty at 1476 Btu/gal. Surprisingly, Pimentel neglects the energy cost of
ethanol distribution in his analysis, although he quotes 5000 Btu/gal in his discussion. The
total discrepancy for transportation between the studies is only 2% (1131 Btu/gal). Tad
Patzek [10] of UC-Berkeley believes the system should be further expanded to include the
energy of worker transportation to production/cultivation facilities. This dramatically
increases the energy cost of the process, but it leads to an unfair comparison to petroleum.
The energy for worker transportation is part of energy demand in the transportation sector
as the cost is borne by the worker, not industry.
Corn Cultivation
The cultivation of corn is where the largest discrepancies between the studies occur.
Shapouri indicates that cultivation accounts for 27% of the energy required to produce
17
ethanol, while Pimentel believes it is closer to 41%. The discrepancy accounts for 52%
(27871 Btu/gal) of the difference between the studies. Corn is a very energy intensive plant
to grow. Large amounts of chemical pesticides and fertilizer are added to cornfields to
produce high yields. Corn also requires about 100cm (39”) of water [9]. Most of this
arrives as rainfall in the major corn producing states, but irrigation is also applied on many
fields.
Pimentel and Shapouri differ greatly in how they account for the agricultural
resources used. Shapouri averages data from the 9 major corn-producing states (IL, IN, IA,
MN, NE, OH, MI, SD, and WI), which together account for 72% of total corn production
and 92% of ethanol production [38]. Shapouri’s result is therefore a reasonable estimate of
the actual energy balance of ethanol production. Pimentel derives his agricultural input
estimates from the much less efficient nationwide averages. This is a questionable decision
because corn growth is so inefficient outside of the major corn producing states that
economically it makes little sense to use corn grain feedstock for ethanol outside of the
Midwest. New ethanol capacity will therefore probably occur by an increase in crop yields,
driving down the energy required per acre, or by diverting more Midwest grain to ethanol
production. Either way, the Pimentel data exaggerates the costs.
It is not possible to compare in detail all of the assumptions made in the Shapouri and
Pimentel reports regarding agricultural inputs. Table 2 is an attempt at such a comparison.
Pimentel’s data was converted to Btu/bushel to compare to Shapouri’s results, and then
both studies results were normalized to 2.7 gal/bushel for an apples-to-apples comparison
of the studies. Irrigation costs appear to be a large discrepancy in the studies, but they are
difficult to directly compare. Pimentel calculates a direct energy cost starting with a
nationwide average for irrigation amount. Shapouri does not directly account for irrigation
cost except for purchased water in Nebraska (most locations can pump groundwater for
free). He accounts for irrigation energy in electricity costs and some fraction of the fossil
energy; most pumps are powered by electricity or gasoline. It is still clear that Pimentel
believes irrigation costs are much higher than Shapouri; this is a direct consequence of his
inappropriate use of a nationwide average for irrigation.
18

Both studies agree that nitrogen fertilizer is the largest energy input into corn
cultivation, accounting for roughly a third of the total agricultural energy input. Neither
author derived his own estimate for the energy required to produce nitrogen fertilizer.
Instead, expert opinions were used. The variation in expert opinion is notoriously wide
[41]. An examination of Patzek’s evaluation of this energy input demonstrates some of this
variation. Fig. 4, taken from his report, shows basically a learning curve for ammonia
production, a major source of nitrogen fertilizer. Patzek uses the argument that since most
ammonia is produced in plants at least 30 years old, the energy intensity of ammonia from
the 1960’s should be considered representative of all ammonia produced today. This is
extremely questionable. Plants using 50% more energy than new facilities would not be
competitive and would be shut down. Upgrades to older facilities make them less energy
intensive and competitive with new manufacturing sites. Still, the rapid change in
technology means use of data even 10 years old can have a huge impact on energy balance
results.
19
Figure 4. History of efficiency in ammonia production, inMJ/kg N. After Patzek [10].
Table 1. Direct Comparison of Agricultural Inputs into Shapouri [38] and Pimentel [10]Corn Grain Ethanol Life Cycle Analyses
Shapouri Pimentel Pimentel Shapouri Pimentel & of Total
Input BTU/bus BTUx1000/hectare Btu/bus5 Btu/gal6 Btu/gal6 DifferenceSeed 603 2080 6175 223 2287 11.0Nitrogen 23477 10952 32512 8695 12041 17.8
Potassium4 1899 744 2209 703 818 0.6Phosphate 1631 876 2600 604 963 1.9Lime 63 880 2612 23 968 5.0
Fossil Energy2 14964 5813 17256 5542 6391 4.5
Electricity 2258 136 404 836 150 -3.7Labor 1581 1000 2969 586 1099 2.7
Chemicals3 2941 900 2672 1089 990 -0.5
Transportation 202 1072 3182 75 1179 5.9
Irrigation1 136 3764 11174 50 4138 21.7
Machinery 5656 16790 6219 33.1
Total 49755 33873 100554 18428 37242 100.0
1 Most irrigation costs in the Shapouri report are included under fossilenergy and electricity2 Fossil energy is diesel, gasoline, LPG, and natural gas
3 Chemicals are herbicides and pesticides
4 Shapouri quotes a number for potash, the primary source ofpotassium5 Using 8590 kg/hectare yield (USDA 2001) and 57 lbs/bushel
6 Using 2.7 gal EtOH/bushel (Pimental uses 2.5, Shapouri 2.64)
The largest discrepancy in the studies- a third of the energy difference- is the
energy input regarding machinery. This is the largest cost input into corn cultivation,
according to Pimentel, and the second largest energy input. Shapouri dismissed this input
entirely; he states the data Pimentel used was outdated. This is a poor argument against
including the input, but including machinery costs still seems suspicious. Machinery is
required for commercial agriculture, but no additional machinery is required for ethanol
production, assuming that no new land is added for ethanol production. New land may
incur some incremental additional cost for machinery, but this incremental cost is much less
than the initial machinery costs required for farming any land. Using an average value for
machinery costs dramatically overstates this cost for ethanol production, which is
incremental on grain production in general. Also, machinery is used in all energy feedstock
production, much like labor transportation. It was not included in the estimate of petroleum
net energy balance derived in this paper and should therefore not be included in an estimate
of ethanol net energy balance.
Ethanol and Byproduct Production
The energy input to ferment and distill ethanol from corn is the largest contribution
to the total energy required to make the fuel. The Shapouri and Pimentel studies differ
sharply on how to properly account for the energy used and produced by this process. Not
all of the corn grain can be converted to ethanol. The byproducts are not thrown away or
burned, as the bagasse from sugarcane is, but rather dried and sold as high value feed.
Energy inputs are therefore required to keep the plant running, but the plant produces a
product that is more valuable than the coal that is burned and thus reduces the cost of
production.
The most straightforward comparison between Shapouri and Pimentel ignores these credits
entirely. This makes the reports startlingly similar. Shapouri states ethanol conversion
requires 49733 Btu/gal, while Pimentel quotes 54171 Btu/gal. About 80% of the energy
consumed is from the coal required for process heat; the rest is plant electricity, also mostly
coal derived [9]. Pimentel includes in his estimate energy required for the construction of
the plant, i.e. energy to build stainless steel vats, the concrete in the floors, etc. These
capital energy expenditures are akin to assigning an energy value to the building materials
in an oil refinery, and are therefore misleading. Pimentel’s estimate drops to only 48455
Btu/gal once these ancillary energy expenditures are removed.
20

An apples-to-apples comparison of the Pimentel and Shapouri reports is possible at this
point. Each was normalized to 2.7 gal/bushel and the energy expenditures on capital
equipment (machinery and dry-mill equipment) were subtracted from Pimentel’s data. The
results are 70450 Btu/gal ethanol are required according to Shapouri, while Pimentel
indicates 75889 Btu/gal are necessary. Both reports indicate a slightly positive- and
startlingly similar- net energy balance for grain ethanol [10].
The extremely dissimilar conclusions the two reports draw from this nearly identical data
is largely due to how they deal with the byproducts of ethanol production. Shapouri uses
the actual value of the feed obtained from the dry and wet mill plants. He works out a credit
in terms of energy not used to grow similar cattle feed, and then credits this energy to
various ethanol processes. Pimentel does not give any credit for byproducts in the results
prominently displayed in his tables. Buried in his discussion section, he credits ethanol with
producing only distillers dried grains. He steeply discounts the value of this feed and
assigns an accordingly low credit. This analysis is only valid if Pimentel is examining the
net energy cost of additional ethanol production, because the vast majority of new ethanol
production is from dry-mill plants that produce low-grade feed. This is inconsistent with
using averages for machinery costs. The incremental machinery costs for farming new land
are much, much lower than the initial cost.
The most straightforward credit for byproducts is to count their heating value
towards savings on coal consumption. Patzek argues that no credit should be given to
byproducts because any removal of material from a field degrades the soil and therefore all
byproducts should be returned to the fields to maintain topsoil integrity. This argument is
simply wrong. Even that analysis should credit the byproducts with some savings in energy
required for production of fertilizer. However, about half the biomass in a corn plant is
already left on the fields after collection of grain. This biomass is enough to actually
rapidly build soil carbon if proper farming techniques are used [11]. It is also more
reasonable that the byproducts would be burned on site than shipped back to the fields.
Approximately 25% of a corn kernel is oil, protein, and cellulose that end up as byproduct
(Fig. 1). 5.3 lbs of byproducts leave the plant for every gallon of ethanol produced (at 2.7
gal/bushel). Using the heating value of cellulose (7500 Btu/lb) to model the heating value
of the byproduct, 39600 Btu/bushel of heat can be produced by burning the fuels. This is
enough heat to replace the purchased coal required for running the distillery. It is also more
21

energy than either Shapouri or Pimentel credited byproducts (25250 Btu/gal and 6278
Btu/gal respectively).
Assessment of the Studies
The studies, when fairly compared, both suggest grain ethanol has a positive net
energy balance. Ethanol proponents can argue, based on this, that ethanol slightly reduces
fossil fuel consumption. Every gallon of ethanol used reduces the US oil consumption in
excess of 60%. Most of the fossil energy input into ethanol is coal, a huge domestic
resource, so ethanol almost certainly helps domestic energy security.
The most serious downfall of both the Pimentel and Shapouri studies from a
sustainability perspective is no quantitative accounting of externalities was included in
either study. The work of Pimentel raises a wide range of criticisms that apply more
broadly to industrialized farming practices than grain ethanol production in particular, such
as ecological damage from fertilizer and pesticide use and the energy cost of machinery
production. Unfortunately, Pimentel does not quantify these effects. The climate change
benefits of grain ethanol are unclear because a more carbon intense fuel than gasoline is
used to make ethanol. 5.3 lbs of coal (at 9000 Btu/lb) are burned to generate the ~48000
Btu of heat and electricity necessary for 1 gallon of ethanol. This amounts to 6.5 kg of CO2,
more than burning a thermally equivalent amount of gasoline (5.9 kg CO2 [18]). Byproduct
energy accounting is critical to the climate change picture.
The choice to turn to ethanol does not really depend on whether it is infinitely
sustainable, but rather if it is more sustainable than gasoline. Almost to a point the negative
attributes of corn ethanol have even more negative analogs in petroleum. Gasoline is at best
energy and carbon-equivalent with ethanol. Petroleum pollution is more dangerous than
fertilizer runoff. Ethanol combustion is cleaner than gasoline. Soil remediation takes
decades; oil reserve replenishment takes epochs. We can turn to ethanol use right now
without new infrastructure and without new automotive technology, unlike any other
alternative fuel. It is domestically produced and farmers clearly believe it benefits them.
Grain ethanol appears to be a clear winner.
Lignocellulosic Ethanol LCA
Grain ethanol’s biggest sustainability problem is there isn’t enough grain. The US produces
about 10 billion bushels of corn per year (2004) [USDA]. Currently, a bushel of corn
22

produces 2.7 gallons of ethanol [5]. This has been rising with improvements in the dry-mill
process, but the theoretical maximum is only 3.2 gal/bushel [10]. Adopting this maximum,
the entire US corn crop could produce 32 billion gallons of ethanol, roughly equivalent to
21 billion gallons of gasoline [9]. This represents only 16% of the total gasoline consumed
in the US in 2003 [3]. Furthermore, the increased use of corn grain as a fuel feedstock
should drive up the cost of grain, making it uncompetitive with gasoline [15, 9].
The answer to the feedstock problem may still be in the cornfields. Over half of the
residual material left after harvesting corn grain- collectively called corn stover- is
polymerized sugar that can be fermented with new technology. Corn stover and other
lignocellulosic residuals, such as rice straw, wheat chaff, sugarcane bagasse, and corn
stover- are almost the ideal feedstock: they provide fuel from garbage. However, residual
biomass collection and conversion pose several serious sustainability problems. A corn
stover LCA is examined below to demonstrate some representative issues.
Corn Stover LCA
John Sheehan et al. of The National Renewable Energy Laboratory (NREL)
published a life cycle assessment of corn stover derived ethanol in 2004 [11]. The report
analyzed the feasibility, possible production limit, and benefits of corn stover ethanol
production in Iowa. The life cycle of corn ethanol is shown schematically in Fig. 5. No
ethanol is produced commercially from corn stover, so the life cycle assessment dealt with
23
Figure 5. Corn ethanol fuel and gasoline life cycles. After Sheehan et.al. [11]
a hypothetical system that would be ideal for maximizing the crop yield while minimizing
environmental damage.
The NREL corn stover report focused on the sustainability of the practice.
Sustainability was defined by “stakeholders”: farmers, automakers, environmentalists, grain
processors, and researchers. The study defined 18 metrics for quantifying sustainability and
compared stover ethanol to gasoline for all of them. The depth of the study is too great to
review all aspects of it here, but a few of the major areas demonstrate the vast opportunity
and challenges of lignocellulosic biomass. The impact of stover ethanol on soil health, and
climate change and energy security will be reviewed.
Soil Health
Soil erosion has long been recognized critically important to the productivity of
agriculture. Poor tilling practices combined with a severe drought was responsible for the
1930’s “Dust Bowl,” a particularly stark example of the dangers wind erosion. Erosion
limits the productivity of soil by removing soil carbon (“humus”) and washing away vital
nutrients such as nitrogen, phosphorous, potassium, and trace metals. Today, soil erosion
rates are less than half that of the 1930’s and 1940’s, thanks in large part to adoption of
erosion limiting practices like contour farming and crop rotation [10]. A Penn State study
found that using modern, conventional farming techniques only a 1.7% change in soil
carbon occurred over the 20-year span of the study [10]. 90% of Iowa corn farmers practice
corn/soybean crop rotation and apply chemical fertilizers, practices similar to that study
[11].
The unsustainable removal of soil carbon and nutrients with the plant material sold
at market is called “soil mining.” Most farmers today remove grain at harvest and plow the
stover back into the fields, where it decomposes. This practice is referred to as “full-till” or
“conventional-till.” 75% of the plant matter is released as CO2; the remaining 25%
contributes to the replenishment of soil carbon [10]. Some studies suggest that the amount
returned to the soil is not enough to sustain growth of a new plant, meaning that soil mining
is occurring. Patzek’s extrapolations suggest that 20% of the soil carbon required to grow a
new crop is removed with each harvest [10]. Apparently this is a small fraction of total soil
carbon. The 1.7% soil carbon loss over 20 years of farming noted in the Penn State study
would suggest centuries of typical cultivation can occur before carbon depletion becomes
problematic.
24
Farming practices have a dramatic impact on the sustainability of stover production.
Almost half of Iowa farmers practice a form of conversation tillage, defined as a tilling
practice that leaves at least 1/3 of the soil covered by residue. Most of these farmers use
processes called “mulch-till” or “strip-till”. Mulch-till aerates the entire surface without
actually plowing under the surface residues. Strip-till plows the area where seeds are
planted but otherwise leaves the surface untouched. The most extreme form of conservation
tillage is “no-till.” A modified planter is used to slice open the soil and the seed and
fertilizer are “drilled” into it together, leaving almost no soil disturbed. Conservation tillage
dramatically reduces soil erosion and increases the amount of biomass returned to the soil
from residues. Some farmers have reported slightly lower yields with no-till farming. Strip
tilling appears to solve that problem, but is less protective of the soil. [42] Today, 26%
percent of Iowa farmers perform mulch or strip-till and 16% practice no-till. [11]
The issue of soil mining is addressed at length in the NREL study. Soil loss is not
caused exclusively by human cultivation; soil from Iowa has washed down to Louisiana for
millennia. Studies performed in 1970’s determined what level of soil loss could be
withstood without any serious effect on agricultural production. These studies have been
used to predict “tolerable loss limits” for various soil types. This tolerable loss limit was
used to calculate the amount of stover that could be collected without permanently
degrading the soil.
The amount of stover that could be removed without exceeding tolerable loss limits
is directly related to the level of tillage, so maximum corn stover production results when
all farmers switch to using no-till practices. 70% of the stover in the fields, amounting to
about 30 million tons, could be recovered safely if this practice was adopted. Only 40% can
be recovered if mulch-till practices were adopted [11]. Full-till data was not reported,
though extrapolating from the data given it appears very little stover collection is
sustainable using this practice. Soil carbon would increase by 32% over the next century if
corn-only, no-till farming was universally practiced and no stover was collected. This is a
substantial carbon sink and should be considered for carbon sequestration where stover is
not used for fuel production.
Ecosystem damage may prove to be the limiting factor for stover ethanol
sustainability. Soybeans are nitrogen-fixing plants and the corn-soybean crop rotation is
designed to reduce the amount of chemical fertilizers required. It has the ancillary benefit
25
of diversifying the field crops, somewhat reducing pest and disease outbreaks associated
with farming only one species [10,11]. The NREL study of stover ethanol assumes that
corn will be grown exclusively. The ecosystem changes resulting from the increased use of
fertilizers and pesticides can only be guessed at. These changes must be quantified and
weighed against the negative consequences of petroleum derived energy production before
a switch to corn-only crop production for ethanol is advisable [11].
Climate Change and Energy Security
The ultimate size of the stover ethanol resource is a major concern for energy
security. NREL reports the maximum amount of fuel produced from Iowa stover could
reach 8 billion liters, or over 2 billion gallons per year. The cost of feedstock delivery
makes even the full 8 billion liter biologically sustainable capacity of Iowa economically
untenable; the study projects 7 billion liters is practical before the fuel is uncompetitive.
[11] The nine major corn states collectively produce around 8 billion bushels of corn, which
result in about 225 million tons of stover [11]. Assuming a complete switch to no-till
farming, no change in yield, and 100% of the theoretical conversion capacity for corn
stover (113 gal/ton), this could contribute 17 billion gallons of ethanol (11 billion gallons
gasoline equivalent) to the nations fuel supply. This is only around 8% of the total US
gasoline consumption. Current proven corn stover conversion technology results in only 61
gal/ton, about half the theoretical capacity. The economics of stover collection dictate that
perhaps ¾ of the stover available could be collected, and no stover outside of the major
corn states will be used for ethanol. Combining these factors, a maximum sustainable
production of 4 billion gallons of stover ethanol a year is reasonable. This is about as much
ethanol as is produced from grain: less than 3% of the gasoline demand.
NREL does not dispute the stover supply is limited, but believes stover ethanol is a
positive step towards more energy independence. Stover ethanol, like grain ethanol,
requires little petroleum-derived energy to produce liquid fuel that directly replaces
gasoline. The primary fossil energy input is coal, which is domestically produced,
inexpensive, and vast in supply. NREL’s data suggests that an 80% reduction in petroleum
use per gallon of ethanol is possible. The resulting offset in oil imports would be
commensurate with the projected resource in the Arctic National Wildlife Refuge [11].
Stover ethanol’s impact on climate change is less clear. Climate change is affected
by a large number of variables. Carbon typically dominates because such large amount of
26
CO2 is produced during combustion of fossil fuels. For instance, burning a gallon of
gasoline releases about 8.9 kg of CO2 [18], accounting for 98.7% of the fuel’s total
greenhouse gas emissions [11]. A Michigan State study found that almost half of the total
greenhouse gas emissions from corn farming come from NOx emissions from nitrogen
fertilized fields [43]. NREL allots only 12% of the total greenhouse gas emissions from
corn cultivation to NOx, but believes much more fossil fuel is required to cultivate the
fields. The studies suggest corn agriculture to produce ethanol releases 20-25% of the
greenhouse gases that direct combustion of gasoline does.
The hypothetical process that will convert stover to ethanol is the key to the climate
change impact of stover ethanol. The NREL stover ethanol process does not exist, even at a
bench scale. Their hypothetical process produces enough heat from burning byproducts that
the conversion process is a net energy producer, with the excess heat generating enough
electricity to cover the energy of corn cultivation. It is worth comparing their data to the
well-quantified grain ethanol process. The lignin content of stover has a heating value of
3.1x10⁶ Btu/ton (17.5% lignin content in stover, 9100 Btu/lb). This corresponds to 39032
Btu/gal stover ethanol at the 81 gal/ton yield used in the NREL report. The Pimentel and
Shapouri data suggest this is significantly less than the energy required to make grain
ethanol (~50000 Btu/gal). The lignocellulosic biomass conversion process is more energy
intensive because the sugars in cellulose in hemicellulose are more tightly bound to each
other and because the efficiency of the conversion of the resulting sugars to ethanol is
lower. Thus, the NREL process seems extremely unrealistic. Assuming that the stover
process is only equally energy intensive as the grain ethanol process, about 11000 Btu/gal
will have to be supplied from fossil energy, probably coal (~9000 Btu/lb, 0.756 lb C/lb)
[18]. Burning this much coal releases about 1540 grams CO2 to the atmosphere, which adds
to an estimated 1617 g CO2 / gal ethanol for stover production and transportation [11]. This
more realistic process releases 3.2 kg CO2/gal stover ethanol, about 53% of an equivalent
gallon of gasoline. Efficient conversion technology is the key to the sustainability of
biomass fuels.
Conclusion
Ethanol has been the “Fuel of the Future” since the dawn of the automobile, but concerns
over the sustainability of continued petroleum consumption have pushed it into the
27
forefront of renewable energy research. Ethanol today is a clean, safe, and effective
replacement for MTBE in reformulated gasoline. It has the potential to play a much more
important role in fueling the nation.
Changes in the production methods and feedstock for ethanol are necessary for it to
become a serious replacement for gasoline. Grain ethanol consumes 10% of the current US
corn grain production but only accounts for 2.6% of the total US gasoline supply. The fuel
that is produced may have slight positive environmental impacts and significantly positive
impacts on domestic energy independence, but the resource simply is not large enough.
Lignocellulosic biomass holds the promise of greatly expanding the ethanol feedstock
resource, but it remains to be seen whether this promise can be translated into industrial
processes that actually perform in a globally sustainable, domestically energy-producing
manner.
The debate over the virtue of fuel ethanol has persisted for over a century. It has
pitted huge industries against each other in the courts and in legislatures. Ethanol has
consistently lost in the market because the technology simply couldn’t make it cheap
enough to compete with oil. We know today that price alone isn’t enough to make oil worth
buying. Air quality, energy security, ecological impact of production, and climate change
all contribute to the net cost of using a fuel. Ethanol is not the answer to all these problems,
but the balance of evidence suggests it can help. Sustainability isn’t about making a fuel
last forever. It is about making it last long enough that future generations will be around to
replace it. Using fuel ethanol is a step in the right direction.
28

References1. Bruntland, H.G. Our Common Future. WCED, New York. Oxford University Press. 1987.2. Manufacturing Energy Consumption Survey. Energy Information Administration. 2001.
http://www.eia.doe.gov/emeu/mecs/iab98/petroleum/energy_use.html3. Annual Energy Review 2003. Energy Information Administration. 2004.
http://www.eia.doe.gov/emeu/aer/overview.html 4. Kovarik, Bill. "Henry Ford, Charles F. Kettering and the Fuel of the Future," Automotive
History Review, Spring 1998, No. 32, p. 7 - 27. Reproduced on the Web athttp://www.radford.edu/~wkovarik/papers/fuel.html.
5. National Biobased Products and Bioenergy Coordination Office. “The U.S. Dry-MillEthanol Industry Biobased Products and Bioenergy Initiative Success Stories.”http://www.bioproducts-bioenergy.gov/publications.asp
6. DiPardo, Joseph. “Outlook for Biomass Ethanol Production and Demand.” EnergyInformation Administration. 2002. http://www.eia.doe.gov/oiaf/analysispaper/biomass.html
7. Dinneen, Bob. “Homegrown for the Homeland: Ethanol Industry Outlook 2005”.Renewable Fuels Association. 2005. http://www.ethanolrfa.org/outlook2005.html
8. Hodge, Cal. “Comment: Ban, don’t expand, ethanol use in US gasoline.” Oil & GasJournal, Oct. 6, 2003.
9. Pimentel, David. “Ethanol Fuels: Energy Balance, Economics, and Environmental Impactsare Negative.” Natural Resources Research, Vol. 12, No. 2, June 2003.
10. Patzek, Tad W. “Thermodynamics of the Corn-Ethanol Biofuel Cycle.” Critical Reviewsin Plant Sciences, 23(6):519-567. 2004.
11. Sheehan, John et. al. “Energy and Environmental Aspects of Using Corn Stover for FuelEthanol.” Journal of Industrial Ecology. Vol 7(3–4) p 117. 2004.
12. Appenzeller, Tim and Dimick, Dennis R. “Signs from Earth.” National Geographic. Sept.2004.
13. Boggen, Bill. “Alcohol, Chemistry and You: Sources and Uses of Ethyl Alcohol”Kennesaw State University, 2003. http://chemcases.com/alcohol/alc-03.htm
14. “Chemical Profiles: Ethanol.” The Innovation Group. http://www.the-innovation-group.com/ChemProfiles/Ethanol.htm Republished in Chemical Market Reporter. April2005
15. “Alcohol Fuel.” Wikipedia. http://en.wikipedia.org/wiki/Alcohol_fuel. Accessed April 26,2005.
16. “Alternative Fuel Vehicles.” US DOE Office of Energy Efficiency and Renewable Energy.http://www.eere.energy.gov/afdc/afv/afvehicles.html March 2005.
17. “Alternative Fuel Station Locator.” US DOE Office of Energy Efficiency and RenewableEnergy. http://afdcmap.nrel.gov/locator/LocatePane.asp. Accessed April 26, 2005
18. “Bioenergy Conversion Factors.” Oak Ridge National Laboratory Bioenergy FeedstockDevelopment. http://bioenergy.ornl.gov/papers/misc/energy_conv.html Accessed April2005.
19. “Ethanol Fuel & Your Vehicle.” American Association for Ethanol.http://www.ethanol.org/ Accessed April 2005.
20. “E85 Price Forum.” American Lung Association of Minnesota.http://www.cleanairchoice.org/outdoor/PriceForum.asp April 26, 2005.
21. “MTBE Cleanup Cost Grossly Underestimated.” Alexander’s Gas & Oil Connections.Vol. 6 # 22. Nov. 21, 2001. http://www.gasandoil.com/goc/news/ntn14782.htm
22. Whitten, Gary Z. “Air Quality and Ethanol in Gasoline.” National Ethanol Conference, Feb2004. http://www.ethanolrfa.org/pubs.shtml
29
23. “Evaluation of the Fate and Transport of Ethanol in the Environment” Malcolm Pirnie, Inc.Nov. 1998. http://www.calgasoline.com/studies.htm
24. Ohe, Shuzo. “Vapor Pressure Calculation Program: Ethanol.” http://www.s-ohe.com/Ethanol_cal.html Temp provided: 38.8°C (the conventional temperature fortesting gasoline vapor pressure. See [25]) Accessed April 2005.
25. “Motor Gasolines Technical Review.” Chevron. 2005.http://www.chevron.com/prodserv/fuels/bulletin/motorgas/0_introduction/
26. White, James S. “The Ethanol in Gasoline Penalty.” White Environmental Associates.Nov. 2003. http://www.calgasoline.com/studies.htm
27. “Biofuels for Sustainable Transportation.” US DOE Office of Energy Efficiency andRenewable Energy.http://permanent.access.gpo.gov/websites/www.ott.doe.gov/biofuels/advanced_bioethanol.html March 2003.
28. Henick-Kling, Thomas. “Alcoholic Fermentation: Pathways.” Cornell University FS 430.http://www.nysaes.cornell.edu/fst/faculty/acree/fs430/lectures/thk29ferment.html Feb.1997.
29. “Fermentation.” Mead Made Complicated.http://www.meadmadecomplicated.org/science/fermentation.html. May 2002.
30. Mayo, Dana W., Pike, Ronald M., Trumper, Peter K. Microscale Organic Laboratorywith Multistep and Multiscale Syntheses Wiley Online. 4th Edition.http://www.wiley.com/college/chem/mayo321850/ref/discuss.pdf Wiley Publishing.
31. Tester, J. “Biomass Energy.” Presented March 31, 2005 to MIT Sustainable Energy.http://web.mit.edu/10.391j/www/lecturenote.html
32. “What are Enzymes?” EuropaBio. http://www.europabio.org/module_14.htm 2005.33. “How Ethanol is Made.” Renewable Fuels Association.
http://www.ethanolrfa.org/student_made.html 2000.34. “BC International’s Technology.” BC International.
http://www.bcintlcorp.com/technology.htm Accessed April 2005.35. “Not Your Father’s Ethanol.” Businessweek, Feb 21, 2005.
http://www.iogen.ca/5000.html 36. Tester, J. et.al. Sustainable Energy-Choosing Among Options. January 2005.37. “Gasifier Inventory.” Biomass Technology Group. http://www.gasifiers.org/ 2002. 38. Shapouri, Hosein; Duffield, James; McAloon, Andrew; Wang, Michael. “The 2001 Net
Energy Balance of Corn-Ethanol.” Presented at the Corn Utilization and TechnologyConference, June 7-9, 2004, Indianapolis, IN.
39. Kim, Seungdo and Dale, Bruce E. “Allocation Procedure in Ethanol Production Systemfrom Corn Grain I. System Expansion” International Journal of Life Cycle Assessment (4)237-243 (2002)
40. Johnson, Jeremy. “Life Cycle Environmental and Economic Assessment: Biomassprocessing for ethanol production” Presented April 5, 2005 to MIT Sustainable Energy.
41. Golay, Michael. “Economic Feasibility Assessment Methods” Presented February 5, 2005to MIT Sustainable Energy.
42. Fisher, Kate. “Environmentally Friendly Farming.” The Corn and Soybean Digest. Feb. 1,2000.http://www.cornandsoybeandigest.com/mag/soybean_environmentally_friendly_farming/
43. Kim, Seungdo and Dale, Bruce E. “Cumulative Energy and Global Warming Impact fromthe Production of Biomass for Biobased Products.” Journal of Industrial Ecology. 7, (3–4)p147.
30