The surface phase at the ideal polarized mercury electrode: 2. Coulostatic measurements at the Hg...
17
Electroanalytical Chemistry and lnterfacial Electrochemistry, 51 (1974) 377-393 377 © Elsevier Sequoia S.A., Lausanne - Printed in The Netherlands THE SURFACE PHASE AT THE IDEAL POLARIZED MERCURY ELECTRODE 2. COULOSTATIC MEASUREMENTS AT THE Hg ELECTRODE IN DILUTE NaF AQUEOUS SOLUTIONS AT VARIOUS TEMPERATURES NGUYEN HUU CUONG, C. V. D'ALKAINE*, A. JENARD and H. D. HURWITZ Faculty of Sciences, UniversitO Libre de BruxeUes, 50, av. F. D. Roosevelt, 1050 Brussels (Belgium) (Received 19th October 1973) INTRODUCTION _ Numerous works have been published on coulostatic techniques applied to the study of electrode kinetics 1-3, electroanalytical problems 4-7, electroadsorption s' 9 and relaxation phenomena 1° 12. The method has also been applied to the measure- ment of the double layer capacity in dilute solutions 13 14. The present communica- tion shows some results obtained with this technique in the case of 10-1 to 10 4 mol kg -1 aqueous NaF solutions at 15, 25 and 35°C. Using these experimental data it is possible to perform an analysis on ground of the thermodynamic treatment which has been developed previously in Part 115 . Thus we wish to focus attention particularly on the derivation of the partial molar surface entropies of water at the mercury electrode in absence of specific ionic adsorption. EXPERIMENTAL Electronic circuit A schematic representation of the circuitry is shown in Fig. 1. The diagram represents the case of initial injection on the dropping mercury electrode (DME) of a given amount of charge provided by the discharge of a capacitor Ci (some nanofarad). This capacitor has been previously charged to the desirable amount using a d.c. power supply Vi connected through a 18 kO resistor. At this stage of the operation the voltmeter V m (Fluke 8300 A Digital Voltmeter) remains dis- connected. An electronic chronometer computes the time elapsed since the birth of each drop and gives the triggering pulse (Ext. Trig. IN) at a chosen moment (30 s). Then the program proceeds as follows: (1) Disconnection of the polarization source from the Pt counter electrode at time t 1 = t o + 1.75 ms. (2) Switching of the injection capacitor from Vi to the Pt electrode at t 2 = t o + 3.2 ms. Consequently the Hg electrode receivesthe charge and the potential Eing~t jumps to ~Hg~'t- * Present address: Instituto Nac. Tecnologia Industrial, Libertad 1235, Buenos Aires, Argentine.
-
Upload
nguyen-huu-cuong -
Category
Documents
-
view
215 -
download
3
Transcript of The surface phase at the ideal polarized mercury electrode: 2. Coulostatic measurements at the Hg...
Electroanalytical Chemistry and lnterfacial Electrochemistry, 51 (1974) 377-393 377 © Elsevier Sequoia S.A., Lausanne - Printed in The Netherlands
T H E SURFACE PHASE AT T H E IDEAL P O L A R I Z E D M E R C U R Y E L E C T R O D E
2. C O U L O S T A T I C M E A S U R E M E N T S AT T H E Hg E L E C T R O D E IN D I L U T E NaF A Q U E O U S S O L U T I O N S AT VARIOUS T E M P E R A T U R E S
NGUYEN HUU CUONG, C. V. D'ALKAINE*, A. JENARD and H. D. HURWITZ
Faculty of Sciences, UniversitO Libre de BruxeUes, 50, av. F. D. Roosevelt, 1050 Brussels (Belgium)
(Received 19th October 1973)
INTRODUCTION _
Numerous works have been published on coulostatic techniques applied to the study of electrode kinetics 1-3, electroanalytical problems 4-7, electroadsorption s' 9 and relaxation phenomena 1° 12. The method has also been applied to the measure- ment of the double layer capacity in dilute solutions 13 14. The present communica- tion shows some results obtained with this technique in the case of 10-1 to 10 4
mol kg -1 aqueous NaF solutions at 15, 25 and 35°C. Using these experimental data it is possible to perform an analysis on ground of the thermodynamic treatment which has been developed previously in Part 115 . Thus we wish to focus attention particularly on the derivation of the partial molar surface entropies of water at the mercury electrode in absence of specific ionic adsorption.
EXPERIMENTAL
Electronic circuit
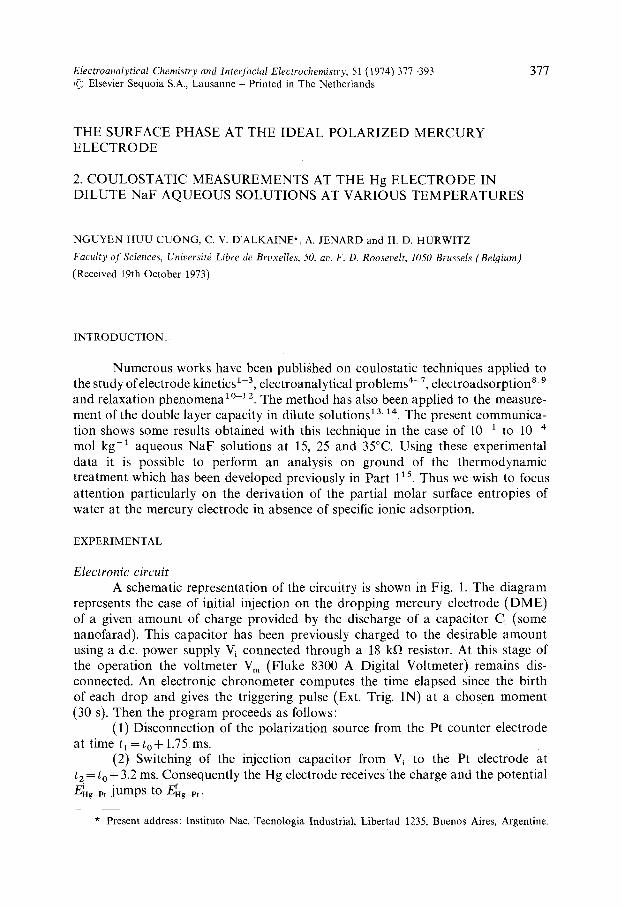
A schematic representation of the circuitry is shown in Fig. 1. The diagram represents the case of initial injection on the dropping mercury electrode (DME) of a given amount of charge provided by the discharge of a capacitor Ci (some nanofarad). This capacitor has been previously charged to the desirable amount using a d.c. power supply Vi connected through a 18 kO resistor. At this stage of the operation the voltmeter V m (Fluke 8300 A Digital Voltmeter) remains dis- connected. An electronic chronometer computes the time elapsed since the birth of each drop and gives the triggering pulse (Ext. Trig. IN) at a chosen moment (30 s). Then the program proceeds as follows:
(1) Disconnection of the polarization source from the Pt counter electrode at time t 1 = t o + 1.75 ms.
(2) Switching of the injection capacitor from Vi to the Pt electrode at t 2 = t o + 3.2 ms. Consequently the Hg electrode receivesthe charge and the potential Eing~t jumps to ~Hg~'t-
* Present address: Instituto Nac. Tecnologia Industrial, Libertad 1235, Buenos Aires, Argentine.
378 N. H, C U O N G , C. V. D ' A L K A I N E , A. J E N A R D , H. D. H U R W I T Z
L•E
POL ~HT O(~T IN __VmeslN [Vines
. . . . . . . . . . . . . . . . . - - I - i - - v . . . . . . . . - t b . . . . . -tI - - ~ - - - @+PoL N ',
. . . . . . . . . . . . . . . . . . . . . . . , . . . . . . . . . . . . . . . . . . . . . . . . . .
Fig. 1. Schemat ic d iagram of coulostat ic circuitry.
V Trig
(3) Connection of Vm to the counter electrode at t 3 = to+4.0 ms. (4) Triggering of V m at t4 = to + 9.0 ms (minimum). The voltmeter samples
the input signal within a maximum of 1.5 ms. Optionally, supplementary delays of 5, 25, 50 and 100 ms and combinations thereof might be introduced between t 2 and t 3.
Reagents NaF of high analytical purity was heated to 600°C during 48 h i n a Pt
vessel. The portion of the product in contact with the vessel wall was discarded. The solutions were prepared with tridistilled water, the second distillation being performed with KMnO4 (specific conductance of water ~ 2 x 10 6 y~-i cm-1).
Cell The cell consists of a main compartment with the capillary electrode and
counter electrode, and a reference electrode compartment. Both compartments are interconnected through a solution-sealed glass stopcock. At the bottom of the main compartment is a glass jet serving to bubble prepurified and presaturated N 2 during at least 30 min. Nitrogen is also introduced above the solution during the measurement.
The whole experimental System is placed in an air thermostat. Control of temperature in the solution is obtained within +0.2°C. The mercury flow rate (about 0.130 mg s 1) is measured at 30 s drop age (the total drop life is about 1.30 min) and checked before and after each set of runs.

COULOSTATICS AT Hg IN NaF AT VARIOUS TEMPERATURES 379
The potential of zero charge is measured by means of the streaming electrode method 16 and in the case of dilute solutions (10 -3 and 10 .4 mol kg 1) from the position of the minimum differential capacitance.
Determination of interfacial tension is obtained by the maximum bubble pressure method 17'1s. For calibration the value 426.2+0.2 mN m 1 in Na2SO4 0.05 M at the electrocapillary maximum at 250C 19 w a s used.
Experimental procedure Two procedures have been followed: (1) Direct measurement of the electrode
potential increment AEng~c r resulting from the coulostatic injection of a given amount of charge on the electrode initially polarized at the p.z.c.; (2) summation of small increments of the electrode potential of about 100 mV caused by successive small jumps of charge used to set up the charge~otent ia l curve.
In order to get the potential difference with respect to the normal calomel electrode one measures separately the potential differences UHg~t between the Hg electrode and counter electrode after injection, E~Hgq,, and Eng~CE between the Hg electrode and respectively the Pt electrode and reference electrode before coulostatic injection.
Using supplementary delays between t 2 and t a, the potential transient is recorded, and extrapolation to t 2 is made graphically in order to obtain the correct electrode potential.
In view of the oscilloscope and digital reading of potential transients, it has appeared that slopes of potential vs. time curves are always less than 0.5 mV ms-1. Such a decrease follows from the drop growth (a theoretical correction for this effect can be introduced) and from the presence of traces of O2 and impurities.
The occurrence of most double layer relaxation effects may be ignored since usually 1°-12 the lifetime of relaxation phenomena is less than t4- t2-
RESULTS AND DISCUSSION
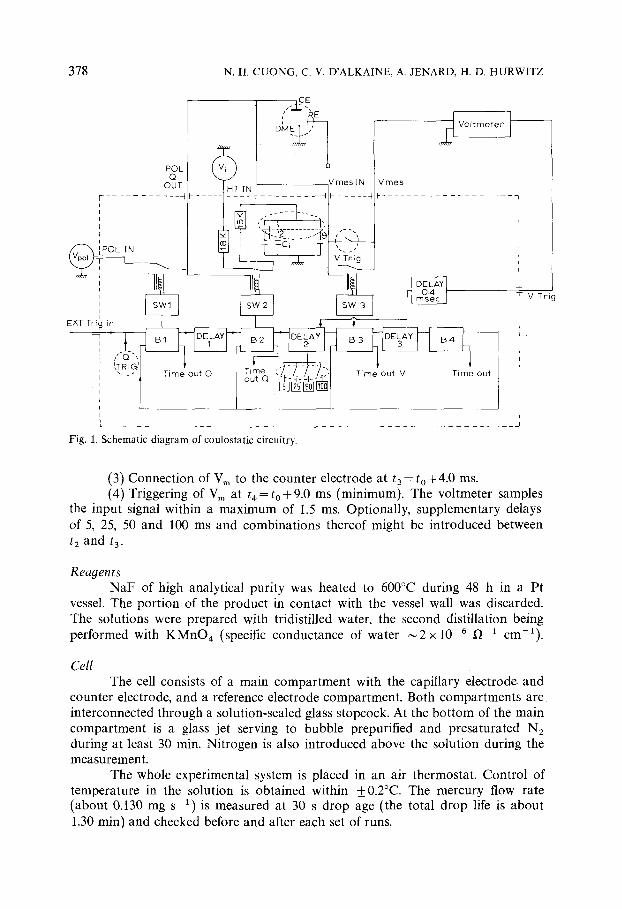
(a ) Consideration on electrocapillary data Interpolated experimental results for 10-1 to 10- 4 tool kg- 1 NaF at 15, 25 and
35°C, are shown in Tables 1-3. Calculated values obtained by integration of our capacity potential measurements for 10 -1 tool kg-1 solution are also given for comparison.
Scattering of potentials is less when the procedure of successive small jumps of charge is followed than with that of large coulostatic injection. Therefore, most of our reported results have been obtained by means of the former procedure.
The errors associated with the data reported in Tables 1-3 have been estimated as follows. Charge densities are given within 0.2~o. The experimentally computed relative standard deviation s has been obtained in each system for about 10 values of the potential measured at t 4. Similar relative deviations have been computed at t 4 + various delays.
It has been found that for 10 -1 mol kg -1 solutions s~0.2~o, for 10 . 3 tool kg-1 solutions s ~ 0.7~o over the total range of charges; for 10-4 mol kg-1 solutions s,-~ 1~o near the p.z.c, and reaches a maximum of ,-~ 3~o at extreme negative charges. Accordingly, the error on summed extrapolated potentials is supposed to be within
(Continued on p. 386)

380 N . H . C U O N G C. V. D ' A L K A I N E , A. J E N A R D , H . D. H U R W I T Z
,..j
.< [..
r,.)
b-
Z ©
,....1 ©
z
©
H
" E "
I t - . .
H
eq
"" I
o II
¢5
I
~ ~ I I I
t t '5
v2.
I
~ - - t l l
C O U L O S T A T I C S A T H g I N N a F A T V A R I O U S T E M P E R A T U R E S 381
I I I I I I I I I I I I I I I
I I I I I I I I I I I I 1 - -
I I t I I I I I I I I I t I I - -
I I I I I 1 I I I I I I I I I - -
'77779 7777 77
q
I 1 1 1 1 1 1 1 1

382 N . H . C U O N G , C. V. D ' A L K A I N E , A. J E N A R D , H. D. H U R W I T Z
II
H
[--
t¢3
C N ~ f
G
~a
~ ~ i i ~ I
I
¢.q
I

COULOSTATICS AT Hg IN NaF AT VARIOUS TEMPERATURES 383
I I I I I I I I I I I I I I ~ I
I I I I I . I I I I I I I I I I
I I I I I I I I I I I I I I I ~
i I I I 1 1 1 1 1 1 1 1 1 1 i~
I I 1 1 1 I I I 1 1 1 1 1 1 I~
'TTSSSSS~T~SSS~
I ITTSTTTTSTT TSS
oo
T,TT,TTTTT

384 N . H . C U O N G , C. V. D ' A L K A I N E , A. J E N A R D , H. D. H U R W I T Z
¢'¢3
z ©
0 ~
< N z -~
R
H
H
H
eq I
:Zk
~ ~ I i ~ I
~ ' , q . ~ eqeq
e e 3 t ~ q , . q ~ ~ ~ ~ , ~ -
I I

COULOSTATICS AT Hg IN NaF AT VARIOUS TEMPERATURES 385
I I 1 I I I I I I I I I I I ~
I I I I I I 1 I I I I I I I I
I I I I I 1 I I I I I I I I I I
I I I I I I I I I I I I I I I I
I I I I I I I I I I I I I I I I
I I I I I I I I I I I I I I I I ~
I I I I I I I I I

386 N . H . C U O N G , C. V. D ' A L K A I N E , A. J E N A R D , H. D. H U R W I T Z
+0.4~o for 10 -I mol kg -1 solutions, _+0.9~ for 10 -3 mol kg -1 solutions, 1~ and 2~o for 10 -4 mol kg -1 solutions respectively at the p.z.c, and on the extreme cathodic side. Large relative standard deviations in the latter case are probably related to the instability of the counter electrode potential and to effects of the diffuse layer relaxation tailing after a delay of 5.8 ms.
The electrocapillary curves resulting from integration of charge density potential curves are shown in Fig. 2 and Table 4. Good agreement is found between the calculated curves and direct measurements of surface tension for 10-1 mol kg -1 solution. Such agreement is found on the negative branch for other solutions. It is worth stressing that for more dilute solutions than 10-1 tool kg- ~ reliable results can only be obtained in a region restricted to 0 1000 mV v s . NCE.
425
4 0 0
E z E
g
0)
375
"C o
c
350
325 I I
(b)
/(a)
] - 5 0 0 - 1 0 0 0
E/Mi l l ivo l ts vs. ENC E25°c - 1 5 0 0
Fig. 2. Electrocapillary curves for NaF solutions at 25°C calculated by integration of q'-E curves. The integration constants are taken as: (a) 10 -1 mol kg 1 N a F : 399.0 m N m -1 at - 1 0 0 0 mV vs.
2 5 ~ C . 2 5 ' C . Er~c~ , (b ) 10 -2 mol kg 1 N a F : 403.8 m N m -1 at - 1 0 0 0 mV vs. E~c E , (c) 10 3 mol kg -1 N a F :
415.9 m N m t at - 9 0 0 mY vs. E~:~ ~c.

COULOSTATICS AT Hg IN NaF AT VARIOUS TEMPERATURES 387
TABLE 4
SURFACE TENSION (in mN m -1) OF THE Hg ELECTRODE AS A FUNCTION OF THE MOLALITY OF THE NaF SOLUTION AND OF THE POTENTIAL DIFFERENCE vs. NCE AT THE SAME TEMPERATURE
The integration constants are underlined
E/mV 10 1 molkg 1 10 2 molkg t 10 3 molkg -~
15°C 25°C 35°C 15°C 25°C 35°C 15°C 25°C 35°C
000 400 .2 399.5 398.5 405.9 405.0 404.2 411.9 410.6 409.9 100 410~9 410.0 408.9 415.1 414.1 412.9 419.1 418.1 416.9 200 418.8 417.7 416.5 421.6 420.5 419.1 424.5 423.0 421.6 300 424.1 422.9 421.5 425.7 424.4 422.8 427.3 425.7 424.1 400 426 .9 425.6 424.1 427.6 426.3 424.6 428.4 426.8 425.2 450 427.5 426.1 424.6 427.9 426.6 424.9 428.5 427.0 425.3 500 427 .4 426.0 424.6 427.9 426.6 424.9 428.5 427.0 425.3 600 425.8 424.5 423.0 426.8 425.5 423.9 427.9 426.4 424.8 700 422 .0 420.9 419.6 424.0 422.8 421.3 426.0 424.6 423.1 800 416.3 415.3 414.2 419.3 418.3 416.9 422.3 421.2 419.8 900 408.8 408.0 407.0 412.7 411.9 410.8 416.8 415.9 414.7
1000 399.5 399.0 398.2 404.4 403.8 403.0 409.4 408.8 407.9 1100 388.6 388.3 387.7 394.4 394.1 393.5 400.4 400.0 399.4 1200 376.1 376.1 375.7 382.8 382.8 382.5 389.7 389.6 389.3 1300 362 .0 362.3 362.0 369.6 369.9 369.9 377.5 377.6 377.6 1400 346.3 346.8 346.8 354.7 355.3 355.7 363.7 364.0 364.3 1500 328 .9 329.7 " 329.9 338.2 339.2 339.9 348.3 348.8 349.5
This has also been observed by Barradas and H e r m a n n 2° in the case of dilute LiC1 solutions.
Exper imental results of charge-poten t ia l curves agree very well with the values calculated using the potent ial drop in the diffuse layer as ob ta ined from the G o u y - C h a p m a n theory and the potent ial drop in the inner layer derived from the c h a r g e ~ o t e n t i a l curves measured for 10-1 mol k g - 1 solut ions assuming no specific adsorpt ion. This is indicated in Tables 1-3 and Fig. 3 from which it appears, however, that the experimental values are systematically higher than the theoretical ones for 10 -4 mol kg-~ solut ions at potent ials far from the p.z.c. This discrepancy is slightly larger than permit ted by the errors.
( b ) Determinat ion o f the partial molar adsorption entropy o f water In a previous paper 15 the the rmodynamic der ivat ion of part ial molar surface
properties has been presented in detail. Actually the isothermal electrochemical cell considered here is of the k ind Cu[Hg electrodeJaq.NaF solutionfcalomel electrode[Cu for which one gets, in absence of specific ionic adsorpt ion,
d(7 + q~ EAB)p. mN.r. = d(~)p . . . . . = E AB dq ~ - [Fo~ ( ~ - ~ ) + F,. d(Na +, F - )
- q ' E ~ ' n g ] d T (1)
Equa t ion (1 )ho lds in the case of negligible temperature coefficients for the l iquid j unc t i on potent ia l and for the contact potent ia l Cu-Hg . The symbols used have

388 N. H. CUONG, C. V. D'ALKAINE, A. JENARD, H. D. HURWITZ
o
I LU
- 1 0 0 0
- 5 0 0
+ 5 0 0
/ /
. , / ' /
/ / ×
.+ /
I I I I I I I + 1 0 + 5 0 - 5 - 1 0 - 1 5 - 2 0
Charge dens i t y / / . tC cm -~
Fig. 3. Experimental and calculated potential E-E~ vs. q~ for the Hg/NaF aqueous solutions at 25°C. Grahame's data are also shown for comparison. ( ) Coulostatic method (10-1, 10- z, 10- 3, 10-~ mol kg-l) ; ( x ) bridge method (10 -1 tool kg 1); (+ ) calculated values (10 2, 10-3, 10 4 mol kg 1); (Q) Grahame (10 -1, 10 -2, 10 -3 N)21; (A) Grahame calcd. (10 -3 N) 21.
the following meaning; 7 is the surface tension; q" is the charge density on the Hg electrode; E AB represents the electromotive force of the cell; Fo, is the surface phase density of adsorbed water; ~ and ~ are the partial molar surface entropy and the partial molar bulk entropy of water, respectively; Fs, a corresponds to the contribution of the diffuse part of the electrochemical double layer and ET #'Hg is the temperature coefficient of the calomel electrode (at 25°C ET~'Hg = --0.5814 mV K - t for the 1 tool kg-1 KC1 calomel electrodeZ2).
Let us further recall that eqn. (1) relies on the convention FHg+ =0 and that the expression of F~,d, computed by means of the Gouy-Chapman model, becomest 5
/2RTsJpa~½( [_ {~ In epd\ q F~,d(Na+,F-) = - R ~ - ~ ~) /2A c o s h - l ( l + A 2 ) ~ - L 3 + ~ J p s J ,
• [ (1 + A2) ½ - 1]} (2a)
where
A = q~/{2 RTeJpd/rc} ~ (2b)
COULOSTATICS AT Hg 1N NaF AT VARIOUS TEMPERATURES 389
+ I.C
+ 0 . 5
- 0 . 5
- 1 . 0
"a "/3 1 -L # / mV K-1
-p.T. tuNa F
A +
%,, 0 0 ~&
A & ¢X /X
&
I I I I I I S -- +10 0 - 1 0 - 2
C h a r g e d e n s i t y / p C crn -2
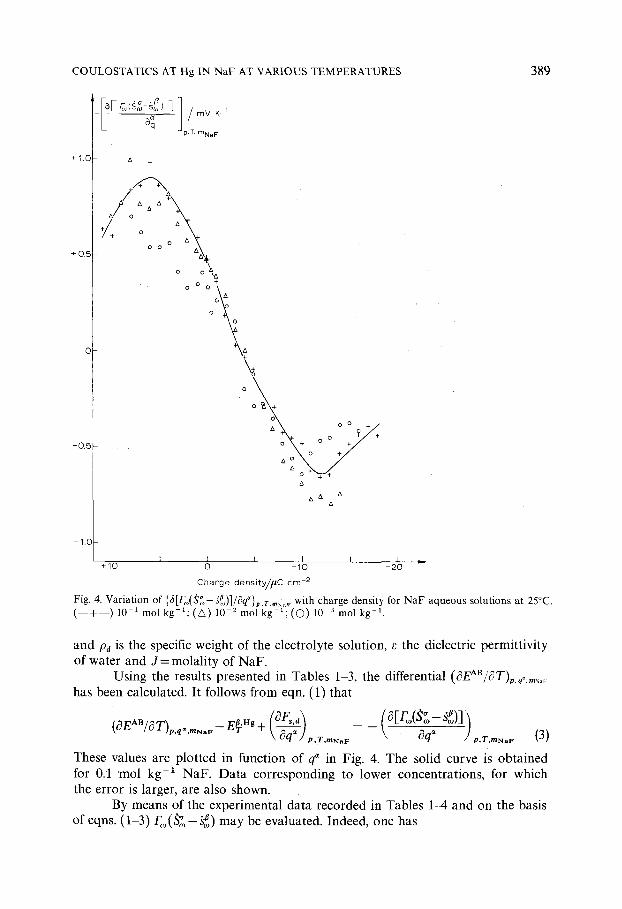
Fig. 4. Variation of {5[F, (~,-h~,)]/Oq~}p .T . . . . with charge density for NaF aqueous solutions at 25°C. ( - - + - - ) 10 1 m o l k g - 1 ; ( A ) 10 - z m o l k g - t ; ( O ) 10 3 m o l k g - t .
and Pa is the specific weight of the electrolyte solution, ~ the dielectric permittivity of water and J = mola l i ty of NaF .
Us ing the results presented in Tables 1-3, the differential (#EAB/#T)p.¢. . . . .
has been calculated. It fo l lows from eqn. (1) that
" ~ "a "fl (OEA"/OT), q" , , , F - E~ ng + ~ _~.~, j (o [r ,o(S ,o- so~)] = - \ WG_~ -
' ' " \ q / t , r mNaF Oq Jp,T,mNaF (3)
These values are plotted in funct ion o f q~ in Fig. 4. The solid curve is obta ined for 0.1 m o l kg -1 NaF . Data corresponding to lower concentrat ions , for which the error is larger, are also shown.
By means of the experimental data recorded in Tables 1M and on the basis o f eqns. (1 -3 ) F~o ( ~ - ~ ) m a y be evaluated. Indeed, one has

390 N . H . C U O N G , C. V. D'ALKAINE, A. JENARD, H. D. HURW ITZ
( 0 ¢ ) .. .p ~ q~ E ~ n ~ ~ f ~ ~ ~Na ~ ~F ~ ~ = - [ r o ( & - . . . .
p,qCt,mNaF
(4)
This result is illustrated in Fig. 5 where the bell shape curve culminates at about - 4 #C cm 2 (q~ corresponding to the crossing of the ordinate zero in Fig. 4 is - 3 . 8 #C cm-2 ) . The plot further indicates that there is no significant difference
between the value obtained for various concentrations, since the estimated error is about 0 . 2 4 x 1 0 -9 cal ~ cm - z K -1 for 10 -1 mol kg -1 and still increases with dilution of the electrolyte. Taking for example a model of hexagonal arrangement of water molecules in a monomolecular layer (F~) 1 ranges from 41 x l07 cm 2 m o l - 1 to 106 x 107 cm 2 m o l - 1 depending on whether the Van der Waals diameter of the water molecule (2.8 to 3.9 ~ according to the orientation of the molecule) 23 is taken into account, or the distance of 4.5 A between water molecules hydrogen bonded by an intermediate third molecule located out of the plane of adsorption 24. The choice of an average value of 71 x 107 cm 2 m o l - t corresponding to a diameter of 3.7 A has been made. It yields at the maximum in Fig. 5 ( ~ - & ~ ) - ~ 2 . 7 cal m o l - 1 K 1 which is large in comparison with changes of &~ with concentration.
-- ~ )p ,T , m N a F , q a x 1 0 9
/ c a l K -1 c r ~ 2
o o o
o o I o o a a n Z~ o 0 . 0 1 m N m -1 K -1
o A 0 A A 0
0 A A 0
o A A o
o A A o
o A o
o A o
o A o
A o
<
I I I l I I t + 1 0 0 - 1 0 - 2 0
C h a r g e d e n s i t y / ~ C c rn - 2
Fig. 5. Surface excess entropy of adsorbed water as a function of charge density. ( k g - l ; ( A ) 10 -2 mol kg-1; ( O) 10 -3 tool kg -1.
) 10 -~ tool
* 1 ca1=4.184 J.

C O U L O S T A T I C S AT Hg IN NaF AT VARIOUS T E M P E R A T U R E S 391
These values are either known from thermodynamic data or are computed by means of the Debye-HiJckel theory, which then allows the following expression to be set up 25' 26:
A ~ = - ~-f R T In a,o/p . . . . .
= / e N2n~ ~1 0 In e)] A(2j)~ (5) k ( 5 5 . 5 1 ) 6 ~ ( e T ) ~ k ~ + 3 T OT ]J
~----0.0154A(2J)~cafmo1-1 K 1
Accordingly, within the limits of validity of the Gouy~Chapman approximation, introduced in eqn. (2), no significant effects of ionic strength are to be expected on the values given in Fig. 5.
The maximum value being about 3.8 x 10 _9 cal cm -2 K -1, it is worthwhile to put it in parallel with decrements of surface tensions measured at the mercury mercury vapor interphase27*: 5 x 10 - 9 cal cm -2 K -~ and at the water-water vapor interphase at 25°C2S: 3.5 x 10 . 9 cal K 1 cm 2.
Surprisingly enough the value obtained for the total entropy of adsorption of water near the p.z.c, is about the same as that of the equivalent quantity at the water-water vapor interphase. At the latter interphase, assuming a surface thickness of a single molecular layer, the value of the partial molar entropy of adsorption has been quoted 28 as 4.067 cal mol-1 K-1 . However, in order to form a correct estimate of the entropy of adsorption of water at the Hg-interphase, it is necessary to take into account the contribution of the mercury side of the interphase which is implicated in F~,(~-g~) because of the convention FHg+ =0. Establishing the importance of such contribution is a difficult task which presently can only be overcome by means of the following oversimplified assumption. Let us consider that, on the metal side the mechanical part in the stress tensor component parallel to the surface (which is a term included in Pt of ref. 15, eqn. 75) remains unaffected near the p.z.c, both by the density o f charge and by the presence of water. As for the shear electrostatic part in the stress, thus related to the local electrostatic field at the metal surface, it cancels whenever, in absence of specific ionic adsorption, the differential of ~ is taken at constant q~. This can readily be inferred from eqn. 76 in ref. 15. According to the previous hypothesis, the value of 5 x 10 .9 cal K 1 cm -2 should be subtracted from F ~ ( ~ - ~ ) in order to get the true value for water. Hence, at the maximum one has - 1.2 x 10 - 9
cal K -~ cm -2 and (~ -g~ , ) -~ - 0 . 9 cal K -~ mol -~ supposing that the monolayer convention and the choice of Fo =(71 x 107) a mol cm -2 has been adopted.
It is of particular note that a small negative entropy of adsorption has been obtained, thus corresponding to a monomolecular sheet slightly more ordered than bulk water. This is contrary to the finding at the water-water vapor interphase 29. Thus an interpretation of Fig. 5 can be suggested such that for q~ = - 3.8 C c m - 2 the surface excess of ordering of water molecules is a minimum and increases on both sides of this value as a function of the charge density. As emphasized already by Hills 3°, the fact that this minimum occurs on the cathodic side, reflects
* We wish to thank Dr. A. Couper who kindly communicated to us his own unpublished data.

392 N. H. CUONG, C. V. D'ALKAINE, A. JENARD, H. D. HURWITZ
the existence of some preferential orientation of water dipoles with their positive ends towards the solution. I t is ye t difficult to guess how far the behavior predicted above is subject to error, although it is worthwhile mentioning in relation to it, the similarity appearing from our estimate, between hydrated mercury and the solvated ions belonging to the hydrophobic type. As stressed in many treatments the so called cavity ions are supposed to exert an ice-like structure promoting influence on their neighboring water molecules 31'32. In this connection let us notice that a decrement of entropy in bulk water of 0.9 cal mo1-1 K -a is associated with a decrease of temperature from 25 to 10°C *.
Furthermore, many electrochemical experiments based on the control of effects, in the case of discharge mechanisms at the mercury electrode, have led to analogous conclusions regarding the behavior of the mercury-aqueous solution interphase 33.
CONCLUSION
The impedance bridge generally fails to give correct results for systems of low conductivity as in the case of very dilute solutions. The impedance of the s01ution-electrode interface is then too low even at the lowest practical frequencies in 'comparison with the cell resistance. The present work shows that coulostatic measurements are feasible in dilute aqueous NaF solutions. The accuracy of the electrocapillary data so obtained compares well, in most cases, with those obtained with the conventional bridge in more concentrated systems. Contribution of spurious faradaic process and slow adsorption processes are negligible and discrepancies of charge densities as well as transiel~t responses of the circuitry are absent since the stray capacities of connection and geometric capacities of the electrode arrangement ( ~ 1 0 -1° F) are at least one order of magnitude less than the capacity of injection (Ci > 2 x ]0 . 9 F ) which itself is two orders of magnitude less than the double layer capacity.
No significant large deviations have been found between experimental and calculated data, such as described by Ariel and Nemirovsky 34.* in the negative polarization region.
From the thermodynamic treatment it is apparent that a better knowledge of the values to be taken for the stress component on the metallic side of the interphase is of paramount importance in order to get simply a correct determina- tion of the sign of the entropy of adsorption of water.
SUMMARY
Electrocapillary measurements in NaF aqueous solution at the Hg electrode are reported. Charge densities obtained by the coulostatic technique in the case of 10-1 mol kg -1 to 10 .4 mol kg -1 aqueous NaF solution at 15, 25, 35°C agree
* I t is worth stressing in this respect that (F,,,) 2=106 x 107 cm 2 mol 1 yields an entropy of (S~,--S~) ~ - - 1.30 cal 'mol-1 K-~ which corresponds to a decrease of temperature in adsorption bulk
Water from 25°C to 4°C. ** See also the work of K. Takahashi and R. Tamamushi 35 on aqueous solutions of HC104,
NaC10 4 and NaOH.
COULOSTATICS AT Hg IN NaF AT VARIOUS TEMPERATURES 393
well with values measured by the bridge method (for 10 -1 tool kg 1) and conform with calculated values based on the Gouyq22hapman model. Results of surface tension are obtained by means of the maximum bubble pressure technique. Comparison is made between these results and data derived from coulostatic measurements. The partial molar surface entropies of water in. function of the density of charge are computed from the temperature coefficients of the surface tension.
REFERENCES
1 G. C. Barker in E. Yeager (Ed.), Trans. Syrup. Electrode Processes, Philadelphia, 1959, Wiley, New York~ 1961, p. 325.
2 P. Delahay, J. Phys. Chem., 66 (1962) 2204. 3 W. H. Reinmuth and C. E. Wilson, Anal. Chem., 34 (1962) 1159. 4 P. Delahay, Anal. Chem., 34 (1962) 1267. 5 P. Delahay and Y. Ide, Anal. Chem., 34 (1962) 1580. 6 F. R. Smith and P. Delahay, J. Electroanal. Chem., 10 (1965) 435. 7 R. W. Sorensen and R. F. Sympson, A,al. Chem., 39 (1969) 1238. 8 P. Delahay and D. M. Mohilner, J. Amer. Chem. Soc., 84 (1962)4247. 9 P. Delahay, J. Phys. Chem., 67 (1963) 135.
10 F. C. Anson, Anal. Chem., 38 (1966) 1924. 11 F. C. Anson, R. Martin and C. Yarmitzky, J. Phys. Chem., 73 (1969) 1835. 12 S. W. Feldberg, J. Phys. Chem., 74 (1970) 87. 13 P. Delahay, R. De Levie and A. M. Giuliani, Electrochim. Acta, 11 (1968) 1141. 14 P. Delahay and D. J. Kelses, J. Electroallal. Chem., 16 (1968) 116. 15 H. D. Hurwitz and C. V. D'Alkaine, J. Electroanal. Chem., 42 (1973) 77. 16 D. C. Grahame, R. P. Larsen and M. A. Poth, J. Amer. Chem. Soc., 74 (1952) 1207. 17 D. J. Schiffrin, J. Electroanal. Chem., 23 (1969) 168. 18 J. Lawrence and D. M. Mohilner, J. Electrochem. Soc., 118 (1971) 259. 19 C. A. Smolders and E. M. Dugvis, Rec. Tray. Chem., 60 (1961) 635. 20 R. G. Barradas and E. W. Hermann, J. Phys. Chem., 73 (1969) 3619. 21 D. C. Grahame, J. Amer. Chem. Soc., 76 (1954) 4819. 22 A." J. de Bethune, H. O. Daley, N. A. Swendeman and G. R. Solvi, J. Electrochem. Soc.. 114
(1967) 578. 23 L. Pauling, The Nature of the Chemical Bond, Corneli University Press, Ithaca, N.Y., 3rd edn.,
1960, p. 275. 24 D. Eisenberg and W. Kauzman, The Structure and Properties of Water, Clarendon Press, Oxford,
1961. 25 R. A. Robinson and R. H. Stokes, Electrolyte Solutions, Butterworth, London, 1959, Ch. 9. 26 H. S. Frank and A. L. Robinson, J. Chem. Phys., 8 (1940) 933. 27 M. L. Wilkinson, Chem. Rev., 72 (1972) 575. 28 W. F. Clausen, Science, 156 (1967) 1226. 29 J. E. B. Randles, Communication at the 15th Conseil International de Chimie Solvay, Brussels, !972. 30 G. J. Hills, J. Phys. Chem., 73 (1964) 11. 31 G. Nemethy and H. A. Scheraga, J. Chem. Phys., 36 (1962) 3401. 32 F. Nightingale in B. E. Conway and R. G. Barradas (Eds.), Chemical Physics o f Ionic Solutions,
Wiley, New York, 1966, p. 87. 33 L. Gierst, E. Nicolas and L. Tytgat, Croat. Chem. Acta, 42 (1970) 117. 34 M. Ariel and Y. Nemirovsky, Electrochim. Aeta, 17 (1972) 1977. 35 K. Takahashi and R. Tamamushi, Electrochim. Acta, 16 (1971) 875.