The Surface Finish Effect on the Creep Corrosion in PCB
50
The Surface Finish Effect on the Creep Corrosion in PCB 1 Cherie Chen*, 1 Jeffrey ChangBing Lee, 1 Graver Chang, 1 Jandel Lin 2 Casa Hsieh, 2 Jesse Liao, 2 Jerry Huang 1 IST-Integrated Service Technology, Inc. 2 Tripod Technology Corporation 1 Hsinchu City, Taiwan Abstract Creep corrosion normally happens in the end system, PCB, connectors and components are widely noted due to the exposure of high sulfur environments under elevated humidity. In this study, the major focus is the investigation of PCBs with 3 different types of surface finish (ImAg, Post-Treatment ImAg, HT-OSP), SMD vs NSMD and non clean organic acid flux residue from simulating wave soldering process under MFG Test (Mixed Flowing Gas Test). The realistic mixed flowing gas (H 2 S, SO 2 , NO 2 , Cl 2 ) at certain concentration of each and relative humidity are designed to accelerate creep corrosion happening. One of the purposes in this study is to investigate the effect of the mixed flowing gas with various H 2 S concentration (500 ppb, 1000 ppb, 1700 ppb) at 5 days duration on the corrosion rate (nm/day) in the Cu coupon and Ag coupon in order to understand how H 2 S drives the corrosion acceleration. The data are also verified by the methods of Weight Gain Analysis and X-Section with SEM/EDX. The result shows much higher corrosion rates are observed on Cu coupon in both Individual and Mixed Flowing Gas Tests. The corrosion rate of Cu coupon rapidly increases with H 2 S concentration above 1000 ppb. Ag coupon have more active corrosion in low H 2 S concentration than high H 2 S concentration. Flaking corrosion also happens on the Cu coupon with heavy corrosion product in the high H 2 S concentration test condition. And more visible creep corrosion is observed on HT-OSP finished circuit boards and SMD, as the residue of organic acid flux residue is not able to prevent corrosion occurrence. Key Words: Creep Corrosion, Surface Finish, Organic Acid Flux, Mixed Flowing Gas Test (MFG), SMD, NSMD Introduction Many volcanoes erupted in Iceland, Japan, Indonesia and the Philippines in the recent two years. There are 2,000 extinct volcanoes and 523 active volcanoes distributed in four major volcanic belts in the world. There are twenty volcanic eruptions at any time and volcanic activity increased significantly since year 2000. This released more sulfides posing a threat to the environment. The general and volcanic gas compositions are shown in Figure 2. H 2 O and SO 2 released into the air may cause corrosion after a volcanic eruption. Figure 1. The major volcanic belts in the world.
Transcript of The Surface Finish Effect on the Creep Corrosion in PCB

The Surface Finish Effect on the Creep Corrosion in PCB
1Cherie Chen*,
1Jeffrey ChangBing Lee,
1Graver Chang,
1Jandel Lin
2Casa Hsieh,
2Jesse Liao,
2Jerry Huang
1IST-Integrated Service Technology, Inc.
2Tripod Technology Corporation
1Hsinchu City, Taiwan
Abstract
Creep corrosion normally happens in the end system, PCB, connectors and components are widely noted due to the exposure of
high sulfur environments under elevated humidity. In this study, the major focus is the investigation of PCBs with 3 different
types of surface finish (ImAg, Post-Treatment ImAg, HT-OSP), SMD vs NSMD and non clean organic acid flux residue from
simulating wave soldering process under MFG Test (Mixed Flowing Gas Test). The realistic mixed flowing gas (H2S, SO2, NO2,
Cl2) at certain concentration of each and relative humidity are designed to accelerate creep corrosion happening.
One of the purposes in this study is to investigate the effect of the mixed flowing gas with various H2S concentration (500 ppb,
1000 ppb, 1700 ppb) at 5 days duration on the corrosion rate (nm/day) in the Cu coupon and Ag coupon in order to understand
how H2S drives the corrosion acceleration. The data are also verified by the methods of Weight Gain Analysis and X-Section
with SEM/EDX.
The result shows much higher corrosion rates are observed on Cu coupon in both Individual and Mixed Flowing Gas Tests. The
corrosion rate of Cu coupon rapidly increases with H2S concentration above 1000 ppb. Ag coupon have more active corrosion in
low H2S concentration than high H2S concentration. Flaking corrosion also happens on the Cu coupon with heavy corrosion
product in the high H2S concentration test condition. And more visible creep corrosion is observed on HT-OSP finished circuit
boards and SMD, as the residue of organic acid flux residue is not able to prevent corrosion occurrence.
Key Words: Creep Corrosion, Surface Finish, Organic Acid Flux, Mixed Flowing Gas Test (MFG), SMD, NSMD
Introduction
Many volcanoes erupted in Iceland, Japan, Indonesia and the Philippines in the recent two years. There are 2,000 extinct
volcanoes and 523 active volcanoes distributed in four major volcanic belts in the world. There are twenty volcanic eruptions at
any time and volcanic activity increased significantly since year 2000. This released more sulfides posing a threat to the
environment. The general and volcanic gas compositions are shown in Figure 2. H2O and SO2 released into the air may cause
corrosion after a volcanic eruption.
Figure 1. The major volcanic belts in the world.

Figure 2. The comparison of general and volcanic gas compositions.
There are many types of active sulfur compounds that are able to cause corrosion. The creep corrosion is the mass transport
process where solid corrosion products migrate over a surface without the involvement of an electric field. [1] The comparison
among Creep Corrosion, Dendrite, and CAF is shown in Table 1, which illustrate different mechanism to electrical failure. [2]
Table 1. The comparison among Creep Corrosion, Dendrite and CAF. [2]
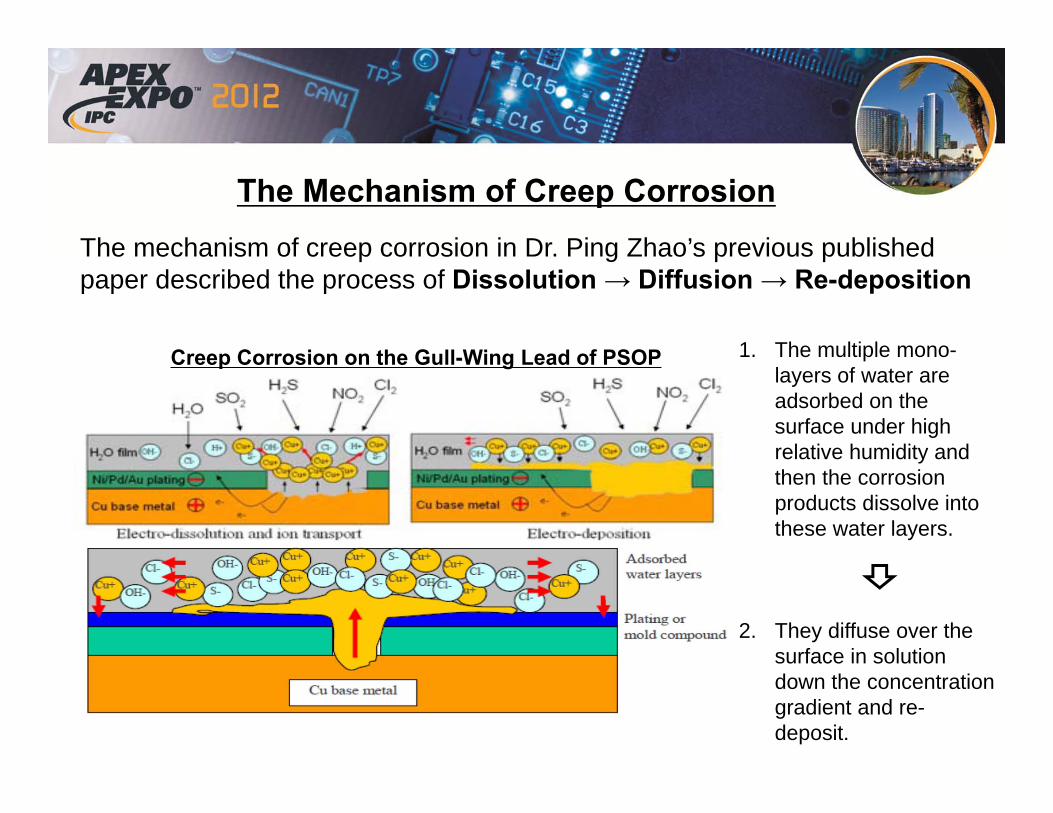
The mechanism of creep corrosion in Dr. Ping Zhao’s previous published paper described the process of Dissolution →
Diffusion → Re-deposition. The multiple mono-layers of water are adsorbed on the surface under high relative humidity and
then the corrosion products dissolve into these water layers. Therefore, they diffuse over the surface in solution down the
concentration gradient and re-deposit. The mechanism of creep corrosion is shown in Figure 3. [3]
Figure 3. The mechanism of creep corrosion from Dr. Ping Zhao’s previous published paper[3]
There are a number of factors that lead to creep corrosion in PCBs, as shown in Table 2. In this paper, the study is focused on the
factors of PCB board design (SMD vs NSMD), surface finish, flux residue in wave soldering and MFG test conditions. The
creep corrosion on a PCB will induce electrical failure in the electronic product. Obvious corroded PCBs are identified in some
locations with elevated level of sulfur-based gases, including paper mills, waste-water treatment plants, landfills, swamps, and
exit / entrance ramp, especially in the developing countries. [4]
Table 2. The factors to creep corrosion
Factors to Creep Corrosion Studied in this paper
1 PCB board design v 2 Surface Finish v 3 Flux residue v 4 Solder Mask Geometry v 5 Solder Paste Coverage
ComparisonCreep
Corrosion
Dendrite CAF
Substrate Cu Cu/Ag/Tin-
Lead…
Cu
Corrosion
ProductCu2S
FO Cu Oxide/
Hydroxide
Electron
Migration
X Cathode to
Anode
Anode to
Cathode
Failure Mode Short /
Open
Short Short
Humidity
Requirement
Yes Yes Yes
Voltage
Requirement
No Yes Yes

6 Reflow 7 Wave Soldering process 8 MFG Test Conditions v
In the electronic industry, there have been a number of test methods developed to evaluate the corrosion resistance from the view
point of PCB materials, PCB assembly process and gas condition. The MFG test method was carried out in 1980’s. It’s the
primary test method used currently in the electronic industry.
The MFG test is a laboratory test where the temperature (℃), relative humidity (%RH), concentration of gaseous pollutants (ppb
level), and other critical variables (such as volume exchange rate and airflow rate) are carefully defined, monitored and
controlled. [5] The purpose of MFG test is to use the combination of four most common corrosive gases in the environment, H2S,
Cl2, NO2, SO2 to simulate and accelerate atmospheric corrosion due to exposure. Many specific and application-oriented MFG
test methods created for industrial applications are shown in Table 3. [6][7][8][9]
But there is still no accepted industry standard created for MFG test to correlate to real service life yet. From the literature
published, the critical factor that causes creep corrosion is the concentration of H2S. IPC 3-11g Corrosion of Metal Finish Task
Group also had a draft discussion for setting 1500ppb possibility as the minimum concentration of H2S in IPC/APEX 2011.
Further progress will be updated in the next publication.
Table3. MFG test methods for industrial applications concentration: (unit: ppb) [6][7][8][9]
Condition Class H2S CL2 NO2 S02 Temp RH
Telcordia
Indoor 10 10 200 100 30℃ 70%
Outdoor 100 20 200 200 30℃ 70%
ALU Intl. 1500-2000 20 200 200 40℃ 70%
Battelle
Class 2 10 10 200 - 30℃ 70%
Class 3 100 20 200 - 30℃ 75%
Class 4 200 50 200 - 50℃ 75%
EIA
II 10 10 200 - 30℃ 70%
II A 10 10 200 100 30℃ 70%
III 100 20 200 - 30℃ 75%
IIIA 100 20 200 200 30℃ 70%
IV 200 30 200 - 40℃ 75%
IEC
1 100 - - 500 25℃ 75%
2 10 10 200 - 30℃ 70%
3 100 20 200 - 30℃ 75%
4 10 10 200 200 25℃ 75%
IBM 40 3 610 350 30℃ 70%
Experiment
1. MFG test set up
a. Chamber feature is shown in figure 4
Figure 4. MFG test system in IST’s lab.
b. MFG Test Flow
Figure 5 shows the flow chart. 4 kinds of individual gas coming from the bottom side are mixed before getting into the
chamber. The gas flow in the chamber is coming from the bottom side. The gas emission coming from the chamber first goes

into Filter Tank for neutralization and then goes to Active Carbon for deodorization. The final gas emission is non-toxic and
non-polluting.
Figure 5. IST MFG test flow chart
c. Uniformity measurement in the MFG chamber
In order to make sure that each board will experience the same test conditions and the test boards installed in the chamber will
not be interfere with the gas flow it is necessary to verify the corrosion level in different locations of the chamber. A total of
12 Cu coupons and 12 Ag coupons with 99.99% purity (1 inch x 1 inch) are cleaned through proprietary chemical cleaning
procedure and hung in different area of the chamber with some test boards for 5 days exposure with various H2S concentration
(500 ppb, 1000 ppb, 1700 ppb) to understand how H2S drives the corrosion acceleration. The chamber set up is shown in
Figure 6. The weight gain after the test confirms whether the corrosion degrees in different locations of the chamber are all in
the reasonable range and make sure the gas concentration inside the chamber is stable and uniform. The weight gain and
corrosion product of each coupon is verified by the methods of Weight Gain Analysis, X-Section and u-XPS to define
acceptable uniformity.
Figure 6. Chamber set up of uniformity test
d. Test condition
The critical factor of creep corrosion is the concentration of H2S, which has been already been shown in previously published
papers. In order to get more visible creep corrosion phenomenon, 1700 ppb is chosen for the concentration of H2S in this
experiment based on the ALU’s study. [10] The MFG test condition in this study is shown in Table 4.
Table 4. MFG Test Condition in this experiment (ppb) H2S Cl2 NO2 SO2 Temp. RH Duration
1700 20 200 200 40℃ 90% 21days
Before MFG test, all of the test boards are reflowed one time. The reflow profile is shown in Figure 7. After reflow, all PCBs are
placed in the MFG chamber in figure 8.
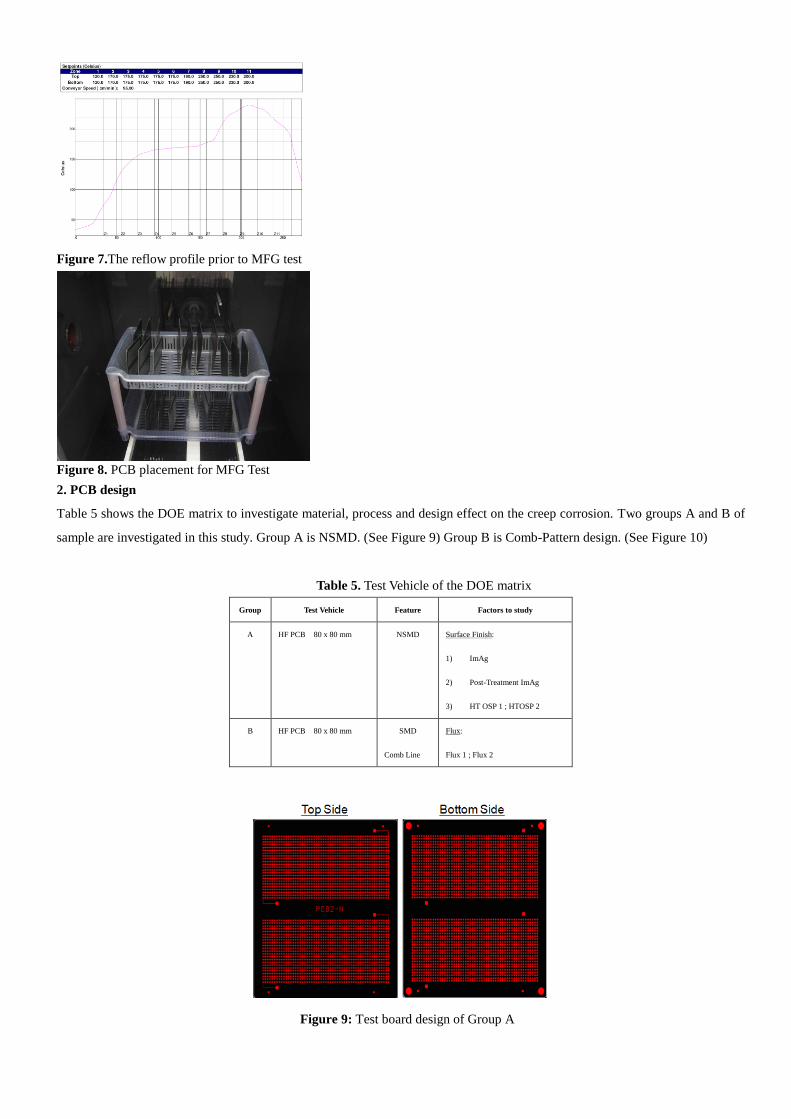
Figure 7.The reflow profile prior to MFG test
Figure 8. PCB placement for MFG Test
2. PCB design
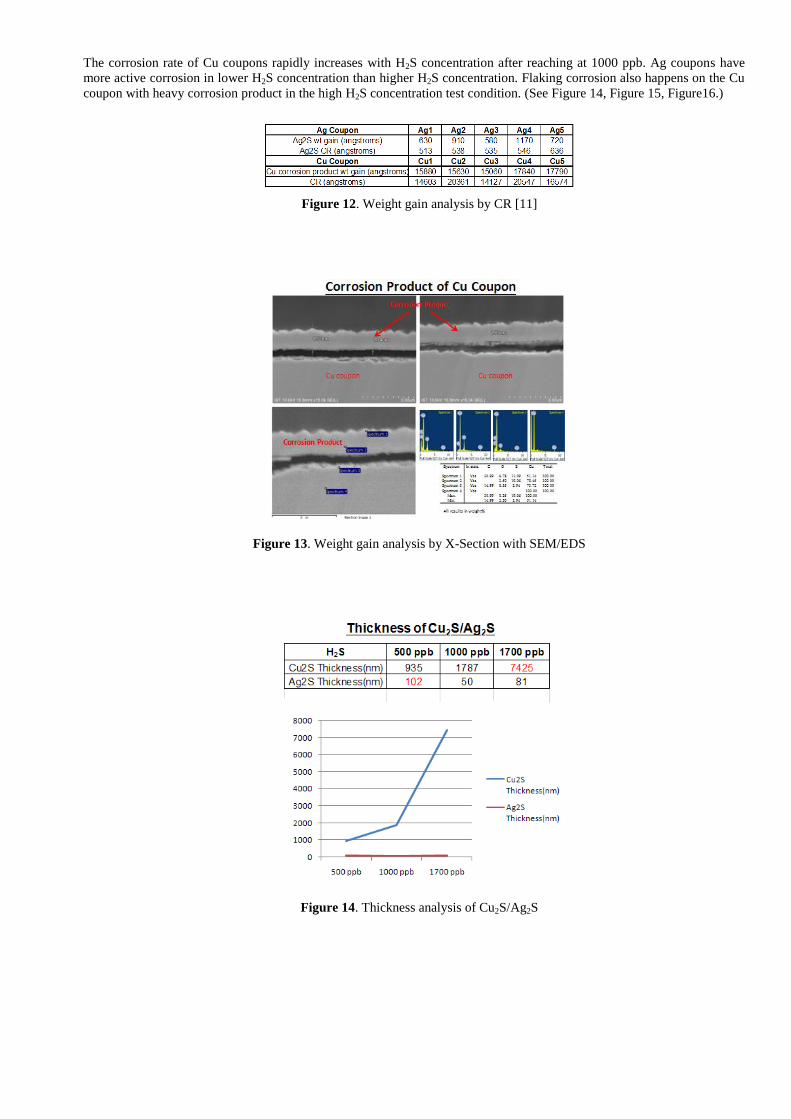
Table 5 shows the DOE matrix to investigate material, process and design effect on the creep corrosion. Two groups A and B of
sample are investigated in this study. Group A is NSMD. (See Figure 9) Group B is Comb-Pattern design. (See Figure 10)
Table 5. Test Vehicle of the DOE matrix
Group Test Vehicle Feature Factors to study
A HF PCB 80 x 80 mm NSMD Surface Finish:
1) ImAg
2) Post-Treatment ImAg
3) HT OSP 1 ; HTOSP 2
B HF PCB 80 x 80 mm SMD
Comb Line
Flux:
Flux 1 ; Flux 2
Figure 9: Test board design of Group A

Figure 10: Test board design of Group B
a. SMD vs NSMD is shown in Figure 11
Figure 11. SMD vs NSMD features
b. Surface finish comparison is shown in table 6
Table 6: The description of surface finishes vehicle
c. Flux residue in wave soldering
In Group B, two types NC(No Clean) and OA(Organic Acid) Flux are sprayed on PCB with the simulation of wave soldering
condition by baking the flux residue on the PCB.
PCBs of Group B are put in the oven at 125℃ for 5 minutes and then at 270℃ for 1 minute after the NC OA Flux are
sprayed on it to simulate wave soldering condition and have flux residue remaining on the PCB.
Result and Discussion
a. Uniformity Test
Before and after the uniformity test, 5 weightings are conducted by the microbalance and the average is calculated. After the
weight gain, corrosion product is verified by the methods of Weight Gain Analysis, Coulometeric Reduction(CR) and
X-Section with SEM/EDS.(See Figure 12 and Figure 13.) The data from the three methods are consistent with each other. It
can be defined that the gas inside of the chamber is uniform.
The effect of the mixed flowing gas with various H2S concentration (500 ppb, 1000 ppb, 1700 ppb) at 5 days duration
showed that a much higher corrosion rate is observed on Cu coupons in both the Individual and Mixed Flowing Gas Test.
Experiment Surface Finish Supplier
ImAg Vendor 1
Post-Treatment ImAg Vendor 2
HT OSP 1 Vendor 3
HT OSP 2 Vendor 2
Group B ImAg Vendor 1
Group A
The corrosion rate of Cu coupons rapidly increases with H2S concentration after reaching at 1000 ppb. Ag coupons have
more active corrosion in lower H2S concentration than higher H2S concentration. Flaking corrosion also happens on the Cu
coupon with heavy corrosion product in the high H2S concentration test condition. (See Figure 14, Figure 15, Figure16.)
Figure 12. Weight gain analysis by CR [11]
Figure 13. Weight gain analysis by X-Section with SEM/EDS
Figure 14. Thickness analysis of Cu2S/Ag2S
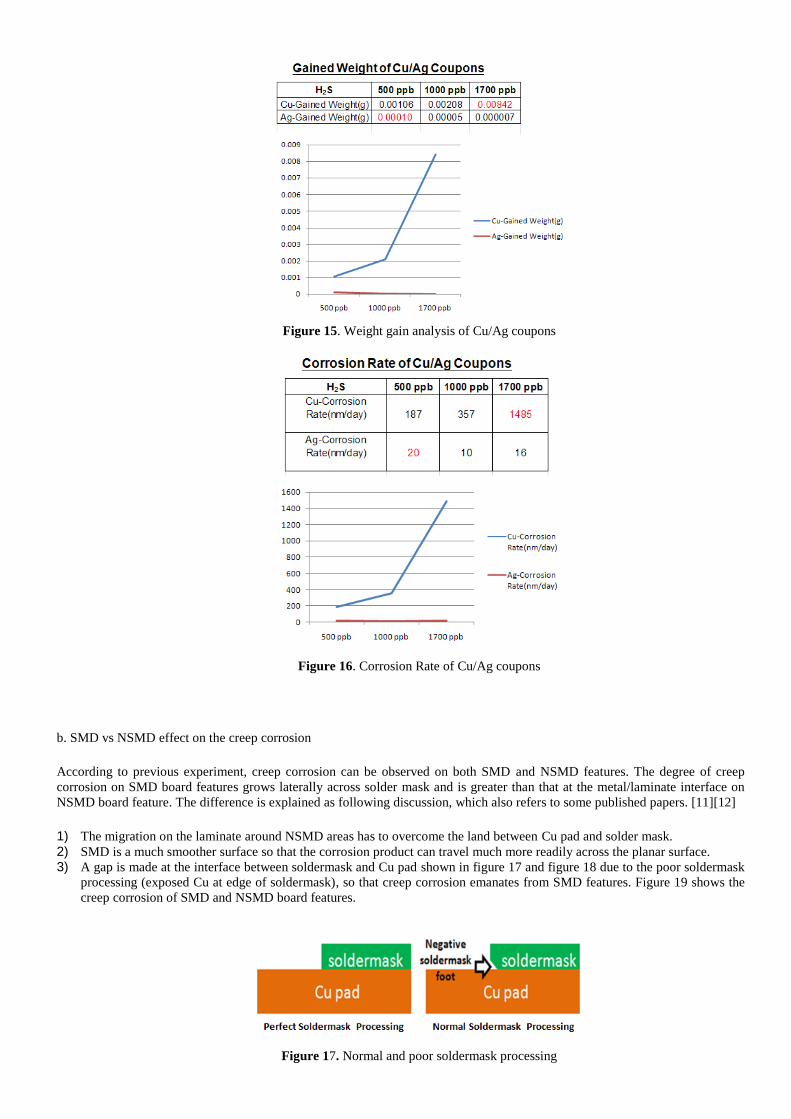
Figure 15. Weight gain analysis of Cu/Ag coupons
Figure 16. Corrosion Rate of Cu/Ag coupons
b. SMD vs NSMD effect on the creep corrosion
According to previous experiment, creep corrosion can be observed on both SMD and NSMD features. The degree of creep
corrosion on SMD board features grows laterally across solder mask and is greater than that at the metal/laminate interface on
NSMD board feature. The difference is explained as following discussion, which also refers to some published papers. [11][12]
1) The migration on the laminate around NSMD areas has to overcome the land between Cu pad and solder mask.
2) SMD is a much smoother surface so that the corrosion product can travel much more readily across the planar surface.
3) A gap is made at the interface between soldermask and Cu pad shown in figure 17 and figure 18 due to the poor soldermask
processing (exposed Cu at edge of soldermask), so that creep corrosion emanates from SMD features. Figure 19 shows the
creep corrosion of SMD and NSMD board features.
Figure 17. Normal and poor soldermask processing

Figure 18. Creep corrosion occurred from the exposed copper at the edge of soldermask.
Figure 19. Creep corrosion on SMD and NSMD board features.
c. Surface finish effect on the creep corrosion (Group A)
In the mid of 2006, ROHS legislation has been implemented and the use of lead in electronic products is prohibited. The PCB
manufactures are driven to transition from lead coating final finishes to lead free alternatives. The most common lead free
surface finishes applied today are ImAg (Immersion Silver) and OSP (Organic Solderability Preservatives) to date based on
solder joint reliability validation. With creep corrosion concerns in high reliability product like telecom, network product and so
on, the 2 available surface finish were found not to be good candidates to prevent its occurrence. Therefore, one improved ImAg
surface finish with post-treatment is designed for comparison besides the above 2 candidates in the creep corrosion resistance
study. Group A PCB is NSMD design with 3 different types of surface finish, and Group B PCB is Comb-Pattern design with
ImAg surface finish.
Creep corrosion is observed on all the three types of surface finish based on the visual inspection and the analysis through
Cross-Section, SEM/EDS and electrical measurement in Table 7.
Table 7. Creep corrosion of different surface finishes
Finally, the corrosion severity of the three PCB finishes is ranked as below.
OSP > ImAg > Post-Treatment ImAg
The creep corrosion evolution of NSMD is shown in Figure 20.
Surface Finish \ Result Corrosion on pad Corrosion on Trace Shorting Occurrence
ImAg O O X
Post-Treatment ImAg O X X
HT OSP 1 O O O
HT OSP 2 O O O

Figure 20: Creep corrosion evolution of NSMD PCB
ImAg and Post-Treatment ImAg
The comparison in SEM/EDS analysis between ImAg and Post-Treatment ImAg coating show that the corrosion rate of ImAg is
higher than Post-Treatment ImAg. In figure 21, the corrosion of ImAg creeps onto the trace from pad, but the corrosion of
Post-Treatment ImAg only occur on the pad and doesn’t creep to the trace. The pad of ImAg has been corroded and flaked as
shown in figure 22, therefore, it is concluded Post-Treatment ImAg has the better performance than normal ImAg.
Figure 21: Top view SEM/EDS analysis
Figure 22: Pad comparison of side view
Porosity in surface finish is an inherent characteristic. When the Cu pad is rougher, it will promote micro-voids. The
Post-Treatment is molecular self-assembly Monolayer. The molecule will selectively attach itself to available copper, as shown
in Figure 23.
Spectrum C O Al Si S Cu Ag Total
1 15.58 76.94 7.48 100.00
2 6.05 15.00 74.07 4.88 100.00
3 21.78 2.31 0.78 9.72 51.40 14.00 100.00
4 49.46 22.75 7.60 3.14 8.49 8.55 100.00
5 23.30 11.62 59.11 5.97 100.00
6 16.15 11.42 31.22 41.22 100.00
7 51.55 30.08 1.17 8.08 2.32 6.80 100.00
8 43.06 56.94 100.00
9 48.05 51.95 100.00
Max. 51.55 56.94 1.17 8.08 15.58 76.94 41.22
Min. 0.00 0.00 0.00 0.00 0.00 0.00 0.00
Spectrum C O Si S Cu Ag Total
1 14.41 48.86 36.73 100.00
2 14.08 62.16 23.76 100.00
3 3.77 3.10 14.60 24.88 53.65 100.00
4 5.63 13.53 34.90 45.94 100.00
5 39.61 41.00 18.16 1.23 100.00
6 42.06 44.37 13.57 100.00
7 100.00 100.00
Max. 42.06 100.00 18.16 14.60 62.16 53.65
Min. 0.00 0.00 0.00 0.00 0.00 0.00

The silver layer is getting denser with better coverage of Cu pad preventing corrosion happening. The Post-Treatment ImAg with
more organic preservative is designed to have better performance than ImAg under the corrosive gas exposure. [2]
Figure 23: The mechanism of Self-Assembly Monolayer. [2]
The comparison of the 2 HT OSP
Both HT OSP 1 and HT OSP 2 have worse performance than ImAg, but there is not enough evidences to judge which one is the
worst. HT OSP 1 has creep and flaking corrosion. The corrosion product on the pad is thinner and smoother. HT OSP 2 has
creep corrosion but the pad isn’t flaked. The corrosion product on the pad of HT OSP 2 is thicker and rougher as shown in
Figure 24. Figure 25 shows the side view of HT OSP 1 and HT OSP 2. Both of them have creep corrosion from pad to the trace
and the pad crater. HT OSP 2 has thicker corrosion product on the pad.
Figure 24: Top view of HT OSP1 and HT OSP2
Figure 25: Both HT OSP1 and HT OSP2 have creep corrosion product.
ImAg has a higher porosity ratio than Post-Treatment ImAg and it is assumed that OSP might have higher porosity ratio than
ImAg in Figure 26. Currently there are three testing methods for surface finish porosity in the industry. These are Gas Exposure
Method, Electrolysis Imaging Method and Salt Spray Test Method. But all of them are not the ideal and reliable test methods to
identify quantitatively the porosity.

Figure 26: Qualitative comparison of porosity ratio among surface finish
d. u-XPS Analysis
Figure 27: Atomic Percent Profile of ImAg
Figure 28: Atomic Percent Profile of Post-Treatment ImAg
Figure 29: Atomic Percent Profile of HT OSP1
Figure 30: Atomic Percent Profile of HT OSP2
e. Flux Residue effect on the creep corrosion (Group B)
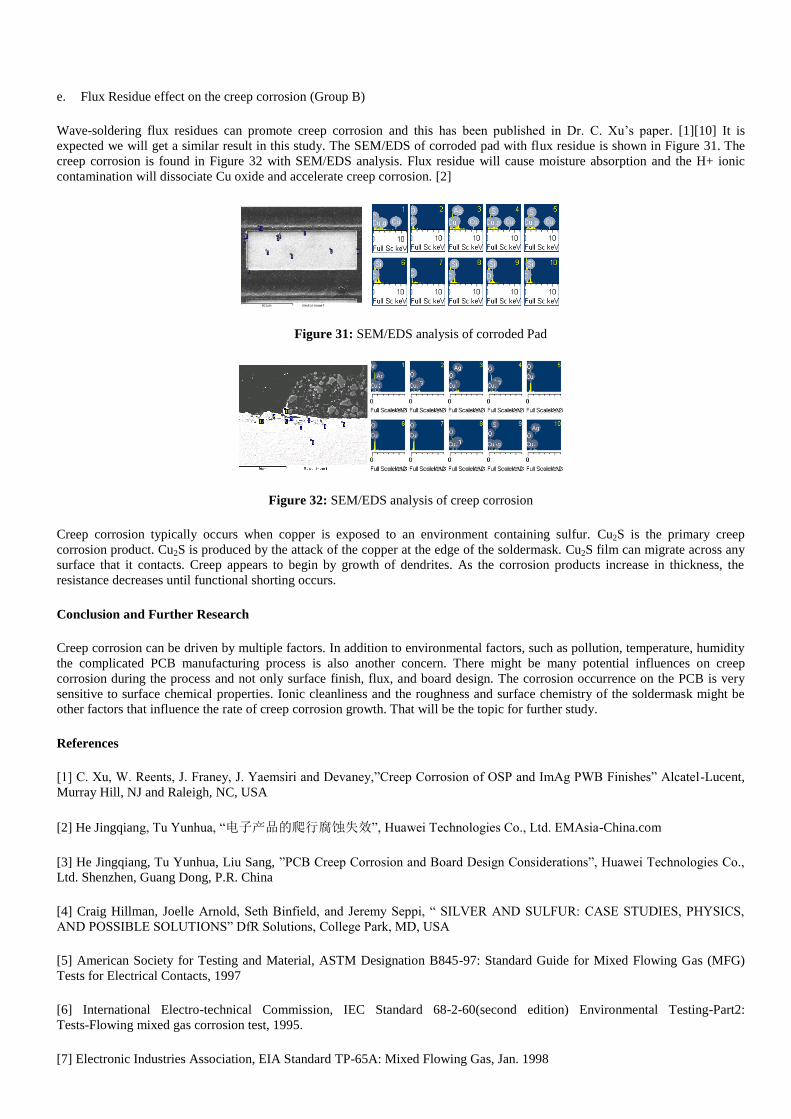
Wave-soldering flux residues can promote creep corrosion and this has been published in Dr. C. Xu’s paper. [1][10] It is
expected we will get a similar result in this study. The SEM/EDS of corroded pad with flux residue is shown in Figure 31. The
creep corrosion is found in Figure 32 with SEM/EDS analysis. Flux residue will cause moisture absorption and the H+ ionic
contamination will dissociate Cu oxide and accelerate creep corrosion. [2]
Figure 31: SEM/EDS analysis of corroded Pad
Figure 32: SEM/EDS analysis of creep corrosion
Creep corrosion typically occurs when copper is exposed to an environment containing sulfur. Cu2S is the primary creep
corrosion product. Cu2S is produced by the attack of the copper at the edge of the soldermask. Cu2S film can migrate across any
surface that it contacts. Creep appears to begin by growth of dendrites. As the corrosion products increase in thickness, the
resistance decreases until functional shorting occurs.
Conclusion and Further Research
Creep corrosion can be driven by multiple factors. In addition to environmental factors, such as pollution, temperature, humidity
the complicated PCB manufacturing process is also another concern. There might be many potential influences on creep
corrosion during the process and not only surface finish, flux, and board design. The corrosion occurrence on the PCB is very
sensitive to surface chemical properties. Ionic cleanliness and the roughness and surface chemistry of the soldermask might be
other factors that influence the rate of creep corrosion growth. That will be the topic for further study.
References
[1] C. Xu, W. Reents, J. Franey, J. Yaemsiri and Devaney,”Creep Corrosion of OSP and ImAg PWB Finishes” Alcatel-Lucent,
Murray Hill, NJ and Raleigh, NC, USA
[2] He Jingqiang, Tu Yunhua, “电子产品的爬行腐蚀失效”, Huawei Technologies Co., Ltd. EMAsia-China.com
[3] He Jingqiang, Tu Yunhua, Liu Sang, ”PCB Creep Corrosion and Board Design Considerations”, Huawei Technologies Co.,
Ltd. Shenzhen, Guang Dong, P.R. China
[4] Craig Hillman, Joelle Arnold, Seth Binfield, and Jeremy Seppi, “ SILVER AND SULFUR: CASE STUDIES, PHYSICS,
AND POSSIBLE SOLUTIONS” DfR Solutions, College Park, MD, USA
[5] American Society for Testing and Material, ASTM Designation B845-97: Standard Guide for Mixed Flowing Gas (MFG)
Tests for Electrical Contacts, 1997
[6] International Electro-technical Commission, IEC Standard 68-2-60(second edition) Environmental Testing-Part2:
Tests-Flowing mixed gas corrosion test, 1995.
[7] Electronic Industries Association, EIA Standard TP-65A: Mixed Flowing Gas, Jan. 1998

[8] Telcordia GR-63-CORE Issue2, Section 5.5,”Airborne Contaminants Test Methods”, Nov. 2000
[9] Chao, J.G., Gore, R.R., “Evaluation of a mixed flowing gas test,”1991 Proceedings of the Thirty Seventh IEEE Holm
Conference on Electrical Contacts,pp.216-228, Piscataway, NJ:IEEE,1991.
[10] C. Xu, W. Reents, J. Franey, J. Yaemsiri and J. Devaney,”Creep Corrosion of OSP and ImAg PWB Finishes”,
Alcatel-Lucent, Murray Hill, NJ and Raleigh, NC, USA
[11] Coulometeric Reduction data is conducted by IBM’s Dr. PJ Singh in INEMI Creep Corrosion project
[12] Lenora Toscano, Ernest Long, Ph.D., and Swanson,”CREEP CORROSION ON PCB SURFACES: IMPROVEMENTS OF
PREDICTIVE TEST METHODS ANDDEVELOPMENTS REGARDING PREVENTION TECHNIQUES”, Mac Dermid,
Waterbury, CT,USA
[13] Randy Schueller, Ph.D, ”CREEP CORROSION ON LEAD-FREE PRINTED CIRCUIT BOARDS IN HIGH SULFUR
ENVIRONMENTS”, Dell Inc. Austin, TX, USA
The Surface Finish Effect on the Creep Corrosion in PCB
Presenter : Cherie Chen

• Introduction
• Experiment Purpose
• Experiment Design
• Experiment Result
• Conclusion
• Q & A
Outline

Introduction

The Major Volcanic Belts in The World
Refer to :新竹市青草湖社区大学网站
• Pacific Ring of Fire
• East Africa Ring of Fire
• Mediterranean Ring of Fire
• Java Ring of Fire

Frequent Volcanic Eruptions in Recent Years
Geological experts say :
• 20 Volcanic Eruptions any time
• Volcanic Activities occur more frequently since 2000.
Volcanic Eruptions in 2010 ~ 2011 Time Volcano Area
2010.03 Eyjafjallajokull Volcano Ice Island 2010.10 Merapi Volcano Indonesia 2011.01 Mount Etha Volcano Italy 2011.02 Bulusan Volcano Philippines2011.03 Kilauea Volcano Hawaii 2011.03 Shinmoedake Volcano Japan 2011.03 Kagoshima Volcano Japan
? Mount Changbai Volcano China ? Mount Tatun Volcano Taiwan
Italy Vesuvius Volcanic Eruptions Crater of Mount Vesuvius

The Silent Mount Before Volcanic Eruptions
取自新华网
Mount Changbai in China Mount Tatun in Taiwan
refer to : http://chifoto.blogspot.com/

Volcanic Eruptions
Refer to 世界地质公园网络办公室Refer to 新华网
Refer to 新华网 取自新华网
World Geological Park – Mount Yandang
Reunion Volcano
Alaska Volcano
Refer to 中广网
Ice Island Volcano

The Product of Volcanic Eruptions ~ Ash
取自National Geographic
• Diameter is less than 2mm
• Composed of the rocks, minerals and volcanic glass fragments
• From the rock and magma crushed into small particles during the volcanic eruptions
• Different from the soot,hard and insoluble in water
• In addition to the climate impact of volcanic ash, but also on human and animal damage to the respiratory system

The comparison of general and volcanic gas compositions
The general gas composition and volcanic gas composition are closely related to exhaust gas of volcanic eruptions.
Refer to 台湾台北科技大学网站
General Gas Composition Volcanic Gas Composition

Creep Corrosion • Creep corrosion typically occurs when copper is exposed to an environment containing sulfur.
• Cu2S is the primary creep corrosion product. Cu2S is produced by the attack of the copper at the edge of the soldermask.
•Creep appears to begin by growth of dendrites. As the corrosion products increase in thickness, the resistance decreases until functional shorting occurs.
Refer to : Dr. Randy Schueller’s published paper
Creep Corrosion on PCB Creep Corrosion on PPF SOIC
Refer to : the published paper of Maryland University

Comparison among Creep Corrosion, Dendrite and CAF
Refer to 中国赛宝实验室可靠性分析中心
CAF
Refer to 北京工业大学现代教育技术中心
Comparison CreepCorrosion
Dendrite CAF
Substrate Cu Cu/Ag/Tin-Lead…
Cu
CorrosionProduct Cu2S
FO Cu Oxide/Hydroxide
ElectronMigration
X Cathode toAnode
Anode toCathode
Failure Mode Short /Open
Short Short
HumidityRequirement
Yes Yes Yes
VoltageRequirement
No Yes YesDendrite
Creep Corrosion
The Mechanism of Creep Corrosion
Creep Corrosion on the Gull-Wing Lead of PSOP 1. The multiple mono-layers of water are adsorbed on the surface under high relative humidity and then the corrosion products dissolve into these water layers.
2. They diffuse over the surface in solution down the concentration gradient and re-deposit.
The mechanism of creep corrosion in Dr. Ping Zhao’s previous published paper described the process of Dissolution → Diffusion → Re-deposition

The Factors to Creep Corrosion
PCB Design Surface Finish Flux Residue
SMD & NSMD
Solder Paste CoverageReflow
Test Condition
Wave Soldering

MFG Test

MFG(Mixed Flowing Gas) Test• The MFG test method was carried out in1980’s.
• A laboratory test where the temperature ( ),relative humidity (%RH), concentration ofgaseous pollutants (ppb level), and other criticalvariables (such as volume exchange rate andairflow rate) are carefully defined, monitoredand controlled.
• The purpose of MFG test is to use thecombination of four most common corrosivegases in the environment, H2S, Cl2, NO2, SO2 tosimulate and accelerate atmospheric corrosiondue to exposure.
• Many specific and application-oriented MFGtest methods created for industrial applications
• There is still no accepted industry standardcreated for MFG test to correlate to real servicelife yet.
Application-oriented MFG test methods

MFG Test System
MFG Test System MFG Test Flow
Brand : Yamasaki
Model : GH-180-VL/M(Japan)
Temperature : 20 ±50
Humidity Range : 70 ~ 95%(RH)
Exchange Rate : 1500 L / hour
Mode : Single or Mixed flowing gas
Inside Dimension :50 cm (W) x 50 cm (D) x 50 cm (H)

Test Conditions & Gas Concentration Setting
H2S NO2 Cl2 SO2 Temp. RH Duration(day)
1700 ppb 200ppb 20ppb 200ppb 40 90% 21
• Gas concentration is set according to the exchange rate of the chamber
•1500 Litter gas get into the chamber and 1500 Little gas emission go out
Gas Concentration
Gas H2S Cl2 SO2 NO2Concentration 1700 ppb 20 ppb 200 ppb 200 ppbGas Cylinder 50000 ppm 100 ppm 1000 ppm 1000 ppm
Chamber Exchange RateLiter/per hour (L/H) 0.05 0.3 0.3 0.3
GasH2SCl2SO2NO2
1500 L/H x 0.02 ppm1500 L/H x 0.2 ppm1500 L/H x 0.2 ppm
0.05 L/H x 50000 ppm0.3 L/H x 100 ppm0.3 L/H x 1000 ppm0.3 L/H x 1000 ppm
Gas In = Gas Out
1500 L/H
Test Condition
Calculation of Exchange Rate
1500 L/H x 1.7 ppm

Uniformity Measurement in the MFG chamber

Chamber Set up of Uniformity Test
H2S NO2 Cl2 SO2 Temp. RH Duration(day)
500/1000/1700 ppb 200ppb 20ppb 200ppb 40 75% 5
Test Condition

Weight Gain Analysis Ag Coupon Ag1 Ag2 Ag3 Ag4 Ag5
Ag2S wt gain (angstroms) 630 910 580 1170 720Ag2S CR (angstroms) 513 538 535 546 636
Cu Coupon Cu1 Cu2 Cu3 Cu4 Cu5Cu corrosion product wt gain (angstroms) 15880 15630 15060 17840 17790
CR (angstroms) 14603 20361 14127 20547 16574
• Weight gain analysis methods :
a. Weight Measurement b. Coulometric Reduction(CR)c. X-Section with SEM/EDS
•The data of weight gain analysis by the three methods are consistent to each other.
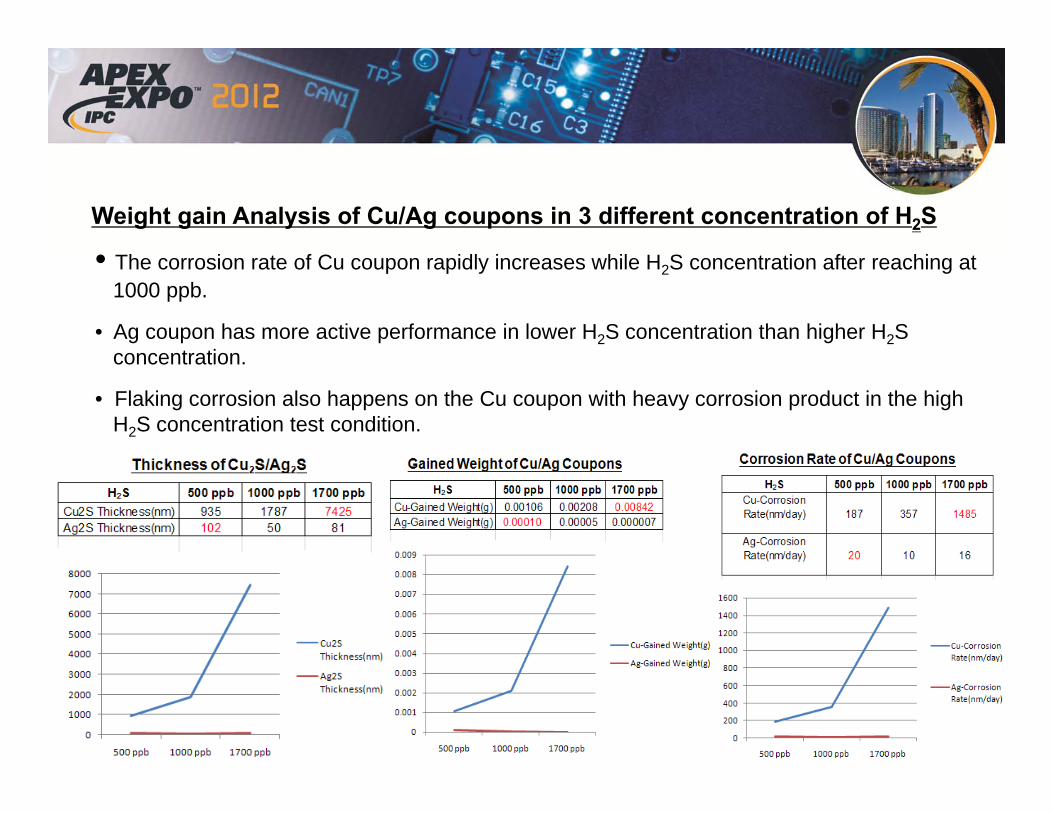
Weight gain Analysis of Cu/Ag coupons in 3 different concentration of H2S
• The corrosion rate of Cu coupon rapidly increases while H2S concentration after reaching at 1000 ppb.
• Ag coupon has more active performance in lower H2S concentration than higher H2S concentration.
• Flaking corrosion also happens on the Cu coupon with heavy corrosion product in the high H2S concentration test condition.

MFG Test MatrixGroup Feature
2) Post-Treatment ImAg3) HT OSP14) HT OSP2
SMD1) NC OA Flux12) NC OA Flux2
Test Vehicle Factors to studySurface Finish
A HF PCB 80 x 80 mm
HF PCB 80 x 80 mmBComb Line
1) ImAg
Flux
NSMD
• To investigate material, process and design effect on the creep corrosion.
• Two groups( A and B) of test boards are investigated in this study.
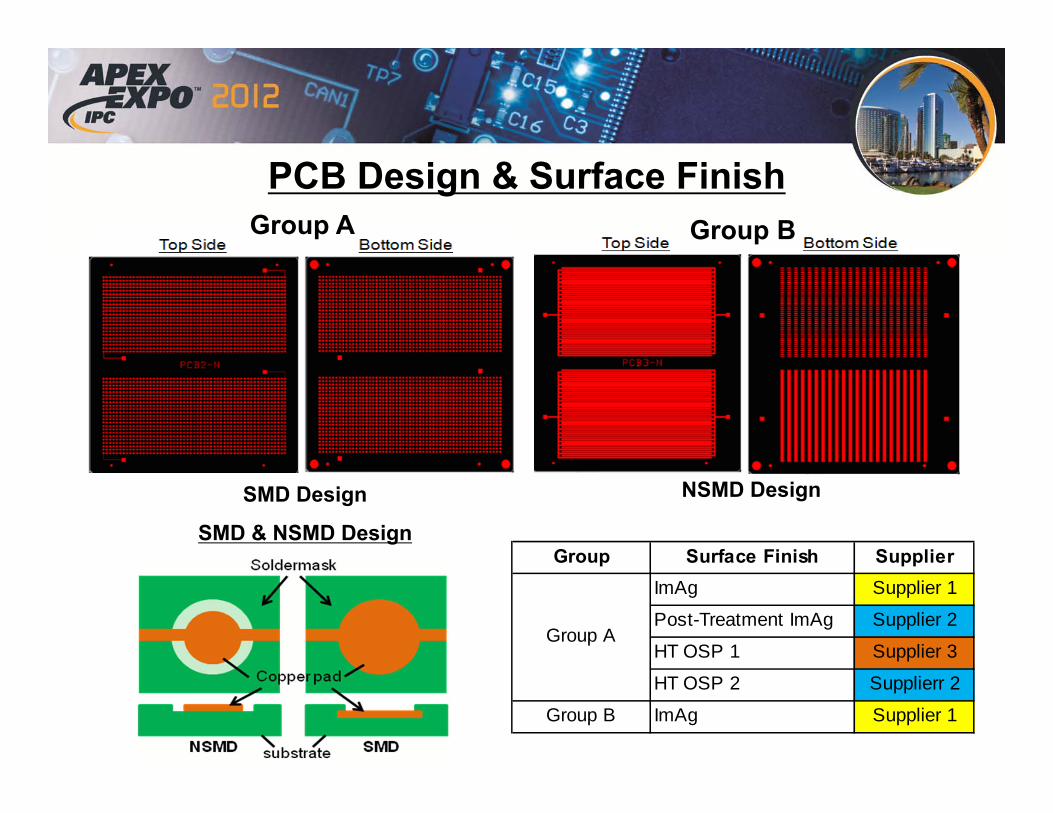
PCB Design & Surface FinishGroup A Group B
SMD Design NSMD Design
SMD & NSMD DesignGroup Surface Finish Supplier
ImAg Supplier 1
Post-Treatment ImAg Supplier 2
HT OSP 1 Supplier 3
HT OSP 2 Supplierr 2
Group B ImAg Supplier 1
Group A

Flux Residue for Wave Soldering Simulation
• Group B
• Spray 2 different types of NC OA Flux on the boards
• The boards with flux are baked at 125 for 5 minutes and then 270 for 1minute to simulate the wave soldering process.
NC OAFlux 1
NC OAFlux 2
Baking

MFG Test• Test Conditions:
• All test boards have one time reflow before MFG test
Chamber set up
SMT line & Reflow Profile

Experiment Result

SMD vs NSMD Effec on Creep Corrosion• The degree of creep corrosion on SMD board feature grows laterally
across solder mask is greater than that at the metal/laminate interface on NSMD board feature.
• The difference is explained as following discussion :
1) The migration on the laminate around NSMD areas has to overcome the land between Cu pad and solder mask.
2) SMD is a much smoother surface so that the corrosion product can travel much more readily across the planar surface.
3) A gap is made at the interface between soldermask and Cu pad due to the poor soldermask processing (exposed Cu at edge of soldermask), so that creep corrosion emanate from SMD features.

SMD vs NSMD Effec on Creep CorrosionCreep Corrosion occurred from the exposed copper at the edge of soldermask
PCB Creep Corrosion of SMD & NSMD PCBCreep Corrosion evolution of SMD & NSMD PCB
Perfect & Normal soldermask processing

Surface Finish Effect on Creep Corrosion– Group A
• Creep corrosion is observed on all the three types of surface finish based on the visual inspection and the analysis through Cross-Section, SEM/EDS and electrical measurement. The result show as below.
• The corrosion severity of the three PCB surface finishes is ranked as below.
OSP > ImAg > Post-Treatment ImAg
Surface Finish \ Result Corrosion on pad Corrosion on Trace Creep Corrosion Shorting Occurrence RankImAg O O O X 2
Post-Treatment ImAg O X O X 3HT OSP 1 O O O OHT OSP 2 O O O O 1

ImAg and Post-Treatment ImAg
Post-Treatment is molecular self-assemblyMonolayer. The molecule will selectivelyattach itself to available copper. The silverlayer is getting denser with better coverageof Cu pad to prevent corrosion happening.The Post-Treatment ImAg with moreorganic preservative is designed to havebetter performance than ImAg under thecorrosive gas exposure.
Refer to EMAsia-China.com

The Comparison of HT OSP1 & HT OSP2• Both HT OSP 1 and HT OSP 2 have worse performance than ImAg, but there are
no enough evidences to judge which one is the worst.
• HT OSP 1 has creep and flaking corrosion. The corrosion product on the pad is thinner and smoother.
• HT OSP 2 has creep corrosion but the pad isn’t flaked. The corrosion product on the pad of HT OSP 2 is thicker and rougher.
• Both of them have creep corrosion from padto the trace and the pad crater. HT OSP 2 has thicker corrosion product on the pad.

Qualitative Comparison of Porosity Ratio Among Surface Finishes
• ImAg has the higher porosity ratio than Post-Treatment ImAg, it is assumed that OSP might have higher porosity ratio than ImAg.
• In Currently there are three testing methods for surface finish porosity test in the industry, which are Gas Exposure Method, Electrolysis Imaging Method and Salt Spray Test Method. But all of them are not the ideal and reliable test methods to identify quantitatively the porosity.

u-XPS AnalysisImAg vs Post-Treatment ImAg
HT OSP1 vs HT OSP2

Flux Residue effect on the creep corrosion – Group B
• Flux residue will cause easily moisture absorption and the H+ of ion contamination is helpful to dissociate Cu oxide and accelerate creep corrosion.
Conclusions• Creep corrosion can be driven by multiple factors.
• Except environmental factors, such as pollution, temperature, humidity, complicated PCB manufacturing process is another concern.
• There might be many potential influences to creep corrosion during the process not only surface finish, flux, and board design.
• The corrosion occurrence on PCB is very sensitive to surface chemical properties. Ionic cleanliness, the roughness and surface chemistry of the soldermask might be other factors to influence the rate of creep corrosion growth.

Welcome your comments !