The Supply Chain Matrix: A Prospective Study of the ...
28
The Supply Chain Matrix: A Prospective Study of the Spatial and Economic Connections within New England’s Meat Industry Prepared by REINVESTMENT FUND Published JANUARY 2017 RESEARCH CONDUCTED BY Policy Solutions at Reinvestment Fund Rhea Acuña, Research Analyst Michael H. Norton, Chief Policy Analyst
Transcript of The Supply Chain Matrix: A Prospective Study of the ...

The Supply Chain Matrix: A Prospective Study of the Spatial and Economic Connections within New England’s Meat Industry Prepared by REINVESTMENT FUND
Published JANUARY 2017
RESEARCH CONDUCTED BY
Policy Solutions at Reinvestment Fund
Rhea Acuña, Research Analyst Michael H. Norton, Chief Policy Analyst
1
INTRODUCTION In 2013, Reinvestment Fund initially developed the Supply Chain Matrix (SCM) to better understand the food production system. Historically, Reinvestment Fund’s food lending has focused on retail establishments, making investments in supermarkets and other retail outlets most frequently in low-income communities with limited access to healthy food. In addition to increasing healthy food access, our supermarket investments promote job creation, and often serve as community anchors that contribute to community revitalization. The SCM represented an initial step for Reinvestment Fund’s food lending group to use data-driven decision making to identify opportunities at other stages in the food supply chain to further promote access to healthy, sustainable food. With support from the William Penn and Surdna Foundations, the initial SCM was developed and tested in the Southeastern Pennsylvania meat industry. 1 Results from the initial SCM were shared with experts in food research, practitioners in the meat industry, and other stakeholders who provided valuable insights on both the methodology and its potential application by meat producers, processors, retailers, and policy makers in the industry. With ongoing support from the Surdna Foundation, and in partnership with the Maine Sustainable Agriculture Society (MESAS) and Broad Reach Fund, an updated SCM was developed to analyze the red meat supply chain in New England, with a particular focus on Maine, extending the methodology to value-added processing. Across New England, there is growing demand for locally sourced meat products. However, the current infrastructure in the region is not suited to meet increasing demand, creating an impediment for local businesses. A primary challenge in New England is limited capacity to slaughter and process meat. Many farmers ship their animals long distances for slaughtering. Recently, a local newspaper described the challenge for one farmer in Maine: He travels 600 miles to get his animals slaughtered and processed in Pennsylvania. In addition to the long travel, this process can also require scheduled appointments and months-long wait lists (Lowell, 2015). Stakeholders in the red meat industry widely recognize this as a critical challenge to overcome to strengthen the regional food system and support local farmers and businesses. This report is divided into the following sections to present the updated methodology and application of the SCM: 1. Section 1 presents the updated methodology for estimating the SCM, based on the
feedback provided by industry informants; 2. Section 2 presents the results of the SCM for the red meat industry in New England to
highlight processing bottlenecks throughout the region; 3. Section 3 presents hypothetical scenarios of adjustments to address observed processing
bottlenecks in the supply chain; 4. The Appendix details technical challenges with data sources for this analysis. The findings presented in this report highlight the existence of substantial gaps in the capacity of the New England meat slaughtering and processing industries. In addition, these 1 The initial Supply Chain Matrix report can be downloaded at https://www.reinvestment.com/research-publications/the-supply-chain-matrix-a-prospective-study-of-the-spatial-and-economic-connections-within-the-regions-meat-industry/
2
findings also highlight the power of the SCM as a tool that can provide actionable information for industry decision makers, local food advocates, and policy makers working to create efficiencies within local food markets.
I. SPECIFYING THE SUPPLY CHAIN MATRIX The SCM is an optimization model that identifies potential geographic and economic relationships between buyers and sellers within the supply chain. Based on key factors built into the model, the results provide the best solution that satisfies the specified criteria. Based on feedback from industry experts after the first application of the SCM conducted for the Southeastern PA meat industry, the following updates were made for the analysis of the New England red meat industry, defined as both pork in beef in this study.2 • Add auction houses in the producer stage of the supply chain. The current model added
auction houses to the producer stage as they serve as intermediaries between producers and processors. The overall effect of their additions was minimal due to the small number of auction houses in New England.
• Factor economies of scale among producers and processors. The updated supply chain differentiates between the value of inputs based on the relative size of the producers or processors. For example, relative to large farms, small farms place a greater value on their animals due to the higher variable cost they face.
• Use two-year rolling averages for price inputs. The pilot model used the 2010 U.S. Department of Agriculture (USDA) Meat Price Spreads to calculate the dollar value of meat at different stages of the supply chain. Industry informants suggested that a two-year rolling average (2014-2015) is a better alternative to an annual average as it would be less susceptible to monthly fluctuations and temporary economic shocks.
• Use network distance to measure distance. The pilot model used Euclidean Distance to draw a straight path between buyers and sellers. The updated model uses network distance, which uses actual street networks to measure the distances between buyers and sellers.
Geographic Region The study area includes nine Northeastern states: all six New England states: Connecticut, Maine, Massachusetts, New Hampshire, Rhode Island, and Vermont; and three bordering states: New Jersey, New York, and Pennsylvania. Border states were included to capture edge effects (i.e., transactions that occur within proximity of the region).
2 The red meat industry is comprised of establishments that are involved with the production, slaughtering, and processing of beef, pork, or both. The report uses beef in examples since the meat industry in New England is largely comprised of beef. Only about 10 percent of the establishments were identified as solely focused on pork.

3
Data Sources Reinvestment Fund utilized the following data sources to build the SCM: 1. The National Establishment Time Series (NETS) database provides longitudinal records for
the location, industry classification, employment and sales information for all firms in the red meat supply chain in our study area. 3 Industry classifications (i.e., Standard Industrial Classification (SIC) system) were utilized to identify firms relevant to the red meat industry and assign establishments to different stages of the supply chain. Sales information was used to estimate supply and demand. 4
2. The USDA Economic Research Service (ERS) developed a methodology to estimate the average value of the meat at different stages of the supply chain. It estimates net farm value (i.e., average value of the animal to the producer), wholesale value (i.e., average value of the animal as it leaves the packing plant), and retail (i.e., average value of the meat at grocery stores). USDA Meat Price Spreads were used to estimate buyer demand. 5
Factors in the Model The primary goal of the SCM is to articulate a model that minimizes the distance between buyers and sellers within a given geography, taking into account seller supply and buyer demand. Key steps to build the model include: • Identify key stages that comprise the red meat supply chain; • Determine the establishments to include in the model; • Assign business establishments to a specific supply chain stage; • Estimate the supply and demand of business establishments. Understanding the Red Meat Supply Chain Red meat starts with producers (i.e., farmers), but can travel through multiple pathways from farm to table. Figure 1 presents a basic representation of these different pathways. For this study, the SCM analyzed two segments of the supply chain: producers and 1st stage processors and 1st stage processors and 2nd stage processors: • Producers (i.e., farms and feedlots) sell live animals to 1st stage processors (i.e.,
slaughterhouse or meatpackers) who slaughter the animals into cuts. • Slaughterhouses and meatpackers sell the cuts to 2nd stage processors (i.e., post-slaughter
processing facilities) who transform the cuts into value-added meat products, such as sausages and meat pies. 6
3 See Appendix for challenges associated with the NETS database. For more information about NETS, see http://bit.ly/NETSInfo 4 The SIC is an industry classification system used by government agencies to classify business establishments into their most appropriate industry sectors. For more information, see http://bit.ly/SICInformation 5 For more information about the USDA Meat Price Spreads, see http://bit.ly/USDAPriceSpread 6 Extending the SCM into retail outlets would represent a substantial extension of the tool for future studies.

4
Figure 1: A Walk Through the Supply Chain
PRODUCER
Livestock Farmer sells cattle to a . . .
1ST STAGE PROCESSOR
Slaughterhouse or Meatpacker who slaughters and/or cuts the meat and sells the meat to either a . . .
2ND STAGE PROCESSOR
Meat Processor who converts the cuts into other meat products, such as sausage, hamburgers, or meat pies
WHOLESALE OR RETAIL
Or a Distributor or Grocer
Estimating Supply For producers and 1st stage processors, annual sales from NETS represent a proxy for supply estimates. For example, a business establishment classified as Beef Cattle, Except Feedlots (SIC 0212) with annual sales of $500,000 means that this is a beef producer with $500,000 of animals available for sale to a 1st stage processor. Most cuts of meat from 1st stage processors are not sold to 2nd stage processors for further processing, rather they go straight to retail (e.g., restaurants, farmers markets, or supermarkets). Therefore, adjustments were made to better reflect the amount of supplies that were available for 2nd stage processor. Based on feedback from industry informants, the SCM allocates one-third of 1st stage processor sales for sale to 2nd stage processors. The remaining two-thirds fall out of the model, since it does not include retailers. Estimating Demand A primary challenge in estimating demand for live animals and processed products is that there is no national or regional database with firm level demand estimates. Demand was determined using a multiplier from the USDA Meat Price Spreads and sales figures provided

5
by NETS. Figure 2, on the following page, details an example of how the multiplier was calculated from the USDA Meat Price Spreads and how it was applied in the model.7 What is the role of the demand multiplier? Among producers and processors, sales revenue can be used for multiple purposes: buy more supplies, pay operational cost, realize profits, etc. In the SCM, the demand multiplier represents a fixed proportion of sales that establishments expend on inputs – this multiplier is adjusted for smaller and larger producers and processors. The multiplier was calculated using values provided by the USDA Meat Price Spreads to estimate the share of establishment sales used to purchase new meat inputs. Appendix II details the multipliers calculated for beef and pork at different stages of the supply chain. What is the USDA Meat Price Spreads? The USDA Meat Price Spreads provide estimated values for specific cuts of meat at different stages of the supply chain, providing a way to estimate demand at different points in the supply chain. The price spreads calculate values based on the per pound retail weight of selected cuts of meat found in grocery stores, using a conversion factor to estimate farm and wholesale value (Hahn, 2004). For example, “The live animal value is the cost of the amount of live animal it takes to produce 1 pound of retail meat” (p. 5). Although commonly used as a measure of gross margins, USDA stresses that the price spreads is not equivalent to gross margins.
7 Appendix II presents a graphic overview of the way USDA Meat Price Spreads were built into the SCM at different points in the supply chain for different sized producers and processors.

6
Utilizing the Price Spreads to Estimate Demand The figure below presents an example of how the SCM uses USDA Meat Price Spreads to calculate demand. The SCM relies on two key assumptions in modeling transactions between establishments: (1) the seller will sell its product at face value and the buyer will agree to pay this price, and (2) economies of scale exist in the market; therefore, smaller establishments will place a higher value on the product relative to their larger counterparts. USDA Meat Price Spreads provide the values for each stage, measured in per pound of retail weight. Since the price spread is based on the value of a standard animal and standard cuts, and does not include by-products, the values presented are likely to be an underestimate (Please see Appendix I for more information on data challenges and limitations).
Figure 2: A Walk Through the Use of the Price Spreads (Mea t Ty p e: Be ef ; Es ta bl i s hm en t S iz e : L ar g e) Producer Value
Average value of standard animal in the farm, measured in per pound of retail weight
$327
1st Stage Processor Value Average value of the meat as it leaves 1st stage, measured in per pound of retail weight
$350
Percentage of 1st Stage Processor’s Sales Spent on Inputs from Farms
93%
2nd Stage Processor Value Average value of the meat as it leaves 2nd stage, measured in per pound of retail weight
$435
Percentage of 2nd Stage Processor’s Sales Spent on Inputs from 1st Stage Processors
80%
Retail Value Average value of selected standard cuts of meat in grocery stores, measured in per pound of retail weight
$613
Percentage of Retail Sales Spent on Inputs from 2nd Stage Processors
71%
1s t Stage
In this scenario, the model assumes that the 1st stage processor would be able to buy inputs from the producer for $327 and sell its final product for $350. Thus, the 1st stage processor spends 93% of its sales revenue on the initial purchase of the animal. For example, we expect that a 1st stage processor with annual sales of $500,000 would have a demand of $465,000 (93% * $500,000). 2n d Stage
In this scenario, the model assumes that the 2nd stage processor would be able to buy inputs from the 1st stage process for $350 and sell its final product for $435. Thus, the 2nd stage processor spends 80% of its sales revenue on the initial purchase of the meat cuts. For example, we expect that a 2nd stage processor with annual sales of $500,000 would have a demand of $400,000 (80% * $500,000).

7
Establishing Buyer and Seller Connections The following factors identify buyer and seller relationships: • Position in the supply chain— buyers (1st or 2nd stage processors) or sellers (producers or
1st stage processors); • Seller Supply — how much each establishment has to sell; • Buyer Demand— how much each establishment can buy. Using actual street maps (i.e., network distance), the SCM geographically matches buyers and sellers at each stage in the supply chain to minimize the distance between buyers and sellers until supply is depleted or demand is satisfied. For example, the SCM will identify sellers who are closest to an individual buyer until the buyer’s demand is satisfied. Once the buyer’s demand has been satisfied, the buyer falls out of the market (for computational purposes). Simultaneously, as individual sellers sell their supply to one or more buyers, the seller falls out of the market. The SCM continues to identify buyer and seller connections that minimize distance until there are no more supplies to sell or no more demand to buy. To illustrate these connections, Map 1 presents an example for a single 1st stage processor in Southern Maine, highlighting connections with local producers that satisfy its demand.

8
Map 1: Satisfied Demand Estimates for a 1s t Stage Processor in Southern Maine
Map 1 illustrates an optimal set of relationships for a 1st stage processor in Southern Maine. Shapes represent buyers and sellers:
• Crosses represent 1st stage processors; the central, bolded cross near Rockland is the focus of this example.
• Circles represent producers. Size variation represents the magnitude of their sales.
Colors represent economic connections:
• Red – producer sells all supply to the focal 1st stage processor. • Orange – producer sells supply to other 1st stage processor. • Gray – producer is not able to sell any supply in the study area within the constraints of
the model.

9
II. THE RED MEAT INDUSTRY IN NEW ENGLAND Using the updated SCM, Reinvestment Fund conducted an analysis of the New England red meat supply chain to identify regional gaps in supply and demand and spur discussions in the local food industry about how such gaps might be addressed if the distance between buyers and sellers were the primary consideration. The results presented in this section provide an overview of the relationships between New England producers, 1st stage processors, and 2nd stage processors to identify those segments of the supply chain experiencing surpluses or shortages. The unique spatial feature of the SCM also provides insight into where gaps in the supply chain are most severe and point to locations that may be good candidates for future investments. NOTE: The results generated from the SCM represent spatially optimal relationships between producers and processors – i.e., the shortest distances to move meat from farms to 1st and 2nd stage processors. These results do not necessarily represent actual relationships between buyers and sellers. In addition, supply and demand calculations represent estimates based on available data (see Appendix I for a review of key data sources). Map 2, on the following page, presents an overview of the establishments in the New England red meat supply chain. This map reveals the following key features of the supply chain: • The red meat industry in New England is largely comprised of producers, and has minimal
processing capacity: • 292 producers;8 • 46 1st stage processors; • 84 2nd stage processors;
• Vermont has the largest number of producers (85). • With the exception of Maine (18), there are fewer than 10 1st stage processors located in
each New England state. • Second stage processors are primarily concentrated in Massachusetts and Connecticut.
8 Conversations with local stakeholders suggest that the number of producers identified for this analysis substantially underrepresents active producers in New England. NETS data are estimates, and do not fully capture producers in the state, particularly very small operations. However, undercounting producers does not change the overall findings – many producers are unable to sell their animals to slaughterhouses in the study area. Additional producers would only increase the excess supply in the region.

10
Map 2: The Red Meat Supply Chain in New England – Producers, 1st Stage Processors, & 2nd Stage Processors

11
The Meat Supply Chain Bottlenecks at 1st Stage Processing Across New England The SCM results suggest that the New England regional meat industry suffers from a substantial bottleneck at 1st stage processing. Figure 3 presents an overview of New England red meat as it flows from producers to 1st stage processors to 2nd stage processors. Figure 3: The Red Meat Supply Chain in New England
As Figure 3 illustrates, the 292 producers in New England have a collective supply of about $50 million. However, the 46 1st stage processors in New England only have the capacity to process about $15 million. First stage processors send roughly $5 million of meat cuts to 2nd stage processors, and the remainder go directly to retail.9 New England 2nd stage processors have a collective demand of $360 million, the vast majority of which must be satisfied by suppliers from outside of the region. 9 Background research and stakeholder feedback indicated that the majority of slaughtered meat is sold to retail and only a small percentage is available for further processing. To estimate the percentage available for further processing, in addition to stakeholder feedback, the following literature on take-home yields of animals were used as a guide: Washington State Department of Agriculture ( http://bit.ly/MeatProcessingChart); Food and Agriculture Organization of the United Nations ( http://bit.ly/MeatProcessingGuide); and Fuller Consulting LLC (http://bit.ly/MeatProcessingHome).

12
NOTE: Although the model was extended to include 2nd stage processors, there were considerable challenges encountered with modeling 2nd stage processing. Second stage processors include large, food manufacturing establishments that produce multiple product lines that are not always meat centric (e.g., soup or pasta) or involve non-red meat ingredients (e.g., poultry and fish). For 2nd stage processors, the SCM cannot differentiate the amount of sales dedicated to red meat. For this reason, the 2nd stage processing demand estimates likely overestimate actual demand. This is particularly true in Massachusetts and Connecticut, home to the majority of 2nd stage processors in the region. However, even a very conservative estimate of 50% would suggest a gap in excess of $150 million between 1st stage processor supply and 2nd stage processing demand in the region.

13
Farm to Slaughterhouse, NE Animals Exceed NE Processing Capacity Throughout New England, farms and feedlots are abundant, while 1st stage processing capacity is highly restricted, making it difficult for farmers to find meatpacking and slaughtering facilities in the region. Producers raise more animals than regional slaughterhouses can accommodate, leading to “long waiting times for slaughtering or long hours driving to reach out-of-state facilities” (Arnett, 2014). Navigating these challenges creates added costs for producers, costs associated with finding distant buyers and transporting their animals to distant processors. Map 3 presents the estimated percentage of excess supply for counties in each New England state, representing roughly from $175,000 in Connecticut to $7.9 million in Vermont. Map 3: Excess Supply Estimates in New England
Figure 4, on the following page, presents the percentage of the estimated supply for each state that is sold in-state, out-of-state, or represents surplus in the regional market. For example, Maine sells approximately 33% of its total supply ($9.5 million) to 1st stage processors, 32% to 1st stage processors in the state and 1% to out-of-state slaughterhouses. Maine producers were unable to sell the approximately two-thirds of estimated supply to any 1st stage processors in New England.

14
Figure 4: Excess Regional Supply Estimates for Producers in New England
With the exception of Connecticut (97%), producers in the New England states sell fewer than half of all their animals in the region. Additionally, the SCM results suggest that slaughterhouses could potentially satisfy their demand by primarily buying from in-state producers.
Estimated Supply (in millions of dollars)
$6.5
$11.5
$9.5
$11.0
$3.0
$6.0
89%
71%
71%
68%
53%
3%
0% 20% 40% 60% 80% 100%
Rhode Island
New Hampshire
Vermont
Maine
Massachusetts
Connecticut
In State Out State Surplus

15
Second Stage Processors in NE have Unmet Demand The bottleneck between the producers and 1st stage processors adversely affects the 2nd stage processors as well. The SCM results suggest that 1st stage processors can potentially sell all their supply ($5 million) to 2nd stage processors in New England, and 2nd stage processors in the region would still be left with substantial unmet demand. Map 4 presents the percentage of unmet demand for 2nd stage processors in New England, assuming they consume all available supply from 1st stage processors in the region. Map 4: Unmet Demand Estimates for Cut Meat in New England
Overall, many New England counties do not have any 2nd stage processing capacity. In particular, Massachusetts and Connecticut account for about 90 percent of all 2nd stage processing demand in the region. However, the SCM results suggest less than one percent of this demand could be met within the region, meaning that 2nd stage processors in these states are likely importing the vast majority of their inputs from outside the region.

16
Figure 5 presents the percentage of each state’s 2nd stage processing demand that could be satisfied in-state, out-of-state, or is unmet in the regional market. For example, Maine’s 2nd stage processors could satisfy 75% of their total demand ($2 million), 72% from 1st stage processors in the state and 3% from out-of-state – leaving Maine’s 2nd stage processors with potentially up to 25% of their demand unmet by 1st stage processors in New England. With the exception of Maine, over 90% of 2nd stage processing demand in every New England state is potentially unsatisfied by in-region supply. Figure 5: Unmet Regional Demand Estimates for 2nd Stage Processors in New England
Estimated Demand (in millions of dollars)
$2.0
$13.0
$16.0
$6.0
$248.0
$78.0
100%
99%
98%
97%
91%
25%
0% 20% 40% 60% 80% 100%
Connecticut
Massachusetts
New Hampshire
Rhode Island
Vermont
Maine
In State Out State Surplus

17
III. SCENARIO ANALYSES: MAINE The SCM results can provide insight into how additional actors in the supply chain can potentially impact a broader network of buyer and seller relationships. The results of the analyses can provide critical insights for policy makers, business leaders, potential investors, and local communities involved in decision making to influence local supply chains. This section presents two separate scenarios to adjust the red meat supply chain in Maine. The first scenario examines how a new 1st and 2nd stage processing facility scheduled to come online in Aroostook County, ME could influence local producers and processors. The second scenario examines how the inclusion of increased 1st stage processing capacity throughout Maine could balance existing bottlenecks between producers and 1st stage processors throughout the state. Scenario 1: Increasing Processing Capacity in Aroostook County Aroostook County is a county with pristine farmlands, limited processing facilities, and no post-slaughtering capacity. Furthermore, it is geographically isolated from the more robust processing markets in Southwestern Maine. A new facility, Aroostook Prime, with capacity for $1.3 million in 1st stage processing and $675,000 in 2nd stage processing is planned in Woodland, ME for operation in late 2016. Scenario One examines how adding this facility into the supply chain would impact buyer and seller relationships in the region. Map 5, on the following page, presents the producer and 1st stage processor relationships before and after the inclusion of the new facility with $1.3 million in 1st stage processing capacity. Map 6, on page 20, presents 1st and 2nd stage processor relationships before and after the inclusion of the new facility. By adding Aroostook Prime, the county could increase economic activity associated with additional jobs, locally circulated earnings, and locally processed animals within the county. Producers could reduce costs associated with shipping animals to distant processors, and the introduction of post-slaughtering processing could also bring local value-added products to Aroostook County.

18
Map 5: The Potential Impact of Building Aroostook Prime, 1s t Stage Processor Circles represent producers and crosses represent 1st stage processors; the green cross on the ‘AFTER’ map is the proposed location of Aroostook Prime. The size of each circle reflects the relative size of producers. Red circles are producers that could sell to 1st stage processors in Aroostook County. Orange circles are producers that could sell outside Aroostook County. Gray circles are producers that, within the constraints of the SCM, are unable to sell their animals in New England.
With the new facility, a greater number of Aroostook County producers would be able to send their animals to an in-county slaughterhouse. The Aroostook Prime site could fulfill its demand by buying supplies from 12 producers in the county that in all likelihood were unable to sell to slaughterhouses anywhere in Aroostook County, and potentially the entire region. With the inclusion of Aroostook Prime, these 12 producers would only have to transport their animals 35 miles to the new slaughterhouse, on average.
19
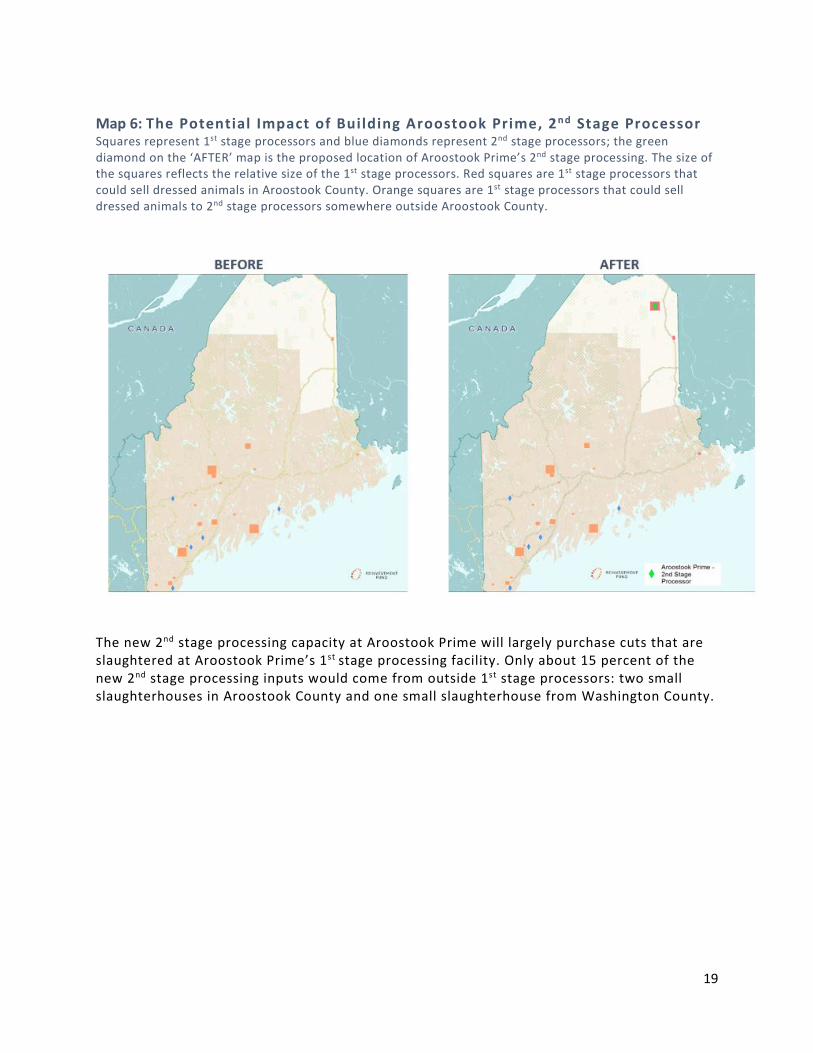
Map 6: The Potential Impact of Building Aroostook Prime, 2n d Stage Processor Squares represent 1st stage processors and blue diamonds represent 2nd stage processors; the green diamond on the ‘AFTER’ map is the proposed location of Aroostook Prime’s 2nd stage processing. The size of the squares reflects the relative size of the 1st stage processors. Red squares are 1st stage processors that could sell dressed animals in Aroostook County. Orange squares are 1st stage processors that could sell dressed animals to 2nd stage processors somewhere outside Aroostook County.
The new 2nd stage processing capacity at Aroostook Prime will largely purchase cuts that are slaughtered at Aroostook Prime’s 1st stage processing facility. Only about 15 percent of the new 2nd stage processing inputs would come from outside 1st stage processors: two small slaughterhouses in Aroostook County and one small slaughterhouse from Washington County.

20
Scenario 2: Closing State-Wide Gaps between Producers and 1st Stage Processors Scenario Two is designed to close the gap between producers and 1st stage processors in each of Maine’s five regions: Aroostook-Washington, Central-Western, North Coastal, South Coastal, and Tri-County. 10 Figure 6 presents excess supply estimates for each of Maine’s five regions. Figure 6: Excess Supply Estimates by Region
The SCM results suggest that in each region, producers likely cannot sell some portion of their animals to buyers in New England. Excess supply estimates ranged from only 10% in the North Coastal region to 91% percent in Aroostook-Washington. The remaining three regions’ excess supply estimates were about two-thirds of their supply. To close the regional gap between producers and 1st stage processors, additional 1st stage processors were placed in each region to buy excess supply. Figure 7 presents the size and location of hypothetical 1st stage processors added into the SCM in each region. Map 7 presents estimated producer and 1st stage processor relationships before and after the inclusion of the new facilities. Figure 7: Characteristics of New 1s t Stage Processors 11 Region City Size (Annual Sales) Aroostook- Washington Chapman $1,936,000 Central-Western Monmouth $2,577,000 North Coastal Troy $79,000 South Coastal Windham $1,222,000 Tri-County Port Clyde $595,000
10 Regions were defined using regions identified by the Maine Department of Labor, Center for Workforce Research and Information (http://www.maine.gov/labor/cwri/). 11 The location of each proposed 1st stage processor is based on the locations of producers with excess supply in each region and the size is based on the amount of excess supply in each region for this simulation.
10%
64% 66% 69%
91%
Nor
th C
oast
al
Sout
h Co
asta
l
Tri-C
ount
y
Cent
ral-
Wes
tern
Aroo
stoo
k-W
ashi
ngto
n

21
Map 7: Potential Impact of Adding a Slaughterhouse in Each Region Circles represent producers and crosses represent 1st stage processors; the bolded-blue crosses on the ‘AFTER’ map are the proposed locations of hypothetical 1st stage processors. The size of each circle reflects the relative size of the producer. Red circles are producers that could sell all of their supply to a 1st stage processor. Orange circles are producers that could only sell a portion of their supply. Gray circles are producers that could not sell any of their animals in New England.
Prior to the inclusion of the new 1st stage processors, many producers were potentially unable to find 1st stage processing for their animals in New England - the grey and orange circles in the “Before” map. This excess supply represented roughly $6.4 million of animals potentially shipped out of New England for processing. Adding new 1st stage processors could reduce the excess supply to less than $500,000, with many more ‘red’ producers in the “After” map – i.e., producers who could sell all their animals in the region. Increased 1st stage processing capacity in Maine could boost the income of farmers by lowering shipping costs, and could also increase the amount of meat cuts available for 2nd stage processors. While Maine’s 2nd stage processors currently have fairly limited capacity, increased 1st stage processing could create export opportunities as second stage processors in other New England states have a substantial unmet demand for dressed animals.

22
CONCLUSION Using the SCM to assess New England’s meat industry provides a clear picture of the regional bottleneck at 1st stage processing. Within the parameters specified for the SCM, New England producers can sell only about 40% of their supply in the region. As a result, New England 2nd stage processors can only satisfy a very small share of their demand in the region. These market gaps weaken the regional food system as businesses turn to suppliers and buyers outside the region to meet their needs. The results presented in this report provide substantive conversation starters for key stakeholders and practitioners to inform policy, advocacy and development activity. Growing demand and interest for locally sourced food presents a clear opportunity to strengthen regional food systems. However, the results presented in this study suggest that the current infrastructure does not appear to be adequate to support regionally, much less locally, sourced and processed meat products in New England. Making use of the findings presented in this report will require ongoing collaborations between multiple stakeholders to guide the development of the regional infrastructure to support locally sourced meat production and consumption. Extending the Supply Chain Matrix As previously stated, the following refinements were built into the analysis of New England red meat industry: • Refined supply estimates include auction houses as producers; • Refined connections between producers and processors account for economies of scale
between producers and processors based on size; • Refined price spread estimates use a two-year rolling average to value meat at different
stages in the supply chain; • Refined network calculations estimate distance between buyers and sellers based on
street networks rather than straight line distance. These adjustments greatly enhanced the SCM estimates for supply and demand, while also adding greater precision to distance calculations. These adjustments improved our ability to identify the most advantageous locational connections throughout the supply chain. The findings from this application also point to additional steps to further refine the SCM: • Enhanced data validation to improve the reliability of supply and demand estimates; • Quantitative and qualitative data collection with market participants to understand
decision making; • Qualitative and quantitative data collection with 2nd stage processors to understand
production and sales. Thus far, the SCM has been solely applied to the meat industry, both in Pennsylvania and New England. However, a key advantage of the tool is its applicability to any geography for any product that is locally produced, processed, and distributed. While every industry and geography is unique, the SCM is flexible enough to identify barriers and efficiencies within other industries and regions to inform the development of efficient and sustainable local supply chains.

23
APPENDIX I: Technical Notes on Data Sources The meat supply chain is a complex network of relationships governed by multiple factors that cannot all be represented in the SCM. The SCM models a single instance of the network that moves in a consistent sequence between the different stages in the supply chain, and assumes that all establishments in the meat supply chain follow this path. The SCM model assumes that the meat travels forward from farm to 1st stage processing to 2nd stage processing and finally to consumers via retail outlets. The model does not capture other possible pathways to move products from farms to consumers that may not adhere to this straight forward process. In addition to product flow limitations, the data sources used by the SCM carry additional limitations. The SCM relied heavily on data from the National Establishment Time Series (NETS), which is one of the most comprehensive data source for business establishments in the United States. However, the dataset also presents the following challenges: • Producers are substantially undercounted in the NETS data. Local informants vetted all
establishments in the NETS data and 1st and 2nd stage processors were cross checked against the lists of slaughterhouses and meat processors released by USDA’s Meat, Poultry, and Egg Product Inspection Directory. The 1st and 2nd stage processors identified in NETS were generally acknowledged as accurate by local stakeholders.
• Longitude and latitude coordinates provided for individual establishments did not always specify actual addresses. In instances where the coordinate system represented census tract or zip code centroids, manual geocoding was attempted to improve accuracy.
• Sales are not always reported by establishments. For these cases, NETS provides an estimate based on industry knowledge – it was not possible to validate these estimates.
• Primary industry classifications were drawn from two- to eight-digits SIC codes, which become increasingly specific with more digits. Close examination suggests that SIC code accuracy reduces as specificity increases. For this reason, four-digit SIC codes were used as a good balance between accuracy and the specificity required to assign establishments to supply chain stages.
• The SCM relies only on primary SIC codes for each establishment, and is unable to fully represent establishments involved at multiple stages of the supply chain. For example, a farm can also have processing capacity, but the data would not reveal this distinction and the model would only recognize the farm in the producer stage.
The USDA Meat Price Spreads were an essential part of the demand calculation. However, the price spreads were developed to represent the most common path from farm to retail for the most common cuts of meat:
“[The] price spreads are based on a standard animal, cut up in a standard way at the packing plant, and sold in standard form through the retail store (Hahn, 2004, p. 4)”.
Using the USDA Meat Price Spreads may underestimate buyer demand since higher quality animals and cuts would solicit greater prices, as well as products sold outside of grocery stores, such as farmers’ markets or butcher shops.

24
In addition to underestimating demand, challenges were discovered when extending the use of the methodology to model the relationship between 1st stage and 2nd stage processing: • The NETS database does not provide information on product lines, which is especially
problematic in 2nd stage processing. Due to this limitation, it was not possible to estimate the percentages of the establishments’ activities that include red meat.
• The multiplier that estimates the share of sales attributed to buying inputs assumes that inputs are solely meat, which is not typically the case for 2nd stage processing. Some 2nd stage products like burgers and sausages have largely meat inputs, but more processed products are comprised of a variety of ingredients in addition to meat. For this reason, the applicability of the multiplier weakens between 1st stage and 2nd stage processing.
• The USDA Meat Price Spreads do not account for value-added products sold in grocery stores (i.e., processed foods and products sold in the service deli). This means that a large share of outputs from 2nd stage processing was not considered in the retail value.

25
APPENDIX II: Estimating Demand Using USDA Meat Price Spreads The figure below presents the assumptions built into the SCM to estimate demand at different stages in the meat supply chain. The figure also represents how the size of producers and processors are accounted for in the SCM, building greater efficiencies into more vertically aligned pathways through larger producers and processors on the way to retail distribution. Each box represents the value placed on the product for each stage of the supply chain, while the circle indicates the percentage of the buyer’s sales revenue that were spent on buying inputs. As the figure highlights, when a large 1st stage processor buys live cattle from a large producer, 93% of the large 1st stage processor’s revenue from selling beef is spent on buying the live cattle.
Note: Assumptions were necessary to build a comprehensive supply chain that includes 2nd stage processing and differentiates between small and large establishments. The USDA Meat Price Spreads provide values for Large Producers, Small 1st Stage Processors, and Retail. The remaining values were estimated using USDA values as a foundation and assumed that small establishments place a greater value on the products relative to large establishments since large establishments can benefit from economies of scale.

26
Citations
Arnett, A. (2014, February 14). Livestock Farmers in Massachusetts Face Processing Bottlenecks. Boston Globe. Retrieved from https://www.bostonglobe.com/
Hahn, W. (2004). Beef and Pork Value and Price Spreads Explained. Washington, DC: Economic Research
Service, U.S. Department of Agriculture (USDA). Lowell, J. (2015, November 19). Central Maine Meats Readies Red Meat Processing Facility. Kennebec
Journal. Retrieved from http://www.centralmaine.com/ The initial SCM report can be downloaded at https://www.reinvestment.com/research-publications/the-
supply-chain-matrix-a-prospective-study-of-the-spatial-and-economic-connections-within-the-regions-meat-industry/
Graphics “Cow” symbol on pages 5, 7, 9, 12, and 14 is by Road Signs from the Noun Project “Beef” symbol on pages 5, 7, 9, 12, 14, and 16 is by Braden Stranks from the Noun Project “Meat Grinder” symbol on pages 5, 7, 12, and 16 is by Cédric Villain from the Noun Project “Shopping Cart” symbol on pages 5 and 7 by Renee Ramsey-Passmore from the Noun Project

PHILADELPHIA 1700 Market Street, 19th floor Philadelphia, PA 19103 TEL 215.574.5800 FAX 215.574.5900
REINVESTMENT FUND is a catalyst for change in low-income communities. We integrate data, policy and strategic investments to improve the quality of life in low-income neighborhoods.
www.reinvestment.com www.policymap.com
real estate early education
healthcare healthy food
housing k-12 education
data & analysis
sustainable energy
BALTIMORE 1707 North Charles Street, Suite 200B Baltimore, MD 21201 TEL 410.783.1110 FAX 410.637.8265
Reinvestment Fund is an equal opportunity provider.
2013
The Supply Chain Matrix: A Prospective Study of the Spatial and Economic Connections within the Region’s Meat Industry
2015
PA Fresh Food Financing Initiative: Case Study of Rural Grocery Store Investments
2017
Colorado Healthy Food Financing: Case Study of Colorado Enterprise Fund Fresh Food Initiatives
2015
2014 Analysis of Limited Supermarket Access
Reinvestment Fund has published a range of reports addressing critical public policy issues. The highlighted reports below represent recent food-related research projects. For details, please visit our Policy Publications site: WWW.REINVESTMENT.COM/IMPACT/RESEARCH-PUBLICATIONS