THE STUDY ON MASTER PLAN FOR PROMOTION OF MINING …
73
THE STUDY ON MASTER PLAN FOR PROMOTION OF MINING INDUSTRY IN REPUBLIC OF SERBIA FINAL REPORT(Summary) CONTENTS Pages CHAPTER1 Outline of the Study 1.1 Background of the Study··········································································1 1.2 Purpose of the Study ·············································································· 1 1.3 Target Area of the Study ··········································································1 1.4 Method and Content of Study ····································································1 1.5 Local Survey ······················································································· 2 1.6 Case Study ··························································································4 CHAPTER2 Investment Foundation 2.1 National Economic Development Plan··························································6 2.2 Economic Conditions··············································································6 2.3 General State of the Mining Industry ···························································8 2.4 Finances and Accounting ······································································· 10 2.5 Serbian Infrastructure ··········································································· 12 CHAPTER3 Current State of the Mining Industry 3.1 Privatization ······················································································ 18 3.2 Investment Climate and Investment Promotion·············································· 18 3.3 World Bank and Internationally Supported Projects ········································ 21 3.4 Mining Policy ···················································································· 22 3.5 Mining Administration ·········································································· 22 3.6 The Mining Law and Procedures for Mining Licenses ····································· 24 3.7 Mining Activities ················································································ 28 3.8 Geology and Mineral Potential in Serbia ····················································· 30 3.9 Current State and Tasks of Mining Activities ················································ 33 3.10 Geology and Deposits of the Velijki Majdan Mine ········································ 36 3.11 Geology and Deposits of the Zajaca Mine ·················································· 37 3.12 Activities of Serbian Non-Ferrous Mines ··················································· 40 i
Transcript of THE STUDY ON MASTER PLAN FOR PROMOTION OF MINING …

THE STUDY ON MASTER PLAN FOR PROMOTION OF MINING INDUSTRY IN REPUBLIC OF SERBIA FINAL REPORT(Summary)
CONTENTS
Pages
CHAPTER1 Outline of the Study
1.1 Background of the Study··········································································1
1.2 Purpose of the Study ··············································································1
1.3 Target Area of the Study ··········································································1
1.4 Method and Content of Study ····································································1
1.5 Local Survey ·······················································································2
1.6 Case Study ··························································································4
CHAPTER2 Investment Foundation
2.1 National Economic Development Plan··························································6
2.2 Economic Conditions··············································································6
2.3 General State of the Mining Industry ···························································8
2.4 Finances and Accounting ······································································· 10
2.5 Serbian Infrastructure ··········································································· 12
CHAPTER3 Current State of the Mining Industry
3.1 Privatization ······················································································ 18
3.2 Investment Climate and Investment Promotion·············································· 18
3.3 World Bank and Internationally Supported Projects ········································ 21
3.4 Mining Policy ···················································································· 22
3.5 Mining Administration ·········································································· 22
3.6 The Mining Law and Procedures for Mining Licenses ····································· 24
3.7 Mining Activities ················································································ 28
3.8 Geology and Mineral Potential in Serbia ····················································· 30
3.9 Current State and Tasks of Mining Activities ················································ 33
3.10 Geology and Deposits of the Velijki Majdan Mine ········································ 36
3.11 Geology and Deposits of the Zajaca Mine ·················································· 37
3.12 Activities of Serbian Non-Ferrous Mines ··················································· 40
i
CHAPTER4 Current State and Tasks of Mining Activities
4.1 Activities of Large Mines owned by RTB Bor ··············································· 43
4.2 Activities of Middle/Small-Scale Mines in Serbia ·········································· 49
4.3 Other Mining Activities ········································································· 52
4.4 Smelting Activities ·············································································· 54
CHAPTER5 Compilation of Digital Spatial Data Sets and Information Disclosure
5.1 Current State and Evaluation of GIS Database at MEM···································· 65
5.2 MEM Website ···················································································· 67
5.3 Some Approaches to Database Creation at MEP ············································ 70
5.4 Geological and Related Maps at the Geological Institute ·································· 71
5.5 Topographical maps by the Military Geography Institute ·································· 72
5.6 Current IT Utilization at Bor ··································································· 72
5.7 Strategic Future Database Construction ······················································ 72
CHAPTER6 Environmental Considerations
6.1 Laws and Regulations related to Environment··············································· 74
6.2 Environmental Monitor System································································ 77
6.3 Inspection System ··············································································· 79
6.4 Environmental Status in Serbia and Environmental Problems in Local Mine ··········· 80
CHAPTER7 Case Study
7.1 Preparation and Implementation of the Case Study ········································· 87
7.2 Geology, Deposits and Exploration ··························································· 87
7.3 Mining and Processing ·········································································· 93
7.4 Processing Plant and Tailings Dam of the Bor Complex ··································· 99
7.5 Issues in Serbian Mining Companies ························································ 113
CHAPTER8 Draft of the Master Plan
8.1 Policy and Purpose of the Master Plan······················································· 122
8.2 Mining Sector Institutional Strengthening and Visions···································· 124
8.3 Action Program and Institutional Program ·················································· 127
ii

8.4 Implementation Organization ································································· 129
8.5 Action Program·················································································· 130
8.6 Institutional Reform Programs ································································ 139
CHAPTER9 Recommendations
9.1 Current State of the Mining Industry and Serbian Mining ································ 146
9.2 National Economic Development Plan and Master Plan ·································· 148
9.3 Capacity Building··············································································· 149
9.4 Exploration, Development and Production Activities······································ 150
9.5 Mining Management············································································ 151
9.6 Environmental Conservation ·································································· 152
9.7 Unused Resources ·············································································· 154
9.8 Sustainable Development of the Mining Industry ·········································· 155
9.9 Database·························································································· 156
iii

List of Tables
Table 1.1 Study Team Members······························································2
Table 1.2 Candidate Mines for the Case Study·············································5
Table 2.1 Main Indices for Economic Growth (2001-2005) ······························7
Table 2.2 Features and Current State of the Serbian Mining Industry ················ 10
Table 3.1 Mine Privatization ································································ 18
Table 3.2 Ore Deposits and Metallogenesis in Serbia ···································· 31
Table 3.3 Ore Reserves and Potential in Serbia ··········································· 32
Table 3.4 Mineral Potential and Explored Areas·········································· 32
Table 3.5 List of Reserves in RTB Bor····················································· 36
Table 3.6 Reserves at the Zajaca Mine ··················································· 39
Table 3.7 Mineral Resources at the Zajaca Mine ········································ 40
Table 4.1 Comparison of Underground Operations in the Bor Mine in 1996
and 2003 (source: Bor) ·························································· 44
Table 4.2 Comparison of Exploited Mass in the Veliki Krivelj Open Pit ·············· 46
Table 4.3 Transition of RBB Personnel (source: RTB Bor) ····························· 46
Table 4.4 Slag to be Mined ·································································· 47
Table 4.5 Estimated Flotation Operation Values ·········································· 47
Table 4.6 Comparison of Exploited Mass in the South Pit ······························ 48
Table 4.7 Comparison of Exploited Mass in the North Pit ······························ 49
Table 4.8 Summary of Financial Reports ·················································· 56
Table 4.9 Comparison of Operating Costs by Smelting Process (direct cost) ········· 61
Table 5.1 Development of a GIS Database in MEM-DMG ······························ 65
Table 5.2 General Contents of the Databases Created by BRGM······················· 65
Table 5.3 Mine Datasets Stored in the Current GIS Database at MEM ················ 66
Table 5.4 General Contents of the Planned MEM-DMG English Website ··········· 68
Table 7.1 Reserves of the Grot Mine ······················································· 89
Table 7.2 Resources of the Grot Mine ····················································· 90
Table 7.3 Target Reserves to be Explored at the Grot Mine ····························· 91
Table 7.4 Reserves of the Suva Ruda Mine················································ 92
Table 7.5 Chemical Composition of 8 Holes Partial Composites ····················· 100
Table 7.6 Chemical Analyses Data of Composite Sample ····························· 100
Table 7.7 Chemical Analyses Results of Drilling Core Samples······················ 101
v

Table 7.8 Chemical Analyses Result of Composite Sample ··························· 101
Table 7.9 Analysis Results of Processing Plant ········································· 102
Table 7.10 Chemical Analysis Results of Snap Samples from Rudnik
Processing Plant ································································ 103
Table 7.11 Lead Flotation Result ··························································· 106
Table 7.12 Zinc Flotation Result ···························································· 106
Table 7.13 The Latest 10 years Processing Result of the Rudnik Mine ················ 107
Table 7.14 Analysis Result of Grot Mine Processing Plant Samples ·········· 109
Table 7.16 Waste of RTB-Bor ·······························································111
Table 7.17 Tailings of RTB-Bor·····························································111
Table 7.18 DCF-IRR estimation example of Cu recovering form the Bor mine
old tailing dam ···································································· 112
Table 7.19 DCF-IRR estimation example of Au recovering form the Lece mine
tailing dam ······································································ 113
Table 7.20 Balance Sheet of the Grot as of 2006- Unit-1,000 Dinars ·················· 115
Table 7.21 Grot Mine P/L Statement for 5 Years ········································· 116
Table 7.22 Grot Mine P/L Statement for 4 Year··········································· 116
Table 7.23 Weight of Production Cost in Sales ··········································· 117
Table 7.24 Ratio of Production Cost to Sales (%) ········································ 117
Table 7.25 Material Cost in Sales··························································· 117
Table 7.26 Other Expenses in Sales ························································ 117
Table 7.27 Production Cost and Other Expenses in Sales ······························· 118
Table 7.28 Grot Mine Profit & Loss Account in 2006···································· 118
Table 7.29 Grot Mine Income and Expenditure Account ································ 119
Table 8.1 Schedule for the Master Plan and Action Program····························· 123
Table 8.2 Scheduling for Reconstruction and Promotion of the Mining Sector ········ 124
Table 8.3 Action Program and Institutional Reform Program ···························· 127
Table 8.4 Main Issues with and Current State of Investment Promotion················ 131
Table 8.5 Overview of Regional Exploration··············································· 141
Table 8.6 Overview of an Environmental Survey ·········································· 144
Table 9.1 Surveys for Unused Resources in Serbia ········································ 154
vi

List of Figures
Fig 2.1 Trends in Revenues and Expenditures ·············································7
Fig 2.2 Trends in Foreign Investment ·······················································8
Fig 2.3 Role of the Mining Industry in the Economy ·····································8 Fig 2.4 Primary Roads in Serbia ·····························································13
Fig 2.5 Railway Network in Serbia ························································15
Fig 3.1 The World Bank Project ·····························································22
Fig 3.2 Organization of MEM································································23
Fig 3.3 Mineral Potential and Explored Areas in Serbia ··································33
Fig 3.4 Geological Map of the Bor Deposits ···············································35
Fig 3.5 Organization of the Mining Institute ···············································35
Fig 3.6 Geological Map of the Boranja Ore Field ·········································38 Fig 3.7 Zones of Mineral Deposits of the Boranja Ore Field ···························38
Fig 3.8 Geological Profile of the Turin Orebody at Zavorje Mine ······················38 Fig 3.9 Production of Copper Ore in Serbia Montenegro ·······························42
Fig 3.10 Mineral Potential of Serbia ························································42
Fig 4.1 Production of the last 20 yrs at RTB Bor (source: RTB Bor) ···················43
Fig 4.2 Layout of the Main Mine Facilities in Bor City (source: RTB Bor)············43
Fig 4.3 The Organization Chart of RBB (source: RTB Bor) ·····························43
Fig 4.4 Schematic Diagram of the Bor Underground Mine·······························44
Fig 4.5 Operation Result of the Bor Open Pit ··············································45
Fig 4.6 Geological Section of the Veliki Krivelj···········································45
Fig 4.7 Operation Result of the Veliki Krivelj ·············································45
Fig 4.8 Layout of Main Facility of the RBM ···············································47
Fig 4.9 Operation Result of the Majdanpek Mine ·········································48
Fig 4.10 Miners in the Majdanpek···························································48
Fig 4.11 Design and Current State of the South Pit ·········································49
Fig 4.12 Production Result of the Veliki Majdan ············································50
Fig 4.13 Schematic Diagram of the Veliki Majdan Underground Mine ···················51
Fig 4.14 Production Result of the Rudnik Mine ·············································51
Fig 4.15 Kostolac Mine Production in the Last 20 ··········································52
Fig 4.16 Kovilovaca ·············································································53
Fig 4.17 Past Production ········································································56
vii

Fig 4.18 Operating Cost by production ·······················································56
Fig 4.19 Operating Cost for Smelting and Refining ·········································57
Fig 4.20 Cu Grade Trend of Concentrate, Matte and Slag ··································57
Fig 4.21 Relation between TC/RC and Operating Cost ·····································58
Fig 4.22 Trend of LME Copper Price and TC/RC (US /lb in 2002) ·······················58
Fig 4.23 Relation between LME Price and TC/RC ··········································59
Fig 4.24 Copper Recovery Trend of the TIR Bor ············································59
Fig 4.25 Minimum Profitable Level of Production ··········································60
Fig 4.26 Trends in the Use of the New Smelting Process···································62
Fig 4.27 Production of Zinc in the Zorka Smelter ···········································63
Fig 4.28 Process of the Zorka Smelter ························································64
Fig 5.1 A view of the current GIS database at the MEM ···································66
Fig 5.2 Geological Information for GIS Database with Mineral Deposits from the
BRGM’s Database·······································································67
Fig 5.3 Website of MEM-DMG ······························································68
Fig 5.4 Portal Site for Web-GIS ·····························································69 Fig 5.5 Geology, Road Network and Mining Information on the Full Version of
Web-GIS Window ····································································69
Fig 5.6 Operation Windows in GEOLISS ·····················································71
Fig 6.1 Environmental monitor system ····················································77
Fig 6.2 Service Segment in each Inspection Section that relates to Environment ·····80
Fig 6.3 Origin Points of Wastewater ························································85
Fig 7.1 Geological Map of the Blagodat Ore Field ········································88
Fig 7.2 Geological Profile of the Blagodat Deposit ·······································88
Fig 7.3 Geological Profile of the Kula Deposit ············································89
Fig 7.4 Distribution of ore drposits in the Raska Metallogenic Zone ···················92
Fig 7.5 Production at the Grot Mine for last 23 years·····································93
Fig 7.6 Schematic Underground Section of the Grot Mine ·······························94
Fig 7.7 Distribution Map of the Raska Metallogenic Zone ·······························97
Fig 7.8 Lead and Zinc produced in the Kizevak Mine ····································97
Fig 7.9 Simulation for Ore Dilution in Half Bench Height ·······························99
Fig 7.10 Core-Drilling Points in the Old Tailing Dams at the Bor Mine················ 100
Fig 7.11 Core Drilling Points at the Lece Mine Tailings Dam························· 101
viii

Fig 7.12 Sampling Points at the Grot Mine Processing Plant ···························· 102
Fig 7.13 Sampling Points at the Rudnik Mine Processing Plant ························· 103
Fig 7.14 Leaching test result (Recovery of Cu and Fe) ··································· 104
Fig 7.15 SX test result ········································································ 104
Fig 7.16 Tendency of the Bor Mine Production and Cu Grade ··················· 108
Fig 7.17 Tendency of Cu Grade of Cu-Concentrate and Cu Recovery ·········· 108
Fig 8.1 Relationship between Current Mining Management and the Master Plan ····· 122
Fig 8.2 Roles of the Institutional Reform··················································· 122
Fig 8.3 The Master Plan for Improvement of the Mining Sector ························ 123
Fig 8.4 Financial Resources to Implement each Program································· 124
Fig 8.5 Institutional Reform ·································································· 124
Fig 8.6 Stance of the Mining Sector before and after Implementing the Master Plan · 125
Fig 8.7 Viewpoint of Improvement for Management System of the Mining
Concession ············································································· 126
Fig 8.8 Compilation of Information ························································· 126
Fig 8.9 Relation between the Action Program and Institutional Reform Program ····· 127
Fig 8.10 Location of each Measure of the Master Plan ··································· 128
Fig 8.11 Each Measures and Mining Promotion ··········································· 129
Fig 8.12 Implementation Organization for the Action Plan ······························ 129
Fig 8.13 Unitary Government Organization Concept for the Mining Sector ··········· 130
Fig 8.14 Organization of the Mining Agency ············································· 131
Fig 8.15 Schematic Diagram for Management of the Mining Sector ···················· 133
Fig 8.16 Structure chart for the division and privatization of the Research Institution133
Fig 8.17 Concept for Breakup and Privatization of National Institutes ················· 134
Fig 8.18 A Concept for Fostering Human Resources ······································ 134
Fig 8.19 Mining Fund Concept······························································· 135
Fig 8.20 Two-Step Loan ······································································ 135
Fig 8.21 The Mining Association and its related organizations ·························· 136
Fig 8.22 Monitoring System for Tailings Dam ············································· 136
Fig 8.23 Flow of Procedures to Acquire Mining Concession····························· 137
Fig 8.24 Concept of Management Improvemen ············································ 138
Fig 8.25 Concept for Implementation Flow of Environmental Measures ··············· 138
ix

Fig 8.26 Support Systems for Private Mining Companies ································ 139
Fig 8.27 Procedures Flow for Exploration Subsidy Institution ·························· 140
Fig 8.28 Regional Exploration and Investment Promotion ······························· 141
Fig 8.29 Mining Cadastre Management System············································ 141
Fig 8.30 Environmental Monitoring and Information Disclosure························ 143
Fig 8.31 Conceptual Diagram of a Monitoring System for Mining Activities·········· 143
Fig 8.32 Function-enhanced Organization of MEM ······································· 144
Fig 9.1 Recent Resources Powers ························································· 146
Fig 9.2 Relationship between Copper Ore Production and Ore Grade ················ 147
Fig 9.3 Schematic Diagram for Regional Economy in Mining ························· 147
Fig 9.4 Networked Regional Economy between Eastern Europe-Russia-Central Asia
····················································································· 148
Fig 9.5 Procedure to implement the Master Plan ········································ 149
Fig 9.6 One Example of Financial Management ········································· 151
Fig 9.7 A Concept for Monitoring Center ················································ 153
Fig 9.8 Investigation of the Tailings Dam ················································ 154
Fig 9.9 Flow of Recovering Metals from Tailings ······································· 155
Fig 9.10 Construction and Strategic Flow of Geo-science GIS Databases·············· 156
Fig 9.11 Flow of future MEM database r ··················································· 158
x

1
Chapter 1 Outline of the Study
1.1 Background of the Study
The Republic of Serbia (hereafter Serbia) is a country rich in metal and mineral resources.
During the Socialist Federal Republic of Yugoslavia era, Serbia was a metal supply station as well as
a major European producer of base metals such as copper, zinc, and lead. However, mining
production decreased dramatically due to economic sanctions imposed by the United Nations, and
competitiveness has decreased during the transition from a socialist economy to market economy.
Today, the mining industry is a pillar of the Serbian economy and exports of non-ferrous
metals amounted to 17% of total Serbian exports in 2004.The mining industry is an effective way for
the government to obtain foreign currency, and reformation and development of the mining industry
will make it a significant player in the economic development of Serbia. Therefore, a mining
industry policy is needed for internal and external investment promotion.
1.2 Purposes of the Study
The purposes of this study are as follows: (1) Elaboration of a Master Plan for developing
the Serbian mining industries under a market economy; (2) Creation of a road map for sustainable
development of the Serbian mining industry; and (3) Technical transfer so that Serbia can
independently expand and improve upon (1) and (2) long into the future.
1.3 Target Area of the Study
The target for this study is the entire territory of Serbia.
1.4 Method and Content of Study
The study consists of two stages: a basic survey stage (A) and a Master Plan formulation
stage (B).
A. The Basic Survey Stage consists of:
• Review and analysis of information related to investment and the environment
• Review and analysis of information on mineral resources (publications related to geology,
exploration reports).
• Support for development of a GIS database for mineral resources
• Preliminary work for an outline of the Master Plan for mining industry development
B.The Master Plan Formulation Stage consists of:
• Creation of a Master Plan for mining industry development
• Preparation of an action plan
• Case study and feedback for the Master Plan
• Recommendations for mining development
1.5 Local Survey
1.5.1 Implementation of the Study
The first local survey was carried out from January 14 to February 22, 2007 (40 days), the second

2
survey was carried out from May 10 to June 10, 2007 (32 days), the third survey was carried out
from July 1 to August 9, 2007 (40 days), and the forth survey was carried out from October 2 to 31,
2007 (30 days). The JICA team completed the local survey with eight to nine members on schedule. The fifth local survey was carried out from January 27 to February 12 (17 days).
1.5.2 Study Team Members (Table 1.1)
Name Assignment First site survey Second site survey Third site survey Fourth site survey
Yuji NISHIKAWA
Team Leader / Mining Promotion Policy / Macro Economics /
Investment Promotion
Jan.14-Jan.28, 2007Feb.14-Feb.22, 2007 May 15-May.31, 2007 Jul 15-Jul 31, 2007 Oct 11-Oct 24, 2007
Richard THOMPSON Investment Promotion B May 14-May 23, 2007 Jul 15-Jul 21, 2007
Mitsuo OZAKI Mining Accounting May 13-Jun.1, 2007 Jul 20-Aug 5, 2007 Oct 7-Oct 29, 2007
Masaharu MARUTANI Geology / Exploration Jan. 14-Feb.12,2007 May 10-Jun. 3,2007 Jul 9-Aug 1, 2007 Oct 2-Oct 29, 2007
Kazuki SHINGU Mining Jan.25-Feb.21,2007 May.10-Jun.7, 2007 Jul 8-Aug 5, 2007 Oct 8-Oct 31, 2007
Hisamitsu OOKI
Mineral Processing / Management of Tailings Dams Jan.14-Feb.2, 2007 May 13-Jun.10, 2007 Jul 7-Aug 3, 2007 Oct 8-Oct 31, 2007
Shinichiro MUTO Smelting Jan.25-Feb.13, 2007 May 19-Jun. 2, 2007 Jul 8-Jul 31, 2007
Masatoshi MURATA Environment Feb.8-Feb.21, 2007 May.10-Jun.7, 2007 Jul 7-Aug 3, 2007 Oct 8-Oct 27, 2007
Kazunari WADA GIS Database Jan.25-Feb.21, 2007 May.10-Jun.3, 2007 Jul 1-Aug 1, 2007 Oct 11-Oct 24, 2007
Toshio INOUE Coordinator Jan.14-Feb.2, 2007 May.13-May.30, 2007 Jul 12-Jul 26, 2007
1.5.3 Minutes from the Meeting with the Serbian Side
The Japanese Team had its 1st meeting with the Steering Committee, which represented the
Serbian side in “The Study on a Master Plan for the Promotion of the Mining Industry in the
Republic of Serbia”, and reached an agreement on the following points (the meeting minutes are
presented in Appendix II-1).
• The 1st meeting with the steering committee was held on January 19, 2007.
• The content of the Inception Report and the study schedule. • A case study of a small/medium-scale mine will be conducted based on study team
recommendations and the counterparts’ agreement.
• The 2nd meeting with the steering committee was held on July 17, 2007.
• The contents of the Progress Report
• Information on the status of the privatization process and the case study implementation
• The MEP organization, etc., described in the Progress Report must be revamped.
• The MEP must cooperate with the MEM in order to make the most efficient use of
geological data.
• Data accuracy must be improved for ore reserves and other areas described in the report.
The 3rd meeting with the steering committee was held on October 14, 2007. In attendance
were the MEM and the MEP from the Serbian side, and the Japanese Embassy, the JICA Balkan
office, and the study team from the Japanese side. The participants agreed to the following points

3
(Appendix I-1). • The contents of the Interim Report
• The current state of privatization and the case study implementation.
• Schedule and content of the Interim Workshop, Regional Workshop and Tokyo Investment
Seminar, etc.
The following comments were made.
• The content and orientation of the Interim Report is reasonable.
• The tailings survey in the case study yielded results.
The 4th Steering Committee meeting was attended by representatives of MEM, MEP, financial
officials, the Japanese Embassy, the JICA-Balkan office, and the Japanese Study Team. The Draft
Final Report was explained and approved. The following is a list of what was covered at the
meeting:
Contents of the Draft Final Report
The state of privatization, industrial law, and mining policy
The results of case studies
In addition, the following comments were received:
• The Draft Final Report can become the Final Report by including the comments from the
Serbian side.
• Capacity development is needed at various stages to reform the mining sector.
• The Master Plan proposed by the Study Team is now being materialized. It would be
desirable to now receive support from the Japanese government.
1.5.4 Workshop
At the Progress Workshop on May 25, 2007, the Minister of Energy and Mines (MEM),
the Japanese Ambassador, the Vice Minister of Environmental Protection (MEP), a JICA
Representative, and the World Bank Serbia task manager presented addresses, and the MEM, the
MEP, Belgrade University, representatives from privatized mines, and study team members spoke at
the Nikola Tesla Conference Hall. There was a total of 94 participants.
The theme of the workshop was “From State Ownership to Private Sector Management”.
To help participants understand the current status of the mining industry and the plans for the future,
the study team presented a workshop, which was also useful for creation of the Master Plan
(Appendix I-6). Also, the theme of the Interim Workshop to be held on Oct 19, 2007 was “Charting
the Course for Rebuilding the Mining Foundation”.
The Minister of Energy and Mines (MEM) and the Japanese Ambassador gave addresses,
and the representatives of the MEM, MEP, SIEPA, Privatization Agency, JTI and the study team
gave presentations. There were a total of 83 participants. Through this workshop, the mining
orientation in the future was understood and also technical transfers were implemented by

4
presentations of the team members.
It should be noted that a regional workshop was carried out in Vranje in Oct 16, 2007 to
promote harmonious co-existence between mining activities and local communities. The Mayor of
the city, the Japanese Ambassador and a JICA Representative of the Balkan Office gave addresses,
and the representatives of the MEM, MEP and the study team gave presentations. There were a total
of 77 participants including city related people, the Grot Mine and local companies. Mining
activities in local communities, contribution of the mining sector to local communities and
environmental conservation were understood and technical transfers were implemented to the
counterparts and local people.
On February 6, 2008, a seminar with the theme “Master Plan and Roadmap for the
Mining Sector” was hald at the SAVA Center in Belgrade. In attendance were about 130 people
involved with the Serbian mining industry, Canadian companies undertaking exploration acativities
in Serbia, international organizations (World Bank, EBRD), Japanese companies, the news media,
and others. This final seminar entailed discussing and confirming the future course of the Serbian
mining sector, with presentations given according to the program (Appendix 4(1), P.22) by the
Minister of MEM, the Japanese Ambassador, the JICA main office, the World Bank, MEM, MEP, the
Study Team, and Canadian companies. As a result of this seminar, attendees were able to gain a
thorough understanding of the Master Plan, and confirm the future course of the mining sector.
1.5.5 International Investment Seminar
In order to give international investors a good understanding about the potential of Serbia ‘s
mining sector and mineral resources, an international investment seminar was held in Tokyo on
November 27, 2008 under the auspices of the Serbian Embassy, JBIC、JOGMEC、JICA、JOI、and
JETRO.
On January 30, the AMA Semonar was held at Armourers’Hall in London, UK.
Participating and making arrangements were 5 members of the Study Team (including one from the
UK), while the Serbian side was represented by 3 people from the MEM (including the vice minister,
whose expenses were covered by JICA), 1 person from SIEPA, and 3 people from Serbian
companies. The seminar program (see Appendix 3(1), p.16) included addresses from the Serbian
Ambassador to the Court of St. James’s and the vice minister of MEM, presentations by MEM and
Study Team members, and reports on exploration results and the attractiveness of investment in
exploration in Serbia by British and Canadian companies. Attendees included representatives of
British mining companies, exploration companies, mining and exploration consultants, international
organizations, and banks, among others. Representing Japan were 2 people from the JOGMEC
London office, and 1 person from JICA’s UK office.
1.6 Case Study
Candidate mines for the case study are limited because many mines have already been privatized.

5
The paths to privatization are tender, auction, bankruptcy, and reconstruction. Mines currently under
tender or auction processes are not being targeted for this case study.
The target mines were selected for the case studies which were conducted during the 2nd
and 3rd local surveys under the auspices of the MEM and Privatization Agency.
Table 1.2 Target Mines for the Case Study Target Mine Current Status Case Study
Grot Mine To be auctioned in March 2008
OK for exploration, mining, mineral processing, accounting
Lece Bankrupt OK for tailings dam Suva Ruda Sold, reconstruction
started OK for exploration, mining, mineral processing
RTB Bor Under negotiation OK for tailings dam
It should be noted that the Rudnik Mine was added for making comparisons.

6
Chapter 2 Investment Foundation
2.1 National Economic Development Plan
In November 2006, the Finance Ministry announced “the Memorandum on Budget and
Economic and Fiscal Policy for 2007 with Projections for 2008 and 2009” as a national economic
development plan. This Memorandum lays out policies, targets and methods through 2009 for Serbia
to make the transition to a market economy.This includes:
• National Plan for Joining the European Union
• Strategy for Poverty Reduction
• Strategy for National Economic Development
Strategy for Sector Development
2.2 Economic Conditions
2.2.1 Economic Policy
The following is a list of Serbia’s main economic policies covered in the above 3-year
development plan.
• Maintaining the stability of the macroeconomy and Serbian currency, and keeping inflation
under control
• Rapid implementation of economic and social reforms (completing economic reforms and
privatization)
• System reform (including national and local governments)
• Increase employment and living standards
Policy targets include a GDP growth rate of 7.2%, and the inflation rate to be reduced to
4.5% by 2009. These high-priority economic policies are each composed of individual policies. In
other words, this means the formulation of policies for inflation, exchange rates, finance,
international relations, employment, raising revenues, and so on.
2.2.2 National budget
The national budget is formulated and implemented based on the Budget System Law that
was implemented in 2002. This law, which covers preparations, procedures, and implementation of
budgets, bonds and guarantees, budget accounting and reports, budget management and auditing,
and the national treasury, among other things, lays out detailed rules for making draft proposals at
the ministry level, obtaining government (ministry) approval, obtaining approval from the national
legislature, and so on. The budget contains detailed information, including the nation’s overall
budget, the budgets of all ministries and government agencies, assets, loans, and payments made on
government bonds.

7
Fig. 2.1 Trends in Revenues and Expenditures
Looking at revenues and expenditures in the national budget, both are sharply increasing,
and there has been a budget surplus since 2004. This means that rebuilding is having a desirable
effect on the budget and may be reducing the economic burden imposed by national debt.
2.2.3 Macroeconomics
(1) Macroeconomics
The macroeconomics since 2001 that have involved economic policies such as finance and
budgetary reform, keeping inflation under control, free trade agreements, bank restructuring, and
promotion of privatization have been undergoing a rapid transformation. In 2005, GDP growth stood
at 6.5%, while per capita GDP has been rising steadily, reaching US $3,158 (Finance Ministry data).
This is the result of promoting investment, restructuring enterprises, and restoring productivity.
Table 2.1 Main Indices for Economic Growth (2001-2005) Item 2001 2002 2003 2004 2005GDP in current prices, in billion CSD * 784 1,020 1,172 1,431 1,750GDP, real growth, in % 5.1 4.5 2.4 9.3 6.8Inflation, period average, in % 91.8 19.5 11.7 10.1 16.5Inflation, end of the period, % 40.7 14.8 7.8 13.7 17.7Current account of the balance of payments, without donations, % GDP 7.4 11.0 9.6 13.5 9.8Unemployment rate, in %** 24.7 27.1 27.8 28.0 29.2
* Estimates ** Including insured farmers (Source: MoF and NES)
(2) Investment Promotion
The Serbian Investment and Export Promotion Agency (SIEPA), which is under direct
control of the Deputy Prime Minister, serves as a window for private investors.. The recent increase
in direct foreign investment (rising from US $1.5 billion in 2005 to US $4 billion in 2006) is closely
linked to the development of the investment climate.
However, there has been relatively little investment in the mining sector. Although SIEPA considers
mining to be a major sector, investment has not been actively promoted, and it still falls outside the
range of SIEPA activities.
0
100,000
200,000
300,000
400,000
500,000
600,000
700,000
2001 2002 2003 2004 2005
Expenditure
Revenue
Million RSD
8
Infrastructure
MinesProducts
MinesProducts
Revenue Trade balance GDP
Cost Sales
Exports
Employment
RoyaltiesIncome tax
Commodity tax
Spin-off businesses
•Manufacturing•Public works•Transport
Spin-off businesses
•Manufacturing•Public works•Transport
Economic Development
Rural development
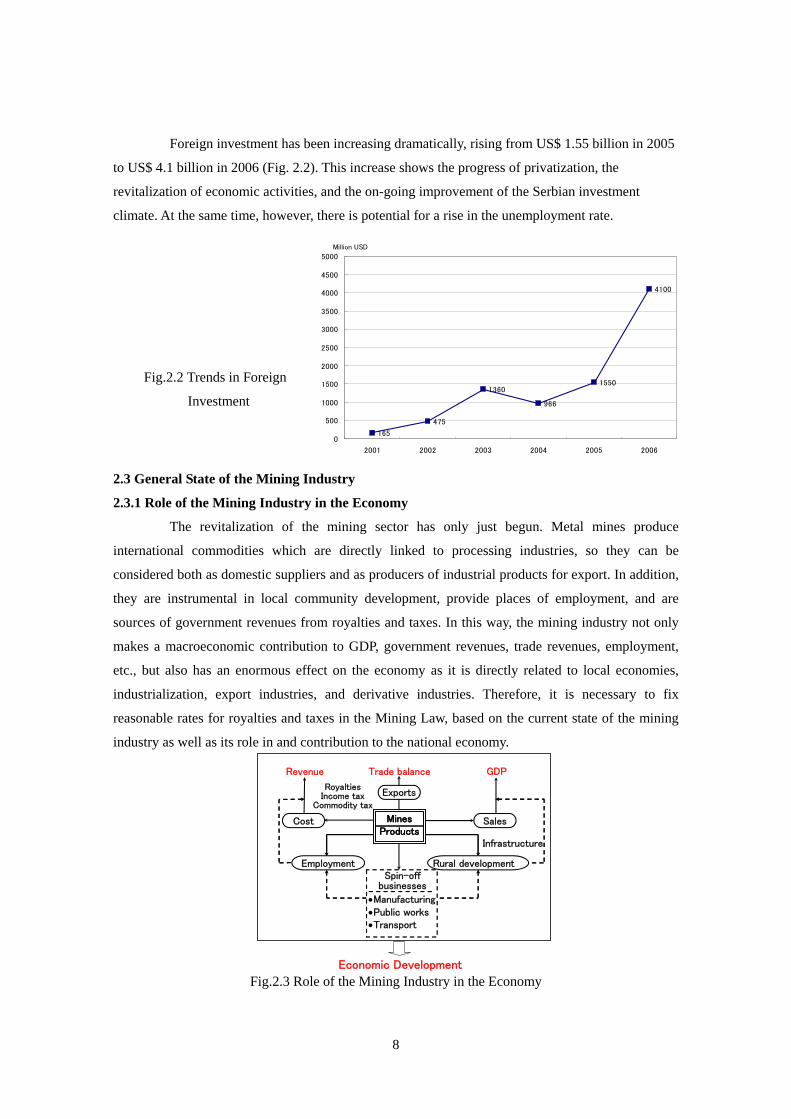
Foreign investment has been increasing dramatically, rising from US$ 1.55 billion in 2005
to US$ 4.1 billion in 2006 (Fig. 2.2). This increase shows the progress of privatization, the
revitalization of economic activities, and the on-going improvement of the Serbian investment
climate. At the same time, however, there is potential for a rise in the unemployment rate.
2.3 General State of the Mining Industry
2.3.1 Role of the Mining Industry in the Economy
The revitalization of the mining sector has only just begun. Metal mines produce
international commodities which are directly linked to processing industries, so they can be
considered both as domestic suppliers and as producers of industrial products for export. In addition,
they are instrumental in local community development, provide places of employment, and are
sources of government revenues from royalties and taxes. In this way, the mining industry not only
makes a macroeconomic contribution to GDP, government revenues, trade revenues, employment,
etc., but also has an enormous effect on the economy as it is directly related to local economies,
industrialization, export industries, and derivative industries. Therefore, it is necessary to fix
reasonable rates for royalties and taxes in the Mining Law, based on the current state of the mining
industry as well as its role in and contribution to the national economy.
Fig.2.3 Role of the Mining Industry in the Economy
165
475
1360
966
1550
4100
0
500
1000
1500
2000
2500
3000
3500
4000
4500
5000
2001 2002 2003 2004 2005 2006
Million USD
Fig.2.2 Trends in Foreign
Investment

9
The Serbian mining industry is involved with the extraction of coal, industrial materials,
building materials, and metals, primarily copper and zinc. Its estimated contribution to GDP was 3%,
and is moving at about the same rate as it was in the late 1990s.
2.3.2 State of the Mining Industry
Mining has a long tradition at the foundations of the Serbian economy and dates back over
3000 years. By 1990, annual mineral production revenues were nearly US$3.5 Bn at today’s prices
but unfortunately, output has declined to an estimated US$1.3 Bn.
Modern mining had its start in 1904, when a French businessman established the Bore
Mining Company and began full-scale operations. After the Second World War, a wide range of
mining activities was developed; for a long time, mining was one of Serbia’s premier industries and
formed one of the foundations of the country’s economy. This was especially the case with the RTB
Bor complex which was comprised of core companies possessing mining and smelting facilities and
equipment. The complex had 15,000 employees, and more than 6,000 others were employed in
subsidiary companies that were involved in the processing of copper or the refining of precious
metals from copper ore.
However, due to the money-consuming operations, unsustainable financial situation, etc.,
of the “autonomous management socialism” era, the industry ran up enormous debt. The excessive
number of employees and a lack of investment in replacing aging machinery had a direct effect on
declining production, and falling copper prices led to a decline in management. Revitalization plans
were drafted that included company production, organization and financial integration, etc., and in
September 2006, work started on the privatization of RTB Bor. With assistance from privatization,
the World Bank, etc., plans have been made that should help to reduce the large debt that had been
amassed, resolve pollution problems, and make reinvestments in equipment and machinery to
prevent environmental and other mine-related problems.
In addition, lead and zinc are being mined at the Rudnik, Lece, Grot, Veliki, Majdan, Suva
Ruda and elsewhere Mines, with total annual production of lead and zinc concentrate. Precious and
rare metals are recovered as by-products at base metal processing plants. Some slag actually contains
a higher grade of precious and/or rare metals than deposits in the mines. However, with the
exception of Rudnik which has already been privatized and is operating in the black, these mines,
like the abovementioned Bor, are either stalled in the privatization process, or are privatized but
dormant, because of difficulties in management. Only some mines started to prepare their reopening.
Coal is being mined in large open pits in the Kolubara and Kostolac coal regions. About
95% of this coal is destined for coal-burning power plants. Large-scale coal mines are currently
being revitalized, and the privatization process is not materialized yet. 99% of these mines belong to
the state-owned Electric Power of Serbia (EPS). Small- and medium-scale open pits, quarries, etc.,
are producing industrial materials, building materials, etc., and they are playing an important role in

10
the Serbian mining sector.
Because the Bor complex is located near the border with Romania and Bulgaria, it is also a
source of transborder pollution. In addition, like Bor, zinc and lead mines show signs of soil and
water contamination from heavy metals, and there is concern that tailings containing heavy metals
may be carried downstream. There is precedent: in 2001, part of the tailings dam at Velijki Majdan
ruptured, discharging liquid tailings downstream. Despite these problems, there is still no concerted
effort being made to address them.
The mining sector is still being managed with approaches from the old socialist era, but
mining policy, mining law, etc., are being reformed with support from the World Bank.
Table 2.2 Features and Current State of the Serbian Mining Industry Features Current State
• Possesses “full set” of technologies (exploration,
mining, dressing, smelting, manufacturing)
• All mines except Bor are small/medium scale
• Both underground and open-pit mines exist
• Mostly base metals are mined
• Mining methods, geological survey methods,
regulations, etc., remain from Socialism era
• Privatization is leading to the restructuring of all
mines and smelters
• There is still a sense of self-managed Socialism
• Technologies, equipment, etc., are aging
• The system will be made more economical
• Pollution is becoming more noticeable
2.4 Finances and Accounting
2.4.1 Serbian Accounting Standards and the Introduction of IAS
As a result of the implementation of the Accounting and Auditing Law in 2002, Serbian
accounting standards have begun adopting International Financial Reporting Standards (hereafter,
IFRS) and International Accounting Standards (hereafter, IAS). The 2002 law applies to all
corporations, companies, banks, financial institutions, insurance companies, brokerage houses, etc.,
regardless of their size. In addition, individuals who undertake economic activities for the purpose of
making a profit and who must file income tax returns are also subject to this law (Appendix I-1).
The 2006 Accounting and Auditing Law picks up where the old 2002 law left off. The new
law stipulates that corporations and individual business owners to whom Articles 15 and 24 apply
should record their transactions using accounting forms (designated by the Ministry of Finance) that
are completely compatible with IAS and IFRS. As a result, corporations and individual business
owners are required to do their accounting on unified forms designated by the Ministry of Finance or
the National Bank of Serbia (in the case of financial institutions) in an effort to fully adopt
international accounting standards (IAS, IFRS).
In addition, to enhance the implementation of international accounting standards, the
Chamber of Certified Auditors (hereafter, “Chamber”) has been recently established. The Chamber is
a public organization under the jurisdiction of the Minister of Finance that has been given important
duties related to the monitoring and dissemination of international accounting standards through
observations of accounting practices and by improving the quality of auditors through education,
training, and the issuing of licenses.

11
2.4.2 Overview of Accounting Standards
With the implementation of the Accounting and Auditing Law in 2006, Serbian accounting
standards are being given clearer guidelines for creating accounting statements that are in
accordance with IFRS and IAS. The following is an overview of these standards.
(1) Scope of Application of the 2006 Law
All corporations and sole proprietors are responsible for creating and reporting financial statements
based on international accounting standards. However, it would be more desirable if small
companies and sole proprietors could do this on a voluntary, rather than mandatory, basis (Article 2).
(2) Auditing
Article 37 stipulates that all medium- and large-scale companies which are subject to the
2006 Accounting and Auditing Law must undergo an audit in accordance with International Audit
Standards by an auditor having the same type of license as under the old law. In addition, companies
that are required to file a combined statement, and companies that issue stock, are also required to
undergo the same type of audit. Article 38 states that an auditor can express any of three opinions:
Positive, Negative, and Withheld. In the case of small companies and sole proprietors, financial
statements can be checked by the tax office (Article 37).
(3) Registration and Keeping of Financial Reports
Medium- and large-scale companies must register a financial report with the National
Bank of Serbia once a year. (In Article 31 of the old law, the registrar is referred to by the ambiguous
term of “the authority”). The accounting year in Serbia begins on January 1 and ends on December
31 of each calendar year. Annual reports must be submitted no later than February 28 of the
following year, the Auditor’s Opinion must be submitted by September 30, and combined financial
reports must be submitted no later than April 30 (Article 31).
Financial reports are handled as public information that can be viewed at any time during
that 20 years that it is stored by the National Bank of Serbia (Article 33).
2.4.3 Special Features of the Serbian Accounting Standards
Accounting standards in effect in Serbia include the 2006 Accounting and Auditing Law
which already includes provision for the application of international IAS and IFRS accounting
standards. There are no discrepancies between Serbian accounting and auditing standards and
international standards. However, in actual practice, the implementation of the 2006 law is in
accordance with the rules and bylaws of the Ministry of Finance (Article 15 designates the Account
Framework and official financial statement forms).
Incidentally, the biggest difference between accounting and auditing under the old socialist
system, and under the new laws implemented since 2002, appears to be that in the old system, fixed
assets were appraised only by book price and there was no use of the current (market) price appraisal
system (although fixed assets were reappraised in times of severe inflation). Under the socialist

12
economy, price controls and government-mandated prices were the norm, but these concepts are
almost non-existent in a market economy, so these differences might have arisen because there was
no concept of current market price of fixed assets in the socialist economy.
In addition, regarding the use of accounting standards, the National Bank of Serbia, which
receives financial statements and is responsible for their management, conducts the final monitoring
and evaluation. However, this central bank manages all the financial statements of all corporate and
single proprietor industries, not just financial institutions.
2.4.4 Accounting Standards and Issues with Financial Affairs
As stated earlier, Serbian accounting standards are mandated by the 2006 Accounting Law
to employ IFRS. Where there are still a few minor problems remaining, for all intents and purposes
the legal system has reached a level that is compatible with international standards. Thus, both the
system and legal framework of Serbian accounting standards conform to IFRS and IAS, and there
are no major discrepancies between Serbian and international accounting standards. However, in
actual practice it is possible that international standards are not being implemented exactly as
prescribed by the 2006 Accounting Law.
In the case of financial statements of mining companies, they are not publicly disclosed
because the mining industry is still being privatized. The Grot Mine, for example, only discloses its
balance sheet and profit-and-loss statements, and does not compile other financial statements at the
present time. At the Rudnik Mine, which has been privatized with Serbian capital, international
accounting standards (current Serbian standards) have only recently been introduced, and financial
statements are only now starting to be created.
2.5 Serbian Infrastructure
Serbian infrastructure is comparatively well-developed, and it is attractive to potential
investors in mining. The following is a basic description of the country’s roads, railways, river
transportation, electricity and electronic communications.
2.5.1 Roads
Serbian roads are categorized into primary roads, regional roads and local roads according
to the Road Law. In 2002, the total length of Serbian roads was 40,845km. Detailed data are shown
in Table 2.4.
Fig. 2.5 shows mainly the primary roads of the Serbian road network. This map does not include all
regional and local roads.

13
Fig.2.4 Primary Roads in Serbia
Approximately 40% of the length of the primary road network includes major
thoroughfares connecting Europe with the Middle East of 2,150km total length. In the 3rd Pan
European Transport Conference held in Helsinki, Finland in 1997, Corridor 10 was included in the
European road network. The length of the Corridor 10 network in Serbia is 800km.
2.5.2 Railways
Basic activities of the Serbian railway system include the carriage of passengers and goods,
hauling trains and cargo, maintenance of traction units, trains and rolling stock, track maintenance
and inspection, and inspection of permanent way and station structures, among others. The following

14
is a list of some basic facts about the Serbian railway network.
Line length: 3,808.7km
Electric line length: 1,196.051km
Main route length: 1,767.5km
Private sidings length: 772.6km
Tractive stock: 417
Passenger rolling stock: 797
Number of train cars: 4800
Annual carriage amount: 9.325 million tons (as of 2002)
Number of employees: 22,271
Using loans from EBRD and the European
Investment Bank, Serbian Railways will upgrade and
modernize freight rolling stock, particularly in the international
Corridor 10. This modernization will be able to increase the
capacity for goods transport and have a positive effect on
overall economic growth in Serbia.
Railways are also widely used by the Serbian mining industry to, for example, transport
concentrates from the Majdanpeck Mine to the smelting plant at RTB Bor, and to transport coal
produced at the Kolubara Mine to the generation plant. Fig.2.5 shows the Serbian railway network.
A platform in Belgrade Station.
Spur lines for cargos in Belgrade

15
Fig.2.5 Railway Network in Serbia
2.5.3 Waterway Transport
The Danube River is the backbone of the Serbian inland waterway system and is part of
the Rhine-Main-Danube system of the Trans-European inland waterway, which is the main inland
waterway system in Europe.
The Danube River, as a major river, is distinguished from all other systems by some
unique features. The Danube is not particularly noted for its natural properties, such as total length
of some 2,680km or catchment area of 817,000km2, but rather for its strategic and economic
position in Europe. This is the only river in the world which is fully navigable through ten

16
countries.
According to the available data, the currently used transport capacity of the entire Danube
River is only 10%, and even less than that in Serbia, especially after the NATO bombing and
destruction of bridges in Novi Sad in 1999. At that time, the international transport on the Danube
was virtually stopped, and the internal river transport was carried out under restricted and
dangerous conditions.
In the mining industry, products of US Steel are transported by inland waterways to
foreign countries.
2.5.4 Electricity
(1) Electric Conditions in Serbia
Administration of Electric Power: Department of Electric Power in MEM, which consists of
Analysis Division (5 staff) and Inspection Division (7 staff).
Ratio of Generation: 2/3 by lignite-fired thermal power and 1/3 by hydro power.
Total generation: 35~38GWh.
Supply/Demand Balance: shortage in winter (October to March), surplus in summer (April to
September). Annual supply is balanced with demand.
Electricity price: Price for family-use is different from industrial use. The price system is
complicated, but the average price is 4.72 euro cents/kwh.
• New generation plant: There is a plan to construct a new generation plant (two 700Mw) in
2012. Construction budget is 1,000euros/kwh.
(2) EPS (Serbian Public Electric Power Enterprise)
The EPS (“Public Electric Power Enterprise”), which was established on July 1st 2005, is a
100% -owned enterprise of the Serbian government, which appoints all board members.
The basic task of EPS is to meet all the electric power requirements of the economy and
people of Serbia. Supply and sales of electric power to almost 3.3 million people in Serbia are
carried out in the scope of electric power distribution activities of EPS.
EPS is the largest enterprise in Serbia with a total of 35,000 employees. The most current
figures (January 2007) show the total installed capacity of EPS’s power plants to be 8,355MW. It
consists of lignite-fired thermal power plants with a capacity of 5,171MW (62%), gas-fired and
liquid fuel-fired combined heat and power plants with a capacity of 253MW (4%) and hydro power
plants with a capacity of 2,831MW (34%).
EPS is the largest lignite producer in Serbia, with annual output of about 33.65 million
tons (as of 2004). EPS has two main coal mines, Kolubara and Kostolac, which are somewhat close
to thermal power plants. Kolubara produces 75% of all lignite and Kostolac produces the other 25%.
Lignite produced at the Kolubara mine is transported 30km by train to the Nikola Tesla Power Plant,
and lignite produced at Kostolac is consumed by the Kostolac Power Plant.

17
• In 2004, annual stripped waste was 67.73 million m3 in Kolubara and 22.72 million m3 in
Kostolac.
2.5.5 Telecommunications
(1) Fixed Telephones
• “Telekom Srbija” is the only public telecom operator that has a license for the public
landline telecommunication network and for providing public landline telecommunication
service. Since 2003, “Telekom Srbijahas” has been owned by two shareholders: Public
Company of PTT Traffic “Srbija” (80%) and OTE Greece (20%). In 2005, the number of
landline telephone users reached 2.53 million, accounting for about 37% of all Serbian
households.
(2) Mobile Telephone Service
Currently, about 90% of Serbia is covered by mobile telephone service. During 2006, RATEL
(Republic Telecommunication Agency) issued three 10-year licenses for public mobile
telecommunications networks and services, one each to Telekom Srbija, Telenor ASA and Mobilkom
Austria AG. In recent years, the number of mobile phone users has increased dramatically, reaching
5.5 million in 2005.
(3) Internet Service
Internet users have increased rapidly, reaching 756,675 in 2005. However 93.6% of
them use the old dial-up system, and there is still little use of other systems.
(4) Cable System
RATEL issued authorizations for distributing radio and television broadcasts via the cable
network in December 2006. In 2005, there were 540,000 subscribers to the cable system.
18
Chapter 3 Current State of the Mining Industry
3.1 Privatization
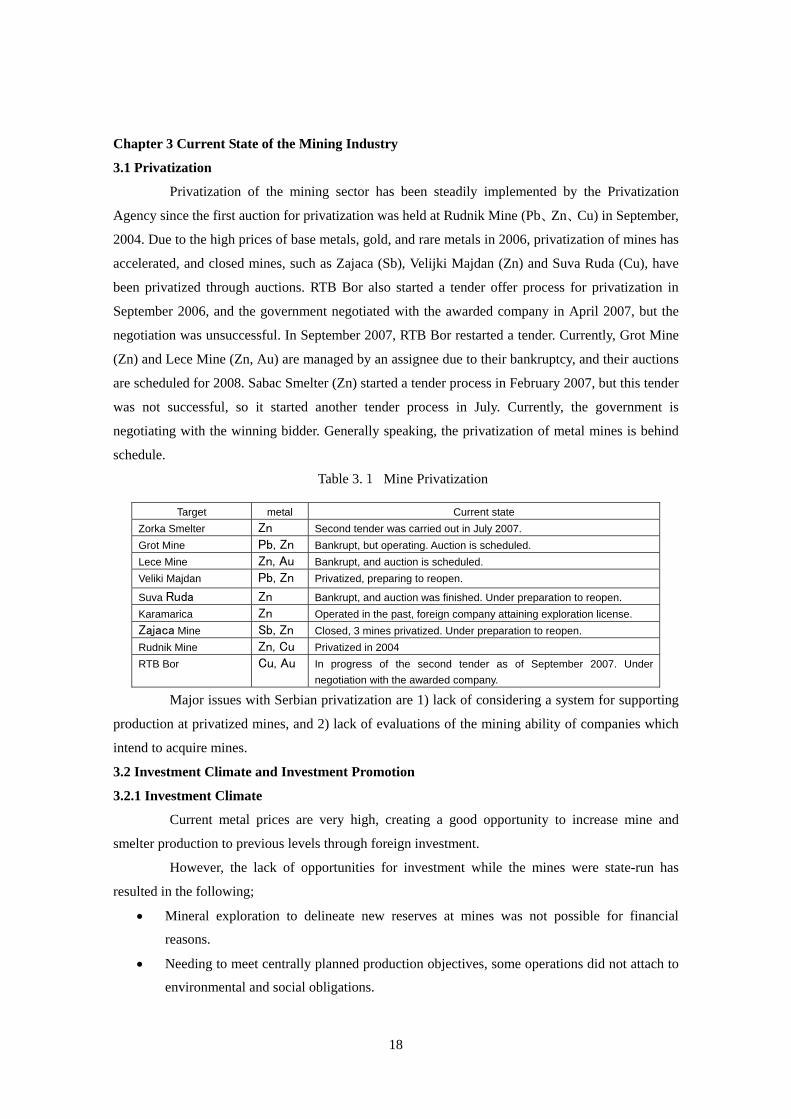
Privatization of the mining sector has been steadily implemented by the Privatization
Agency since the first auction for privatization was held at Rudnik Mine (Pb、Zn、Cu) in September,
2004. Due to the high prices of base metals, gold, and rare metals in 2006, privatization of mines has
accelerated, and closed mines, such as Zajaca (Sb), Velijki Majdan (Zn) and Suva Ruda (Cu), have
been privatized through auctions. RTB Bor also started a tender offer process for privatization in
September 2006, and the government negotiated with the awarded company in April 2007, but the
negotiation was unsuccessful. In September 2007, RTB Bor restarted a tender. Currently, Grot Mine
(Zn) and Lece Mine (Zn, Au) are managed by an assignee due to their bankruptcy, and their auctions
are scheduled for 2008. Sabac Smelter (Zn) started a tender process in February 2007, but this tender
was not successful, so it started another tender process in July. Currently, the government is
negotiating with the winning bidder. Generally speaking, the privatization of metal mines is behind
schedule.
Table 3.1 Mine Privatization
Major issues with Serbian privatization are 1) lack of considering a system for supporting
production at privatized mines, and 2) lack of evaluations of the mining ability of companies which
intend to acquire mines.
3.2 Investment Climate and Investment Promotion
3.2.1 Investment Climate
Current metal prices are very high, creating a good opportunity to increase mine and
smelter production to previous levels through foreign investment.
However, the lack of opportunities for investment while the mines were state-run has
resulted in the following;
• Mineral exploration to delineate new reserves at mines was not possible for financial
reasons.
• Needing to meet centrally planned production objectives, some operations did not attach to
environmental and social obligations.
Target metal Current state Zorka Smelter Zn Second tender was carried out in July 2007. Grot Mine Pb, Zn Bankrupt, but operating. Auction is scheduled. Lece Mine Zn, Au Bankrupt, and auction is scheduled. Veliki Majdan Pb, Zn Privatized, preparing to reopen.
Suva Ruda Zn Bankrupt, and auction was finished. Under preparation to reopen. Karamarica Zn Operated in the past, foreign company attaining exploration license. Zajaca Mine Sb, Zn Closed, 3 mines privatized. Under preparation to reopen. Rudnik Mine Zn, Cu Privatized in 2004 RTB Bor Cu, Au In progress of the second tender as of September 2007. Under
negotiation with the awarded company.

19
These factors, and also the age of some mines and smelters, appears to have lead to
unfavorable economic results and bankruptcies, due to the age of the infrastructure and equipment.
The legacy of environmental and social issues, uncertainty over ore reserves, and the resulting
inability to make meaningful estimates of return on investment, together with the significant costs of
upgrading equipment and processing plants, and the retraining of personnel in new techniques and
modern processes suitable for the market economy, have all contributed to the unattractiveness of
these operations to any investor. To create a privatization plan, an understanding of the current
investment climate and conditions within the sector are needed. To improve the investment climate
under the market economy, the following points are required;
• A commitment to implementing policy, legal, and fiscal reforms to reinforce
macroeconomic stability and contribute to sustainable growth.
• A thorough understanding of the geological resources, in order to maximize the benefits
derived from the country’s mineral resources, and compilation of data for investors.
• Review, evaluation, and prioritization of geological resources and mineral prospects to
determine those that favor growth.
• Policy, legal, regulatory, and sector fiscal regime need urgent reform. Currently this reform
is in first process. Up to two years may be needed before these reforms are debated and put
in place.
3.2.2 Analysis of Investment Climate
Investors are confused by the current legal and administrative structure in the mining
sector. At the present time, the legal framework in the sector is governed by the Mining Law of 1995
with amendments made in 2006, and the Law on Geological Exploration dating from 1995.
Regulatory control is a combined responsibility of the Ministry of Energy and Mines, the Ministry of
Agriculture (and water), and the Ministry of Environment.
In Serbia, minerals belong to the state. Current law requires that a Serbian legal entity
(company) applies for exploration and exploitation licenses through the Ministry of Energy and
Mines. The implication here is that foreign investors need to establish a Serbian registered business
(office or company). However, this is not always good for investment promotion. Serbia has no
mining regulations to support the 1995 legal framework for mining sector development. These are
the most serious issues, confronting investors with a lack of clarity and transparency, as well as the
burden of administration and inefficiency. These are all causes for concern at the risks involved in
investing in Serbia.
The main tasks faced by such investors can be summarized and categorized as follows:
(1) Political and Economic Stability
For investors, political and economic stability is important. Mining requires significant
initial investment of capital, and returns are earned over a long term. This requires that investors find

20
a regulatory regime that will remain stable throughout a project’s life.
(2) Legal
The confidence given by clarity of the law may be further improved by ensuring that the
implementation of the law is accompanied by transparency in all legal and regulatory transactions
between the investor and the government. The law should be there to encourage the investor,
and not to be used by government to impede the investment process.
(3) Concessions and Permits
General international practice allows investing companies the right to explore for and mine
all minerals found on a licensed property. The administration of all permits and concessions is today,
normally undertaken by a cadastral office and is based on an internationally agreed system of
geographical coordinates. Serbia needs to establish an office or organization to oversee this.
Once a permit is granted, the investing company must be assured of the security of their
tenure. In this respect, the new law should allow for permit holders to move from exploration to
mine development, and then to production, based on principles enshrined in law.
Applications for exploration rights should be handled on a first-come, first-served basis.
There should be no barrier to the transfer of rights, so long as such transfers are conducted in
accordance with the governing laws. For an investor to move from exploration to production, they
may need to introduce new partners, or even owners, and the rights of the original investors should
be transferable without barriers to new investors or lenders, so that projects may proceed to
completion.
(4) Geological Information
Serbia needs to provide better geological information to investors. Good practice today is
based on the provision of detailed 1:25,000 scale geological survey maps of a jurisdiction. 1:100,000
and 1:250,000 scale regional maps, and 1:1,000,000 scale national maps are also provided. One
Ministry should take sole responsibility for the planning, mapping, and distribution of all
geo-science data.
Another geological issue is the need for investors to obtain approval for technical
decisions on exploration techniques, the drilling patterns and disposition of drill holes on a
concession, and the drilling data to be processed and reported. It is vital to remove these hurdles by
giving investors the freedom to drill properties based on their own initial assumptions concerning the
appropriate level of investigation related to the potential and subsequent infill drilling based on
initial results, to reinforce the data.
3.2.3 Investment Promotion
Investment promotion is led by the SIEPA, with steady improvements the investment
climate. However, it should be noted that social tax and meal expenditures borne by the company are
regulated by labor laws, and are a significant expense for privatized companies. Debt and investment

21
in reconstruction of national companies is an requirement for investors. Also, it needs time to
recover production by the private sector. Therefore, there might be a negative impact on investment
promotion unless some exoneration is allowed while improvements are made to management and the
laws and regulations to meet the market economy.
For that purpose, it is necessary to identify unfavorable issues for investment promotion
and address them. In particular, national enterprises should not investment in staff and materials, as
competitiveness in the mining sector is comparatively low. It would be more effective to support
privatized mines in decreasing expenditures, which could be linked with investment promotion. It
would be difficult to achieve sustainable development without systematic improvements such as
revising mining laws and changing the organization of the sector, even if the government appeals the
use of Serbian resources and the reconstruction of privatized mines through international seminars.
Therefore, it is necessary to study systematically which governmental organization, the SIEPA or a
newly established tentative investment committee, should be in charge of improvements to the
investment climate. The SIEPA (or the committee) needs to identify the tasks for investment
promotion after privatization
3.2.4 Investment from Japan
Only one company invested in the Serbia is Japan Tobacco International (JTI). The JTI
opened a local office in 2001 and investigated the investment climate including marketing for
neighboring countries for 5 years. Based on the investigation result, the JTB bought and upgraded a
former national cigarette factory in May 2006, and also constructed a new factory with Japanese yen
17bln, and started production in March 2007. The JTB’s successful investment points in Serbia are
as follows;
• The investment climate in Serbia has become better year by year.
• Serbian people are high in quality as human resource, so production activity is possible
according to management.
• After risk analysis, strategy was made based on 5-year investigation of the investment
climate.
• Marketing targets are not only Serbia, but also neighboring countries.
A new cigarette factory was built to establish a full-scale production system.
3.3 World Bank and Internationally Supported Projects
3.3.1 World Bank Projects
The World Bank is supporting financial analysis of the reconstruction plans for RTB Bor
and relevant areas, finance for environmental protection, and measures for displaced workers.

22
This plan targets a significant reduction in production due to superannuated facilities and
machines, insufficient management and production systems, and lost markets, accumulated deficits
(US$ 500 million, as of 2004), contaminated environments, and socio-economic reconstruction of
the Bor area.
3.3.2 International Support
International support for the mining sector has been implemented mainly through the
World Bank. The World Bank addresses the privatization of RTB Bor, including investigation of and
solutions for environmental and social issues. It also addresses the revision of mining laws, and
formulation of mineral laws.
3.3.3 EU Fund
The EU Fund is called as IPA (Investment for Pre-accession Assistance), and Serbia has received it
to prepare joining the EU since 2001.The EU government has received annually 1.8 million Euros
every year from the EU. It is gratis in aid. Annual budget for projects is 5 to 20 million Euros per
project, and more than 10 projects have been selected by the Ministry of Finance. Outline of project
concept is submitted by each ministry, and is reviewed and investigated by the Ministry of Finance
and EU.
3.4 Mining Policy
A draft for the framework of a Mineral Policy was created by a Canadian mining
consultant (John Gamman Associates, Inc.) with World Bank support in May 2007.
Strategic points in the framework include the following:
• Creating a competitive business environment and attracting private sector participation.
• Fostering world-class environmental stewardship and oversight.
Ensuring mutual benefits between mining companies, local communities and residents.
3.5 Mining Administration
3.5.1 Ministry of Energy and Mines (MEM) and Ministry of Environmental Protection (MEP)
(1) MEM
Fig.3.1 The World Bank
The World Bank Project
Core Mines & Smelter Privatization (Sold)
Non - C
ore
Tailing Dam Monitoring Facility System
Environmental Damage
Ecological Environmental Survey
& Action Plan
Copper Research Facility
National Organization
Social Problems Economic Support
Manufacturing Factory & Company
Privatization (Sold)
World Bank Project
Output

23
Minister
State Secretary
Sector for Mining and Geology
Department for Study Analitical
Department for Mining and Geological Inspection
Sector for Oil and Gas
Sector for Electro Energetics
Sector for Public Enterprices
Secretariat
Group for International
Cabinet of the Minister
The MEM is responsible for the steady fulfillment
of mining regulations, and coordinates all mining activities
in the country, as shown in the new mining law
enacted in 1997. The principal purposes of the
MEM are; 1) to take charge of the production of
mining, energy, oil and natural gas; 2) to
implement detailed geological exploration
(excluding ground water), and create annual and
medium-term plans; 3) to take charge of the application
of laws, such as mining laws, geological exploration laws, and
energy laws. The total staff of the MEM is about 70 and its
organization is shown at the right. (2) MEP
Main services of the MEP are as follows;
• Establishment of systems concerning maintenance of natural resources and their continued
use, planning and research on programs concerning sustainable use of natural resources
• Establishment of plans for research and basic geological investigation of groundwater
resources, and establishment of standards for geologic map making
• Establishment of a system for environmental preservation and improvement
• Warning of environmental pollution accidents and environmental crisis management
• Ionizing and non-ionizing radiation protection
• Chemical substance management
• Waste management
• Control of fishing and hunting
• Management of the protection and conservation of nature in wildlife parks
• Integration with EC and intraregional cooperation with EU
• Environmental inspection and services for pollution control
(3) Geological Institute
The Geological Institute is a governmental organization which merged with the
“Geozavod” on September 1, 2006, as an independent institute that doesn't belong to any ministry.
The organization of the institute consists of six basic departments.
Department of Geology
Department of Mineral Exploration (metallic and non-metallic)
Department of Hydrogeology and Engineering Geology
Laboratory Department
Computer Data Processing
Fig.3.2 Organization of MEM

24
Drilling Department
There is a total of about 200 staff, including 120 geologists, geophysicists, and chemists. In
2006, the budget was 4 million euros. 86% of the work was done by domestic and overseas
companies and public organizations, and the remaining 14% was geological and exploration work by
the MEP.
(4) Mining Institute
The Mining Institute in Belgrade was established in 1960 by the government and a group
of mining companies with the purpose to create a leading organization designed to introduce the
newest methods and technologies to the Yugoslav mining industry, by means of extensive research
and transfer of knowledge and experience, and with a view to provide optimum safety at work and
environmental protection.
The activities and development of the Institute have been conducted in following two
principal trends;
(1) Research, fundamental and applied investigations in the field of technical,
technological and natural sciences being directly or indirectly related to the mining
industry and mining technologies.
(2) Design and process engineering enable the Institute to use and employ recent
technological solutions and to be permanently involved in resolving different kinds of
problems in the field of the mining industry in developing new mines, or
rehabilitating/updating existing mines.
The Institute operates as an independent enterprise, and was recognized as an institution
for research and investigation, based on the resolution issued by the ministry of Science and
Technology. It is provided with necessary specialists and staff, equipment and facilities.
(5) Reserves Verification Commission
The Reserves Verification Commission is a national organization whose purpose is to
verify mineral resource reserve reports submitted to the MEM by mining and exploration companies,
and to register the reserves with the government. Membership is determined by the Ministry of
Energy and Mines according to geological exploration laws.
• Commission meetings are held almost each month usually at least 10 commissions per year,
only Vojvodina commissions are held every 3-4 months.
• At each meeting, six or eight petroleum, coal, metal and nonmetal deposits are discussed.
Common deposit types are lead, zinc, marble, limestone, and building stone.
3.6 The Mining Law and Procedures for Mining Licenses
3.6.1 The Mining Law and Issues
Serbia has mining laws and geological exploration laws. The former were revised partially
(new mining laws) in April 2006 with World Bank support. There is no major difference between

25
these laws, except for the establishment of a Mining Agency and provision of royalties. There is no
procedure to transfer mining rights to third parties, nor a procedure to transfer rights through
privatization.The geological exploration laws define the conditions and methods for geological
exploration, payments for information provided to the MEM (5% of exploration costs), and reporting
on exploration results. Some national management of exploration still remains from the socialism era.
Both laws have barriers to free exploration and mining activities in a market economy, and need
basic amendments.
3.6.2 Acquisition of Mining Rights
The maximum area for exploration is 50km2 and exploration is permitted for one year.
After exploration results are submitted, and a new application excluding unpromising areas is
approved, another year is permitted for exploration. Exploration rights are thus basically
annual.Moreover, there are many issues, such as lack of disclosure of concession maps, overly
complicated procedures, and unclear exploration periods, which are barriers to promoting
exploration activities. It is thus necessary to establish an office or company to issue exploration
licenses.
To obtain exploitation licenses, it is necessary to calculate Category A, B or C1 reserves
after detailed exploration and to acquire a certification of reserves of mineral resources from the
Reserves Verification Commission. It is also necessary to get approval for the mining exploitation
project and to include measures to protect agriculture, forests, water, and the environment from the
relevant departments of the Ministry of Agriculture, Forestry, and Water Management and the MEP.
3.6.3 Procedures and Issues for Geological Exploration Rights
(1) Procedure for Acquiring Geological Exploration Rights
1) Procedure for Acquiring Rights
1. Inspection of the cadastral conditions of the proposed exploration area
2. Preparation of a geological exploration plan
3. Obtaining permission for geological exploration from related ministries and organizations
4. Technical review of the project by another licensed organization
5. Submission of a geological exploration plan
6. Approval of geological exploration rights
2) Issues
• Before applying to the MEM for a geological exploration license, a plan for the geological
exploration project should be prepared in detail. The applicant should obtain the permission
of the MEP, the Institute for Protection of Cultural Monuments, and municipal authorities.
The applicant can expect these procedures to take one year.
• In reality, it takes the MEM three or four months to investigate a project.
• After obtaining geological exploration rights, a mining rights holder should submit three

26
quarterly-reports and one annual report on the geological exploration results at each
licensed area for each year. The preparation of quarterly-reports imposes a burden on the
geologists of the project.
• Because geological exploration rights are non-transferable, exploration in Serbia is highly
risky for European and American subsidiary companies.
(2) Verification of Mineral Reserves and Acquisition of Certification of Mineral Resources
1. Notice of commencement on geological exploration work
2. Execution of detailed geological exploration
3. Preparation of reports on the geological exploration results
4. Technical review of the report on exploration results
5. Preparation of reserve studies of mineral resources
6. Submission of reports on reserve studies of mineral resources
7. Review of the reserve study
8. Oral explanation of the reserve study at the Commission for Verification of Reserves
9. Issuance of certification on reserves of mineral resources
(3) Acquisition of Mineral Exploitation Licenses
1. Preparation of plans for mining projects
2. Technical review of the mining exploitation project
3. Obtaining approval from the relevant ministries
4. Application for mineral exploitation licenses
5. Obtaining an exploitation license
(4) Obligations and Implementation of Mineral Resource Exploitation
1. Technical supervision, preparation, and maintenance of geological documents
2. Creation of an ore reserve table
3. Implementation of geological exploration and exploitation
4. Submission of a reserve study to the Reserves Verification Commission
5. Technical reviews of the reserve study
6. Oral explanation of the reserve study to the Reserves Verification Commission
7. Issuance of certification of reserves
(5) Issues
• Before obtaining a mineral exploitation license, the license holder shall acquire a certification
of reserves of mineral resources.
• The acquisition of a certification of reserves involves a lot of procedures, such as obtaining
the MEM’s approval and execution of a detailed geological project, reviewing a report of
exploration results by another licensed organization, and submitting geological and
exploration documents to the Reserves Verification Commission for examination. Thus,

27
exploration activity and evaluation of mineral reserves are under government control.
• Every 5 years, the license holder will prepare the above-mentioned documents, and submit
them to the MEM. The holder should be undertaking exploration activity, and reporting it to
the government.
The above matter imposes an undue burden on the license holder, so a simpler procedure
is needed.
3.6.4 Mining Law
There are not large differences between the old Mining Law and current Mining Law
revised in May 2006, except regulation of royalty rates and establishment of the Mining Agency. A
German consultant (Bergassesor Dipl-Ing) made a draft for the completely new Mining Law under
supports of the World Bank. This draft of the Mining Law will be provided to people related the
mining industry, revised based on their comments, and presented to the parliament after
authorization of the MEM and government to be acknowledged. It may be enacted March to May
2008, if all goes smoothly.
3.6.5 Compilation of Digital Spatial Datasets and Information Disclosure
In 2001, the MEM created a text-based mineral resource database and GIS spatial datasets
through a project supported by the Bureau of Geological and Mining Research, France (BRGM).
In 2002 a capacity building project was created by the United Nations Development Programme
(UNDP) to implement GIS software and training. Then, the MEM constructed a database for
information related to mining licensed areas, and has now started to manage GIS spatial datasets
such as mining license areas, mineral deposits and occurrences, abandoned mines and their reasons
for abandonment, tailing dam sites and infrastructural datasets through voluntary projects.
The present MEM website provides information, such as government announcements,
mining policies, mining laws and related regulations, taxes, organizations, a list of active
state/private companies. The content is revised and updated frequently and seems to show a
commitment to utilize the website effectively. On the other hand, some important information,
such as mining laws and related regulations are simply shown on the page without any instructions
for clients. Thus, it can be said that there is a lack of user’s perspective. Furthermore, there are no
spatial datasets, for instance geology or distribution of ore deposits. Although translation to
English is said to be in progress, and the frame windows for future English content are already
shown, progress seems to have stalled. The MEM-DGM developed a pilot system of web-GIS for
mining licensed areas and other spatial information. But due to a governmental budget shortage,
there was no web server installed, a lack of spatial datasets, need for coordinate conversion to the
WGS84 world standard coordinate system, and need for further development of additional web site
functions, that information has still not been made available on the Internet.
The MEP has fundamental databases for environmental monitoring and underground water

28
development. On the other hand, the MEP started a three–year project called “The Geological
Information System of Serbia”, or GEOLISS from 2004, to design a database structure for future
geological information, with financing of Euro 125,000, and faculty from the Mining and Geology
department at the University of Belgrade. Furthermore, the MEP started to forecast geology and
mineral resource potential areas, and to construct a database of mineral deposits and occurrences in a
five-year project (from 2006 to 2010) in cooperation with the faculty of the Mining and Geology
department at the University of Belgrade and the Geological Institute. Based on this, the MEP
plans to establish mid and long-term geological exploration strategies.
The Geological Institute has produced geological maps, hydro-geological maps, and other
maps with the scales from 1:50,000 to 1:2,000,000 in Serbian territory. Especially for 1:50,000
scale geological maps, the Geological Institute started to create GIS datasets based on the GEOLISS
database structure. However, the process of converting geological information to GIS datasets is
moving slowly at the present time, because of a lack of budget for field surveys, and there is some
dissatisfaction with the current situation.
The databases for “mineral deposits” and “mining districts” of Serbia which were
constructed by the Bureau of Geological and Mining Research, France (hereinafter, BRGM) and the
DMG in the MEM in 20021 were provided to the JICA Study Team from the BRGM. The content
is analyzed to pick up issues and things which shall be improved. The website for the DMG was
constructed, making a flow-chart of mining license application procedure, introducing the
international aid organizations’ activities and designing a download function for reports by this
research in English and Serbian language. A web-GIS database which is able to provide spatial
information such as a current mining license and mineral resource information, and geological maps
and satellite imagery, has developed, confiding the local consultant. The site is expected to be
opened until the end of January 2008. On the other hand, the results derived from the GEOLISS
and the related projects such as “a compilation of mineral resource information of mineral deposits
and occurrences” and “Metallogenetic and Minerallogenetic Geological Economic Estimation”, will
be a backbone for mineral resource information archive in Serbia, and their proceedings are
evaluated and considered on future usage approaches and are incorporated into the MP.
3.7 Mining Activities
3.7.1 Foreign Investor Activities
So far, 104 exploration licenses have been issued. About 90% of these are non-metallic,
and 10% are metallic. Gold exploration is being carried out by Canadian companies Ivanhoe and
Dundee. Rio Tinto is exploring for borate. The targets of Phelps Dodge are gold and copper.
Non-metallic targets, which include groundwater, limestone, and quarrying, can be exploited on a
small scale, so they are mined actively and mainly by Serbian companies. However, metallic
exploration demands greater investments of capital and time, requiring foreign investors. But

29
currently there are not many foreign investors in Serbia.
3.7.2 Current Status of Mining Concessions
A list of mining concessions has not been made available. However, companies
implementing detailed geological investigations in 2006, based on MEM data.
• A total of 104 companies conducted detailed geological investigations. These
investigations were: 46 water (mineral water), 24 limestone, 14 quarry, 8 brick, 5 gold
(silver and copper), 2 lead & zinc, one iron, one boron, 2 oil, one clay.
• The 5 companies that investigated gold were: Balkan Mineral Exploration, CMR Balkan,
Dundee Precious Metals, South European Exploration, and South Danube Metals.
• The Grot and Suva Ruda mines were the two companies that investigated lead & zinc.
• Metalfeer investigated iron.
3.7.3 Metal Deposit Exploration Activity
Exploration activity is mainly conducted by Canadain, USA, and UK exploration and
mining companies that are prospecting epithermal gold deposits.
• Hereward Venture (Target: Gold)
• Dundee Precious Metals (Target: epithermal gold), a Canadian junior company
• Dinara Nickel (Target: Nickel), a subsidiary of London-based Europe Nickel.
• South Danube Metals (Target: Gold and Copper), a subsidiary of Canadian junior
company, Euromax Resources
• Rio Save Exploration (Target: Boron)
• South European Exploration (Target: Epithermal Gold), a subsidiary of Canadian junior
company, Reservoir Capital.
3.7.4 Mining Activity in Regions and Provinces (the Vojvodina Autonomous Region)
The Vojvodina Autonomous Region is potential area for oil and coal, and also it has their
production activities. In addition, there are mining activities of limestone and quarries, so the
regional government has the Mineral Resources Department which employs experts including
geological engineer and others as its staffs. Mining activities are managed under the current Mining
Law and environmental related laws in close relationship between the central and regional
governments.
3.7.5 Medium-Term Mine Plans
There are neither long-term plans nor reconstruction plans for medium/small mines, with
the exception of RTB Bor. RTB Bor created a 20-year long-term plan in 1999, and a 6-year
medium-term plan for the Veliki Krivelj Mine in 1999. Majdanpek created a 14-year long-term plan
in 1999, and revised it in 2004 and again in 2006. In these plans, annual investment, profitability,
and improvements to production are discussed, based on a production schedule and financial
analysis. However, the plans to reconstruct RTB Bor were unrealistic, resulting in deviation between

30
the plan and the implementation due to shortage of funds. Medium/small mines have concentrated
on immediate management, because their production dropped due to post-1990s internal conflicts.
They have not been able to afford to prepare long/medium plans. Also, mine management based on a
self-managed model has not harmonized with the market economy, and there is lack of staff to create
plans. 3.7.6 Mining Technology
Mines and institutes have not invested in developing mining technology due to domestic
confusion and the battered post-1990s economy. Serbia has full basic technologies, including
exploration, mining, ore-processing, and smelting. However, the specific technologies that form
the mining industry have not advanced efficiently due to socialist-era mine management. For
example, the transportation systems from mines to ore-processing facilities are inefficient because
the corresponding equipment has different capacities. It is indispensable for each mine and smelter
after privatization to study an effective production system as well as renovation of facilities and
machines.
3.8 Geology and Mineral Potential in Serbia
3.8.1 Geology of Serbia and Southeastern Europe
The geology of Southeastern Europe is composed of the Variscan shield in Meso-Europe
in the European tectonic province, the Alpine orogenic belt in Neo-Europe, and sedimentary basins.
The major physical divisions of Serbia include the mountainous Carpathians, Balkanides, Dinarides,
and Hellenides of the Alpine orogenic belt, and the Pannonian Basin.
The Carpathians and Balkanides cover eastern Serbia. They are mainly composed of Late
Paleozoic and Mesozoic sedimentary rocks underlain by Precambrian – Early Paleozoic
metamorphic and granitic rocks. Intermediate and acidic volcanic activities are known to have
occurred in this area during the Late Cretaceous and Paleogene periods. The Dinarides and
Hellenides are widely distributed in western and southern Serbia. They are composed of
Precambrian metamorphic rocks, Paleozoic sedimentary rocks, and Mesozoic sedimentary and
volcanic rocks. These orogenic belts are characterized by ophiolite formations composed of
volcanics and ultra-basic rocks of the Jurassic to Early-Cretaceous periods. The Pannonian Basin
covers northern Serbia, Hungary, and Romania, and it consists of Late Neogene sediments.
3.8.2 Metallogenic Province of Serbia
Serbia has high potential for metal resources in Europe, and various types of deposits have
formed through various geological ages. The metallogenic provinces of Serbia from east to west are
divided into the Dacian, Carpatho-Balkanian, Serbo-Macedonian and Dinaric provinces.

31
Table 3.2 Ore Deposits and Metallogenesis in Serbia
Detailed information on each metallogenic province in Serbia is from Jankovic et al.
(2003). The Carpatho-Balkanian metallogenic province is composed of the Ridanj-Krepoljin zone
(Fe, Pb, Zn, Cu), Neresnica-Bbeljanica metallogenic zone (Fe, Mn, Au, W), Bor metallogenic zone
(Cu, Mo, Au, Pb, Zn), Porec-Stara Planina metallogenic zone (Fe, Au, Cr), and Stara Planina district
(U, Au). The Bor metallogenic zone, which is also called the Timok magmatic complex zone, is a
typical mineralized zone in Serbia.
The Serbo-Macedonian metallogenic province consists of the Sumadija metallogenic zone
(Pb, Zn, U, Ni), Kopaonik metallogenic zone (Pb, Zn, Ag), Lece-Halkidik zone (Pb, Zn, Au, Ag, Cu),
Besna Kobila –Osogovo zone (Pb, Zn, Mo, U), Golija district (Pb, Zn), Boranja district (Sb, Pb, Zn,
Cu), Lajkovaca district (Cu), Cer district (W, Sn), Fruska Gora district (Ni, Pb, Zn), Maljen district
(Ni), and Drenica district (Ni). This metallogenic province contains the most important antimony,
and lead and zinc mineralized zones in Serbia.
The Dinaric metallogenic province is composed of the Zlatibor (Ni, Cr), Srednje Polimlje
(Cu), Orahovac (Cr) and Djakovica (Cr) districts.
3.8.3 Mineral Potential in Serbia Since 2006, the Serbian government has implemented the “Strategy for Sustainable
Development of Mineral Resources in Serbia” project with support from EBRD. The final report,
will include information on future strategies for mineral resource development and the latest data on
mineral reserves and resources. Draft data from the report are shown in Table 3.3. The data is based
on results of survey and exploration works, but it does not include grass route prospecting projects.
Geological reserves and potential resources of copper ore in Serbia amount to 2,467
million tons and 528 million tons, respectively. Metallic copper in geological reserves and potential
resources amounts to 9.4 million tons and 8.1 million tons, respectively. Almost all of this copper is
in the Timok magmatic complex, which includes Bor, Veliki Krivelj, and Majdanpek. Copper
deposits in the Timok magmatic complex are accompanied by 154 tons of gold as geological
reserves. Geological reserves and potential resources of lead and zinc ore amount to 105 million tons
Geochronology Age (Ma) Major metals Type Magma complex Tectonic environmentNeogene 30 - 5 Pb-Zn Skarn Granodiorite Regional fracture zone
Sb Hydrothermal Volcanic - intrusive complexCu, Mo Porphyry
100 - 50 Cu, Mo, Porphyry Volcanic - intrusive complex Global riftPb-Zn, Fe Vein, skarn
Jurassic 170 - 150 Cu Massive Ophiolite complex Oceanic crustCr, Ni Magmatic
Middle Jurassic 220 - 200 Zn, Cu Massive Basaltic magma GravenMn StratiformPb, Zn, Cu Hydrothermal
Carboniferous to Permian 350 - 250 W, Au Skarn Granitic complex Orogeny?U, Fe Hydrothermal
Devonian 400 Fe, Mn Volcano- Rifting?sedimentary
Cretaceous to Paleogene

32
and 46 million tons, respectively. Lead and zinc metals in minable reserves amount to 650,000 tons
and 490,000 tons. Lead and zinc metals of potential resources amount to 2.05 million tons and 2.75
million tons. Geological reserves from Kosovo correspond to 88 million tons. In Serbia, almost all of
the 2,940 tons of silver occurs in lead and zinc deposits.
Table 3.3 Ore Reserves and Potential in Serbia
Table 3.4 Mineral Potential and Explored Areas
Comment
Ore Metal Ore Metal Ore MetalMt Mt Mt Mt Mt Mt Mt
Cu (whole Serbia) 2,467 1,090 4.2 1,377 5.2 528 8.1Cu (Timok magmatic complex) 1,088 4.145 1,367 5.195 470 0.39% Cu 0.14 g/t Au (as of 31.12.2006) Au (by-product) Au 153 t Au 1 t Au 50t Ag (by-product) Ag 1,120 tCu (ophiolite melange) 1.89 9.78 58 (as of 31.12.1993)Cu (Leckom volcanic complex) 150 (as of 31.12.1994)
Pb-Zn (whole Serbia) 105.03 16.27 Pb 0.65 2.69 46.17 4% Pb 3% Zn (as of 31.12.2005)Zn 0.49
Pb-Zn (Kosovo) 88.07 31.26 Pb 1.27 27 4.05% Pb 3.03% Zn (as of 31.12.2005)Zn 0.95
Ag (by-product, whole Serbia) Ag 2,940 t Ag (by-product, Kosovo) Ag 1,920 t Cd (by-product, whole Serbia) Cd 110 t
Fe (whole Serbia) 119.39 3.97 1.49 115.42 27 52.6
Cr (whole Serbia) 0.089 0.014 0.1 0.02 20% Cr2O3 (as of 31.12.1993)
Ni-Co (whole Serbia) 38.65 19.92 Ni 1.49 18.73 Ni 27 Co 0.011
Ni-Co (Starog) 8 Ni 0.064 Ni-Co (Kopaonic) 30 Ni 0.345
Co 0.015 Ni-Co (Sumadijski) 3 Ni 0.045
Mo (whole Serbia) 1,115 1,115 0.035 1,645 0.249Mo (porphyry copper) 1,090 0.012 1,500 0.126 0.0011% Mo (as of 31.12.2006)Mo (Mackatica) 25.16 0.023 145 0.123 0.09% Mo (as of 31.12.1993)
W (whole Serbia) 0.33 0.33 700 t 1,000 t 0.24% W ? (as of 31.12.1993)
Sn (whole Serbia) 500 t
Sb (whole Serbia) 4.198 0.978 0.015 3.22 As 0.012 3.1 0.03 1.53% Sb (as of 31.12.1993)
Al (whole Serbia) 3.89 2.69 0.69 1.2 19.9 4.2 48% Al2O3 (as of 31.12.1998)Al (Kosovo) 1.66 0.43
U (whole Serbia) 3.654 2.154 727 t 1.5 7 1,000 t 337g/t U3O8 ? (as of 31.12.1993)
Commodities
Non-minable reserves(Non-balanced
reserves)
(after MEM and MEP 2007)
Potential resourcesGrade
Minable reserves(Balanced reserves)Geological reserves
No Zone Commodity Deposit Type Main Deposit Exploration ActivityCu Porphyry Veliki Krivelj, Majdanpek Coka Kurga (DPM)Cu, Au Porphyry Brestovac-Durian Potok (SDM)Cu, Au Volcanic Massive Sulfide Bor, Borska Reka Brestovac (SEE)
2 Ridanj-Krepoljin zone Pb-Zn Skarn, vein Ridanj Au: Rakita (SEE)Pb-Zn Skarn Blagodat Karamanica (Bosilmetal)Mo Porphyry Mackatica Surdulica (DPM)Cu, Au Epithermal vein Lece Ivan Kula (DPM-Ivanhoe)Au, Pb-Zn Epithermal vein Lece (SEE)
5 Sumadia metallogenic zone Pb-Zn Skarn Rudnik (DPM)Pb-Zn Vein, stockwork Kizevak, Stari Trg Rudnitze North (SDM)Cu, Au Porphyry Rudnitze (SDM), Plavkovo (SEE)Sb Hydrothermal ZajacaAu Hydrothermal Zajaca (SEE)Pb-Zn Volcanic Velijki Majdan
DPM: Dundee Precious MetalsSEE: South European Exploration, a subsidiary of Reservoir CapitalSDM: South Danube Metals, a subsidiary of Euromax Resources
Boranja-Lajkovaca zone7
4 Lece Halkidik zone
6 Kopaonic metallogenic zone
3 Besna Kobila Osogovo zone
Bor metallogenic zone1

33
Among the above mineral
commodities, copper, lead, zinc, gold
and antimony are particularly
important in Serbia. Western Junior
companies have a great understanding
of the high potential of mineral
resources in Serbia, and they have
implemented exploration activity
including geophysical and geochemical
surveys and drilling work around
operating mines and old mining sectors.
Mineral potential areas in Serbia are
shown in Table 3.4 and Fig.3.3
including the above-mentioned
exploration activity.
Fig.3.3 Mineral Potential and Explored Areas in Serbia
3.9 Current State and Tasks of Mining Activities
3.9.1 Geology of the Bor Metallogenic Zone
This zone is located in the Carpatho-Balkanian metallogenic province. The Timok magmatic
complex of the Late Cretaceous period is widely distributed in this zone, and contains important
Serbian copper deposits. The Timok magmatic complex covers an area of 80km from north to south
and 20km from east to west. Ninety percent of the magmatic complex is composed of pyroclastic
rocks, and two main volcanic events are recognized. In the Timok magmatic complex, porphyry
copper deposits and massive replacement deposits occur along a mineralization zone covering an
area of 50km from north to south and 5km from east to west. Mineralization is assumed to have
occurred as volcanic dykes intruded along the rift. Ore deposits in the metallogenic zone are
genetically related to faults oriented NNW-SSE, with post-mineralization faults trending E-W. The
Bor segment of the major fault runs 30-40km toward the northwest. The Krivelj fault runs on the
east side parallel to the Bor fault. The fault is a reverse fault, dipping 60゜- 70゜west. The

34
Majdanpek deposit of porphyry copper is situated along the northwest extension of these faults.
3.9.2 Ore Deposits
(1) Porphyry Copper Deposits
a) Veliki Krivelj
The deposit is located 7km north of Bor city. A porphyry copper deposit is situated in
fracture-developed zones which trend NE-SW and NW-SE in andesite and quartz diorite porphyry.
The deposit is distributed in an oval shape that has a NW-SE orientation. The scale of the deposit is
800m along the NW-SE axis, 400m along the NE-SW axis, with a vertical extension of 1,000m or
more. Mineralization of 0.55% Cu until 492m below sea level has been confirmed by the deepest
drill hole. The bottom of the orebody has not been confirmed.
Most of the copper grades 0.3-0.4%, with high-grade copper tending to occur in the central
and peripheral parts. Hydrothermal alteration shows zoning of biotite, sericite, argillized, and
silicified zones from the center to the periphery. Ore minerals are mainly chalcopyrite and pyrite.
b) Majdanpek
The ore deposit is located 60km north-northwest of Bor city. The deposit is situated in the
northern end of the Timok magmatic complex. The deposit has high gold mineralization compared
with other porphyry deposits in the complex.
The area is composed of metamorphic rocks-- mica schist, phyllite, gneiss and marble of
the Paleozoic era-- and conglomerate, sandstone and limestone of the Jurassic era. These rocks are
part of an intruded igneous complex that consists of andesite, tuff, dacite, diorite and quartz diorite.
A porphyry copper deposit was formed in a fracture zone 300m to 600m wide, trending north-south,
when andesite and quartz diorite intruded as stock in gneiss and schist.
The deposit is divided into north and south pits. The south pit is oval shaped, running
2.5km north to south and 1.6km east to west. The top of the pit is 580m above sea level, and the
bottom of the pit is 120m asl. The dimensions of the ore deposit are 800m north to south, 100-300m
east to west, and 1,000m or more in vertical extension.
The north pit is also oval shaped, running 1.9km north to south and 1.1km east to west.
The top of the pit is 670m above sea level, and the bottom of the pit is 360m asl. The dimensions of
the ore deposit are 400m north to south, 60-70m east to west, and 1,000m or more in vertical
extension. Drilling prospects have confirmed that mineralization continues at least 100m below sea
level. Replacement polymetal deposits (Cu, Pb, Zn) of the Tenka I and Tenka II deposits and satellite
deposits of the Dolovi I, Dolovi II, and S. Dusan deposits occur in the northwestern side of the north
pit. Ore minerals are mainly composed of chalcopyrite with bornite, tetrahedrite and molybdenite.
(2) Massive Hydrothermal Deposit
a) Bor
Andesite and pyroclastic rocks of the Late Cretaceous to Tertiary eras cover the area

35
around the deposit. Country rock in the deposit is porphyrytic andesite. The deposit occurs in an area
5km long by 1km wide. The Bor deposit is a volcanic massive copper sulfide deposit that occurs
from the surface (about 400m asl) to 800m in depth, and changes into a porphyry copper deposit in
the deeper part. By the Bor fault, the deposit is limited to the western side of the fault.
Non-mineralized conglomerate is distributed on the eastern side of the fault, corresponding to the
footwall side (Fig.3.4 and Fig.3.5).
Fig.3.4 Geological Map of the Bor Deposits Fig.3.5Vertical Projection of the Bor Deposits
The deposit is divided into the northwestern, central, and southeastern bodies. The most
important orebody was the central body, but it has already been mined out. The orebodies occur in
andesite which has been subjected to intensely argillized alteration. Ore is commonly massive, and
sections of ore are disseminated and stockwork. At one time there were 25 orebodies, but most of
them have been mined. Currently orebodies occur in the Brezonik, Tilva Ros (lower part of the Bor
open pit), and P2A areas. Ore minerals are dominantly composed of pyrite, with chalcopyrite,
energite, bornite, chalcocite and covellite. The copper grade of the ore ranges from 1 to 2%.
3.9.3 Reserves
The Bor mine started operations in 1902; since then it has produced 200 million tons of copper ore
with 1.5% Cu and 3.2g/t Au, and 3 million tons of copper metal. The Veliki Krivelj mine stared
operation in 1982; since then, it has produced 150 million tons of copper ore with 0.3% Cu and
0.1g/t Au, and 450 thousand tons of copper metal. The Majdanpek mine started operation in 1961;
since then, it has produced 359 million tons of copper ore with 0.44% Cu and 0.2g/t Au, 1.6 million
tons of copper and 83 tons of gold. Table 3.5 summarizes the geological reserves1 and exploitable
reserves of each ore deposit collected from RTB Bor. The Veliki Krivelj deposit has 560 million tons
of reserves, but reserves that can be exploited with the current pit design amount to 152 million tons.
The Borska Reka deposit, which is the target for the next exploitation, has 556 million tons of
reserves, but currently exploitable reserves amount to 142 million tons. Total ore reserves of RTB
1 “Geological Reserves” in Serbian terminology corresponds to ore reserves.

36
Class Category Category Ore Cu grade Au grade Copper Gold Cutoff % Cu(Western) (Serbian) thousand t % g/t thousand t t
Geological reserves Proven A+B+C1 560,460 0.34 0.07 1,858 38.1 0.2Minable reserves Proven A+B+C1 465,150 0.34 0.07 1,512 31.6 0.2Exploitation reserves Proven A+B+C1 152,739 0.35 0.07 514 10.4 0.2Geological reserves Proven B 1,972 1.28 0.27 25 0.5 0.4Minable reserves Proven B 1,495 1.31 0.26 20 0.4 0.4Exploitation reserves Proven B 1,023 1.21 0.26 12 0.3 0.4Geological reserves Proven B 3,890 0.76 0.13 29 0.5 0.4Minable reserves Proven B 2,903 0.86 0.14 25 0.4 0.5Exploitation reserves Proven B 991 0.81 0.17 8 0.2 0.5Geological reserves Proven B 8,509 0.71 0.33 60 2.8 0.4Minable reserves Proven B 2,865 0.89 0.32 25 0.9 0.6Exploitation reserves Proven B 1,776 0.83 0.46 15 0.8 0.6Geological reserves Proven A+B+C1 556,911 0.57 0.21 3,151 114.6 0.3Geological reserves Probable C2 450,922 0.49 0.11 2,223 49.4 0.3Minable reserves Proven A+B+C1 319,969 0.50 0.20 1,601 65.2 0.3Exploitation reserves Proven A+B+C1 142,159 0.53 0.23 752 32.6 0.3
Cementario 2 Geological reserves ? 26,580 0.31 0.07 82 1.9 ?Cementario 3 Geological reserves ? 9,144 0.33 0.07 30 0.6 ?Cementario 4 Geological reserves ? 4,028 0.28 0.07 11 0.3 ?Cerovo Primami Geological reserves ? 238,359 0.38 0.07 906 16.7 ?Drenovo Geological reserves ? 45,778 0.28 0.06 128 2.8 ?Kraku Bukaresku Geological reserves ? 1,600 0.62 0.62 10 1.0 ?Total 325,489 0.36 0.07 1,168 23.3
Geological reserves Proven A+B+C1 409,171 0.34 0.18 1,344 72.2 0.2Minable reserves Proven A+B+C1 246,083 0.36 0.19 882 46.7 0.2Exploitation reserves Proven A+B+C1 98,757 0.40 0.23 391 22.5 0.2
North pit Geological reserves 210,658 0.32 0.25 678 52.9 ?Geological reserves Proven B+C1 271 2.04 5.34 6 1.4 ?Minable reserves Proven B+C1 221 2.16 5.91 5 1.3 ?Geological reserves 2,527,982 0.42 0.14 10,537 354.3Exploitation reserves 397,445 0.43 0.17 1,693 66.7
(Source: RTB Bor)
Total
South pitMajdanpek
Veliki Krivelj
Brezanik
OrebodyOre deposit
Coka Marin
P2A
Borska Reka
Bor Underground
Cerovo
Tilva Ros
Bor amount to 2.5 billion tons, but only about 397 million tons, or 15% of these, are exploitable
reserves.
Table 3.5 List of Reserves in RTB Bor
3.9.4 Deposit Potential
To maintain a balance between ore reserves and exploitable reserves at the Veliki Krivelj
deposit, 410 million tons will be the future target reserve after open pit mining. However, reserves
will need to be recalculated in consideration of economic aspects. Satellite orebodies of polymetal
occur around the north pit of the Majdanpek deposit. Combined with the central orebody, there are
210 million tons of ore reserves. In the north pit, exploitable reserves have not been calculated due to
insufficient development. There should be more exploration around satellite orebodies. Drilling of
the lower extension of the Borska Reka orebody has confirmed mineralization down to 900m below
sea level. Therefore, ore reserves between -500m and -900m amount to 450 million tons with 0.49%
Cu and 0.11g/t Au as Category C2 reserves. It is future issue whether there is the economic
feasibility of deep mining or not.
3.9.5 Issues
As described in the section on reserves, the total ore reserves of RTB Bor amount to 2.5
billion tons, but there are only 397 million tons of exploitable reserves, which represents only 15 %
of the total. It is not advisable to evaluate ore deposits based only on reserve figures.
3.10 Geology and Deposits of the Veliki Majdan Mine
3.10.1 Geology and Deposits
In this area, there are a number of lead and zinc deposits and important Serbian lead and
zinc mines and smelters. Around the Veliki Majdan deposit, antimony and lead & zinc deposits occur

37
widely in association with Tertiary granodiorite. One deposit is a small-scale lead and zinc deposit
which formed in the boundaries between limestone and schist of the Triassic period, and andesite to
dacite intrusives of the Tertiary period. Another deposit is a massive skarn type that occurs in
pipe-like and irregular shapes. The deposit, which consists of small orebodies, is 10m to 15m long
and 1m to 3m wide. The horizontal area of orebodies ranges from 20 m2 to 200 m2. Due to the skarn,
the boundaries between deposits and country rock are clear. Ore grade shows 1 – 20% Pb and 1 –
20% Zn. Ore minerals are chiefly composed of pyrite, galena and sphalerite.
3.10.2 Reserves
The Veliki Majdan mine, which started operation in 1952, produced 1.8 million tons of
crude ore consisting of 4.50% Pb and 3.71% Zn, which yielded 82,000 tons of lead and 67,000 tons
of zinc (according to the mine data). Ore reserves in December 31, 1987, which is the latest data
kept for the mine, amounted to 113,000 tons with 6.14% Pb, 4.64% Zn and 188g/t Ag in A+B+ C1
category. Probable resources are presumed to amount to between 65,000 and 70,000 tons.
3.10.3 Issues
Though there are underground maps, underground geological maps, and assay maps, there are
no large-scale geological maps, so it is not possible to clarify the limits of mineralization and to
analyze the formation of deposits. Therefore, the potential of reserves cannot be determined. The
density of underground drilling prospects is quite high, but there is enough in only 30 % to 50 % of
the total length of prospects. The mine has implemented drilling work because the interval of drilling
prospects is regulated due to the Serbian reserve calculation. Although the lower parts, under
280asl, of the Rudevac orebody in the east and the Lipnik orebody in the west have not been
explored, potential areas are indicated due to the lack of geological maps. There is no clear basis for
calculating presumed resources.
3.11 Geology and Deposits of the Zajaca Mine
3.11.1 Geology and Deposits
The Zajaca mine is located in the Boranja ore field. Important antimony deposits are
distributed in this district, including at Zajaca, covering an area 15 – 20km from east to west and 4 –
5km from north to south. A great deal of antimony was produced in this district during the former
Yugoslavia era. The Boranja ore field is composed of schist, sandstone, limestone of the Late
Paleozoic era (Carboniferous to Permian period), and schist and limestone of the Triassic to Jurassic
periods of the Mesozoic era. Boranja granodiorite, andesite, and dacite of the Tertiary are intruded
(Fig.3.6).
Mineral deposits in the Boranja ore field are distributed in zones around the Boranja
granodiorite and are composed of skarn-type iron deposits, skarn-type lead-zinc deposits,
hydrothermal lead-zinc deposits, hydrothermal antimony, and metasomatic fluorite deposits (Fig.
3.7).

38
Fig 3.6 Geological Map of the Boranja Ore Field
Fig 3.7 Zones of Mineral Deposits
of the Boranja Ore Field
The Zajaca deposit is a stratiform
and lenticular antimony disseminated
orebody (sulfide and oxide ores) which
formed along the boundaries between
limestone and schist of the Carboniferous
period (Fig.3.8). The deposits are associated
with a stratiform epithermal antimony vein,
in which the country rock is jasperoid.
Fig.3.8 Geological Profile of the Turin Orebody at Zavorje Mine
Main ore minerals are composed of stibnite and pyrite, and observed valentinite (Sb2O3)
and senarmontite (Sb2O3) that the stibunite is oxidized to. It is associated with chalcopyrite and

39
galena. Calcite consists mainly of gangue minerals with quartz. Quartz veinlets and silicification and
carbonatization occur in footwall limestone. Empirical evidence shows that antimony ore occurs
around those alterations.
3.11.2 Prospecting
Prospecting was implemented in basic order of surface drilling, underground tunnel (adit,
drift and sub-level drift). Surface drilling was carried out in dense intervals ranging from 20m to
60m, due to the small ore body size. Currently, preparations are being made to reopen an adit, and to
do a drift exploration by scraper, because the Turin orebody at the Zavorje deposit is currently an
object of exploration.
3.11.3 Reserves
The Zajaca mine started operation in 1890. Over the next 100 years, it produced 90,000
tons of antimony metal with average grade of 2.5% Sb.
According to data from the mine, the total proven reserves of categories A+B+C amount to
967,000 tons with 1.55% Sb, and mineral resources (Category C2) amount to 700,000 tons with
0.97% Sb (Tables 3.6 and 3.7). Within the total proven reserves of 967,000 tons, 51 percent (500,000
tons) is Category C1, so drift exploration will be needed to confirm exploitation of the Category C1
ore.
Table 3.6 Reserves at the Zajaca Mine
Class Category Category Reserves Sb grade Sb(Western) (Serbian) t % t
Geological reserves Proven A - - -Geological reserves Proven B 1,590 3.75 60Geological reserves Proven C1 57,910 1.49 863
A+B+C1 59,500 1.55 922Geological reserves Proven A - - -Geological reserves Proven B 2,517 2.28 57Geological reserves Proven C1 21,372 1.82 389
A+B+C1 23,889 1.87 446Geological reserves Proven A 4,628 2.89 134Geological reserves Proven B - - -Geological reserves Proven C1 23,083 1.22 282
A+B+C1 27,711 1.50 415Geological reserves Proven A 3,725 1.90 71Geological reserves Proven B 13,715 2.85 391Geological reserves Proven C1 37,925 1.70 645
A+B+C1 55,365 2.00 1,106Geological reserves Proven A - - -Geological reserves Proven B 4,510 2.82 127Geological reserves Proven C1 19,087 2.44 466
A+B+C1 23,597 2.51 593Geological reserves Proven A 112,396 2.33 2,619Geological reserves Proven B 325,179 2.00 6,504Geological reserves Proven C1 337,781 0.71 2,398
A+B+C1 775,356 1.49 11,521Geological reserves Proven A - - -Geological reserves Proven B 1,063 2.24 24Geological reserves Proven C1 1,296 1.20 16
A+B+C1 2,359 1.67 39Geological reserves Proven A 120,749 2.34 2,823
Total Geological reserves Proven B 348,574 2.05 7,162Geological reserves Proven C1 498,454 1.01 5,058
A+B+C1 967,777 1.55 15,044(Source: Zajaca mine)
Dolic
Kik
Kolicina
Štira
Brasina
Stolice
Ore deposit
Zavorje

40
Category Category Resources Sb grade Sb(Western) (Serbian) t % t
Zavorje Probable C2 140,140 0.81 1,135Štira Probable C2 28,275 0.81 229
Brasina Probable C2 60,512 0.80 484Kik Probable C2 93,385 1.80 1,681
Dolic Probable C2 - - -Kolicina Probable C2 387,620 0.87 3,372Stolice Probable C2 - - -Total 709,932 0.97 6,901
Area
(Source: Zajaca mine)
Table 3.7 Mineral Resources at the Zajaca Mine
3.11.4 Issues
Among the mining geologists there is only one senior geologist. There is insufficient
exploration planning and maintenance of documents due to lax organization. Moreover, there are
insufficient underground maps and underground geological maps, and no underground assay maps.
Also, there is no basic document showing ore reserve calculations. So, these calculations are not
reliable. When redeveloping a mine, one has to reconfirm the highest priority ore assay using
analytical equipment and techniques. Exploration to determine the above-mentioned mineral
resources in Table 3.7 has been insufficient for map preparation.
According to recent geochemical surveys of steam sediments and soil conducted by a
private exploration company near the Zajaca mine, geochemical gold anomalies are distributed
around antimony mineralization fields. Jelenkovic and Obrenovic (2005) detected gold anomalies of
greater than 0.1ppm Au in seven districts. It is thought that these geochemical gold anomalies could
reflect a Carlin-type gold mineralization that has replaced carbonate rocks and calcareous shale. This
means there is a high possibility that epithermal gold deposits exist.
Investigation targeting gold has not been implemented at the Zajaca mine. Therefore, to
re-open this mine, it will be very important to 1) collect ore samples from old adits and drifts, 2)
collect surface samples of ores and rocks, 3) undertake RC (reverse circulation) drilling, and 4)
analyze the existing gold and antimony.
3.12 Geology and Deposits of the Rudnik Mine
3.12.1. Geology and Mineral Deposits
Cretaceous limestone, sandstone and breccia are distributed around the Rudnik mine. The
strata have developed a folding structure having a NW-SE axis with a plunge of 20 ゚ toward the SE.
Dacite intrusives of Cretaceous to Tertiary occur with the chief direction of NE to SW in the
Cretaceous system around the mines
Deposits are skarn-type that formed between the limestone and dacite. Main skarn
minerals are clinopyroxene, garnet and epidote, and pre minerals are galena, sphalerite, chalcopyrite
and pyrrhotite. The mineralized area is 2.5km long trending NW-SE, and 1.5km wide trending
NE-SW. Nearly 90 orebodies occur in a 5km2 area.
3.12.2. Reserves

41
Cut-off grades in the Rudnik mine are 1.2% Pb, 1.2% Zn, 0.25% Cu and 60g/t Ag. As of
31 December, 2006, ore reserves amounted to 2 million tonnes with 1.8% Pb, 1.8% Zn, 0.525 Cu
and 92g/t Ag. The ratios of category B and C1 in reserves are 14% and 86%. There are 26 orebodies
with calculated ore reserves, with an average reserve of 80,000 tonnes.
3.12.3. Exploration Personnel
There is a total of seven staff. Their chief tasks are as follows:
1) Exploration in currently exploited sections and new prospecting zones
2) Grade control of mined ore from mining to mineral processing.
3.12.4. Exploration
Exploration in 2007 is divided into exploration in currently exploited sections and
exploration in newly-prospecting zones. In the exploited sections, a total of 200m of drift
prospecting and underground drilling of 10,000m are planned to confirm a C1 category reserve. The
lengths of drill holes range from 150m to 200m. The mine has five drilling machines, comprised of
two old ones and three new ones. Maximum drilling length is 600m. Exploration in
newly-prospecting zone is done by surface drilling survey in the 7km to 8km east zone of the mine.
A total drilling length of 1,200m (400m x 3 holes) is planned in 2007.
3.12.5. Issues
Dilution at the working face is high, ranging from 20 % to 30%. Because the average grade
of mined ore is a low 3% Pb+Zn, the reduction of dilution will help operations directly. It is
important to improve each shining hour from a moving to working faces on foot to a
car-transportation. The latest geological report was prepared by the staff of the Rudnik mine. A lot of
time has been spent on it. Reports to the government increase the burden on the business. The
introduction of IT skills including the use of scanners and digitizers will be necessary for geological
investigations.
3.13 Activities of Serbian Non-Ferrous Mines
Serbian non-ferrous mines have historically operated against a backdrop of rich mineral
resources. There were many production mines such as RTB Bor. However, in recent years all mines
have suffered considerably from political impacts such as the United Nations Sanctions Resolution
and the economic sanctions imposed by Western European countries, and they have not returned to
normal production yet..As there are no data on past production in Serbia at the Ministry of Energy
and Mines (MEM), non-ferrous crude ore production after 1990 in Serbia-Montenegro is shown
from USGS reports, as following figures.
These two figures show 2 sharp drops in production after 1990; the first was in 1993 and
the second was in 1999. The former was caused by sanctions imposed by the United Nations in 1992,
and the latter resulted from economic sanctions imposed by Western Europe, etc., in 1998. It is easy
to understand how these and other actions had such a tremendous impact on Serbian mines. By 2004,

42
mlnt
production of copper ore had dropped to less than 20% of 1990 levels, and lead and zinc ore
production had fallen to about 11% of 1990 levels.
Fig.3.9 Production of Copper Ore in Serbia Montenegro (source: USGS)
Fig.3.10 Production of Lead and Zinc Ore in Serbia and Montenegro (source: USGS)
kt

43Fig.4.3 Production of the Bor Underground Mine
kt %
Chapter 4 Current State and Tasks of Mining Activities
4.1 Activities of Large Mines owned by RTB Bor
RTB Bor is located in
the Bor District which is about
230km by road to the southeast
of Belgrade. RTB Bor consists
of three mining complexes: the
Bor Copper Mine (RBB), the
Majdanpek Copper Mine
(RBM) and the Copper Smelter Fig.4.1 Production of the last 20 yrs at RTB Bor
(TIR). The RBM is located in Majdanpek City, but the other two complexes are in Bor City. Fig. 4.1
shows production trends at RTB Bor for the last 20 years. The main mine facilities of RTB Bor in
Bor City are shown in Fig.4.2.
Fig.4.2 Layout of the Main Mine Facilities
in Bor City
4.1.1 Bor Underground Mine
The history of the RTB Bor
underground mine dates back to 1897
when first exploration was done in the
Tilva Ros area by a French investor.
The first production took place in 1904.
In 1993, the Bor open pit stopped
operation because mining targets
(Tilva Ros and P2A) were too deep.
Since then, these ore bodies have
become the principal ore sources for
the underground mine. Exploitation of

44
the Brezanik ore body, which is slightly distant from these two ore bodies, was begun in 1980. Peak
production of the underground mine was 1.93 million tons in 1996, and remained at a level near
that for the next 3 years. However, production began dropping in 1999, and by 2001 it had fallen to
470,000t. This was due to a shortage of parts for underground machines caused by economic
sanctions. Fig.4.3 shows production of the underground since 1985. Sharp production declines in
1999 and 2001 are easily recognized. Fig.4.4 shows a schematic diagram of the current
underground mine.
The Bor underground mine introduced trackless system in 2003, when the underground
tracks were removed. Regarding mining methods, sublevel caving is used at Tilva Ros and P2A,
and cut and fill is used at Brezanik.
Underground operation is finely managed using various production and cost data, the same
as in Western countries. Table 4.1 shows a comparison of operation efficiency between 1996 (year of
production peak) and 2003 (year of significantly reduced production).
Table 4.1 Comparison of Underground Operations in the Bor Mine in 1996 and 2003 (source: Bor) 1996 2003
Item operation workers efficiency operation Workers Efficiency
Brezanik 260,098t 22,896 11.36t/miner 29,111t 4,315 6.75t/miner
Tilva & P2A 1,672,977t 18,960 88.24t/miner 294,674t 9,221 31.96t/miner
Min
ing
total 1,933,075t 41,856 46.18t/miner 323,785t 13,536 23.92t/miner
Drifting 6,058m 12,900 0.47m/miner 1,464m 7,484 0.20m/miner
Investment 1,544m 9,694 0.16m/miner 1,559m 8,587 0.18m/miner
Transporting & crushing 1,933,075t 12,6446 152.88t/miner 323,785t 12,644 25.61t/miner
Grand total 1,933,075t 75,987 25.44t/miner 323,785t 42,251 7.66t/miner
According to this table, production in 2003 was only about one sixth of the 1996 level.
This dramatic decrease was mainly due to the embargo on mining machine parts. Operation
efficiency decreased in all areas, because of disruptions caused by inadequate machines. Painful
situation of the mine operation can be easily understood. The amount of drifting also dropped,
falling to one fourth because only a few machines could be used for production. Therefore,
Fig.4.4 Schematic Diagram of the Bor Underground Mine (source: RTB

45
kt %
Fig.4.5 Operation Result of the Bor Open Pit
Fig.4.6 Geological Section of the Veliki Krivelj
Fig.4.7 Operation Result of the Veliki Krivelj
kt %
subsequent mining could be more difficult owing to the lack of mining preparation and exploration.
4.1.2 Development of the Borska Reka Ore body
The Borska Reka is a gigantic ore body located near the Bor underground and Veliki
Krivelj open pit, but it lies beneath the Bor underground mining levels. A plan for mining the ore
body was formulated at Belgrade University in 1999, and a mining consultant contracted by the
World Bank reviewed and analyzed the contents of the plan in 2005.
4.1.3 Bor Open Pit Mine
The Bor Open Pit Mine was started
in 1923. The grade of ore was somewhat
higher, 7 to 4 %Cu, in those years. Production
data for 1985 to 1993 are shown in Fig.4.5. All
operational data are listed in the Appendix.
The total exploited rock mass from mine
opening to closing was as follows:
Total ore 95,799,627t (Cu 1.4%), total waste
171,176,926t (stripping ratio: 1.40)
4.1.4 Veliki Krivelj Open Pit Mine
The first waste stripping in
this mine was started in 1979, and the
first ore production was begun as the
4th mine of RTB Bor in 1983. Annual
production reached 9.6 million t in the
4th year after first production, and had
been maintained at nearly the same
level until 1998, when the economic
sanctions began. Since 1999, mine
production has decreased; in 2006, it
was less than 4 million tons, which was
about 40% of the peak. Ore grade was
0.5% Cu at the beginning, but it had
decreased over time to 0.28% Cu in
2006. However, today it plays the lead
role in production, accounting for 70%
of the ore produced at RTB Bor.
Fig.4.7 shows production data

46
from Veliki Krivelj since 1985. Table 4.2 shows a comparison of ore mass exploited from 1983 to
1992, and from 2003 to 2006. The earlier period (1983 to 1992) was a comparatively good period of
operation, while the latter period (2003 to 2006) was far less favorable. Annual average of total mass
removed declined to less than one third, and average stripped waste decreased to about one fifth.
Accordingly, the stripping ratio decreased from 0.86 to 0.36. This indicates partially delayed
stripping. Table 4.2 Comparison of Exploited Mass in the Veliki Krivelj Open Pit
Period Mined ore Stripped waste Total mass Stripping ratio
1983 to 1992 84,852,005t 73,340,701t 158,192,706t 0.86
Annual average 8,485,201t 7,334,070t 15,819,271t 0.86
2003 to 2006 16,769,965t 6,080,445t 22,850,410t 0.36
Annual average 4,192,491t 1,520,111t 5,712,603t 0.36
4.1.5 Cerovo Open Pit Mine
The Cerovo open pit is located approximately 8 km to the north-east of the Veliki Krivelj
Mine. The Cerovo Open Pit Mine began stripping the initial burden in 1991, and started production
in 1993 when the Bor open pit stopped operation. The Cerovo 1 finished its reserve in 2002. Current
remaining reserve may be up to 320 million tons with a grade of 0.3% Cu and 0.1g/tAu, which are
the objective of privatization.
The Copper Mine Bor (RBB) was above described, and the RBB personnel was
restructured according to the privatization strategy. Table 4.3 shows a comparison of personnel in
January 2003, February 2007, and July 2007.
Table 4.3 Transition of RBB Personnel (source: RTB Bor) Department Jan. 2003 Feb. 2007 July 2007
Veliki Kreivelj Open Pit 516 405 396
Veliki Krivelj Plant 352 288 278
Cerovo Open Pit 124 11 13
Bor Underground 694 441 416
Bor Plant 342 230 225
Bor Repair Shop 128 87 87
Hydrometallurgy 48 29 34
Exploration 147 92 98
Administration 375 258 250
Zagradje Limestone 163 118 116
Bela Reka Silica Sand 72 67 66
Total 2,961 2026 1979
4.1.6 Slag Mining
Commercial metals from slag discharged from the Bor smelter have been recovered for
the past several years by the TIR . Mining has been carried out by the TIR, but the RBB has taken
the opportunity of stopped work in the underground operation of the Tilva Ros and P2A to study full
open pit mining operation of slag. And a new operation plan for slag mining was submitted to the
MEM. The total amount of slag is about 9 million tons with about 66,000t of copper metal, 2,600kg

47
of gold, and 41,000kg of silver. Ore reserves for each bench are listed in Table 4.4.
Table 4.4 Slag to be Mined Benches Slag (t) Cu (%) Cu (t) Au (g/t) Au (kg) Ag (g/t) Ag (kg)
365/350 1,318,973 0.715 9,431 0.28 372.0 4.50 5,935.4
350/340 3,061,392 0.715 21,889 0.28 863.3 4.50 13,776.3
340/332 1,277,730 0.715 9,136 0.28 360.3 4.50 5,749.8
330/330 1,465,830 0.715 10,481 0.28 413.4 4.50 6,596.2
320/320 1,330,959 0.715 9,516 0.28 375.3 4.50 5,989.3
320/310 736,056 0.715 5,623 0.28 207.6 4.50 3,312.3
Total 9,190,940 0.715 65,715 0.28 2,591.8 4.50 41,359.2
Mined slag will be treated through a flotation process, as previous test operations have
shown this to be the best recovery method. Full scale operation of copper slag flotation is estimated
in Table 4.5. The total operating cost is estimated to be US$6.57/t, 1.77/t for mining costs and
US$4.8/t for processing costs. It will be possible to recover the total investment of about US$ 10
million.
Table 4.5 Estimated Flotation Operation Values Item Estimated value
Annual amount to be treated 1,112,400 t
Cu grade in slag 0.715 %
Au grade in slag 0.282 g/t
Ag grade in slag 4.5 g/t
Concentrate 219,050 t
Cu grade in concentrate 15.0 %
Cu recovery 50.0 %
Cu in concentrate 32,857 t
Au grade in concentrate 5.072 g/t
Au recovery 50.0 %
Au in concentrate 1,296 kg
Ag in concentrate 64.748 g/t
Ag recovery 40.0 %
Ag in concentrate 16,544 kg
4.1.7 Majdanpek Open Pit Mine
The Majdanpek Mine (RBM) is located in
the City of Majdanpeck which is 70km from Bor City.
The RBM has two open pits, South Pit and North Pit,
and a processing plant. The concentrate is transported to
the Bor Smelter (TIR) by train. The central part of the
city is located in a valley containing many homes. The
main mine facilities are located along a line from the
central city, to the North Pit, South Pit and the mineral
processing plant. Furthermore, the waste dumps of the
North and South pits and tailings pond are somewhat
distant from the other facilities, which are fairly close
together. The layout of the main facility of the RBM is
Fig.4.8 Layout of Main Facility of the RBM

48
%
Fig.4.9 Operation Result of the Majdanpek Mine
Fig.4.10 Miners in the Majdanpek
shown in Fig.4.8.
The South Pit started stripping
in 1959 and production in 1961. The ore
processing plant was constructed by
1961 when the mine began to send the
concentrate to the TIR. The Pit was
expanded after that, and annual
production reached 13 million tons in
1976, and remained at that level until 1989. The RBM had been a central player of RTB Bor,
accounting for more than half of its total production since the year after its opening. In 1968, the
mine accounted for more than 70% of total production, and maintained this share until 1982, when
the Veliki Krivelj Open Pit was opened. The North
Pit recorded the first production in 1989 after it had
initiated stripping in 1977. In 1990, the pit started
full production. Fig.4.9 shows the production
results of the Majdanpek Mine. The number of
RBM workers had decreased as production
decreased, as shown in Fig.4.10. In 2002, the RBM
carried out a drastic restructuring by laying off
1,370 workers, about half of the total workers.
Despite this action, however, operating efficiency
dropped considerably. For example, the mine has maintained its three-shift system, but the first
shift is now working only in preparation, not in production.
The main reason for decreased production is the superannuation of mining machines, just
like at the Veliki Krivelj Mine. The current main mining machines are listed in Table 4.9. There are
some very old machines and some machines are rarely used.
Table 4.6 shows a comparison of exploited mass from 1977 to 1989, and from 2003 to
2006 at the South Pit. The earlier years (1977 to 1989) were a comparatively good period of
operation, while the later years (2003 to 2006) were considerably less favorable.
Table 4.6 Comparison of Exploited Mass in the South Pit Period Mined ore Stripped waste Total mass Stripping ratio
1977 to 1989 164,933,812t 358,684,295t 523,618,107t 2.17
Annual average 12,687,216t 27,591,100t 40,278,316t 2.17
2003 to 2006 3,500,200t 2,667,000t 6,167,200t 0.76
Annual average 875,050t 666,750t 1,541,800t 0.76
Annual average of exploited mass fell approximately 76%, and average stripped waste
decreased by about 98%. Accordingly, the stripping ratio decreased to about one third, from 2.76 to

49
0.76. This clearly indicates delayed stripping. Unlike the RBB, the RBM has not introduced IT, so
the past operation data is not used efficiently. It is easy to understand the bad state of production
merely by seeing the bad condition of the local roads.
Table 4.7 shows a comparison of exploited mass from 1990-2000 and from 2003-2006 at
the North Pit. The annual average of exploited mass decreased approximately 99%, as did average
stripped waste. Accordingly, the stripping ratio decreased to less than half, from 3.13 to 1.55. This
clearly indicates delayed stripping. If the RBM is to continue exploiting above the current water
level, it will be necessary to reroute the national road and remove a large mass of waste
(approximately 8 million tons), which will require a considerable amount of investment. Table 4.7 Comparison of Exploited Mass in the North Pit
Period Mined ore Stripped waste Total mass Stripping ratio
1990 to 2000 31,609,186t 98,987,692t 130,596,878t 3.13
Annual average 2,873,562t 8,998,881t 11,872,443t 3.13
2003 to 2006 752,800t 1,166,000t 1,918,800t 1.55
Annual average 188,200t 291,500t 479,700t 1.55
4.2 Activities of Middle/Small-Scale Mines in Serbia
Many small/medium-scale mines used to mine lead-zinc, rare metals, and other ores in
Serbia. However, they have been relatively inactive 1991 because of political uncertainty, so plans
were made to privatize all national mines, and some mines have already been privatized. The study
team visited three small/medium-scale mines (the Veliki Majdan, Rudnik and Zajaca mines) to
investigate their current states. The Rudnik and Zajaca are privatized mines.
4.2.1 Veliki Majdan Lead and Zinc Mine
Fig.4.11 Design and Current State of the South Pit
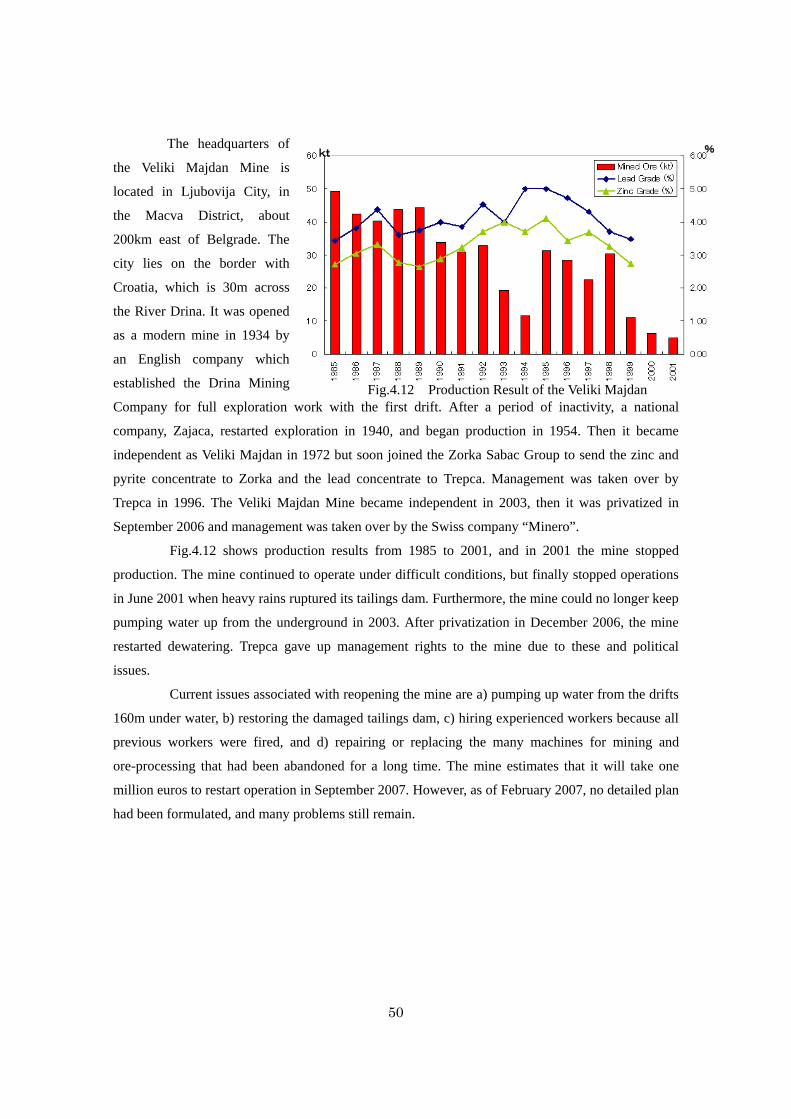
50
Fig.4.12 Production Result of the Veliki Majdan
kt % The headquarters of
the Veliki Majdan Mine is
located in Ljubovija City, in
the Macva District, about
200km east of Belgrade. The
city lies on the border with
Croatia, which is 30m across
the River Drina. It was opened
as a modern mine in 1934 by
an English company which
established the Drina Mining
Company for full exploration work with the first drift. After a period of inactivity, a national
company, Zajaca, restarted exploration in 1940, and began production in 1954. Then it became
independent as Veliki Majdan in 1972 but soon joined the Zorka Sabac Group to send the zinc and
pyrite concentrate to Zorka and the lead concentrate to Trepca. Management was taken over by
Trepca in 1996. The Veliki Majdan Mine became independent in 2003, then it was privatized in
September 2006 and management was taken over by the Swiss company “Minero”.
Fig.4.12 shows production results from 1985 to 2001, and in 2001 the mine stopped
production. The mine continued to operate under difficult conditions, but finally stopped operations
in June 2001 when heavy rains ruptured its tailings dam. Furthermore, the mine could no longer keep
pumping water up from the underground in 2003. After privatization in December 2006, the mine
restarted dewatering. Trepca gave up management rights to the mine due to these and political
issues.
Current issues associated with reopening the mine are a) pumping up water from the drifts
160m under water, b) restoring the damaged tailings dam, c) hiring experienced workers because all
previous workers were fired, and d) repairing or replacing the many machines for mining and
ore-processing that had been abandoned for a long time. The mine estimates that it will take one
million euros to restart operation in September 2007. However, as of February 2007, no detailed plan
had been formulated, and many problems still remain.

51
Fig.4.14 Production Result of the Rudnik Mine
Fig.4.13 Schematic Diagram of the Veliki Majdan Underground Mine
4.2.2 Rudnik Poly-Metal Mine
The mine is located in Rudnik Village, Gornji Milanovac, Sumadija District,
approximately 110 km south of Belgrade. This was the first privatized mine which was bought by
Contango in a public auction held in September 2004. Contango bought 70% stock of the company,
and the other 30% was given to workers of the company, who have already sold most stock to banks
and investment companies. Currently there are more than 10 shareholders.
This mine was established in 1948 by Trepca, and ore production began in 1952. It
produces lead, zinc and copper
ore. The lead and zinc ore
deposits are small massive skarn
type while the copper deposits
are mainly stock work type
which are somewhat larger than
the lead-zinc deposits. Mine
production had been stable until
1992, when it fell sharply due to
economic sanctions. In 1994, the
mine could not produce ore. In
1995, the mine re-began
production, but debt was accumulated owing to low production and low metal prices. Finally, the
company was privatized in 2004. As this mine had been managed autonomously before
privatization, a new owner had difficulties in labor management.2 former managers and 3 leaders
of miners were fired to break with the old habits. After privatization, the mine became profitable
(160 million Dinars) in 2006 due to high metal prices. Production dropped shortly after
privatization, but it has recovered year by year, and will reach the peak level of the past in 2007
(Fig.4.14). From 1999-2002, zinc concentrate was sent to the Veles Smelter in Macedonia. Since
then, it has been sent to the Plovdiv Smelter, same as with the lead concentrate. Copper concentrate

52
0
50
100
150
200
250
300
1984
1985
1986
1987
1988
1989
1990
1991
1992
1993
1994
1995
1996
1997
1998
1999
2000
2001
2002
2003
2004
2005
2006
Fig. 4.15 Kostolac Mine Production in the Last 20
has been treated in the Bor Smelter.
The mining method of the mine is descending “Room and Pillars”. Each small ore-body
prepares one stope, but large ore-bodies are separated vertically into 2 or 3 portions. Each portion is
mined from top down by “Room and Pillars”. Total amount of the sulfide orebody, P2, beneath the
oxide ore is about 800,000t which lies near the surface. The oxide ore has been tested by the Ore
Processing Department of the mine. However, the mine gave up exploitation of the oxide ore due to
its low recovery rate. Currently, the mine is preparing the sulfide orebody just beneath this oxide ore
by the underground method. Room and Pillar method, main mining method of the mine, is not
applicable for this orebody, and Cut and Fill method may be adopted.
4.2.3 Zajaca Mine
The Farmakom Ltd. is located in Sabac City, Macva District, which is about 200 km west
of Belgrade. The company was established about 20 years ago. Although the core business of the
company is agriculture, it has been gradually expanding and diversifying its operations since its
founding. Currently it is a large (200-million-euro) operation employing a total of 2,000 workers.
The company deals in milk, agricultural products cultivated in greenhouses, and spare parts for cars,
and also runs a metal foundry and a lead smelting business. It bought out the Zajaca Mining Co. Ltd.
in March 2006 to acquire antimony mines
The Zajaca area is rich in metallic minerals with a metallogenic length of 25km (300 to
500m wide) in the NW-SE direction, and many mines have been developed in this area in the last
130 years. There are many nonferrous metal ore deposits such as lead, zinc, tin, and arsenic, as well
as antimony in this area.Total production of antimony was 140,000t in metal base. Antimony
production was begun after World War 2, and the average annual production was about 2,000t from
1945 to 1990. The production peak was during 1965 to 1977, when the average annual production
was about 3,200t. The Zajaca Mining Co. Ltd. stopped producing antimony in 1991 due to decreased
metal prices. After that, the company produced lead for car batteries from scrap lead using its
smelting facility. Farmakon has studied reopening mines. They target lead, zinc, tin, rare earths such
as CaF2, and antimony.
4.3 Other Mining Activities
4.3.1 Kostolac Coal Mine
Currently, the Kostolac mine
produces approximately 7 million tons
of coal for 4 billion kWh/year with a
1,000 Mw facility. They plan to increase
coal production to 9 million tons/year in
the future to meet increased electrical
demand. Fig. 4.15 shows mine

53
0
200
400
600
800
1000
1200
2003
2004
2005
2006
Fig. 4.16 Kovilovaca
production for the last 20 years. The mine suffered less than metal mines under economic sanctions,
because the Russian-made spare parts for mining machines were continuously available. It should be
noted that the mine does not have a privatization plan, because its production is directly linked to the
Serbian people’s lives. The Thermal Power Plant and “Kostolac” Mine are located in Kostolac,
Pozarevac Municipality in the Branicevo District about 100 km to the east of Belgrade. They are
operated by the state-owned company, EPS. The mining cost is €7- 8 /t and the mine runs profitably.
Currently at the Kostolac Mine, there are 3 open pits, Drmno (mining area: 2.5 km × 5.0 km),
Cirikovac (1.5 km × 2.0 km), and Klenovnik (0.8 km × 1.0 km). The pit bottom of Drmno Pit is
located 50 to 80m under the water level of the Danube River, which is about 500m from the pit.
Therefore, the pit continuously operates dewatering with 200 wells. Two tons of water must be
dewatered for every 1 ton of coal. Additional wells are needed to facilitate pit moving in the future.
They expect to drill 40 to 50 new wells for each 500m move of the pit. Another problem with Drmno
Pit is avoiding the nearby Roman ruins known as “Viminacijum” on the coal layers. 20 million
Dinars (about 250,000 Euros) per year will be needed to move most of the ruins to another location.
However, as some ruins cannot be moved, approximately 40 million tons of coal will be remain
unmined. 30 years have already passed since Cirikovac Pit was opened. There are 2 coal layers to be
mined. However, mining has already encroached to within about 700m of a local villagers’ residence
area. Thus, it will be impossible to continue mining without changing the current mining method, so
underground mining may be adopted. The current stripping ratio of this pit is about 7:1, but
dewatering is unnecessary.
Klenovnik Pit produces about 150,000t per year with a stripping ratio of 7:1. Mining is
done by dragline, and coal is transported 2km to the plants by train. The reserve is insufficient, and
transportation costs are significant. So, the pit is scheduled to be closed 3 years from now.
4.3.2 Kovilovaca Limestone Quarry
The Kovilovaca Limestone Quarry is located in
Pozarevac Municipality, Branicevo District, about 135km to
the east of Belgrade. The current proven reserve is 21.65
million tons, but the quarry has a vast concession area, so
quarry life is not an issue. Since the thickness of the
overburden waste is about 0.5m, the mining condition is very
good. Limestone is distributed according to purity and grain
sizes. Annual production trends are shown in Fig.4.16 after
privatization.Production has drastically increased since
privatization through several management efforts, such as
renovation of machines and introduction of an efficiency wage
system. In 2007, production is expected to increase to 1.5

54
Country Location (Name) Capacity Process Type x 1,000 (S); secondary
Albania Kukes (Gjegian) 5 ReverberatoryLac 7 Blast FurnaceRubik 5 Reverberatory
Armenia Alaverdi 7 Reverberatory3 Reverberatory (S)
Bulgaria Eliseina 14 Blast Furnace (S)Pirdop 190 Outokumpu Flash
Hungary Csepel 4 Reverberatory (S)Italy Porto Marghera 24 Reverberatory (S)Poland Glogow District (Glogow I) 220 Blast Furnace
Glogow District (Glogow II) 205 Outokumpu FlashWroclaw (Hutmen S.A.) 9 Blast Furnace (S)Legnica 93 Blast Furnace
Romania Baia Mare 35 Outokumpu FlashZlatna 10 Reverberatory (S)Zlatna 40 Outokumpu FlashZlatna 13 Reverberatory
Serbia Bor 170 ReverberatorySlovakia Krompachy 20 Reverberatory (S)Turkey Samsun 42 Outokumpu Flash
million tons.
4.4 Smelting Activities
4.4.1 Overview of the Copper Industry in Serbia
(1) Import and Export of Copper (Statistical Yearbook of Serbia 2006)
(2) Production by TIR Bor
In the 1980’s, production of the Bor smelter reached 150,000 t/y and approximately 70%
of this production was supplied to fabricators in Yugoslavia.
(3) Copper Industry in the Balkans
1) Copper Mines
Total copper concentrate quantity 11,129,000 tons. Assuming the copper content in
concentrate to be 25%, the net copper quantity is 282,000 tons
2) Copper Smelters In the Balkans, the total copper quantity is 282,000 tons, meaning that there is relatively
little copper concentrate in this area.
Total 1,032,000 tons
tons/yearExport Import
year 2,003 2,004 2,005 2,003 2,004 2,005Total 39,319 37,788 59,723 20,812 47,897 41,747
Cyplus 1,673 3,809 19,015 824 4,564 19,386Italy 2,526 4,164 7,416
Gemany 4,054 6,040 5,821 950 493 376USA 3,089 4,341 3,695
Romania 1,333 1,746 3,111Bosnia 1,127 1,010 2,084Bulgalia 4,379 23,614 13,077Russia 4,255 4,974 4,312Austria 1,298 1,620 2,366Others 25,517 16,678 18,581 9,106 12,632 2,230
Year 2003 2004 2005Cathode 14,000 12,000 31,000

55
4.4.2 Operation at the TIR Bor
Features of the RTB Bor and TIR Bor are as follows;
1) Copper content in concentrate from RTB Bor is low and the concentrate cannot be sold in the
international market when its copper content is 20% or less. Therefore, RTB Bor needs to have
its own smelter.
2) The production at TIR Bor is essentially based on raw materials from Bor mines and imported
concentrate is used to maintain the copper content in charged concentrate at 20% Cu.
Although there is no problem with using up to 28% Cu at the smelter, operations are carried out
with the minimum amount of imported concentrate.
3) Before economic sanctions were imposed in 1990, there were fabrication plants in Serbia that
used electrolytic copper as a raw material and approximately 100,000 t/y electrolytic copper was
consumed locally in Yugoslavia. At present, the domestic fabrication in Serbia is approximately
20,000 t/y, and all fabrication plants except RTB Bor are privatized.
4) Because purchases of imported concentrate and sales of electrolytic copper are entrusted to East
Point Co., Ltd. of Cyprus, electrolytic copper produced by TIR Bor is not given priority for
domestic sales.
5) The theoretically calculated copper recovery rate of TIR Bor is about 93%, which is lower than
the contract recovery rate of 95%.
6) The cut-off grade (for trading) of gold and silver in copper concentrate is 1g/t gold and 30g/t
silver and they, unlike copper, are producing a profit. However, RC (refining charges) are not
taken into account.
7) The sales price of sulfuric acid is now 0.5 euros per ton, meaning the more that is produced, the
less profit there will be. When fixing SO2 as sulfuric acid for pollution prevention, it must be
considered as a pollution control cost. (In the following study, it is not considered in the
operating costs for copper production.)
Quality control is already registered for LME electrolytic copper, and some sections have
acquired ISO 9001 (Quality Control). Also, Refinery, Blending control ISO 14000 (Environment
Control) is scheduled after privatization.
Concerning accounting, financial reports are issued yearly and quarterly. A summary of
financial reports for the 3 years is shown in the table below.

56
Table 4.8 Summary of Financial Reports
Because the profit and loss are settled
each year, they cannot manage to have
re-investment fund. The Smelter/Refinery
of Bor started production in 1961 using
one reverberatory furnace. In 1971, the
plant began using 2 reverberatory furnaces
and its capacity was expanded to 175,000
tons. The copper concentrate imported
today is mainly from Bulgaria and is handled by
East Point Co., Ltd. of Cyprus.
The copper production capacity is
160,000 tons but in recent years, the production
has only been 10 to 20% of this capacity.
Because of this, the operating costs are becoming
high. We estimated the operating costs based on
past operation results. We received basic data on
operating costs from 1991 to 2006 and calculated
operating costs versus production. Fig.4.32 shows the calculated operating costs (cents/lb) by
production amount. At 165,000 t/y production, the direct operating cost is 6.9¢/lb. The minimum
production to have a profit under current concentrate purchase price of 31.75 ¢/lb is 19,500 t/y.
However, this is on a direct cost basis and this minimum production quantity will increase when
indirect costs are included. For example, when a desulfurization plant and wastewater treatment
facilities are installed for pollution control, approx. 1.5 ¢/lb has to be added to this operating cost.
Total 8.4 ¢/lb.
Fig.4.17 Past Production
Fig.4.18 Operating Cost by production

57
The graph below shows
the average operating costs of
smelters in the world, comparing
operating cost of the Bor. The
operating costs of Bor will be the
cheapest in the world if the plant is
operated at full capacity. These costs are low compared to international level and will likely increases the economy grows. Thus, operating costs will likely rise in the future.
Smelter operation is based on the quantity of concentrate. A large portion of cost
derives from the quantity of the concentrate. When the copper content in this concentrate is low,
the production cost based on copper quantity becomes high. The quality of concentrate used at RTB
Bor is quite low compared to the average world concentrate of 28%. Copper, silver and gold content
in concentrate from the mines of RTB Bor is as tabulated below.
BOR 10~12 % Cu 12~18g/t Au 150~350 g/t Ag
Veliki Krivelj 16~22 % Cu 50~200g/t Au 600~1500 g/t Ag
Majdanpek 10~16 % Cu 4~7g/t Au 30~60 g/t Ag
The copper content in blended concentrate is adjusted to 20 to 22% Cu by blending with
imported concentrate having a higher copper content. However, since 2000, the quality of imported
copper has dropped down to approx. 15%. However, there is some sign of recovery in 2005 with
the use of imported concentrate. Matte grade is within the range of 35% to 45%. Slag is kept at
around the 0.5% level. The figure below shows copper content in copper concentrate, in matte and in
slag.
4.4.3 Copper Smelting/Refining Business
TC/RC is a processing cost which is borne by the smelter/refinery. Therefore, in order to
have a profit, the total operating costs should be lower than TC/RC.
Fig.4.20 Cu Grade Trend of Concentrate,
Matte and Slag
Fig.4.19 Operating Cost for Smelting and Refining

58
TC is a unit cost per quantity of concentrate and is expressed as ¢/lb of copper quantity.
Therefore, it varies depending on the copper content in concentrate. The following table shows
conversion values for various concentrations. For example, at TC70$/t, the TC will be 11.8¢/lb with
copper content of 28% but when it is 10%, TC will become 35.3¢/lb as a copper base. Profit is
indicated as (TC/RC – production cost). Fig.4.21 shows both TC and TC/RC together, along with
operating costs.
Fig.4.21 Relation between TC/RC and Operating Cost
Past trends in TC/RC are shown in Fig.4.22. The standard for copper content in
concentrate is 28% Cu. According to this figure, TC/RC is changed by LMC prices. TC/RC in the
RTB Bor is unknown, but sale and cost should be managed according to the international standard.
There is no specific relationship because it is determined by the supply and demand conditions of
concentrate and the relation between the seller (mining side) and the buyer (smelter side). However,
the maximum was something like 35¢/lb (TC/RC=130/13) and the minimum was 10¢/lb
(TC/RC=40/4). Also other sources of smelter profit are described as follows..
Fig.4.22 Trend of LME Copper Price and TC/RC (US /lb in 2002)

59
Fig. 4.23 Relation between LME Price and TC/RC
Transactions in copper concentrate are based on the copper content minus 1%. In other
words, if the actual recovery is higher than that, there will be a profit. Copper recovery rate at TIR
Bor is shown below.
Fig.4.24 Copper Recovery Trend of the TIR Bor
Sulfuric acid is produced from sulfur in the copper concentrate but sulfur is not included
in the concentrate price. If it can be sold at a price higher than the operating cost, it will produce a
profit. However, sulfuric acid has been in over-supply recently and it is difficult to sell it under
favorable conditions. At present, the operating cost is 20 euros per ton of sulfuric acid while the sales
price is 0.5 euros per ton, meaning the loss is increased when more is produced. Therefore, it is
needed to use sulfuric acid.
The average grades of Au and Ag in concentrate in the past were 5.5g/t and 36.7g/t,
respectively. Assuming that the cut-off is 1g/t Au and 30g/t Ag, the contract recovery rate will
become 82% Au and 18% Ag. The actual recovery rate is approximately 95% Au and 88% Ag,
meaning there is a profit from this difference in recovery. It is linked with improvement of
management to manage this profit/loss from gold and silver recovery.

60
4.4.4 Modification of the BOR Smelter
(1) Reverbertory Furnace Process
1) the production capacity is to remain at the present 160,000 t/y, incorporating pollution control
measures into present facilities.
The present reverberatory furnace process has low operating cost and when the production
is increased, the operating cost can be reduced further. At present, the operation is only to treat the
copper concentrate from the Bor Mine, but it may be possible to increase profits by increasing the
production and minimizing the operating cost.
The operation results up to 1990 show actual production of 165,000t/y. It is possible to continue
operations by conducting maintenance which had been neglected and by implementing the pollution
control measures.
Fig.4.25 Minimum Profitable Level of Production
As shown in Fig.4.25, if the upper limit of TC/RC in the past was 30¢/lb, profit could be expected
at a production level of 20,000t/y or higher and if the low limit of TC/TC was 15¢/lb, a profit could
be expected at production of 45,000t/y or higher. Thus, TIR Bor should have a minimum production
of 45,000 t/y. Prerequisite is shown as follows; • Desulfurization system
The specifications of desulfurization system for 160,000 t/y production are estimated in the
following table.
• Construction cost (Lime/Gypsum process) US$30 million
• Operating cost US$ 2.1 million /y including indirect costs
Nm3/hr SO2 % SO2 Nm3/hReverberatory gas 140,872 0.75 1057Sulfuric acid exhaust gas 278,650 0.32 900Total 419,522 0.47 1957

61
Smelting cost C/lb 1993Africa Asia Australia W Europe Latan America N.America
Reverberatory 8.8 25.1 28.2 10 16.6OKO Flash 17.8 5.7 16.4 11.3Inco flash 12.6Noranda 13.6MI 20.1 9.9ISASMELT 12.4 12.6Blast 27.6 39.8Electric 7.6 10.6 23.4Noranda 12.6CMT 9.7
0.59 ¢/lb as 160,000 t/y copper production
(These are very rough figures.)
• Wastewater treatment system
At present, there is 440m3/day waste water discharge and that at full capacity operation is
assumed to be 530m3/day.
Construction cost (Neutralization + iron coprecipitation process) US$3.5 million
Operating cost US$ 3 million /y including indirect costs
0.85¢/lb as 160,000 t/y copper production
• Grand total for pollution control measures
Construction cost US$33.5 million
Operating cost 1.44 ¢/lb
(2) Smelting Process
The copper smelting has a long history, and there are many processes developed. Basically,
the process is divided to two steps, which are primary smelting and converting. Many types of
furnaces are used for primary smelting, but currently in most cases PS converter is used for
converting.
(3) Implementing a New Copper Smelting Process
Table 4.9 shows a comparison of operating costs among smelting processes. The areas are
divided because the labor cost and energy cost are different in each area.
The smelting cost of reverbertory furnaces is the second highest in all areas following
blast furnaces. At Bor, there is a special situation in that the smelting cost is low because of the
low unit costs of energy and manpower, but as internationalization progresses, there is a likelihood
that smelting costs will increase.
Table 4.9 Comparison of Operating Costs by Smelting Process (direct cost)
1) New Smelting Process
In the new smelting process, the functions of the roasting furnace and reverbertory
furnace of the Bor will be performed by only one furnace. This will eliminate production of
low-concentration SO2 gas from the reverbertory furnace and will allow the use of a double contact
system sulfuric acid plant that requires rich SO2 gas. In this double contact system sulfuric acid

62
plant, the conversion rate to sulfuric acid can be improved by a single contact system from the
present 95% to approximately 99.5%, thus eliminating the need for a separate desulfurization plant.
The mainstream smelting process has been transitioning from Flash -> MI-> CMT->ISASMELT or
AUSMEL (Fig.4.26).
Fig.4.26 Trends in the Use of the New Smelting Process
The TIR Bor was planning to convert to the new process in 1979, 1990 and 1998, but it
still has not been materialized.
4.4.6 Plan for Improving the Program
Assuming privatization, tentative improving program and scheduling is shown as follows;
(1) Countermeasure against Pollution
1) Air Pollution
As a first step, the priority should be given to re-starting of existing sulfuric acid plants
that have been shut down due to lack of spare parts. The air antipollution measure should be given
priority to in terms of time, and it is necessary therefore to return to the original design capacity of
the existing facilities, and to settle the deficiency of the existing facilities ability.
As a second stage, it is necessary to reduce the SO2 discharge from the smelting facilities
in operation. In the first stage, the lack of capacity of existing facilities should be determined and
decide the remodeling specifications.
In the third stage, the establishment of the SO2 removal facilities matched with
remodeling of smelting process is necessary. A long construction period may become necessary in
order to make a decision of the plant capacity, the choice of smelting process, preparation of a large
amount of investment. So, it is desirable to carry out this stage in two steps.
2) Effluent
An existing plant has only wastewater treatment facilities for #3 sulfuric acid plant. It is
necessary to expedite the decision on the quantity and the quality of wastewater of sulfuric acid

63
plants, refinery and others, and it is necessary to start the construction of wastewater treatment
facilities immediately. (2) Plan for Improving Schedule
a. 2007 Selection of desulfurization process Cu production 40,000 t/y
Order for wastewater treatment facility
b. 2008 Order for desulfurization plant, construction Cu production 40,000 t/y
Completion of the wastewater treatment facility
Ameliorate poor maintenance including restoration of acid plant
c. 2009 Completion of the desulfurization plant Cu production 40,000 t/y
Start operation of the wastewater treatment facility
Ameliorate poor maintenance including restoration of acid plant
d. 2010 Start operation of the desulfurization plant
Production expansion by reverb. furnace Cu production 160,000 t/y
When concentrate from Bor mine is not enough,
imported concentrate is used.
e. 2011 Start research on the introduction of a new smelting process
Determine production capacity, select smelting process, execute feasibility study,
etc.
f. 2013 Place order for new smelting process
g. 2017 Start operation of new smelting process plant
4.4.7 The Zorka Zinc Smelter/Refinery
(1) Production Trend
Similar to the Bor Smelter, the Zorka Zinc Smelter/Refinery had been steadily increasing
production. However, production dropped sharply because of the outbreak of the war in 1990 and the
subsequent economic sanctions by EU countries. In 2006, production was 6,000 tons compared with
an annual production capacity of 30,000 tons.
Fig.4.27 Production of Zinc in
the Zorka Smelter

64
The residue treatment system is a jarosite process. The factory cannot procure concentrate and
10% of zinc remains in residue and the zinc recovery rate is 87%
4.4.8 Current State and Task of Metallurgical Education
In Serbia, metallurgical education is provided at the Faculty of Metallurgy in the
University of Beograd and at Technical Faculty of the University of Beograd in Bor. Recently, there
has been much more interest in popular courses like management and there are only a few students
in metallurgy. Thinking of the Bor Smelter in the future, improvement shown in 4.4.6 should be
implemented to recover production, and it would be linked with employment of students and
fosterage of successors.
Concentrates
BlendingSteam Power plant
Roater 1 set SO2 gas Sulfuric acid plant
Leaching Jarosite leaching
Elecrolysis Residue
Casting
Zn inngotFig.4.28 Process of the Zorka Smelter