Formation and Characteristics of Glucose Oligomers during ...
University of Arkansas, FayettevilleScholarWorks@UARKBiological and Agricultural EngineeringUndergraduate Honors Theses Biological and Agricultural Engineering
5-2015
The study of the formation of oligomers andamyloid plaques from Amylin by capillaryelectrophoresis and fluorescent microchipelectrophoresisShane WeindelUniversity of Arkansas, Fayetteville
Follow this and additional works at: http://scholarworks.uark.edu/baeguht
Part of the Engineering Commons
This Thesis is brought to you for free and open access by the Biological and Agricultural Engineering at ScholarWorks@UARK. It has been accepted forinclusion in Biological and Agricultural Engineering Undergraduate Honors Theses by an authorized administrator of ScholarWorks@UARK. Formore information, please contact [email protected], [email protected].
Recommended CitationWeindel, Shane, "The study of the formation of oligomers and amyloid plaques from Amylin by capillary electrophoresis andfluorescent microchip electrophoresis" (2015). Biological and Agricultural Engineering Undergraduate Honors Theses. 25.http://scholarworks.uark.edu/baeguht/25

The Study of the Formation of Oligomers and Amyloid Plaques
from Amylin by Capillary Electrophoresis and Fluorescent
Microchip Electrophoresis
Shane Weindel, Biological Engineering Undergraduate
Christa Hestekin, Chemical Engineering Assistant Professor
Department of Biological & Agricultural Engineering
203 Engineering Hall
1 University of Arkansas
Abstract
Amylin, a pancreatic β-cell hormone, was the focus of this research project. This
hormone is co-localized and co-secreted with insulin in response to nutrient stimuli. The
hormone inhibits food intake, gastric emptying and glucagon secretion. Insulin and
amylin appear to complement each other in the control of plasma glucose levels. Human
amylin has a propensity to self-aggregate and to form insoluble bodies. In type 2
diabetes, amylin forms pancreatic islet amyloid plaques, which are found in 90% of
people with the disease. It is still uncertain whether or not the deposition of amylin is a
primary, or a secondary, event in the development of type 2 diabetes. Oligomers of
amylin have been recently suggested as the cytotoxic cause of cell death; this is in
opposition to larger amyloid deposits being the cause of β-cell deaths. This project
examined the aggregation of Amylin. By using capillary electrophoresis and microchip
electrophoresis we attempted to determine the earliest time points of amylin oligomer
formation and monitor them as they continue to increase in size. The successful
development of this method could allow researchers to better understand the cytotoxicity
of amylin oligomers and in turn lead to better treatments and potentially earlier diagnosis
for type 2 diabetes patients. Our current research was able to see Amylin aggregation
with capillary electrophoresis, however the optimized conditions to best characterize the
Amylin aggregates still needs to be determined. The microchip studies were not pursued
far enough to observe Amylin aggregates through that process.

1
Introduction
Plasma glucose concentrations are determined by the rate of glucose leaving the
bloodstream (Rd, or glucose disposal) and the rate of glucose entering the bloodstream
(Ra, or glucose appearance).[1] Glucose production by the liver and the glucose taken in
from meals accounts for the Ra in the bloodstream. Insulin, secreted by pancreatic β-
cells, primarily controls the Rd (glucose disappearance) functions. Glucagon is secreted
by pancreatic α-cells in response to stress and hypoglycemia. This hormone increases Ra
by forcing the liver to secrete glucose and stimulating gluconeogenesis.[1] Amylin, a
second β-cell hormone, is co-localized and co-secreted with Insulin in response to
nutrient stimuli.[1] Amylin functions in ways that control Ra. The hormone inhibits
food intake, gastric emptying and glucagon secretion. This suggests that Insulin, which
primarily controls Rd, and Amylin, which primarily controls Ra, appear to complement
each other in the control of plasma glucose levels.
Human Amylin has a propensity to self-aggregate and to form insoluble bodies.
In type 2 diabetes, Amylin forms pancreatic islet amyloid plaques, which are found in
90% of people with the disease.[1] In an animal model of diabetes, the causal role of
Amylin in the development of type two diabetes has been strongly supported.[2] It is still
uncertain whether or not the deposition of Amylin is a primary, or a secondary, event in
the development of type 2 diabetes. Oligomers of Amylin have been recently suggested
as the cytotoxic cause of cell death; this is in opposition to larger amyloid deposits being
the cause of β-cell deaths.[2]
Amylin Cytotoxicity
Mirzabekov, et al. studied the role of Amylin in the formation of voltage-
dependent ion-permeable channels in the phospholipid bilayer.[3] This channel formation
is dependent upon lipid membrane composition, ionic strength and membrane potential.
At 1-10 μM, cytotoxic human Amylin dramatically increases the conductance of lipid
bilayer membranes. This suggests that channel formation is the mechanism of
cytotoxicity for Amylin. The researchers also tested Rat Amylin, which is highly
homologous to human Amylin, and showed no formation of pores. Therefore, the
formation of these pores is not caused by length or general sequence of the polypeptide.
The researchers summarize several reasons that explain why this channel formation
contributes to cytotoxicity. First, channel formation occurs at concentrations comparable
with those required for cytotoxicity. This shows a possible correlation between the two
events. Second, the Amylin channels are poorly selective channels. They let through
many ions that normal membrane channels do not. This can lead to disruption of ionic
homeostasis. This includes influxes of Ca+2
and Na+
and effluxes of K+. Prolonged
elevations of Ca+2
can potentially lead to cellular damage and even cell death. In addition
to the potentially serious effects of these ionic changes, the cell would face increased
energy demands as various pumps and exchangers attempted to compensate for these

2
ionic disturbances. Amylin not only kills Beta cells but also is able to kill other cell types.
This non-specificity matches with a pore formation model of toxicity. The amount of
amyloid found in pancreatic islets is proportional to the amount of Beta cell destruction
and to the Insulin requirements of the patient. Thus increased Amylin deposition may
lead to increased channel formation and cell destruction, thereby increasing the Insulin
requirement of the patient.
Amylin Inhibition Studies
A promising area of research for the understanding and treatment of Amylin
related disease is inhibitor studies. Various inhibitors have been studied and shown to
either prevent larger species from forming or shown to make the Amylin aggregates non-
toxic to the cells.
Insulin is a kinetic but not a thermodynamic inhibitor of Amylin aggregation
Previous studies have suggested that Insulin inhibits Amylin aggregation in
vitro.[4] Contradictory to this, other studies have shown that Insulin could promote
amyloid formation and enhance the binding of Amylin to preformed fibrils.[5] This
shows that the effects of Insulin on Amylin could be multi-dimensional. Cui, et al. [6]
found that both the above results do happen in vitro using light scattering. In the short-
term, Insulin does inhibit Amylin aggregation. As the time period lengthens, Insulin
actually promotes Amylin fibrillization. These effects were enhanced by a greater
Insulin/Amylin ratio. The researchers found that the promotional effects were a result of
copolymerization of the two proteins. The researchers also found that Insulin
significantly enhanced fibril formation by interacting with Amylin monomers or
oligomers rather than existing Amylin fibrils.
These results show that the previous hypothesis of Insulin inhibition as a reason
for the normal function of Amylin in healthy adults is not a completely valid hypothesis.
The research shows that the interaction between Amylin and Insulin is a complex one.
While a study of short-term effects could show certain positive results from Insulin
interaction a long-term study of the same type can show opposite results. With inhibitors
it is important to fully understand their mechanisms before making hypothesis about their
functions in nature.
Beta-Amyloid neurotoxicity requires fibril formation and is inhibited by Congo red
Lorenzo, et al. studied the effect of Beta-Amyloid on rat hippocampal cultures.[7]
They also studied the effect of Amylin on rat pancreatic cells. While studying the affects
on the cells the group also tested how Congo red affected the growth of the fibrils. The
group demonstrated that the addition of Amylin to the cells resulted in marked
degenerative changes with 62 ± 3% islet cell death after 24 hrs. The addition of Congo
Red was shown to completely inhibit Amylin toxicity. The cells were centrifuged after
the study and were shown to have Amylin peptide that had converted entirely to the

3
insoluble form of Amylin fibrils. This demonstrates that the dye did not inhibit Amylin
fibril formation. Congo Red did however render the Amylin non-toxic. The results
suggest Congo Red is a general inhibitor of amyloid fibril toxicity. For Beta-Amyloid,
the experiments showed that the neurotoxicity is mediated by the amyloid fibril. In the
cell experiments, there was a marked difference between immature diffuse plaques and
compact mature plaques. The immature plaques are not associated with
neurodegenerative changes and are Congo Red negative. The mature plaques are
associated with neurodegenerative changes and stain Congo Red positive. The group
claims that the cyto-protective effect of Congo Red for Beta-Amyloid neurotoxicity and
Amylin islet cell toxicity suggest that different amyloid fibrils have similar toxic
mechanisms. With these results it is possible therapeutic agents that inhibit one certain
type of amyloid fibril formation may have therapeutic effects for several types of
amyloidosis.
These results show a greater confidence in amyloidosis as the cause of pancreatic
cell death. They also show a type of dye that binds to fibrils and not just stains the fibrils
but inhibits further growth.
Interaction of the anthracycline 4’-iodo-4’-deoxydocorubicin (IDOX) with amyloid
fibrils: Inhibition of amyloidogenesis
All types of amyloidosis are structurally characterized by the cross Beta-pleated
sheet conformation of the fibrils, irrespective of their biochemical composition.[8-9] The
research of Merlini, et al. was sparked off by the clinical observation that IDOX could
induce amyloid resorption in patients with immunoglobulin light chain amyloidosis.[10]
The group found that IDOX binds strongly to all of the fibrils tested. They did not test
Amylin fibrils. They did test Beta-Amyloid. The group hypothesized that IDOX exerts its
beneficial effects through the inhibition of fibril growth. The affinity of IDOX for
amyloid is reminiscent of that of Congo red but they do not bind competitively when both
applied. The IDOX binds to amyloid fibrils specifically and with high affinity. The
binding both in vitro and in vivo affects the fibrils by inhibiting further growth and by
promoting resorption. The obvious drawbacks of the treatment with IDOX are its
toxicity. Nontoxic analogs could possibly be created that could be used as a therapeutic
approach and a potential diagnostic tool for multiple types of amyloidosis.
This drug has not been tested on Amylin and seems to have an effect on all types
of Amyloid fibrils. The drug seems to be a good choice to study on Amylin. The issue
with this fibril inhibitor is the same as Congo red in that it toxic but the paper does
suggest that it is possible to make nontoxic analogs.
A Two-Site Mechanism for the Inhibition of IAPP Amyloidogenesis by Zinc
The dysregulation of metal ions in amyloid- related diseases has received more
attention after the discovery of a high prevalence of metal ions in amyloid deposits. It has
been shown that amyloidogenic proteins, such as amyloid beta (Aβ), α-synuclein, and

4
mammalian prion protein, have transition metal binding sites that affect aggregation
rates.[9] However, the interactions of metals with different proteins do not produce the
same outcomes. For example, while copper has been shown to promote the formation of
Aβ fibers, copper inhibits the formation of IAPP fibers. The role of zinc in type II
diabetes and hIAPP aggregation is less understood, as both zinc supplements and zinc
chelation have been shown to decrease β-cell death and symptoms of type II diabetes.
The research of Salamekh, et al. suggests that zinc has a variety of effects on β-cells and
stress the need for further investigation.[11] Zinc has already been shown to affect a
variety of processes involved in glucose homeostasis, including storage and excretion of
Insulin, glucose-stimulated secretion cascades, and paracrine communication with α-
cells; however, little is known about zinc's effect on IAPP-induced β-cell death.
The researchers conducted various studies of zincs effects on Amylin. The group
showed that zinc has an affinity for Amylin monomers. The affinity is much less for
amyloid fibrils. The zinc is displaced upon fibril formation. The research group found the
existence of two zinc-binding sites, one high and one low affinity. This correlates with
the kinetic data that show that zinc inhibits fiber formation at low concentrations, but the
degree of inhibition significantly decreases at millimolar concentrations. After saturation
of the high-affinity, inhibitory binding site, the second low-affinity binding site becomes
occupied, which accelerates fiber formation.
This study shows some of the effects of zinc on Amylin. They are complex effects
such as the ones observed in Amylin’s interaction with Insulin. The way that zinc affects
Amylinin-vitro is harder to comprehend. Amylin can experience anywhere between
millimolar and picomolar concentrations of zinc during its existence.
This Study
As previous research shows, amylin aggregates appear to be cytotoxic and have
been implicated in the development of type 2 diabetes. Therefore, a method is needed
that can detect the early formation of Amylin oligomers and monitor their progression.
Capillary and microchip electrophoresis are promising methods of detection, but need to
be able to detect Amylin at physiological levels.[12,13] Since fluorescent dyes can be
sensitive at picomolar concentrations, we plan to use a FAM label to study Amylin
aggregation.
Experimental Aims
Initial studies with capillary and microchip electrophoresis were conducted.
Various preparation methods and run settings were explored to observe Amylin growth.
Initially, it was also planned to use capillary or microchip electrophoresis to evaluate
various inhibitors, such as the ones described in the background, to observe what size
aggregates are inhibited by what inhibitors. However, due to unanticipated
complications, these experiments were not able to be completed.

5
Materials and Methods
Aliquot Preparation for Amylin
Dried Amylin was obtained from Anaspec (#60804 Amylin (1-37), human) in 1
mg vials. 1,1,1,3,3,3-hexafluoro-2-propanol (HFIP) was added to the vial of Amylin such
that the concentration was 1 mM (256 μL HFIP to 1 mg Amylin). The vial was left with
HFIP at room temperature for 60 min. The vial was separated into individual aliquots
such that the contents of each micro-centrifuge tube will be 0.0271 mg/tube (6.94 μL).
The tubes were evaporated overnight and then stored in a -80°C freezer.
The preparation procedure was the same for FAM labeled Amylin. Dried FAM
labeled Amylin was obtained from Anaspec (5-FAM-Amylin (1 - 37), human #64448-05)
in 0.1 mg vials. It was prepared in a 0.1 mM concentration (235 μL HFIP to 1 mg
Amylin). Each tube was made to contain 0.006775 mg/tube (15.92 μL).
Capillary and Microchip 30 μM Sample Preparation
One aliquot of 0.0271 mg Amylin and one aliquot of 0.00675 mg FAM-Amylin
were used. 11.56 μL of 5 mMNaOH was added to the Amylin vial and 3.15 μL was
added to the FAM-Amylin vial. The NaOH was dissolved for 30 min. The solution was
diluted into 40 mM Tris-HCl (pH 9.0). 196.56 μL was added to the Amylin vial and was
added to the 53.62 μL FAM-Amylin vial. The solution was then supplemented with 10
mM NaCl. 23.13 μL of 100mM NaCl was added to the Amylin vial and was added to the
6.31 μl to the FAM-Amylin vial. The vials are then combined to get the desired ratio. For
50%, 173.44 μL of Amylin was combined with 47.32 μl of FAM-Amylin. For 20%,
48.56 μL of Amylin was combined with 52.99 μl of FAM-Amylin.
Capillary Array Coating Procedure
For each step, the desired solution was loaded into syringes and pushed through
the syringe pump (KD Scientific #780220V). The solution was pushed through at a very
slow rate for the desired time. After all solutions had been used, the array was to stored in
40 mM Tris-HCl pH 9
De-ionized water was run for 15 minutes. Then 1 M HCl was run for 15 minutes.
Then 0.1% PHEA (dissolved in de-ionized water) was run for 20 minutes. Finally, de-
ionized water was run for 15 minutes.
Capillary Electrophoresis Settings
The machine used was an Applied Biosystems 3130 Genetic Analyzer #627-0040.
The buffer used was 40 mMTris-HCl pH 9. The separation polymer was 0.5% PHEA
(dissolved in 40 mM HCl pH 9). The injection voltage is 7 kV with an injection time of
10 seconds. The run voltage was 7 kV with a run time of 9000 seconds.

6
Microchip Coating Procedure
For each step, the given solution was pulled through microchip channels with a vacuum
pump. When the time had elapsed, the vacuum pump was used to pull out the solution.
After all solutions had been used, the chip was to stored dry.
De-ionized water was run for 15 minutes. Then 1 M HCl was run for 15 minutes. Then
0.1% PHEA (dissolved in de-ionized water) was run for 20 minutes. Finally, de-ionized
water was run for 15 minutes.
Microchip Settings
The buffer used is 40 mM Tris-HCl pH 9. The separation polymer is 1% PHEA
(dissolved in 40 mM HCl pH 9).
Run 1:
The injection voltage was 500 V for 20 seconds.
The separation voltage was 3000 V with a pullback voltage of 200 V.
Run 2:
The injection voltage was 500 V for 20 seconds.
The separation voltage was 3000 V with a pullback voltage of 100 V.
Run 2:
The injection voltage was 600 V for 20 seconds.
The separation voltage was 4000 V (-1000 V at one end 3000 V at other end) with a
pull-back voltage of 100 V.
Results/Discussion
Capillary electrophoresis runs were conducted at different FAM-Amylin/Amylin
ratios. The data from these runs were plotted with the run time versus the relative
fluorescence unit at that time-point. The capillary electrophoresis apparatus works by
creating an electrical gradient along the capillary. This gradient pulls the sample from
where it is injected to a window in the capillary where a laser in shown onto the capillary.
As the sample moves through the window, the FAM label absorbs the laser light and then
fluoresces it back. The machine observes this as the relative fluorescence unit. When the
graphs are plotted the peaks at later time points are species that have taken longer to pass
through the capillary. With a single sample type (isoelectrically speaking), the only
difference that would separate the peaks would be the size of the species. With the
Amylin samples, earlier peaks should be samples of smaller size such as monomers and
smaller sized oligomers. The later peaks should be larger size oligomers.

7
The following figure is an example of how true protein peaks are distinguished
from noise and from bubbles. This is an important distinction to recognize since there is a
large amount of this type noise in the graphs, especially the early times during the run.
When the run conditions were first set up, conditions were used that had been
refined for another protein. This preparation used 40 mM Tris HCl pH 8 as the buffer.
Initial runs showed no peaks; suggesting that Amylin did not travel through the capillary.
This inability to travel through the capillary was found out to be an issue of Amylin’s pI.
Amylin has a pI of 8.59. At pH 8, Amylin is actually positively charged and will not flow
along the gradient of the electrophoresis machine. This means that Amylin’s charge at
this pH actually makes it want to migrate toward the cathode (negatively charged end that
is located at the sample injection end of the capillary). We decided to raise the pH of the
buffer to pH 9 making Amylin have a negative charge. This will cause Amylin to flow
down the gradient towards the anode (positively charged end locate on the end of the
capillary that contains the detection window) and be detected by the instrument. When
the buffer was changed, we forgot to change the PHEA polymer solution. So some of the
following runs were done with a buffer of pH 9 and a polymer dissolved in a buffer of pH
8. This would make the sample experience a pH somewhere between pH 8-9, most likely
closer to pH 9. At this pH, the Amylin should be very slightly negatively charged or not
charged at all.
5% FAM-labeled Amylin in pH 8 Polymer
Run conducted using a ratio of 5% FAM labeled Amylin to 95% unlabeled Amylin.
True peak representing the
protein. This peak is broad and
not terribly tall.
False peak representing an air
bubble. This peak is very skinny
and taller than true peaks.

8

9

10
These test at 5% showed a low detection of the Amylin species. Multiple sharp peaks were
detected which were most likely bubbles. Only a few peaks could be determined to be true
Amylin peaks. The peak that elutes between 40-80 minutes in each graph can be observed
as eluting at a later time point as the aggregation time increases from 0-24 hrs. This is an
indication that the species in that peak is increasing in size as time increases.
20% FAM-labeled Amylin in pH 9 Polymer
Run conducted using a ratio of 20% FAM labeled Amylin to 80% unlabeled Amylin.

11

12
The runs at 20 % show multiple size species in each graph. Multiple broad peaks can be
observed from 10-40 minutes. No change in peak elution times can be observed from 0-20
hrs.
50% FAM-labeled Amylin in pH 9 Polymer
Run conducted using a ratio of 50% FAM labeled Amylin to 50% unlabeled Amylin.

13

14
This 50% study shows multiple large peaks at 0 and 3 hrs. These peaks do not change
elution time at the 9 and 20 hrs. The peaks do decrease in area. This could suggests that
some of the species observed at the 0 and 3 hr time points have formed larger species that
elute at later times that were not observed by our study.
50% FAM-labeled Amylin in pH 8 Polymer Run #1
Run conducted using a ratio of 50% FAM labeled Amylin to 50% unlabeled Amylin.

15

16
This 50% study shows three distinct peaks (40, 50 and 80 minutes in the 0 hr run). These
three peaks each increase their elution time as the aggregation time increases from 0-24
hrs. An initial increase and then decrease in peaks area is observed as the aggregation time
increases. Both of these observations suggest that larger species are forming as aggregation
time increases.

17
50% FAM-labeled Amylin in pH 8 Polymer Run #2
Run conducted using a ratio of 50% FAM labeled Amylin to 50% unlabeled Amylin

18

19
This 50% study also shows three distinct peaks (50, 60 and 120 minutes for the 20 hrs run).
As with the other 50% study with pH 8 polymer, these three peaks each increase their
elution time as the aggregation time increases from 0-24 hrs. An initial increase and then
decrease in peaks area is observed as the aggregation time increases. Both of these
observations suggest that larger species are forming as aggregation time increases.
Microchip Results
The microchip system was a home-built instrument that was only completed in
the last months of the semester. Experiments were attempted at three different settings as
stated in materials and methods. With all three runs no peaks were observed. Settings
were changed with the two subsequent runs to attempt to get a greater gradient in the
chip. Positive results were still not observed.
The following graph shows an example positive result for the microchip system.
This was obtained by conducted a run with 100% FAM-AB(1-42).
20
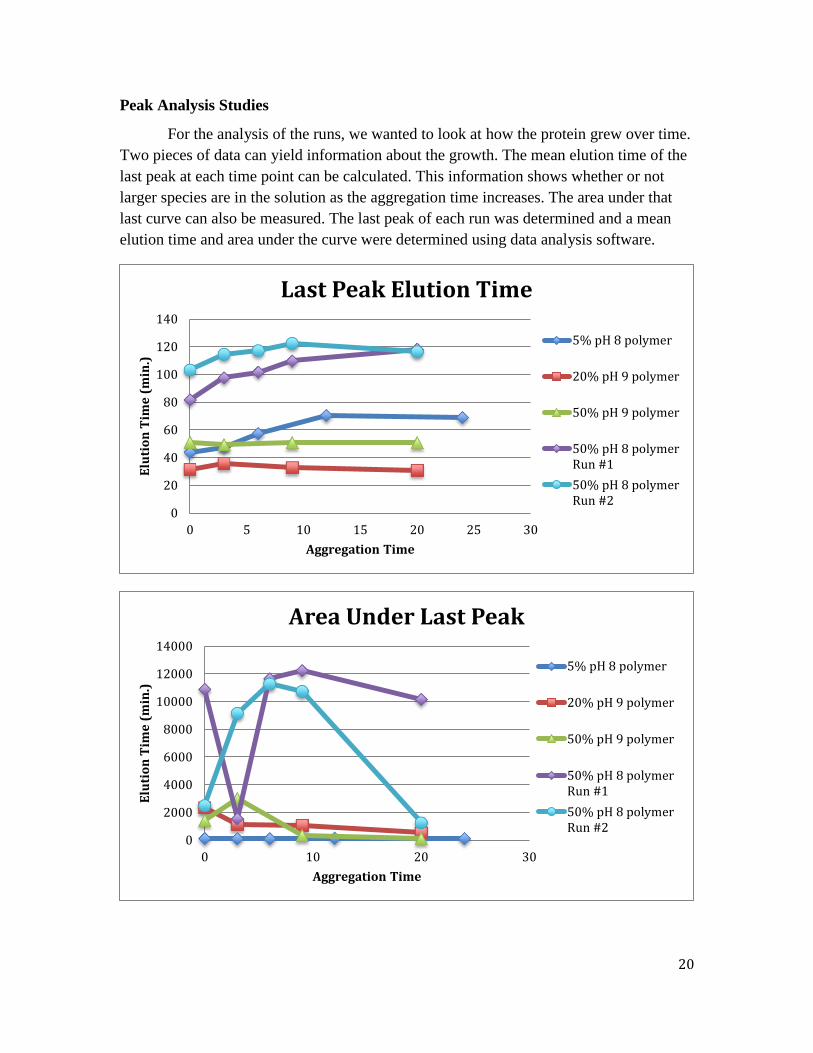
Peak Analysis Studies
For the analysis of the runs, we wanted to look at how the protein grew over time.
Two pieces of data can yield information about the growth. The mean elution time of the
last peak at each time point can be calculated. This information shows whether or not
larger species are in the solution as the aggregation time increases. The area under that
last curve can also be measured. The last peak of each run was determined and a mean
elution time and area under the curve were determined using data analysis software.
0
20
40
60
80
100
120
140
0 5 10 15 20 25 30
Elu
tio
n T
ime
(m
in.)
Aggregation Time
Last Peak Elution Time
5% pH 8 polymer
20% pH 9 polymer
50% pH 9 polymer
50% pH 8 polymerRun #1
50% pH 8 polymerRun #2
0
2000
4000
6000
8000
10000
12000
14000
0 10 20 30
Elu
tio
n T
ime
(m
in.)
Aggregation Time
Area Under Last Peak
5% pH 8 polymer
20% pH 9 polymer
50% pH 9 polymer
50% pH 8 polymerRun #1
50% pH 8 polymerRun #2

21
The last peak elution time graph shows an increase in size (elution time) of the
last peak for all three studies that were conducted in the mixed pH condition (sample at
pH 9, while polymer at pH 8). The two studies conducted in both pH 9 sample and
polymer conditions did not show growth of the last peak. This analysis agrees with the
visual results observed and discussed from the individual run graphs.
The result for area under the last peak showed similar findings. The area under the
curve generally increased and then decreased for both runs conducted with 50% FAM-
Amylin and pH 8 polymer. This also agrees with the visuals studies from the individual
run graphs. The purple curve point at 3 hrs that seems to show a significant drop is most
likely an error. The increase in peak area seen in times up to ~9 hrs most likely indicated
the growth of that size aggregate over time. The decrease in peak are at times >9 hrs is
most likely due to the formation of an even larger species that did not elute before the run
was ended. Again the pH 9 conditions did not show much change in peak area during the
course of aggregation.
Based on these results, the pH 8-9 condition seems to have a favorable result for
the protein aggregation. At this pH, the almost neutral Amylin will have very little
driving force to move under the applied electric field. Two other factors could make the
protein elute through the array. The FAM label does have a negative charge and could be
pulling the Amylin through the array. The migration of the Amylin could also be due to
the bulk electro-osmotic flow produced by the interaction of ions with the charged silanol
groups on the capillary surface. The favorable aggregation of the Amylin at these
conditions could be explained by its closeness to the protein isoelectric point (pI). Near
the pI, Amylin has a neutral or very weakly negative charge. With little to no charge, the
electrostatic effects between each individual protein becomes negligible and therefore the
Amylin monomers will have a greater chance of coming together to form aggregates.
Similar effects of low ionic strengths causing increased aggregation were observed in
with other proteins. [14]
Conclusion
Aggregate growth was observed for Amylin protein. This shows that capillary
electrophoresis is a potential method for studying the growth of Amylin oligomers. The
technique can be used in the future to study the effects of inhibitors on Amylin growth
and do other size characterization studies. Positive microchip results were not able to be
obtained. There is still potential to optimize the conditions to obtain positive results. We
did not have a large amount of time to try to optimize our runs on the system. It was only
available for use near the end of this research.
22
References
1. Young A. Amylin’s physiology and its role in diabetes. Cur Op Endocrinology &
Diabetes: 1997;4:282-290.
2. Phillips LK, Horowitz M. Amylin. Cur Op Endocrinology & Diabetes; 2006;13:191-
198.
3. Mirzabekov T, Lin M, Kagan, B. Pore formation by the cytotoxic islet amyloid peptide
amylin. J Biological Chemistry: 1996;271(4):1988-1992.
4. Kudva YC, Mueske C, Butler PC, Eberhardt NL. (1998) A novel assay in vitro of
human islet amyloid polypeptide amyloidogenesis and effects of insulin secretory vesicle
peptides on amyloid formation. Biochem J: 1998;331:809–813.
5. Janciauskiene S, Eriksson S, Carlemalm E, Ahren B. (1997) B cell granule peptides
affect human islet amyloid polypeptide (IAPP) fibril formation in vitro. Biochem
Biophys Res Commun: 1997;236:580–585.
6. Cui W, Ma J, Lei P, Wu W, Yu Y, Xiang Y, Et al. Insulin is a kinetic but not a
thermodynamic inhibitor of amylin aggregation. FEBS J: 2009;276:3365-3371
7. Lorenzo A, Yankner B. Beta-Amyloid neurotoxicity requires fibril formation and is
inhibited by Congo red. Proc. Nati. Acad. Sci. USA: 1994;91:12243-12247.
8. Glenner GG. Amyloid deposits and amyloidosis-the β-Fibrilloses. N Engl J Med:
1980;302:1283-1292,1333-1343.
9. Sipe JD. Amyloidosis. Annu Rev Biochem: 1992;61:947-975.
10. Merlini G, Ascari E, Amboldi N, Belotti V, Arbustini E, Perfetti V, Et al. Interaction
of the anthracycline 4’-iodo-4’-deoxydocorubicin with amyloid fibrils: Inhibition of
amyloidogenesis. Proc. Nati. Acad. Sci. USA: 1995;92:2959-2963.
11. Salemekh S, Brender J, Hyung S, Nanga R, Vivekanandan S, Ruotolol B, Et al. A
two-site mechanism for the inhibition of IAPP amyloidogenesis by zinc. J Molecular
Biology: 2011;410:294-306.
12. Huang Y, Huang C, Hu C., Chang H. Capillary electrophoresis-based separation
techniques for the analysis of proteins. Electrophoresis: 2006;27:3503-3522.
13. Issaq J. A decade of capillary electrophoresis. Electrophoresis: 2000;21:1921-1939.
14. Electrostatically driven protein aggregation: Beta-Lactoglobulin at low ionic strength
Majhi P, Ganta R, Vanam R, Seyrek E, Giger K, Dubin P. Electrostatically driven protein
aggregation: Beta-Lactoglobulin at low ionic strength. Langmuir: 2006;22:9150-9159.