
The study of late antique cartography through web based sources · The study of late antique...
13
e-Perimetron, Vol. 2, No. 3, Summer 2007 [160-172] www.e-perimetron.org | ISSN 1790-3769 [160] Dimitris Drakoulis ∗ The study of late antique cartography through web based sources Keywords: Late antique cartography; web cartography; Tabula Peutingeriana. Summary The study of sources concerning the cartographic production of late antiquity and in particular mode of late roman cartography was before the spread of the World Wide Web (WWW), a privilege for certain scholars, capable of visiting specialized libraries worldwide, in order to consult original codes and manuscripts. The World Wide Web (WWW) is the most recent medium to present and disseminate information and in par- ticular mode geographical and historical data. In this process, the reproduction of writ- ten and depicted primary sources and especially historical maps plays a key role and has multiple functions. First, gives the possibility for studying the document in total- ity, providing insight into patterns and relations, which could not be observed other- wise, for example, through the printed reproduction of a codes fragment in a secon- dary source, or through the temporary eyeshot of the original or his photographic re- production in the library. Secondly, because of the nature of the WWW, the historical map can also function as an interface or index to additional information. Geographic locations on the map can be linked to magnification of the particular, to the original and (or) the translated text, to settlement plans, photographs, sound or other contem- porary maps (multimedia). The corpus of late antique cartography comprises depicted documents (itineraria picta) and sources in written form (itineraria scripta). In the category of depicted documents belong the Tabula Peutingeriana, the Dura Europos parchment, the illustrations of the Notititia Dignitatum and the Corpus Agrimensorum, the mosaics of Nicopolis, Epirus and Madaba, Jordan, the drawings from the manu- scripts of Cosmas Indicopleustes, etc. In the category of written sources belong the texts from the manuscripts of the Corpus Agrimensorum (C. Arcerianus, C. Palatinus Vaticanus, C. Laurentianus), the itinireraria scripta (Antonini, Burdigalensis, Ege- riae), the writings of Christian Topography, etc. The case study of several internet based websites with content, related to the above-mentioned corpus, will explore the virtues of various modes of visualisation, test the effects of low-resolution screen readability and examine problems and solutions concerning digital representation and the further study of late antique cartography. Introduction The study of sources concerning the cartographic production of late antiquity and in par- ticular mode of late roman cartography was before the spread of the World Wide Web (WWW), a privilege for certain scholars, capable of visiting specialized libraries world- wide, in order to consult original codes and manuscripts. The WWW is the most recent medium to present and disseminate information and in par- ticular mode geographical and historical data. In this process, the reproduction of written and depicted primary sources and especially historical maps plays a key role and has mul- tiple functions. First, gives the possibility for studying the document in totality, providing insight into patterns and relations, which could not be observed otherwise, for example, ∗ Architect - Planner, Aristotle University of Thessaloniki, Greece. [[email protected] ]
Transcript of The study of late antique cartography through web based sources · The study of late antique...
e-Perimetron, Vol. 2, No. 3, Summer 2007 [160-172] www.e-perimetron.org | ISSN 1790-3769
[160]
Dimitris Drakoulis ∗
The study of late antique cartography through web based sources
Keywords: Late antique cartography; web cartography; Tabula Peutingeriana.
Summary
The study of sources concerning the cartographic production of late antiquity and in
particular mode of late roman cartography was before the spread of the World Wide
Web (WWW), a privilege for certain scholars, capable of visiting specialized libraries
worldwide, in order to consult original codes and manuscripts. The World Wide Web
(WWW) is the most recent medium to present and disseminate information and in par-
ticular mode geographical and historical data. In this process, the reproduction of writ-
ten and depicted primary sources and especially historical maps plays a key role and
has multiple functions. First, gives the possibility for studying the document in total-
ity, providing insight into patterns and relations, which could not be observed other-
wise, for example, through the printed reproduction of a codes fragment in a secon-
dary source, or through the temporary eyeshot of the original or his photographic re-
production in the library. Secondly, because of the nature of the WWW, the historical
map can also function as an interface or index to additional information. Geographic
locations on the map can be linked to magnification of the particular, to the original
and (or) the translated text, to settlement plans, photographs, sound or other contem-
porary maps (multimedia). The corpus of late antique cartography comprises depicted
documents (itineraria picta) and sources in written form (itineraria scripta). In the
category of depicted documents belong the Tabula Peutingeriana, the Dura Europos
parchment, the illustrations of the Notititia Dignitatum and the Corpus Agrimensorum,
the mosaics of Nicopolis, Epirus and Madaba, Jordan, the drawings from the manu-
scripts of Cosmas Indicopleustes, etc. In the category of written sources belong the
texts from the manuscripts of the Corpus Agrimensorum (C. Arcerianus, C. Palatinus
Vaticanus, C. Laurentianus), the itinireraria scripta (Antonini, Burdigalensis, Ege-
riae), the writings of Christian Topography, etc. The case study of several internet
based websites with content, related to the above-mentioned corpus, will explore the
virtues of various modes of visualisation, test the effects of low-resolution screen
readability and examine problems and solutions concerning digital representation and
the further study of late antique cartography.
Introduction
The study of sources concerning the cartographic production of late antiquity and in par-
ticular mode of late roman cartography was before the spread of the World Wide Web
(WWW), a privilege for certain scholars, capable of visiting specialized libraries world-
wide, in order to consult original codes and manuscripts.
The WWW is the most recent medium to present and disseminate information and in par-
ticular mode geographical and historical data. In this process, the reproduction of written
and depicted primary sources and especially historical maps plays a key role and has mul-
tiple functions. First, gives the possibility for studying the document in totality, providing
insight into patterns and relations, which could not be observed otherwise, for example,
∗ Architect - Planner, Aristotle University of Thessaloniki, Greece. [[email protected]]

e-Perimetron, Vol. 2, No. 3, Summer 2007 [160-172] www.e-perimetron.org | ISSN 1790-3769
[161]
through the printed reproduction of a codes fragment in a secondary source, or through
the temporary eyeshot of the original or his photographic reproduction in the library. Sec-
ondly, because of the nature of the WWW, the historical map can also function as an in-
terface or index to additional information. Geographic locations on the map can be linked
to magnification of the particular, to the original and (or) the translated text, to settlement
plans, photographs, sound or other contemporary maps (multimedia). The case study of
an internet based websites with content, related to late antique cartography, will explore
the virtues of various modes of visualisation, test the effects of low-resolution screen
readability and examine problems and solutions concerning digital representation and fur-
ther study.
In order to classify the sources, a web model concerning map classification has been fol-
lowed. It distinguishes between static and dynamic web maps. Each of these categories is
further subdivided into view-only and interactive maps. The most common map found on
the WWW is the static view-only map. Often the sources for these web maps are original
cartographic products, which are scanned and put as bitmaps on the WWW. Static maps
can also be interactive. These are the so-called 'clickable' maps. The map can function as
an interface to other data. Alternatively it could allow the user to define the contents of
the web map by switching layers off or on. The WWW has several options to display dy-
namic processes via animations. The so-called animated GIF can be seen as the view-only
version of the dynamic maps. Interactive dynamics can be created by Java, JavaScript or
via virtual environments in VRML or QuicktimeVR. (Fig. 1).
Figure 1. Webmap Classification
(Source: http://kartoweb.itc.nl/webcartography/webmaps/classification.htm).
Presentation
Late antiquity is considered as a relatively autonomous historical period, that according to
certain scholars1 is extended from 200 A.D. to 700 A.D., while according to others2, it is
encompassed from 395 A.D. to 600 A.D.. The corpus of late antique cartography com-
prises two categories of sources: sources in written form (itineraria scripta) and depicted
documents (itineraria picta). The itineraria scripta, compiled in Latin, were works de-
signed to provide assistance for travelers. They recorded a network of itineraries over a
vast area and listed the cities and stations on the routes that crisscrossed the empire, to-
1 Brown 1989: 10-11.
2 Cameron 1993: 5-7 .
e-Perimetron, Vol. 2, No. 3, Summer 2007 [160-172] www.e-perimetron.org | ISSN 1790-3769
[162]
gether with the distances between them. The Itinerarium of Antoninus deals with the land
and sea routes from western into Eastern Europe, from Gadeira (Cadiz, SW Spain) to
Caesarea in Palestine and from the Crimea to Alexandria. It must have taken its final form
between 280 and 290 and is thought to be based on the figures provided by the depart-
ment responsible for the cursus publicus, the roman imperial road office.3 In the early
Byzantine period, especially after the 4th century, with the barbarian raids and in particu-
lar, the founding of Constantinople, a more general need emerged for knowledge of the
world: for travel, itineraries, and cartographic descriptions. To the political and economic
incentives was now added the desire of the pilgrims of the new Christian world to travel
east to the Holy Land.4 The itinerarium Burdigalensis, dealing with the route from Bor-
deaux to Jerusalem records also the cities, towns, stations (mansiones), and points where
horses could be changed (mutationes), and was drawn up in 335. 5 Another known Chris-
tian itinerary is the Itinerarium Egeriae ad loca sancta6 , made by the pilgrim Aitheria
from Spanish Galicia in the 380 A.D.7
The itineraria scripta were closely associated with the production of road maps. Accord-
ing to the military manual of Vegetius (383–395), military commanders possessed itiner-
aria that not only were written (scripta) but also contained drawings in color (picta)8.
These maps were used with a multitude of functions, including the use of maps as cadas-
tral and legal records, as aids to travellers, to commemorate military and religious events,
as strategic documents, as political propaganda and for academic and educational pur-
poses.9 Also, the display of world maps was part of an ideology of extended rule, used
both by the emperor Theodosius II at Constantinople, in the 5th century, and later by Pope
Zachary II in the Lateran Palace at Rome, in the 8th.10
The above-mentioned corpus is not represented in the WWW in his totality. Concerning
the written sources, the Itinerarium Antoninii is absent, so one has to individuate it in its
published form, while the Christian itineraries are present, published from Cristus Rex,
the Vatican Portal in the Web.11 From the category of depicted sources, only two such
“illustrated” maps have survived to the present day: the first is the Tabula Peutingeriana
3 Miller 1964: LΙV-LV.
4 Avramea 2002: 65-72.
5 Dilke 1985: 128-129.
6 http://www.fh-augsburg.de/~harsch/Chronologia/Lspost 04/Egeria/ege_it 00.html (12/04/2005,
Bibliotheca Augustana)
7 Cardini 1987: 333-341.
8 Vegetii epitoma rei militaris III,6), Primum itineraria omnium regionum, in quibus bellum geritur,
plenissime debet habere perscripta, ita ut locorum interualla non solum passuum numero sed etiam
uiarum qualitate perdiscat, conpendia deuerticula montes flumina ad fidem descripta consideret, usque
eo, ut sollertiores duces itineraria prouinciarum, in quibus necessitas gerebatur, non tantum adnotata
sed etiam picta habuisse firmentur, ut non solum consilio mentis uerum aspectu oculorum uiam profec-
turus eligeret. http://www.fh-augsburg.de/~harsch/Chronologia/Lspost04/Vegetius/veg_epi3.html#n1
(12/04/2005, Bibliotheca Augustana)
9 Dilke 1987: 252-57.
10 Brodersen 1999:557.
11 http://www.christusrex.org/www1/ofm/pilgr/bord/10Bord01Lat.html
e-Perimetron, Vol. 2, No. 3, Summer 2007 [160-172] www.e-perimetron.org | ISSN 1790-3769
[163]
(Codex Vindobonensis 324) and the second, the so-called Dura Europos parchment
(Paris, Bibl. Nat., suppl. Gr. 1354.5), which is absent in the Web and can be found only in
analogue form.12 We have chosen as case study, a static view-only map, namely the digi-
tal publication in the WWW of the Tabula Peutingeriana, made by the Biblioteca Augus-
tana of Augsburg University.13
Tabula Peutingeriana
The object of the study is focused on the cartographic genre of itineraria picta and more
specifically on the Tabula Peutingeriana, a road map prepared in order to show the roads
of the empire over a total distance of 104,000 km. The original map was compiled be-
tween 335 and 366, but it was based on older sources and on information provided by the
late roman cursus publicus office. It also contains subsequent additions.
The Tabula Peutingeriana (Cod. Vindobonensis 324) is a long narrow parchment roll,
6,75 m long and 34 cm wide, that constitutes the more complete copy of depicted travel-
ling guide that has been come to us. It contains the network the main roads (about
100.000 km), the network of settlements, of overnight stations (mansiones) and stations of
horse changing that were found in the routes that crossed the late empire. A number of
natural and cultural characteristics are also recorded, such as, rivers, mountains and for-
ests, distances between nodes, public buildings, holy places, thermal baths, etc.14 The
digital copy of the Biblioteca Augustana emanates from 1888 Konrad Miller’s publication
and has two advantages: first, it is divided in 14 individual parts, representing in sequence
the fragments of the map, a choice, that makes the study easier and the screen readability
of text and graphics acceptable. Secondly, being a static view-only bitmap map in a scale
1:2 and in a resolution of 150 dpi, it obtains the original dimension in acceptable quality
in the standard screen resolution of 72 dpi, especially concerning previous analog publica-
tions. Of course, in order to obtain more readable magnified details it is possible to re-
sample the bitmap at print resolution of 300 dpi, crop them at the desired dimension and
present them as second level hyper-text links. A choice has been made to select fragments
of the map that correspond to the geographic regions of Balkan Peninsula, in order to
limit the width of the study. In regard to the representational system used in the map, we
have grouped our observations in three levels of geographical space: interregional, re-
gional level and urban level.
Interregional level
The main interregional axes of the road network in the Balkan peninsula in late antiquity
were two: first, the diagonal military road, the via militaris, also called by the Byzantines
‘imperial road’ (Bασιλική Oδός), ran from northwest to southeast and was the principal
axis connecting Constantinople with the West. This road was the continuation of the great
12 Dilke 1985:113-129.
13 http://www.fh-augsburg.de/~harsch/Chronologia/Lspost03/Tabula/tab_intr.html ( 09/03/2006)
14 Dilke 1987: 238-42.
e-Perimetron, Vol. 2, No. 3, Summer 2007 [160-172] www.e-perimetron.org | ISSN 1790-3769
[164]
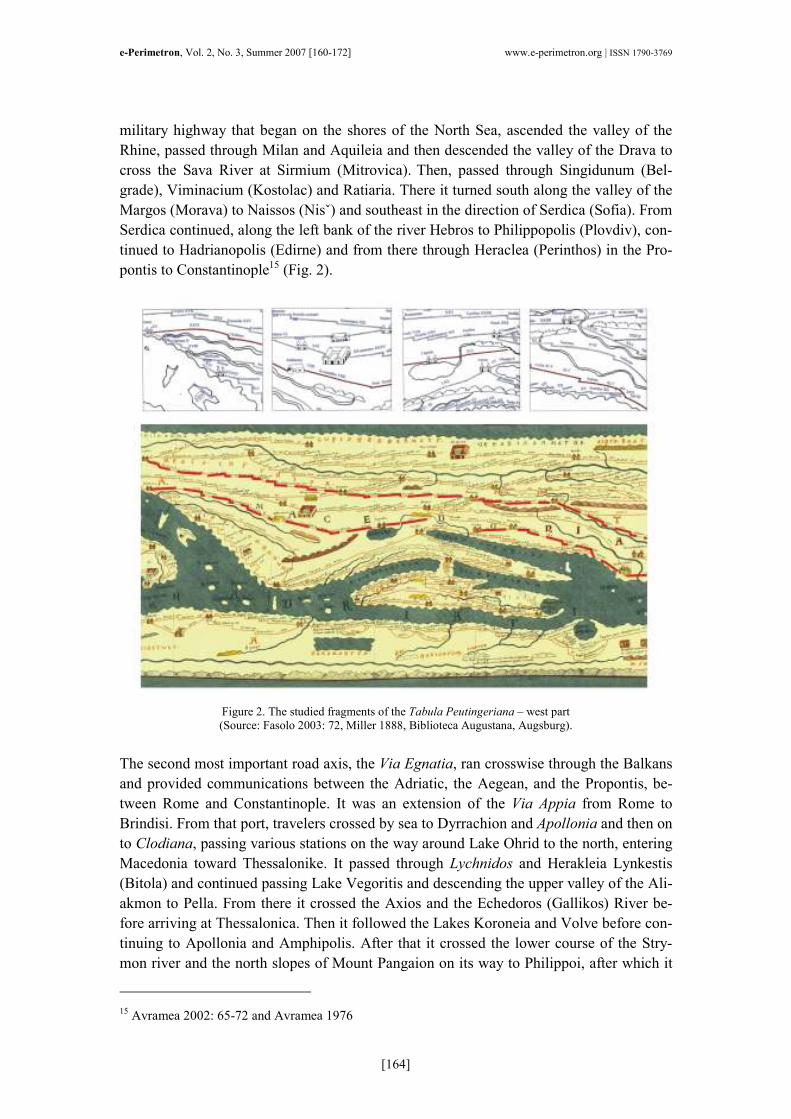
military highway that began on the shores of the North Sea, ascended the valley of the
Rhine, passed through Milan and Aquileia and then descended the valley of the Drava to
cross the Sava River at Sirmium (Mitrovica). Then, passed through Singidunum (Bel-
grade), Viminacium (Kostolac) and Ratiaria. There it turned south along the valley of the
Margos (Morava) to Naissos (Nisˇ) and southeast in the direction of Serdica (Sofia). From
Serdica continued, along the left bank of the river Hebros to Philippopolis (Plovdiv), con-
tinued to Hadrianopolis (Edirne) and from there through Heraclea (Perinthos) in the Pro-
pontis to Constantinople15 (Fig. 2).
Figure 2. The studied fragments of the Tabula Peutingeriana – west part
(Source: Fasolo 2003: 72, Miller 1888, Biblioteca Augustana, Augsburg).
The second most important road axis, the Via Egnatia, ran crosswise through the Balkans
and provided communications between the Adriatic, the Aegean, and the Propontis, be-
tween Rome and Constantinople. It was an extension of the Via Appia from Rome to
Brindisi. From that port, travelers crossed by sea to Dyrrachion and Apollonia and then on
to Clodiana, passing various stations on the way around Lake Ohrid to the north, entering
Macedonia toward Thessalonike. It passed through Lychnidos and Herakleia Lynkestis
(Bitola) and continued passing Lake Vegoritis and descending the upper valley of the Ali-
akmon to Pella. From there it crossed the Axios and the Echedoros (Gallikos) River be-
fore arriving at Thessalonica. Then it followed the Lakes Koroneia and Volve before con-
tinuing to Apollonia and Amphipolis. After that it crossed the lower course of the Stry-
mon river and the north slopes of Mount Pangaion on its way to Philippoi, after which it
15 Avramea 2002: 65-72 and Avramea 1976
e-Perimetron, Vol. 2, No. 3, Summer 2007 [160-172] www.e-perimetron.org | ISSN 1790-3769
[165]
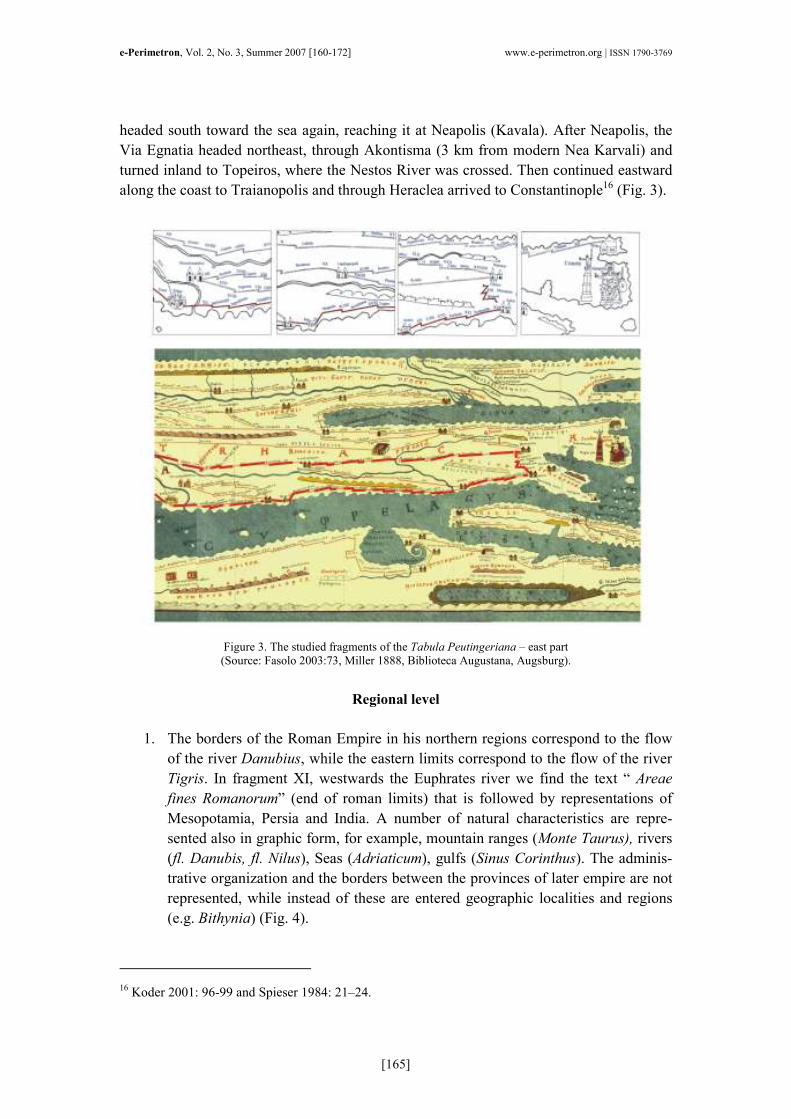
headed south toward the sea again, reaching it at Neapolis (Kavala). After Neapolis, the
Via Egnatia headed northeast, through Akontisma (3 km from modern Nea Karvali) and
turned inland to Topeiros, where the Nestos River was crossed. Then continued eastward
along the coast to Traianopolis and through Heraclea arrived to Constantinople16 (Fig. 3).
Figure 3. The studied fragments of the Tabula Peutingeriana – east part
(Source: Fasolo 2003:73, Miller 1888, Biblioteca Augustana, Augsburg).
Regional level
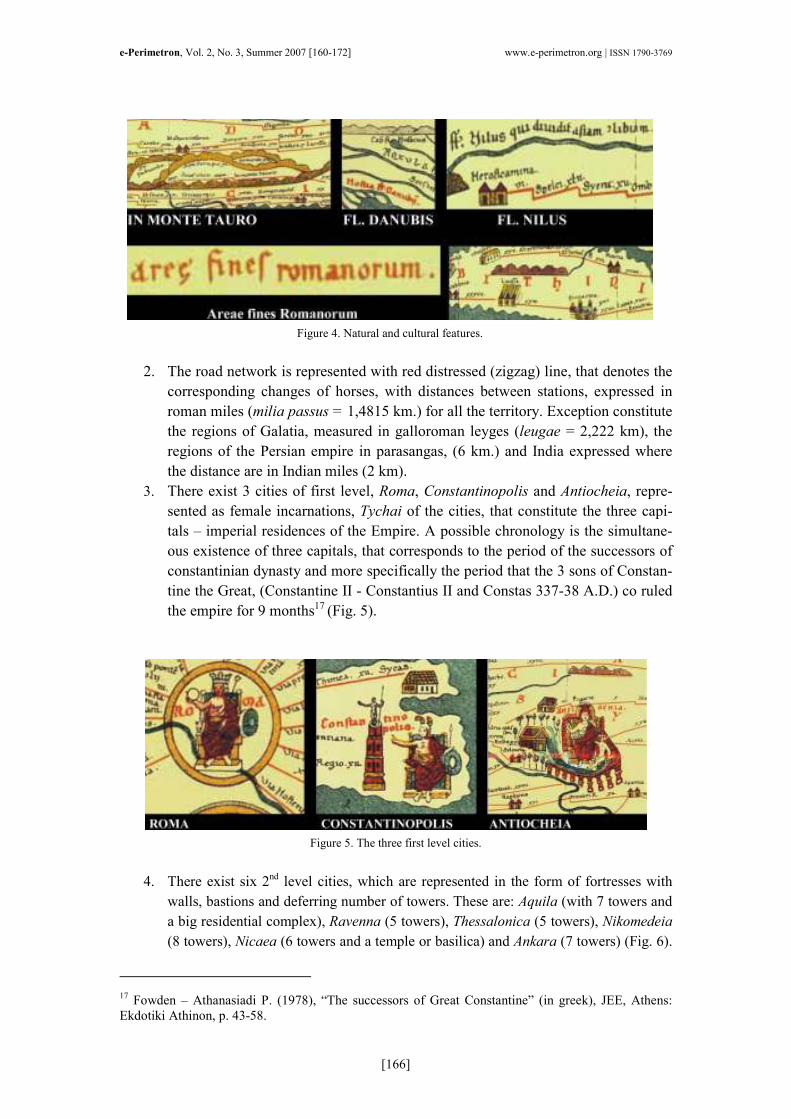
1. The borders of the Roman Empire in his northern regions correspond to the flow
of the river Danubius, while the eastern limits correspond to the flow of the river
Tigris. In fragment XI, westwards the Euphrates river we find the text “ Areae
fines Romanorum” (end of roman limits) that is followed by representations of
Mesopotamia, Persia and India. A number of natural characteristics are repre-
sented also in graphic form, for example, mountain ranges (Monte Taurus), rivers
(fl. Danubis, fl. Nilus), Seas (Adriaticum), gulfs (Sinus Corinthus). The adminis-
trative organization and the borders between the provinces of later empire are not
represented, while instead of these are entered geographic localities and regions
(e.g. Bithynia) (Fig. 4).
16 Koder 2001: 96-99 and Spieser 1984: 21–24.
e-Perimetron, Vol. 2, No. 3, Summer 2007 [160-172] www.e-perimetron.org | ISSN 1790-3769
[166]
Figure 4. Natural and cultural features.
2. The road network is represented with red distressed (zigzag) line, that denotes the
corresponding changes of horses, with distances between stations, expressed in
roman miles (milia passus = 1,4815 km.) for all the territory. Exception constitute
the regions of Galatia, measured in galloroman leyges (leugae = 2,222 km), the
regions of the Persian empire in parasangas, (6 km.) and India expressed where
the distance are in Indian miles (2 km).
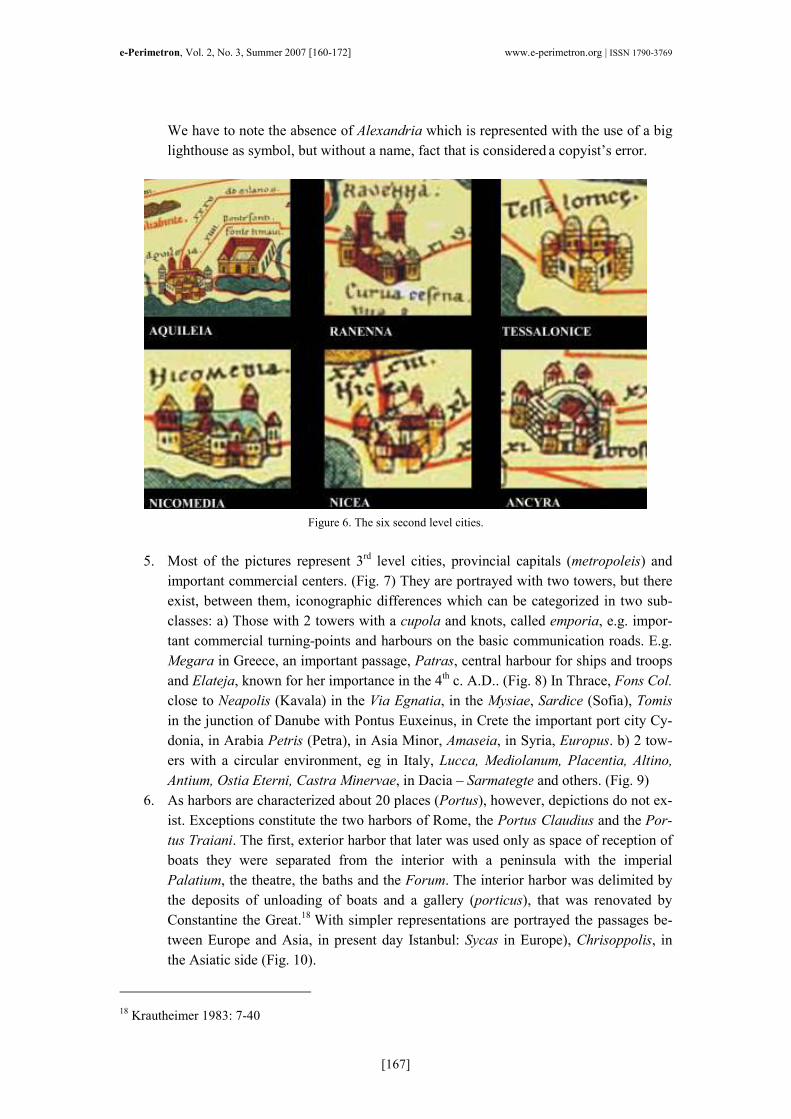
3. There exist 3 cities of first level, Roma, Constantinopolis and Antiocheia, repre-
sented as female incarnations, Tychai of the cities, that constitute the three capi-
tals – imperial residences of the Empire. A possible chronology is the simultane-
ous existence of three capitals, that corresponds to the period of the successors of
constantinian dynasty and more specifically the period that the 3 sons of Constan-
tine the Great, (Constantine II - Constantius II and Constas 337-38 A.D.) co ruled
the empire for 9 months17 (Fig. 5).
Figure 5. The three first level cities.
4. There exist six 2nd level cities, which are represented in the form of fortresses with
walls, bastions and deferring number of towers. These are: Aquila (with 7 towers and
a big residential complex), Ravenna (5 towers), Thessalonica (5 towers), Nikomedeia
(8 towers), Nicaea (6 towers and a temple or basilica) and Ankara (7 towers) (Fig. 6).
17 Fowden – Athanasiadi P. (1978), “The successors of Great Constantine” (in greek), JEE, Athens:
Ekdotiki Athinon, p. 43-58.
e-Perimetron, Vol. 2, No. 3, Summer 2007 [160-172] www.e-perimetron.org | ISSN 1790-3769
[167]
We have to note the absence of Alexandria which is represented with the use of a big
lighthouse as symbol, but without a name, fact that is considered a copyist’s error.
Figure 6. The six second level cities.
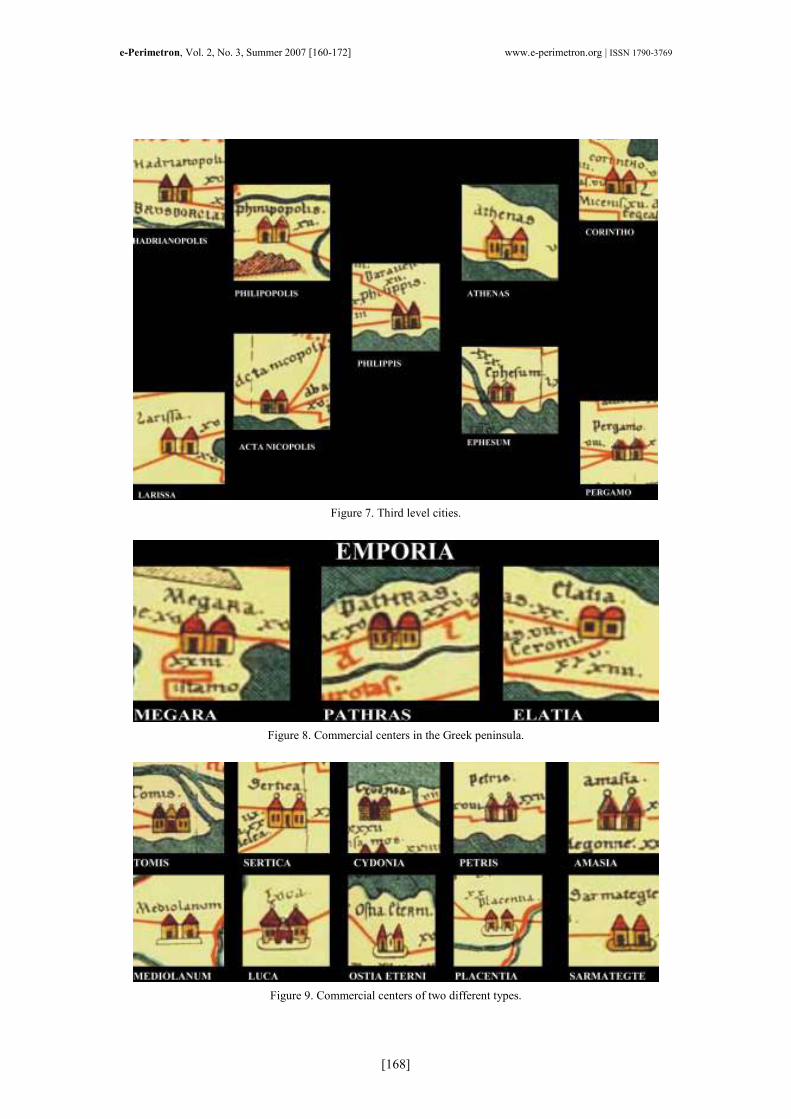
5. Most of the pictures represent 3rd level cities, provincial capitals (metropoleis) and
important commercial centers. (Fig. 7) They are portrayed with two towers, but there
exist, between them, iconographic differences which can be categorized in two sub-
classes: a) Those with 2 towers with a cupola and knots, called emporia, e.g. impor-
tant commercial turning-points and harbours on the basic communication roads. E.g.
Megara in Greece, an important passage, Patras, central harbour for ships and troops
and Elateja, known for her importance in the 4th c. A.D.. (Fig. 8) In Thrace, Fons Col.
close to Neapolis (Kavala) in the Via Egnatia, in the Mysiae, Sardice (Sofia), Tomis
in the junction of Danube with Pontus Euxeinus, in Crete the important port city Cy-
donia, in Arabia Petris (Petra), in Asia Minor, Amaseia, in Syria, Europus. b) 2 tow-
ers with a circular environment, eg in Italy, Lucca, Mediolanum, Placentia, Altino,
Antium, Ostia Eterni, Castra Minervae, in Dacia – Sarmategte and others. (Fig. 9)
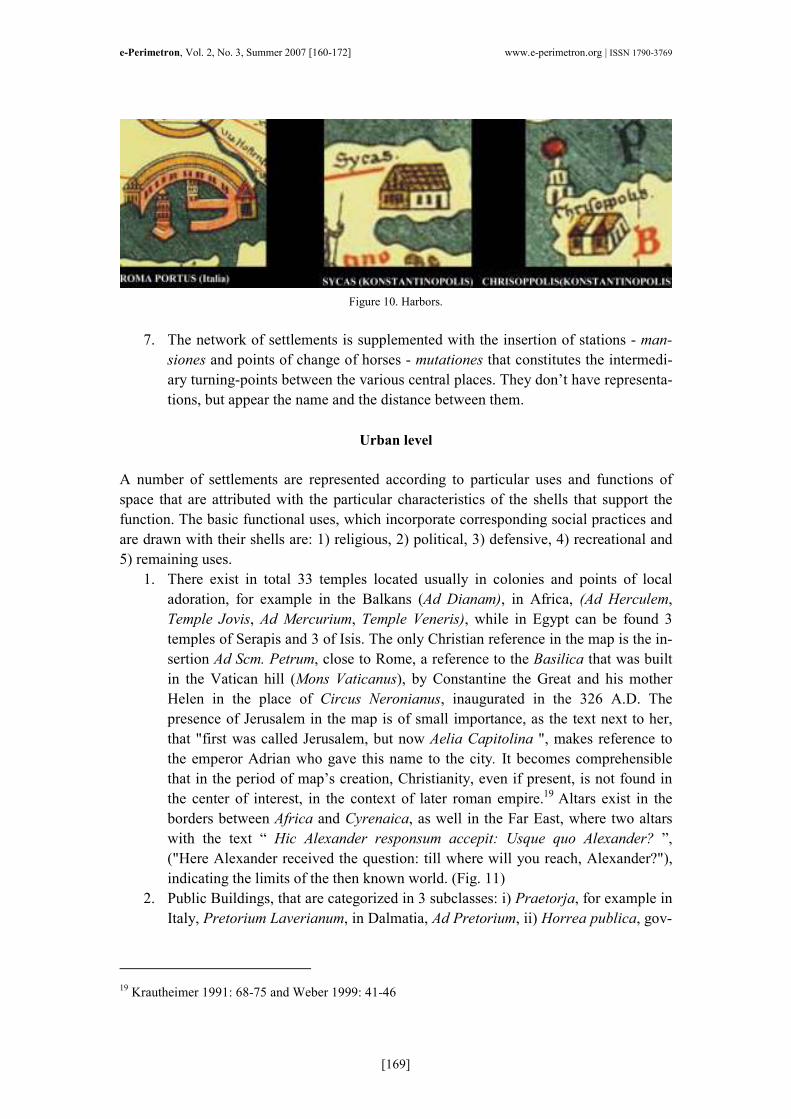
6. As harbors are characterized about 20 places (Portus), however, depictions do not ex-
ist. Exceptions constitute the two harbors of Rome, the Portus Claudius and the Por-
tus Traiani. The first, exterior harbor that later was used only as space of reception of
boats they were separated from the interior with a peninsula with the imperial
Palatium, the theatre, the baths and the Forum. The interior harbor was delimited by
the deposits of unloading of boats and a gallery (porticus), that was renovated by
Constantine the Great.18
With simpler representations are portrayed the passages be-
tween Europe and Asia, in present day Istanbul: Sycas in Europe), Chrisoppolis, in
the Asiatic side (Fig. 10).
18 Krautheimer 1983: 7-40
e-Perimetron, Vol. 2, No. 3, Summer 2007 [160-172] www.e-perimetron.org | ISSN 1790-3769
[168]
Figure 7. Third level cities.
Figure 8. Commercial centers in the Greek peninsula.
Figure 9. Commercial centers of two different types.
e-Perimetron, Vol. 2, No. 3, Summer 2007 [160-172] www.e-perimetron.org | ISSN 1790-3769
[169]
Figure 10. Harbors.
7. The network of settlements is supplemented with the insertion of stations - man-
siones and points of change of horses - mutationes that constitutes the intermedi-
ary turning-points between the various central places. They don’t have representa-
tions, but appear the name and the distance between them.
Urban level
A number of settlements are represented according to particular uses and functions of
space that are attributed with the particular characteristics of the shells that support the
function. The basic functional uses, which incorporate corresponding social practices and
are drawn with their shells are: 1) religious, 2) political, 3) defensive, 4) recreational and
5) remaining uses.
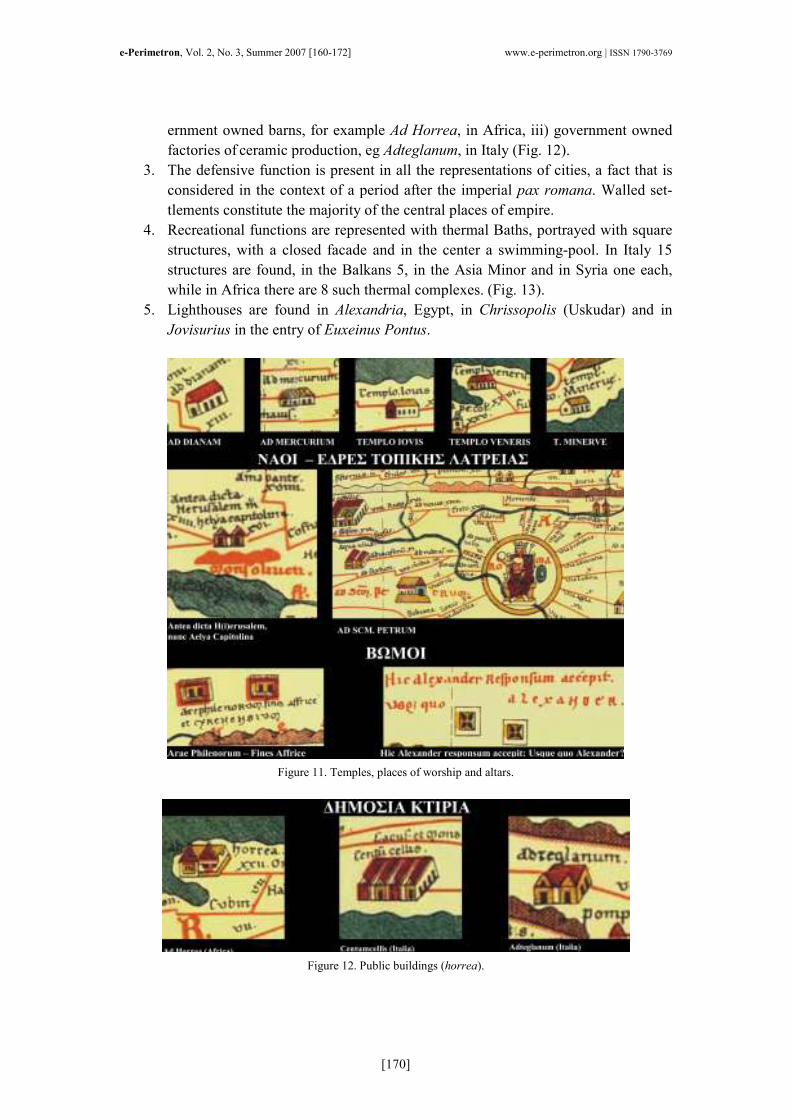
1. There exist in total 33 temples located usually in colonies and points of local
adoration, for example in the Balkans (Ad Dianam), in Africa, (Ad Herculem,
Temple Jovis, Ad Mercurium, Temple Veneris), while in Egypt can be found 3
temples of Serapis and 3 of Isis. The only Christian reference in the map is the in-
sertion Ad Scm. Petrum, close to Rome, a reference to the Basilica that was built
in the Vatican hill (Mons Vaticanus), by Constantine the Great and his mother
Helen in the place of Circus Neronianus, inaugurated in the 326 A.D. The
presence of Jerusalem in the map is of small importance, as the text next to her,
that "first was called Jerusalem, but now Aelia Capitolina ", makes reference to
the emperor Adrian who gave this name to the city. It becomes comprehensible
that in the period of map’s creation, Christianity, even if present, is not found in
the center of interest, in the context of later roman empire.19 Altars exist in the
borders between Africa and Cyrenaica, as well in the Far East, where two altars
with the text “ Hic Alexander responsum accepit: Usque quo Alexander? ”,
("Here Alexander received the question: till where will you reach, Alexander?"),
indicating the limits of the then known world. (Fig. 11)
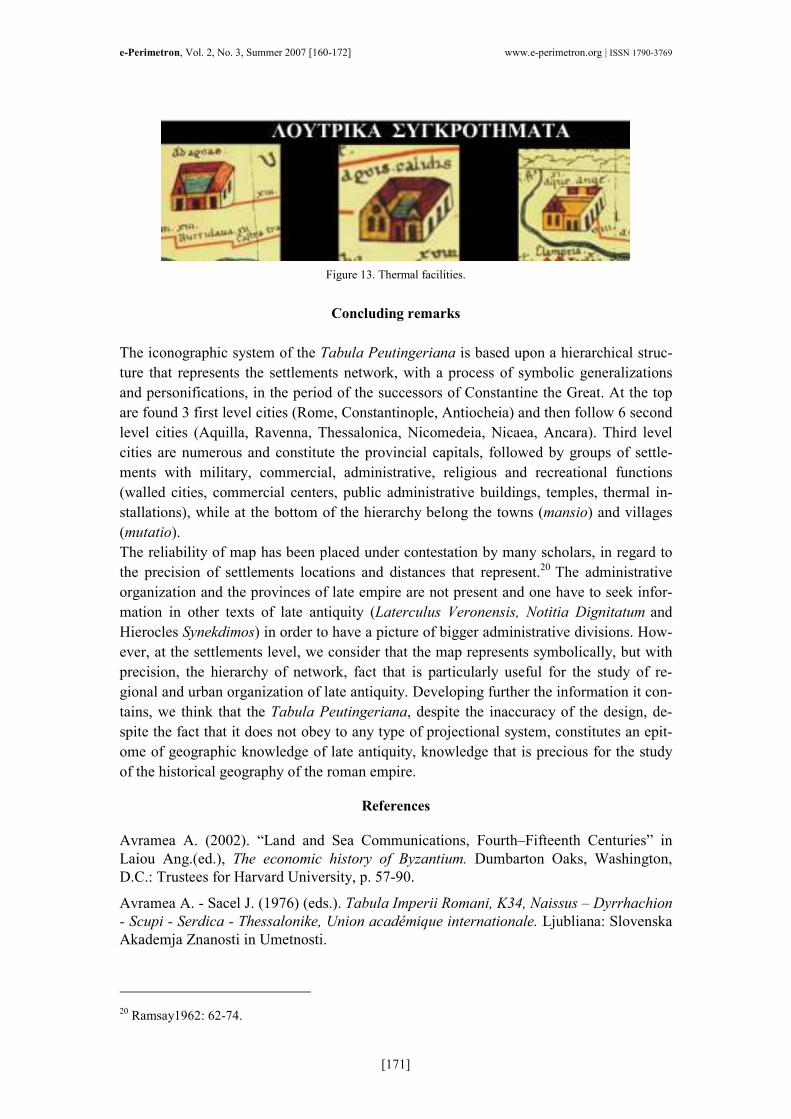
2. Public Buildings, that are categorized in 3 subclasses: i) Praetorja, for example in
Italy, Pretorium Laverianum, in Dalmatia, Ad Pretorium, ii) Horrea publica, gov-
19 Krautheimer 1991: 68-75 and Weber 1999: 41-46
e-Perimetron, Vol. 2, No. 3, Summer 2007 [160-172] www.e-perimetron.org | ISSN 1790-3769
[170]
ernment owned barns, for example Ad Horrea, in Africa, iii) government owned
factories of ceramic production, eg Adteglanum, in Italy (Fig. 12).
3. The defensive function is present in all the representations of cities, a fact that is
considered in the context of a period after the imperial pax romana. Walled set-
tlements constitute the majority of the central places of empire.
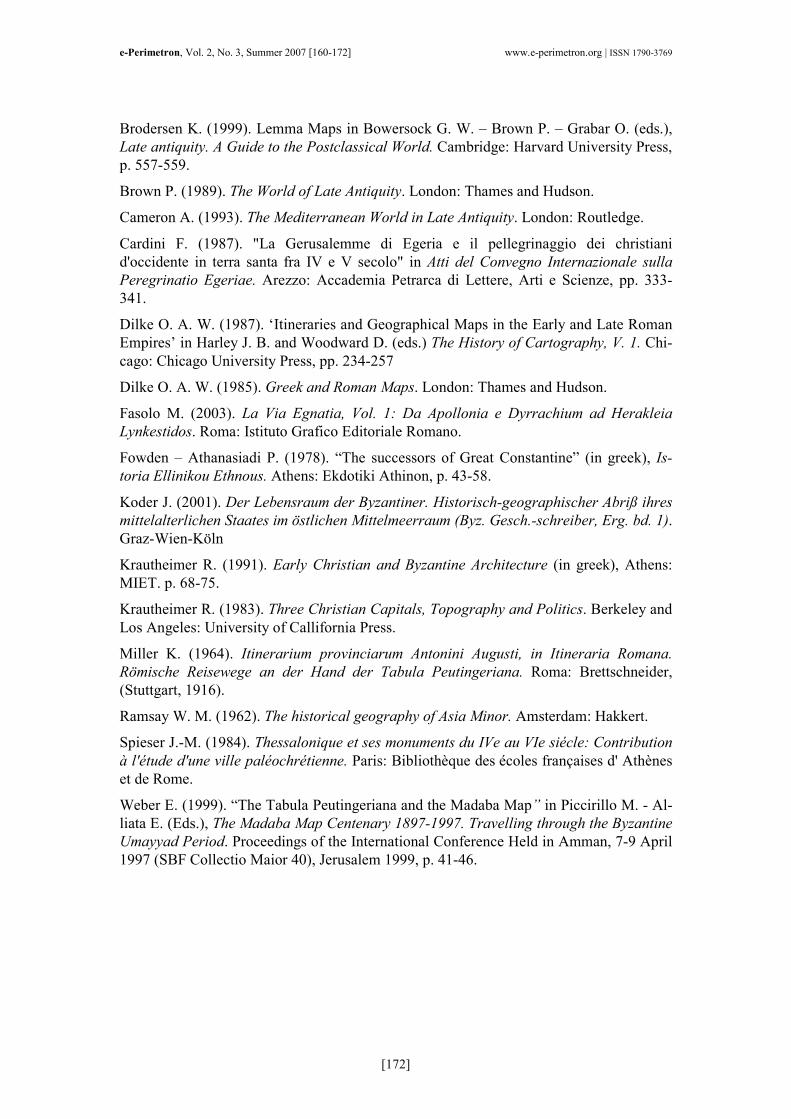
4. Recreational functions are represented with thermal Baths, portrayed with square
structures, with a closed facade and in the center a swimming-pool. In Italy 15
structures are found, in the Balkans 5, in the Asia Minor and in Syria one each,
while in Africa there are 8 such thermal complexes. (Fig. 13).
5. Lighthouses are found in Alexandria, Egypt, in Chrissopolis (Uskudar) and in
Jovisurius in the entry of Euxeinus Pontus.
Figure 11. Temples, places of worship and altars.
Figure 12. Public buildings (horrea).
e-Perimetron, Vol. 2, No. 3, Summer 2007 [160-172] www.e-perimetron.org | ISSN 1790-3769
[171]
Figure 13. Thermal facilities.
Concluding remarks
The iconographic system of the Tabula Peutingeriana is based upon a hierarchical struc-
ture that represents the settlements network, with a process of symbolic generalizations
and personifications, in the period of the successors of Constantine the Great. At the top
are found 3 first level cities (Rome, Constantinople, Antiocheia) and then follow 6 second
level cities (Aquilla, Ravenna, Thessalonica, Nicomedeia, Nicaea, Ancara). Third level
cities are numerous and constitute the provincial capitals, followed by groups of settle-
ments with military, commercial, administrative, religious and recreational functions
(walled cities, commercial centers, public administrative buildings, temples, thermal in-
stallations), while at the bottom of the hierarchy belong the towns (mansio) and villages
(mutatio).
The reliability of map has been placed under contestation by many scholars, in regard to
the precision of settlements locations and distances that represent.20 The administrative
organization and the provinces of late empire are not present and one have to seek infor-
mation in other texts of late antiquity (Laterculus Veronensis, Notitia Dignitatum and
Hierocles Synekdimos) in order to have a picture of bigger administrative divisions. How-
ever, at the settlements level, we consider that the map represents symbolically, but with
precision, the hierarchy of network, fact that is particularly useful for the study of re-
gional and urban organization of late antiquity. Developing further the information it con-
tains, we think that the Tabula Peutingeriana, despite the inaccuracy of the design, de-
spite the fact that it does not obey to any type of projectional system, constitutes an epit-
ome of geographic knowledge of late antiquity, knowledge that is precious for the study
of the historical geography of the roman empire.
References
Avramea A. (2002). “Land and Sea Communications, Fourth–Fifteenth Centuries” in
Laiou Ang.(ed.), Τhe economic history of Byzantium. Dumbarton Oaks, Washington,
D.C.: Trustees for Harvard University, p. 57-90.
Avramea A. - Sacel J. (1976) (eds.). Tabula Imperii Romani, K34, Naissus – Dyrrhachion
- Scupi - Serdica - Thessalonike, Union académique internationale. Ljubliana: Slovenska
Akademja Znanosti in Umetnosti.
20 Ramsay1962: 62-74.
e-Perimetron, Vol. 2, No. 3, Summer 2007 [160-172] www.e-perimetron.org | ISSN 1790-3769
[172]
Brodersen K. (1999). Lemma Maps in Bowersock G. W. – Brown P. – Grabar O. (eds.),
Late antiquity. Α Guide to the Postclassical World. Cambridge: Harvard University Press,
p. 557-559.
Brown P. (1989). The World of Late Antiquity. London: Thames and Hudson.
Cameron A. (1993). The Mediterranean World in Late Antiquity. London: Routledge.
Cardini F. (1987). "La Gerusalemme di Egeria e il pellegrinaggio dei christiani
d'occidente in terra santa fra IV e V secolo" in Atti del Convegno Internazionale sulla
Peregrinatio Egeriae. Arezzo: Accademia Petrarca di Lettere, Arti e Scienze, pp. 333-
341.
Dilke O. A. W. (1987). ‘Itineraries and Geographical Maps in the Early and Late Roman
Empires’ in Harley J. B. and Woodward D. (eds.) The History of Cartography, V. 1. Chi-
cago: Chicago University Press, pp. 234-257
Dilke O. A. W. (1985). Greek and Roman Maps. London: Thames and Hudson.
Fasolo M. (2003). La Via Egnatia, Vol. 1: Da Apollonia e Dyrrachium ad Herakleia
Lynkestidos. Roma: Istituto Grafico Editoriale Romano.
Fowden – Athanasiadi P. (1978). “The successors of Great Constantine” (in greek), Is-
toria Ellinikou Ethnous. Athens: Ekdotiki Athinon, p. 43-58.
Koder J. (2001). Der Lebensraum der Byzantiner. Historisch-geographischer Abriß ihres
mittelalterlichen Staates im östlichen Mittelmeerraum (Byz. Gesch.-schreiber, Erg. bd. 1).
Graz-Wien-Köln
Krautheimer R. (1991). Early Christian and Byzantine Architecture (in greek), Athens:
MIET. p. 68-75.
Krautheimer R. (1983). Three Christian Capitals, Topography and Politics. Berkeley and
Los Angeles: University of Callifornia Press.
Miller K. (1964). Itinerarium provinciarum Antonini Augusti, in Itineraria Romana.
Römische Reisewege an der Hand der Tabula Peutingeriana. Roma: Brettschneider,
(Stuttgart, 1916).
Ramsay W. M. (1962). The historical geography of Asia Minor. Amsterdam: Hakkert.
Spieser J.-M. (1984). Thessalonique et ses monuments du IVe au VIe siécle: Contribution
à l'étude d'une ville paléochrétienne. Paris: Bibliothèque des écoles françaises d' Athènes
et de Rome.
Weber E. (1999). “The Tabula Peutingeriana and the Madaba Map” in Piccirillo M. - Al-
liata E. (Eds.), The Madaba Map Centenary 1897-1997. Travelling through the Byzantine
Umayyad Period. Proceedings of the International Conference Held in Amman, 7-9 April
1997 (SBF Collectio Maior 40), Jerusalem 1999, p. 41-46.