The Structure and Operations of Social Enterprises in REDF ...
311
The Structure and Operations of Social Enterprises in REDF’s Social Innovation Fund Portfolio: Interim Report December 19, 2013 Nan Maxwell Dana Rotz Adam Dunn Linda Rosenberg Jacqueline Berman
Transcript of The Structure and Operations of Social Enterprises in REDF ...

The Structure and Operations of Social Enterprises in REDF’s Social Innovation Fund Portfolio: Interim Report
December 19, 2013
Nan Maxwell Dana Rotz Adam Dunn Linda Rosenberg Jacqueline Berman

This page has been left blank for double-sided copying.

Contract Number: REDF 11-011
Mathematica Reference Number: 40004.700
Submitted to: REDF 221 Main Street, Suite 1550 Oakland, CA 94105 Project Officer: Christina Garcia
Submitted by: Mathematica Policy Research 505 14th Street, Suite 800 Oakland, CA 94612-1475 Telephone: (510) 830-3700 Facsimile: (510) 830-3701 Project Director: Nan Maxwell
The Structure and Operations of Social Enterprises in REDF’s Social Innovation Fund Portfolio: Interim Report
December 19, 2013
Nan Maxwell Dana Rotz Adam Dunn Linda Rosenberg Jacqueline Berman

This page has been left blank for double-sided copying.

Disclaimer Mathematica Policy Research
iii
DISCLAIMER
This report was prepared for REDF. The views expressed are those of the authors and should not be attributed to REDF.

This page has been left blank for double-sided copying.
Acknowledgements Mathematica Policy Research
v
ACKNOWLEDGMENTS
The authors wish to acknowledge the contributions and support of REDF in this research. The advice and steadfast support of our project officer, Christina Garcia, greatly enhanced our ability to execute the study by facilitating communication with REDF staff, the organizations, and the social enterprises. We thank the REDF staff, who graciously answered our many questions with patience, gave thorough feedback and asked questions on monthly reports to stimulate our thinking, and provided their time in discussing the social enterprises and research: Nadia Anggraini, LaMecia Butler, Gordon Chan, Terri Feeley, Samra Haider, Carla Javits, Esther Kim, Tracy Lam-Hine, Anna Martin, Roxanne Miller, and Minakshi Radhakrishnan. The authors would also like to acknowledge several people at Mathematica who contributed to the study. Chrissie Grover-Roybal was the study’s master jack of all trades and worked closely with the sites to collect participant data, took extensive notes on five site visits, and served as the primary research assistant in pulling this report together. Mindy Hu visited and reported on three sites. Jessica McElroy and Kathryn Gonzales provided outstanding research assistance. Josh Haimson and Debbie Reed provided essential feedback at various points in the study. Sheena Flowers helped prepare this report, and Patricia Ciaccio provided editorial assistance. Finally, and most important, we acknowledge the cooperation and enthusiasm we received from the organizations. Although the individuals at the organizations and social enterprises who contributed to the study are too numerous to list individually, this study is made possible only through the generosity of their time in providing us with insights and in collecting data on their clients and social enterprise employees.

This page has been left blank for double-sided copying.

Contents Mathematica Policy Research
vii
CONTENTS
LIST OF ACRONYMS ............................................................................................................. XIII
EXECUTIVE SUMMARY ......................................................................................................... XV
1. Social enterprises served the hard-to-employ. ...........................................xvii 2. Most employees reported being satisfied with their social
enterprise work experience, perhaps because their lives appeared to improve after they obtained their position. ............................. xviii
3. The skill level of jobs in the social enterprise influenced the challenges in supporting employees. ......................................................... xix
4. The transitional model of employment presented implementation challenges for social enterprises. ............................................................... xix
5. Parent organizations and social enterprises face challenges in using data strategically. ............................................................................... xx
I INTRODUCTION ........................................................................................................ 1
A. REDF’s SIF Portfolio ............................................................................................ 2
1. Description of Organizations and Social Enterprises ..................................... 2 2. REDF Expectations of Parent Organizations in Its SIF Portfolio .................... 4
B. Mathematica Jobs Study ...................................................................................... 4
1. Logic Model for the Evaluation ...................................................................... 5 2. Data Collection and Analysis ......................................................................... 6 3. Limitations of the Research ........................................................................... 9
C. Structure of Report ............................................................................................... 9
II CHARACTERISTICS OF SOCIAL ENTERPRISE WORKERS ................................. 11
A. Social Enterprise Employees Face a Wide Range of Employment Barriers .............................................................................................................. 11
B. Social Enterprise Employees Have Backgrounds Suggesting Greater Barriers than Those Requesting Employment Services and Not Referred to Social Enterprise Employment......................................................... 17
C. Workers Who Did and Did Not Meet the Hours Requirement Are Similar ................................................................................................................ 20

Contents Mathematica Policy Research
viii
III SOCIAL ENTERPRISE OPERATIONS AND CHALLENGES .................................... 21
A. Supporting Employees was Challenging ............................................................ 22
B. Social Enterprises Struggled to Implement Transitional Employment ................. 26
C. Social Enterprises Faced Challenges Using Data Strategically .......................... 27
IV SOCIAL ENTERPRISE OUTPUTS AND INDIVIDUAL OUTCOMES ........................ 31
A. Social Enterprises in the MJS Made Progress Toward Employment Goals ................................................................................................................. 32
B. Time Spent Working in a Social Enterprise Varies across Programs and Individuals ................................................................................................... 33
C. Workers had Positive Experiences While Working in a Social Enterprise .......................................................................................................... 38
REFERENCES ......................................................................................................................... 43
APPENDIX A. COLLECTION AND ANALYSIS OF INDIVIDUAL-LEVEL DATA ...................... A.1
APPENDIX B. COLLECTION AND ANALYSIS OF ORGANIZATION-LEVEL INFORMATION ......................................................................................... B.1
APPENDIX C. DETAILED TABLES ........................................................................................ C.1
APPENDIX D. DATA COLLECTION INSTRUMENTS ............................................................. D.1

Tables Mathematica Policy Research
ix
TABLES
1 Description of Social Enterprises ............................................................................. xvi
I.1 Description of Social Enterprises ................................................................................ 3
II.1 Social Enterprise Structure ....................................................................................... 18
III.1 Soft Skills Development ............................................................................................ 22
III.2 Work and Life Supports ............................................................................................ 23
III.3 Program Models for Providing Life and Employment Supports ................................. 23
III.4 Work Activities, Skill Level, and Training Provided .................................................... 24
III.5 Implementation of Transitional Employment Models ................................................. 26
III.6 Organizational Tracking of Employee Progress ........................................................ 28
III.7 Organizational Tracking of Employee Transitions ..................................................... 29
IV.1 Social Enterprise Employment .................................................................................. 33
IV.2 Changes in Social Enterprise Employment: Average Monthly Employment .............. 33
IV.3 Worker Employment Length and Hours .................................................................... 34

This page has been left blank for double-sided copying.
Figures Mathematica Policy Research
FIGURES
1 Social Enterprise Employees ...................................................................................xvii
2 Activities Before and After Social Enterprise Employment....................................... xviii
I.1 Logic Model for the MJS Evaluation ............................................................................ 5
I.2 Pathway to MJS .......................................................................................................... 6
II.1 Employment History When Hired by Social Enterprise .............................................. 12
II.2 Reasons Given for Not Working in Week Before Hire ............................................... 12
II.3 Housing Arrangements Used in Year Before Being Hired by the Social Enterprise ................................................................................................................. 13
II.4 Criminal History of Respondents When Hired by the Social Enterprise ..................... 13
II.5 Income Sources When Hired by the Social Enterprise .............................................. 15
II.6 Share of Income at Hire from Different Sources ........................................................ 15
II.7 Number of Major Barriers at Hire .............................................................................. 16
II.8 Number of Major Barriers at Hire: By Organization ................................................... 16
II.9 Past Participation in Training Programs at Hire ......................................................... 17
II.10 Characteristics of People Hired by Social Enterprise and Other Employment Service Applicants ................................................................................ 19
II.11 Employment Barriers of People Hired by Social Enterprise and Other Employment Service Applicants ................................................................................ 20
III.1 Staff Attitudes Toward Social Enterprise Data Capacity and Use of Data ................. 29
IV.1 Total Hours Worked in the Social Enterprise ............................................................. 34
IV.2 Regression-Adjusted Total Hours Worked, by Organization ...................................... 35
IV.3 Stated Reason for Leaving Social Enterprise ............................................................ 36
IV.4 Average Total Hours Worked, by Stated Reason for Leaving Social Enterprise ................................................................................................................. 37
IV.5 Regression-Adjusted Reason for Leaving Social Enterprise, by Organization ............................................................................................................. 38
IV.6 Satisfaction with Social Enterprise Job Attributes ...................................................... 39
IV.7 Composition of Income at Hire and Exit .................................................................... 40

This page has been left blank for double-sided copying.
List of Acronyms Mathematica Policy Research
xiii
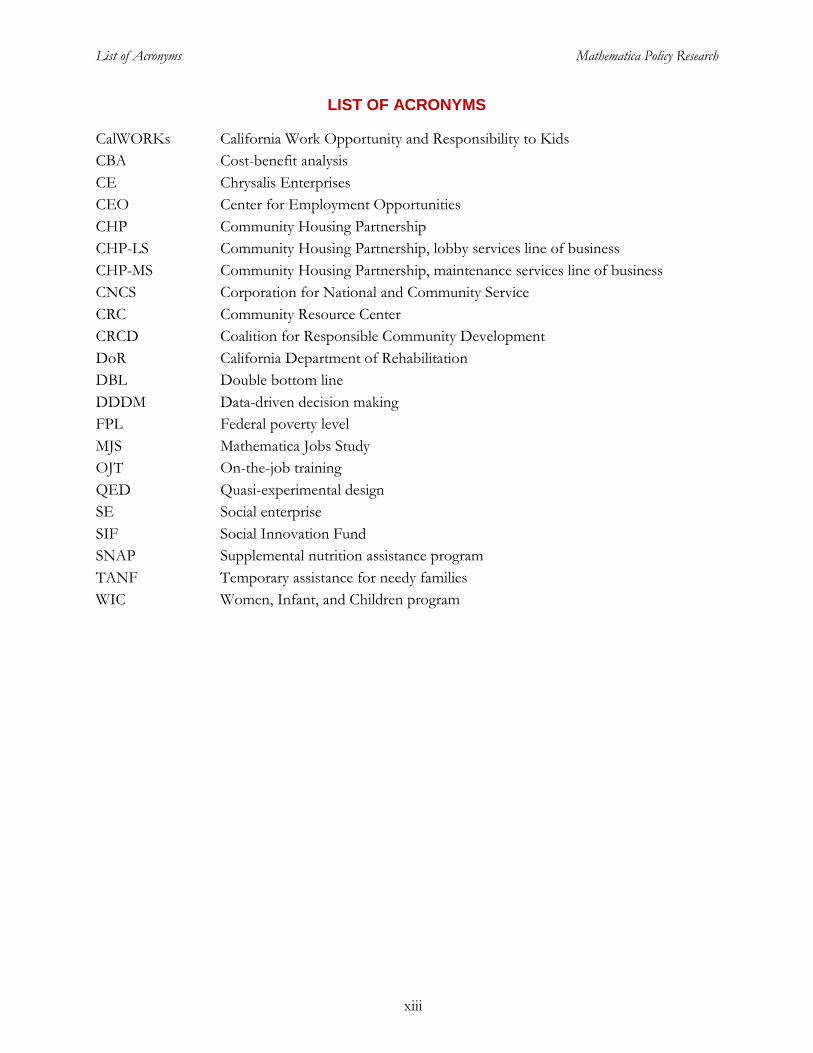
LIST OF ACRONYMS
CalWORKs California Work Opportunity and Responsibility to Kids CBA Cost-benefit analysis CE Chrysalis Enterprises CEO Center for Employment Opportunities CHP Community Housing Partnership CHP-LS Community Housing Partnership, lobby services line of business CHP-MS Community Housing Partnership, maintenance services line of business CNCS Corporation for National and Community Service CRC Community Resource Center CRCD Coalition for Responsible Community Development DoR California Department of Rehabilitation DBL Double bottom line DDDM Data-driven decision making FPL Federal poverty level MJS Mathematica Jobs Study OJT On-the-job training QED Quasi-experimental design SE Social enterprise SIF Social Innovation Fund SNAP Supplemental nutrition assistance program TANF Temporary assistance for needy families WIC Women, Infant, and Children program

This page has been left blank for double-sided copying.
Executive Summary Mathematica Policy Research
xv
EXECUTIVE SUMMARY
In 2011, REDF placed social enterprise (SE) employment at the heart of its five-year strategy to transform how people with many employment barriers transition into the workforce. SEs are businesses that sell goods and services that the marketplace demands in order to intentionally employ individuals who would otherwise face bleak prospects of ever getting a job. By giving people access to jobs they might not secure on their own, SEs seek to provide real-world work experience, improve earnings, and help employees rely less on government benefits, thereby easing taxpayer burden. SEs are designed to develop workers’ skills and provide them with resume-building experience, helping them secure other jobs and increase their earnings and access to additional benefits (for example, healthcare). By providing employees with meaningful jobs and supports, SEs also attempt to improve employees’ lives and well-being while setting them on a path toward greater self-sufficiency.
In support of its strategy, REDF launched a new portfolio, with funding from the Social Innovation Fund (SIF) of the Corporation for National and Community Service and other philanthropic support from corporations, foundations, and individuals. It built its portfolio using a competitive process to select a mix of well-run nonprofit organizations in the early stages of starting an SE or already running businesses that intentionally employ those facing substantial employment challenges, including homelessness, criminal convictions, and mental health disabilities. As part of its SIF award, REDF committed to achieve employment for 2,500 workers by 2015, with employment defined as at least 32 hours of work within a four-week period. Based on evidence that long-term employment prospects are significantly improved if an individual maintains employment for at least a year, REDF set a corollary goal that at least 70 percent of those employed in SEs would remain employed for at least twelve months through a combination of SE and employment outside the SE. Organizations selected to be part of the SIF portfolio were expected to contribute to these targets.
REDF also committed to conducting an evaluation to support the success of the SE approach. It selected Mathematica Policy Research to monitor SE progress toward achieving employment targets and to design and implement the evaluation. The evaluation, which is called the Mathematica Jobs Study or MJS, began on October 1, 2011, and will end on December 30, 2014. It is structured to address the general research question: How do social enterprises serve individuals with multiple barriers to employment? and contains four integrated components: (1) an implementation study of eight organizations that received REDF SIF funding in January 2012, (2) an outcomes study to follow individuals hired in seven of these organizations through about one year after their hire, (3) a quasi-experimental design study to assess the impact of SE employment, and (4) a cost-benefit analysis. A final report, which will focus on the last three components, will be available in December 2014.
This report highlights the initial findings from the evaluation. The research upon which it is based examines SE employee characteristics, SE operations and the implementation challenges they faced, and outcomes of individual employees as they left the SE. This executive summary provides an overview of the SEs we sought to better understand (Section A); the data and methods used in the research, including their limitations (Section B); the lessons learned from the evaluation’s research findings (Section C), and the issues that need to be explored further (Section D).
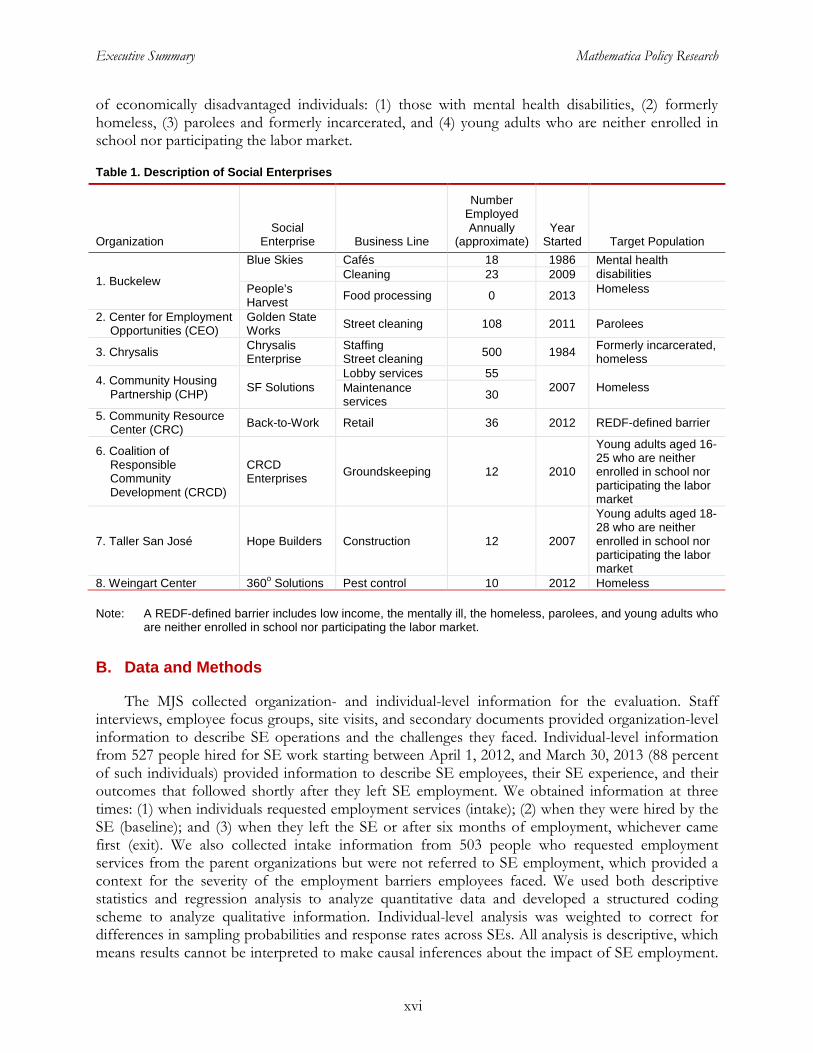
A. Social Enterprises in the Mathematica Jobs Study
The eight organizations in the MJS housed nine SEs operating 12 lines of business (Table 1). The portfolio contains SEs with a wide divergence in size and age and that targeted four populations
Executive Summary Mathematica Policy Research
xvi
of economically disadvantaged individuals: (1) those with mental health disabilities, (2) formerly homeless, (3) parolees and formerly incarcerated, and (4) young adults who are neither enrolled in school nor participating the labor market.
Table 1. Description of Social Enterprises
Organization Social
Enterprise Business Line
Number Employed Annually
(approximate) Year
Started Target Population
1. Buckelew
Blue Skies Cafés 18 1986 Mental health disabilities Cleaning 23 2009
People’s Harvest Food processing 0 2013 Homeless
2. Center for Employment Opportunities (CEO)
Golden State Works Street cleaning 108 2011 Parolees
3. Chrysalis Chrysalis Enterprise
Staffing Street cleaning 500 1984 Formerly incarcerated,
homeless
4. Community Housing Partnership (CHP) SF Solutions
Lobby services 55 2007 Homeless Maintenance
services 30
5. Community Resource Center (CRC) Back-to-Work Retail 36 2012 REDF-defined barrier
6. Coalition of Responsible Community Development (CRCD)
CRCD Enterprises Groundskeeping 12 2010
Young adults aged 16-25 who are neither enrolled in school nor participating the labor market
7. Taller San José Hope Builders Construction 12 2007
Young adults aged 18-28 who are neither enrolled in school nor participating the labor market
8. Weingart Center 360o Solutions Pest control 10 2012 Homeless
Note: A REDF-defined barrier includes low income, the mentally ill, the homeless, parolees, and young adults who are neither enrolled in school nor participating the labor market.
B. Data and Methods
The MJS collected organization- and individual-level information for the evaluation. Staff interviews, employee focus groups, site visits, and secondary documents provided organization-level information to describe SE operations and the challenges they faced. Individual-level information from 527 people hired for SE work starting between April 1, 2012, and March 30, 2013 (88 percent of such individuals) provided information to describe SE employees, their SE experience, and their outcomes that followed shortly after they left SE employment. We obtained information at three times: (1) when individuals requested employment services (intake); (2) when they were hired by the SE (baseline); and (3) when they left the SE or after six months of employment, whichever came first (exit). We also collected intake information from 503 people who requested employment services from the parent organizations but were not referred to SE employment, which provided a context for the severity of the employment barriers employees faced. We used both descriptive statistics and regression analysis to analyze quantitative data and developed a structured coding scheme to analyze qualitative information. Individual-level analysis was weighted to correct for differences in sampling probabilities and response rates across SEs. All analysis is descriptive, which means results cannot be interpreted to make causal inferences about the impact of SE employment.

Executive Summary Mathematica Policy Research
xvii
The analysis allows us to say, for example, that the lives of workers seemed to improve while they were employed at the SE, but cannot be used to say that the SE caused their lives to improve.
C. Lessons Learned
We highlight five overarching themes that emerged from the research.
1. Social enterprises served the hard-to-employ.
People hired by the SEs in REDF’s SIF portfolio faced many employment challenges:
• Prior work experience was minimal, or infrequent. Even though the average employee was 41 years old, 25 percent reported never being employed, and only 16 percent were employed in the week before being hired by the SE.
• Most had unstable housing: 59 percent had temporary housing at some point in the year before being hired by the SE.
• Many had extensive criminal records. On average, employees had been arrested seven times (with only one in five having never been arrested), and 69 percent had convictions on their records.
• Substance abuse and mental and physical health were challenges to getting and keeping a job: more than 20 percent reported they were in counseling for drug or alcohol use in the past year, and 14 percent of those not working in the week before their SE hiring reported that health or substance abuse issues impeded their ability to work.
• Nearly all (98 percent) had income below 200 percent of the federal poverty level (FPL), with only 23 percent of the average income coming from work.
These many employment challenges reflect, in part, the fact that parent organizations often selected and referred to SEs those facing more substantial employment challenges from among those applying for employment services. People hired by an SE were, on average, less ready to work than other people who sought employment services but were not referred to SE employment (Figure 1). SE workers were 11 percentage points less likely to report working in the week before requesting employment services (16 versus 27 percent), 7 percentage points more likely to report using temporary housing in the past year (59 versus 52 percent), 26 percentage points more likely to have a criminal conviction (69 versus 43 percent), and 7 percentage points more likely to have income 200 percent below the FPL (98 versus 91 percent).
Figure 1. Social Enterprise Employees
* = Significant (p ≤ 0.05) differences between the two groups; FPL = federal poverty level.
020406080
100
Employed last week* Temporary housing (past year)*
Ever convicted* Income below 200 percent FPL*
Perc
enta
ge
Hired by social enterprise Other employment service applicants
Executive Summary Mathematica Policy Research
xviii
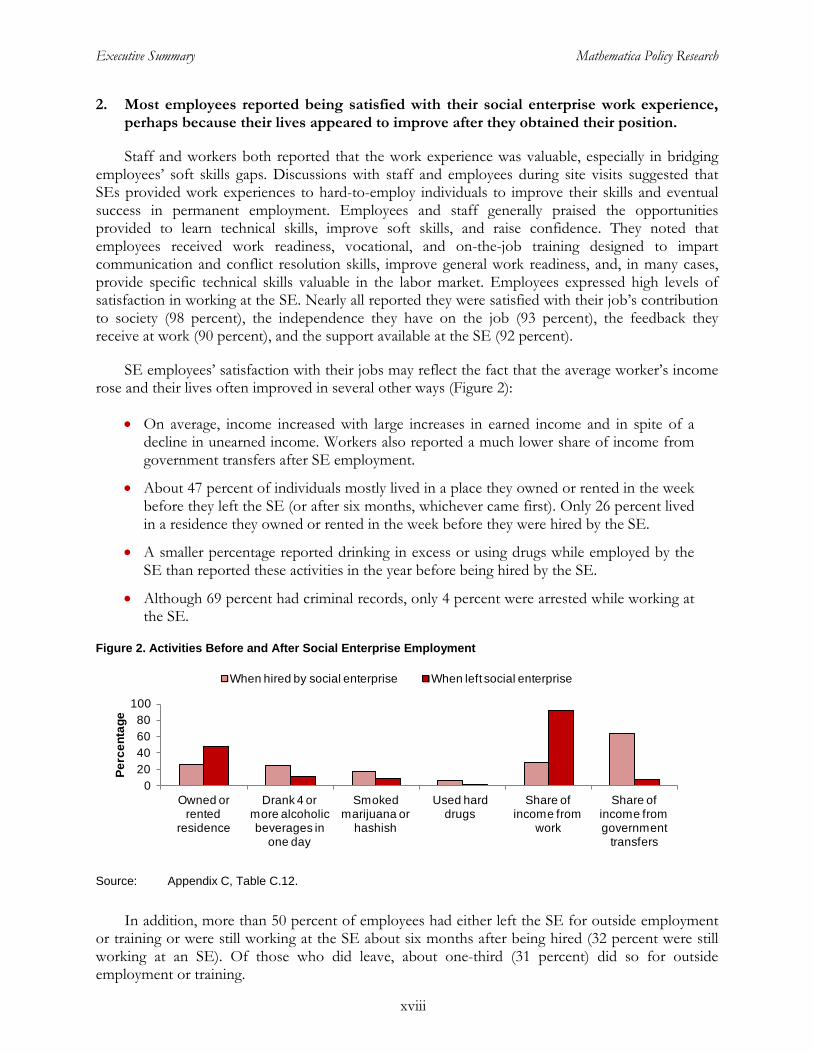
2. Most employees reported being satisfied with their social enterprise work experience, perhaps because their lives appeared to improve after they obtained their position.
Staff and workers both reported that the work experience was valuable, especially in bridging employees’ soft skills gaps. Discussions with staff and employees during site visits suggested that SEs provided work experiences to hard-to-employ individuals to improve their skills and eventual success in permanent employment. Employees and staff generally praised the opportunities provided to learn technical skills, improve soft skills, and raise confidence. They noted that employees received work readiness, vocational, and on-the-job training designed to impart communication and conflict resolution skills, improve general work readiness, and, in many cases, provide specific technical skills valuable in the labor market. Employees expressed high levels of satisfaction in working at the SE. Nearly all reported they were satisfied with their job’s contribution to society (98 percent), the independence they have on the job (93 percent), the feedback they receive at work (90 percent), and the support available at the SE (92 percent).
SE employees’ satisfaction with their jobs may reflect the fact that the average worker’s income rose and their lives often improved in several other ways (Figure 2):
• On average, income increased with large increases in earned income and in spite of a decline in unearned income. Workers also reported a much lower share of income from government transfers after SE employment.
• About 47 percent of individuals mostly lived in a place they owned or rented in the week before they left the SE (or after six months, whichever came first). Only 26 percent lived in a residence they owned or rented in the week before they were hired by the SE.
• A smaller percentage reported drinking in excess or using drugs while employed by the SE than reported these activities in the year before being hired by the SE.
• Although 69 percent had criminal records, only 4 percent were arrested while working at the SE.
Figure 2. Activities Before and After Social Enterprise Employment
Source: Appendix C, Table C.12.
In addition, more than 50 percent of employees had either left the SE for outside employment or training or were still working at the SE about six months after being hired (32 percent were still working at an SE). Of those who did leave, about one-third (31 percent) did so for outside employment or training.
020406080
100
Owned or rented
residence
Drank 4 or more alcoholic beverages in
one day
Smoked marijuana or
hashish
Used hard drugs
Share of income from
work
Share of income from government
transfers
Perc
enta
ge
When hired by social enterprise When left social enterprise

Executive Summary Mathematica Policy Research
xix
Two pieces of evidence suggest that all workers might not have realized such benefits. First, at least one in five workers hired by the SE did not work the equivalent of one week of full-time work, and five percent of those hired worked less than one eight-hour day. Such short periods of exposure to work experience and the SE suggest that these individuals might not have received all the program benefits offered by the SE and its parent organization. Second, about 70 percent of those who left SE employment did so for reasons other than another opportunity. About 34 percent were terminated, about 17 percent left for personal and family reasons, about 13 percent left with job dissatisfaction or because they did not want a job, and about 5 percent left because they became incarcerated.
These outcomes, although mostly positive, do not necessarily establish that SE workers did better than they would have without SEs. However, the outcomes are encouraging and call for further exploration of the impacts of SEs on workers’ lives. Our final report will include analyses of these impacts, using a comparison group of similar employees not hired by SEs.
3. The skill level of jobs in the social enterprise influenced the challenges in supporting employees.
SEs in the SIF portfolio pursued different business lines, with some requiring employees to have or develop more technical skills than others. SEs offering low-skilled, non-technical work were more predominant (for example, working as a barista or janitor) than those offering higher-skilled work (such as a pest control applicator or apprentice or home-builder). SEs providing jobs at different skill levels required different degrees of preemployment and on-the-job training (OJT).
Most SEs provided some training to individuals before they began work, often through their parent organization, with these experiences lasting up to 16 weeks. In general, such training collaborations between the parent organization and SE worked well. (In one case it did not, and the business line folded.) Workers at many SEs, particularly those requiring a more skilled workforce, required additional OJT to contribute to the SE’s business goals. In these cases, employees typically spent at least part of each assignment with supervisors or mentors to learn technical skills required in the job market.
The use of, and reliance on, OJT suggests the importance of the SE staff who worked directly with employees. Across sites, employees and staff identified supervisors as especially important in working with employees to develop technical skills. Determining the skills required for the supervisory positions could depend on whether SEs prioritize hiring technically proficient supervisors and managers (which may increase the viability of the business) or those with a background in working with employees with barriers (which may enhance their ability to communicate with employees and provide support to address employee barriers). An ongoing challenge may be finding supervisors who possess both experience working with hard-to-serve populations and additional technical qualifications needed for higher-skilled business lines.
4. The transitional model of employment presented implementation challenges for social enterprises.
To maximize the impact of SEs, REDF encourages members of its portfolio to use a transitional model of employment. This model specifies that individuals work at SEs for a short period (no less than 32 hours but up to twelve months), acquiring valuable experience, building their resume, and improving their work skills. With help from the SE or parent organization, individuals are ideally able to transition to unsubsidized employment within a year of their hire by the SE. This model allows an SE to serve more people than if the duration of employment was not restricted.
Executive Summary Mathematica Policy Research
xx
Despite this benefit, staff at many SEs expressed concerns about the transitional employment model—specifically, the principle that SEs should limit the duration of SE employment. One concern entailed balancing transitional employment and running a viable business with high turnover among trained staff. Staff of SEs, particularly those that provided more advanced-skills jobs, reported higher costs associated with constantly training new employees and having seasoned workers leave after short work durations. They also reported difficulty in timing the entry and exit of workers so as to not impede workflow. Implementing a transitional program makes staffing difficult because, as one staff member noted, “What makes sense for the business is retaining folks with skills.” Staff also worried about how transitional employment affects employees who may not be ready for permanent employment. These concerns may have lead some SEs, especially those employing workers in skilled occupations, to be slow to adopt a transitional worker program or to begin transitions. The heterogeneous nature of the enterprises and target populations suggests that a one-size-fits-all approach to transition may not be workable. Organization and SE leaders seem to have reached this conclusion; each SE adopted a somewhat different approach to training, employing, and transitioning workers.
5. Parent organizations and social enterprises face challenges in using data strategically.
REDF expects that a data-driven business strategy will help organizations and SEs achieve the double bottom line, improving both their financial viability and their contributions to employee development and long-term well-being. Our research suggests that organizations and SEs focused data collection on documenting their social contributions, but less often used data strategically to help them enhance the supports and services they offered. Moreover, staff told us that they rarely used data to help them achieve business or financial objectives. Most SEs collected enough information to learn, at least in part, how they affect their employees. All SEs or their parent organization collected detailed information on their employees, often including soft and hard skills development. Still, many organizations lacked systems to collect or report data on their employees at the aggregate level. At the time of our site visits, only three organizations had a data “dashboard” to track organizational metrics relating to their financial or social objectives (although three organizations were developing them, with assistance from REDF). Furthermore, only half the organizations tracked employees’ post-transition employment, arguably one of the most important indicators related to their social mission.1
The limited use of data in many SEs appears to be due, in part, to resource limitations. Only about half of staff interviewed indicated they had enough resources for data collection or an efficient data collection system in place, and less than two-thirds indicated that they have staff expertise to analyze data.
Data collection and use on the financial side of the mission was sparser. At least one-third of staff indicated that their SEs did not collect or assess data on the business side: the demand for new types of business or customer satisfaction with their business services. Even when these data were collected, some staff appeared not to be aware of the resource.
1 We did not ask why organizations did not track post-transition employment, but do note that such information is
not readily available without devoting resources to locating clients (through surveying or case management outreach, for example).
Executive Summary Mathematica Policy Research
xxi
D. Issues for Further Exploration
This interim report covers the midpoint of REDF’s five-year strategy to create employment and work experience opportunities, and a scalable SE model, for individuals with complex employment barriers. It comes as a time when many SEs are still developing workable transitional employment models, refining their employee supports, and determining how best to connect employees with employers in the wider labor market. As such, results provide feedback to both REDF and the SEs about how their model is unfolding. They are less informative about SE approaches and activities in fully developed SEs, however, because the results could be influenced by newly created SEs and the early stage at which we are interviewing workers (at about six months after they begin employment).
Analyses comparing work, earnings, and life stability outcomes about one year after being hired by the SE will be presented in the final report, which will be completed in December 2014. This report will include discussions of one-year individual outcomes from SE employment, estimations of the impact of SE employment, and a cost-benefit analysis of SE operations.

This page has been left blank for double-sided copying.
I. Introduction Mathematica Policy Research
1
I. INTRODUCTION
People who are homeless, have conviction records, and have mental health disabilities are likely to experience unemployment rates three to five times higher than those of the general population. For example, more than half of California’s parolees are unemployed (California Office of the Legislative Analyst 2008), unemployment among the severely mentally ill is estimated to be 80 percent (Stuart 2006) and youth unemployment stands about double that for adults (http://www.bls.gov/cps/cpsaat03.pdf). REDF, a San Francisco-based intermediary, selected social enterprises (SEs) as the vehicle to address the difficulties that people with such employment barriers face.2
An SE sells goods and services that the marketplace demands, while intentionally employing people who would otherwise face bleak prospects of ever getting a job. By giving individuals access to jobs they might not secure on their own, SEs can improve employee’s earnings and help them rely less on government benefits, easing taxpayer burden. By developing workers’ skills and providing them with resume-building experience, SE employment might also help workers achieve sustained employment and earnings gains. Furthermore, by providing people with meaningful jobs, SEs might improve quality of life and lead to changes that range from improved health to reduced homelessness and incarceration. Of course, these potential benefits often come with additional business expenses, because SEs might subsidize employment by paying workers more than the value of what they produce or by providing supports needed to overcome employment barriers and transition to unsubsidized employment outside the SE.
In 2011, REDF initiated a five-year strategy to transform how people facing issues related to homelessness, mental health disabilities, addiction, and incarceration and youth transition into the workforce. This strategy seeks to expand SE employment in California and develop a model of SEs that can be used on a national scale. In that same year, REDF received support from the Social Innovation Fund (SIF) of the Corporation for National and Community Service (CNCS) to launch a new portfolio of nonprofits in California to start and expand SEs. As part of its SIF award, REDF committed to fund employment for 2,500 people by 2015, with employment defined as working 32 hours within a four-week period, and set the goal of having 70 percent of these people in a job a year later.
REDF also committed to conducting an evaluation that uses moderate evidence to support the success of its approach. It selected Mathematica Policy Research to (1) help monitor the number of employed, (2) document the number of people employed about one year after being hired by an SE, and (3) design and implement an evaluation that uses moderate evidence to assess the impact of SE employment on subsequent labor market activities and life stability. Mathematica’s evaluation, called the Mathematica Jobs Study (MJS), began on October 1, 2011, and will end on December 30, 2014. It draws information from eight parent organizations in REDF’s SIF portfolio and is designed to address the general research question: How do social enterprises serve individuals with multiple barriers to employment? The study has four key components:
2 The selection of the SE model was supported by a review of 27 rigorous research evaluations of paid work
interventions (Sattar 2010) that suggested paid employment was effective at improving wages, long-term job retention, and educational attachment for people with employment barriers.

I. Introduction Mathematica Policy Research
2
1. An implementation study of eight organizations receiving REDF SIF funding in January 2012, to document implementation of the SE model in each organization
2. An outcomes study to track and analyze outcomes of approximately 500 SE workers about one year after being hired by an SE
3. A quasi-experimental design (QED) impact study of about 275 SE workers and 82 people who entered the labor pool but were not hired from an organization in REDF’s SIF portfolio
4. A cost-benefit analysis (CBA) that links the cost of operating an SE with the benefits it imparts
This report draws information from the implementation and outcomes studies to describe the characteristics of employees, operations, and outputs and outcomes from SEs supported, in part, by funds from REDF’s SIF to their parent organizations. The final report, which will be drafted in December 2014, will draw information from the outcomes study, QED, and CBA to examine outcomes, impacts, and costs of SE employment. Research presented in this report highlights both the strengths and challenges facing SE midway through the SIF funding and provides a backdrop for subsequent research in the final report on the effectiveness of SEs.
The rest of this chapter provides background information on REDF’s SIF portfolio (Section A), the MJS and the structure of the research presented in this report (Section B), and a roadmap to the report (Section C).
A. REDF’s SIF Portfolio
REDF carefully selected its portfolio of nonprofit organizations through a competitive process. It selected well-run nonprofit organizations that were in the early stages of starting or running revenue-generating businesses that intentionally employ those most disconnected from the workforce.
1. Description of Organizations and Social Enterprises
The MJS contains eight organizations in REDF’s SIF portfolio in January 2012: (1) Buckelew, (2) Center for Employment Opportunities (CEO), (3) Chrysalis, (4) Community Housing Partnership (CHP), (5) Coalition for Responsible Community Development (CRCD), (6) Community Resource Center (CRC), (7) Taller San José, and (8) Weingart Center. (A description of each is at http://www.redf.org/what-do-we-do/invest.)3
These eight organizations parent nine SEs with 12 business lines (Table I.1); three of the organizations have more than one business line, and the rest focus on a single type of product or
Each organization is committed to building pathways to the workforce for people with employment barriers and to developing or expanding SEs as one of the employment services to help build that pathway. In addition to sponsoring SEs, each organization offers other employment and training services.
3 The MJS does not include information on the SEs run by the other organizations in REDF’s SIF portfolio:
Goodwill of Silicon Valley, which entered the portfolio after January 2012, and Urban Strategies, which had limited capacity to participate.

I. Introduction Mathematica Policy Research
3
service. The business lines include street cleaning (Golden State Works at CEO and Chrysalis Works at Chrysalis), temporary staffing (SF Solutions at CHP and Chrysalis Staffing at Chrysalis), retail services (Blue Skies Cafés at Buckelew and Back-to-Work Thrift Store at CRC), construction/maintenance services (SF Solutions and Hope Builders at Taller San José); janitorial services (Blue Skies Cleaning), food processing (People’s Harvest at Buckelew), groundskeeping (CRCD Enterprises at CRCD), and pest control (360o Solutions at Weingart Center). During the 2012 calendar year, some of the business lines were being developed, and one was phased out. The size of the SEs vary dramatically: Chrysalis Enterprises employs nearly 500 people per year, and CRCD, Taller San José, and Weingart Center employ only 10 to 12 people per year. Some SEs were well established when they entered REDF’s SIF portfolio, and others were started with that funding. Buckelew (Blue Skies Café) and Chrysalis had SEs established in the mid-1980s; CRC and Weingart Center used REDF funding to start an SE in 2012. The organizations and SEs employed four populations of economically disadvantaged individuals: (1) those with mental health disabilities, (2) those who are homeless, (3) parolees, and (4) young adults who are neither enrolled in school nor participating the labor market. This report contains more detailed information on the prevalence of each of these groups in the organizations.
Table I.1. Description of Social Enterprises
Organization Social Enterprise Business Line
Number Employed Annually
(approximate) Year
Started Target Population of
Employees
1. Buckelew Blue Skies Cafés 18 1986 Mental health disabilities Cleaning 23 2009 People’s Harvest Food processing 0 2013 Homeless
2. CEO Golden State Works Street cleaning 108 2011 Parolees
3. Chrysalis Chrysalis Enterprises
Staffing Street cleaning 500 1984 Formerly incarcerated,
homeless
4. CHP SF Solutions Lobby services 55
2007 Homeless Maintenance services 30
5. CRC Back-to-Work Retail 36 2012 REDF-defined barrier
6. CRCD CRCD Enterprises Groundskeeping 12 2010
Young adults aged 16-25 who are neither enrolled in school nor participating the labor market
7. Taller San José Hope Builders Construction 12 2007
Young adults aged 18-28 who are neither enrolled in school nor participating the labor market
8. Weingart Center 360o Solutions Pest control 10 2012 Homeless
Source: Site visit interviews in eight SEs.
Note: Unless number employed annually was provided by the organization, it was computed as the number of individuals employed at a given time times the expected annual turnover (average months worked). A REDF-defined barrier includes low income, the mentally ill, the homeless, parolees, and young adults who are neither enrolled in school nor participating the labor market.

I. Introduction Mathematica Policy Research
4
2. REDF Expectations of Parent Organizations in Its SIF Portfolio
REDF sees its SIF portfolio as a laboratory to better identify and understand the components of successful SEs. With an understanding of the type of resources and support needed to achieve success, an SE model can be developed, refined, taken to scale, and launched as a cornerstone of a community’s workforce strategy to reduce chronic unemployment.
In light of this philosophy, REDF structured its SIF funding to help organizations launch a business, grow the business, and have the business employ clients of the organization running the SE. It allowed organizations to develop or operate their SEs in their own way, and it funded many different business models, hoping to draw the strongest components from each. Still, it set the following conditions for each organization funded:
• Contribute to REDF’s SIF goal of employing 2,500 people by 2015. REDF worked with each organization to set employment targets. It defined employment as when an individual works 32 hours within a four-week period. People could count as employed only if they were not being counted toward employment goals in other federal funding that the parent organization receives.
• Use SE employment to help individuals gain one year of work experience. Based on a 2010 evidence scan (Sattar 2010), REDF believes that, with one year of work experience, individuals will gain a solid foundation for continued employment. Organizations, through the SEs they parent, are expected to provide transitional employment and help people move into employment outside the enterprise for at least one year of work experience. SE employment is viewed as the bridge to unsubsidized employment and not a permanent employment opportunity. Because the employment barriers that the target populations face often are severe, individuals need a transitional work experience to help them develop soft and hard skills and provide them with supports and services to stabilize their lives. After people build skills and stabilize their lives, the SE or parent organization can help them transition to unsubsidized employment outside the SE.
• Ensure financial viability of the SE. The SE has a commitment both to be a successful business and to provide employment to people who might not have a job otherwise. As such, it has an obligation to meet a double bottom line (DBL) that achieves both financial and social missions. Achieving its financial mission allows the SE to earn income from selling goods and services and not rely solely on government solutions, subsidy, or philanthropy. Achieving its social mission allows the SE to develop the workforce in the surrounding community.
• Use data to build and improve organizations and SE operations. Using data to analyze and document what works is a critical component of REDF’s goal to strengthen SEs and their parent organizations, and REDF expects the organizations that it funds to collect, use, and analyze data to improve their decision making and operations and undertake strategies to achieve the DBL.
B. Mathematica Jobs Study
Mathematica developed a logic model to structure the evaluation and designed the research to unfold in two stages, one to focus on SE operations and program outputs and individual outcomes (this report), the other to focus on longer-term outcomes, impacts, and costs (final report). This

I. Introduction Mathematica Policy Research
5
section discusses the overall structure of the MJS, including its logic model, data collection and analysis, and limitations of the study.
1. Logic Model for the Evaluation
The logic model (Figure I.1) shows how employment and life stability are expected to change with SE employment. The figure has four key components:
1. The left side of the figure highlights REDF’s theory of change for the SE. It shows how REDF’s funding and technical assistance can enhance the SE experience, life stability supports provided, and effective decision making.
2. The middle part of the figure shows the expected relationship between individual SE operations and the expected SE outputs and individual outcomes immediately following SE employment. It shows how outputs and outcomes depend on the SE’s approaches and activities and how SEs are expected to focus on two key outputs: (1) employ individuals so that they meet the REDF hours requirement (32 hours within four weeks), and (2) provide these employees with a positive work experience. Individuals are expected to realize three key outcomes: (1) employment outside the SE, (2) a more stable life, and (3) a positive attitude toward work.
3. The right side of the figure shows how SE employment is designed to affect subsequent outcomes. These outcomes include unsubsidized employment and a stable life, defined as stable housing, no recidivism in crime, positive mental health, and adequate income.
4. The bottom of the figure (dark blue) indicates that the characteristics of the clients seeking employment services in the parent organization and of those people hired by the SE underlie the theory of change, SE structure, SE activities, outputs, and individual outcomes. It also indicates that internal and external environments (for example, labor market conditions) underlie individual-level outcomes.
Figure I.1. Logic Model for the MJS Evaluation
I. Introduction Mathematica Policy Research
6
Three specific research questions, addressed in this report, can be derived from the logic model depicted in Figure I.1:
1. What are the characteristics of SE employees?
2. What activities do SEs undertake, and what challenges do they face?
3. What are the outputs and outcomes following SE employment?
2. Data Collection and Analysis
To answer the research questions, the MJS collected (1) individual-level information from clients in the parent organization and SE employees, and (2) organization-level information from staff and documents. Here, we describe these two types of information. Appendix A provides details of individual-level data and the MJS database constructed from it, and Appendix B provides additional details of the organization-level data collection and analysis.
Individual-Level Information
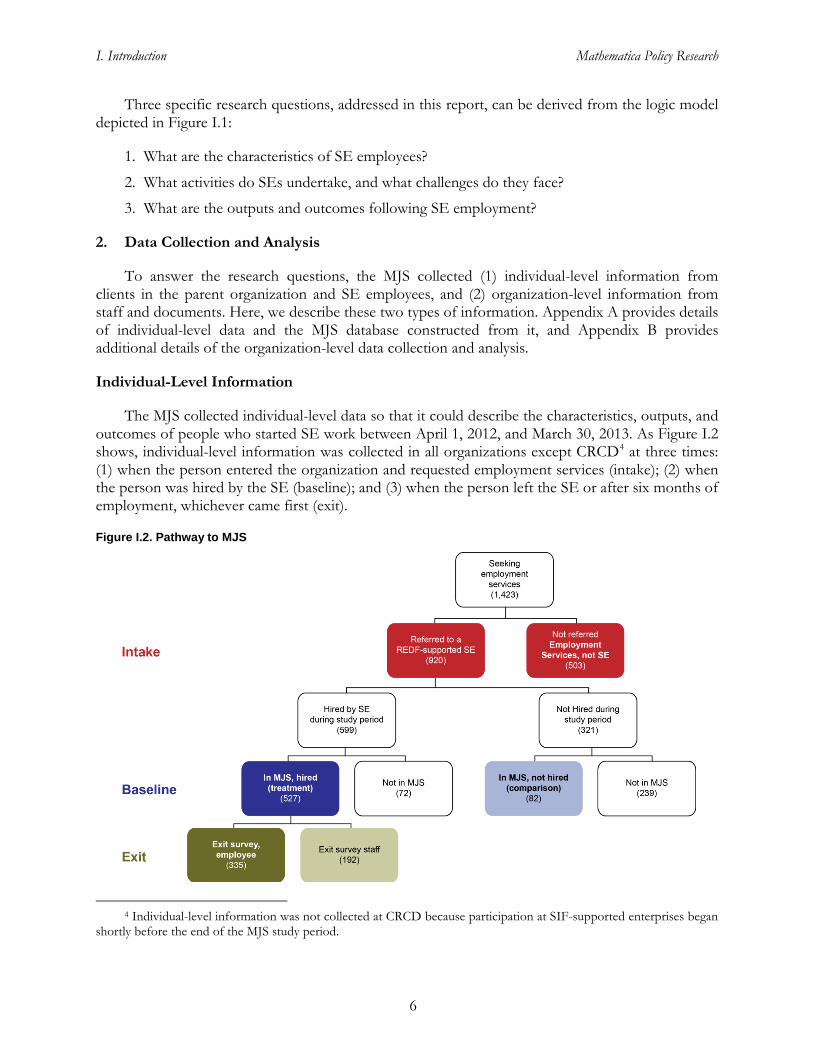
The MJS collected individual-level data so that it could describe the characteristics, outputs, and outcomes of people who started SE work between April 1, 2012, and March 30, 2013. As Figure I.2 shows, individual-level information was collected in all organizations except CRCD4
Figure I.2. Pathway to MJS
at three times: (1) when the person entered the organization and requested employment services (intake); (2) when the person was hired by the SE (baseline); and (3) when the person left the SE or after six months of employment, whichever came first (exit).
4 Individual-level information was not collected at CRCD because participation at SIF-supported enterprises began shortly before the end of the MJS study period.
I. Introduction Mathematica Policy Research
7
• Intake information was collected from 1,423 people who entered the parent organization and requested employment services (the red boxes in Figure I.2). Some people were referred to SE employment, and some were not. Some of the 503 people not referred to SE employment were referred to other employment services by the parent organizations. Those not referred to SE employment constitute a group of individuals to whom SE workers can be compared to assess whether parent organizations are referring those most difficult to employ (for example) to the SE (as we do in Chapter II). Intake information includes basic demographic and background information and was obtained by asking the same questions in all organizations.
• Baseline survey information was collected from two groups of people who consented to be in the MJS: (1) those referred to and hired by an SE; and (2) a subset of those referred to, but not hired by, an SE (our comparison group). All people referred to SE employment and hired by the SE during the MJS study period (April 1, 2012, and March 30, 2013) were taken through the informed consent process for enrolling in the MJS. The 527 (88 percent) people who consented to be in the study formed the treatment group (dark blue box in Figure I.2).5 One organization took all individuals referred to SE employment (not just those hired) through the consent process. The group of 82 referred but nonhired individuals from this organization (the light blue box in Figure I.2) forms a comparison group that we will use in our final report to estimate the impact of SE employment.6
• Exit survey information was collected for all MJS study participants hired by the SE. Staff at the organization administered an exit survey that obtained information on the person’s work in the SE, changes in employment barriers, and satisfaction with the experience. The exit survey was administered when the person left the SE or after six months of employment, whichever came first. Outcomes (for example, earnings and employment barriers) were therefore measured while the individual was employed in the SE. If the employee was not available to respond to the survey, a staff member completed information on the work experience (for example, hours and weeks worked and earnings). Although we have some exit survey information for all people in the treatment group, only 335 employees (64 percent) completed the survey. Staff members completed surveys for the remaining 192 employees.
A parent organization or SE staff member administered the web-based baseline survey to all study participants—those who agreed to participate in the MJS. This survey obtained detailed information on their work history and employment barriers.
We used descriptive methods to describe SE employees (research question 1) and to determine which factors might be associated with SE outputs and employee outcomes (research question 3). Means and percentage distributions uncovered patterns in the characteristics of SE employees, their
5 Appendix A provides a detailed discussion of response rates. 6 People in the comparison group represent nearly all those referred to, but not hired by, the SE at this one
organization. However, they represent only 26 percent of such individuals in all organizations. This difference arises because no other organization took such individuals through the consent process. Therefore, the comparison group provides limited information on outcomes for all people referred to SE employment, but it can describe individuals at one specific organization who were referred to its SE for employment but were not hired. Our final report will contain a full discussion of the relative strengths and weaknesses of using this comparison group.
I. Introduction Mathematica Policy Research
8
work experiences, and their satisfaction with the experience. We used a t-statistic to determine if statistically significant (p ≤ 0.05) differences existed between groups with the characteristic, output, or outcome was measured by a single variable (for example, percent male, total hours worked). We used a chi-square test to determine if statistically significant differences existed between groups in their distributions (for example, education) and, if found, used two-tailed t-tests to test for statistically significant differences in individual categories between groups.
We used multivariate analysis to address the individual outcomes at the time of leaving SE employment (research question 3). This approach controlled for differences in the population served by different organizations and SE to gauge whether outputs and outcomes were different after taking these into account. We used regression-adjusted averages computed from regression estimations to present these results in the text of the report. Such an adjustment compensates for the covariates in the regression to see what the average would be without differences in the other factors included in the analysis. We used ordinary least squares to estimate all regressions.
All individual-level analysis was weighted to correct for differences in sampling probabilities and response rates across SEs. With weighted analysis, the distribution of workers across SEs is identical in the baseline and exit survey data.7
Organization-Level Information
To examine SE operations, Mathematica collected information on SEs and their parent organizations from four sources:
1. Documents about the organization and SE were obtained from REDF staff, staff at the organizations and SEs, and the web.
2. Telephone interviews with REDF staff focused on the technical assistance provided to organizations and SEs and REDF’s assessment of the SEs’ strengths and challenges.
3. Site visits provided in-depth qualitative information on the operations of organizations and SEs from the staff’s perspective.
4. Checklists and a structured questionnaire provided information on the services and supports provided to SE employees (checklist) and the use of data to make decisions (questionnaire). Both were administered as part of the site visit.
We collected information after REDF required organizations to have employee supports in place (on March 1, 2013); therefore, this information reflected SE operations, not plans for operations.8
Information we collected produced a large volume of qualitative information (sources 1 to 3) and a small amount of quantitative data (source 4). We used descriptive statistics (means and percentage distributions) to analyze the quantitative data and developed a structured coding scheme to analyze qualitative information. Both types of analysis allowed us to identify themes, patterns, and trends across organizations and to assess the approach and activities box in Figure I.1.
7 The weighting did not affect data from other employment service applicants. 8 The exception was the visit to the maintenance service business line at CHP. Because this business line closed in
December 2012, we visited the site in mid-December.

I. Introduction Mathematica Policy Research
9
3. Limitations of the Research
Results presented in this study must be considered in the context of its three key limitations:
1. Results cannot be used to describe employees or SE outcomes outside of this study. Because other SEs or transitional work programs have different funding structures, locations, and resources, the experiences of participants in this study might differ from those in other SEs or transitional work programs. Furthermore, our analysis of operations is based on information collected from a select group of SE staff and employee samples and might not reflect views of those not interviewed for this study.
2. Causal inferences cannot be made. The analysis of SE outputs and outcomes and employee characteristics provided interesting insights into the experiences at SEs. However, because all analysis was descriptive, results cannot be interpreted to make causal inferences about the impact of SE employment on postprogram employment, housing stability, or other outcomes of interest.
3. Some survey responses may not be accurate. Responses to all survey questions are subject to correct recall and truthful reporting. This can be particularly problematic for sensitive topics such as those in our surveys (for example, arrest record, housing, income, mental health) or in interviews (for example, overstating positive reactions to please a funder).
C. Structure of Report
The next three chapters of the report each address one of the three research questions. Chapter II addresses the question, What are the characteristics of SE employees? It focuses on the employment barriers that SE employees face and provides a context for those barriers by comparing them to the barriers that people seeking employment services from the parent organization who were not referred to SE employment face. Chapter III addresses the question, What activities do SEs undertake, and what challenges do they face? by examining the challenges they face in employing, training, and supporting workers, as well as strategies used to address these challenges. Chapter IV addresses the question, What are the outputs and outcomes following SE employment? by examining program outputs and individual outcomes at the end of SE employment and assessing their associations with the parent organization. Analysis presented in the final report will build on findings in this chapter, present more rigorous estimates of SE impacts, and examine the associations between impacts and the characteristics of SEs and employees.
The report also includes four appendices. The first two provide detailed information on the design of the study. Appendix A describes the data collection and analysis of individual-level data, defines the variables used in individual-level analysis, and discusses the potential for sample selection biases in analysis. Appendix B describes the processes and information collected on organizations. Appendix C provides the main data tables upon which figures in the text are based, and Appendix D provides copies of the data collection instruments used.

This page has been left blank for double-sided copying.
II. Characteristics of Social Enterprise Workers Mathematica Policy Research
11
II. CHARACTERISTICS OF SOCIAL ENTERPRISE WORKERS
When REDF selected organizations to be part of the SIF portfolio, one criterion was that organizations—and the SEs they operate—provide employment to the hardest to employ. It defined employment as an individual working 32 hours within a four-week period. In this chapter, we describe the characteristics of SE workers. Analysis undertaken as part of that description answers the first research question in the study, What are the characteristics of SE employees? Although some information in this chapter is drawn from the organization-level data, most is from the MJS baseline survey and intake data (described in detail in Appendix A).9
To provide a comprehensive description of SE employees, the chapter describes the employment barriers that SE employees face (Section A), compares their barriers to those faced by people seeking employment services from the parent organization but not referred to the SE (Section B), and compares barriers faced by those who do and do not meet the REDF hours requirement for employment (Section C). Appendix C, Section A contains the data from which the figures in this chapter are drawn.
A. Social Enterprise Employees Face a Wide Range of Employment Barriers
People working in REDF-funded SEs demonstrated a myriad of barriers to employment. Workers struggled with limited employment histories, health and substance abuse issues, unstable housing, and long criminal records.
1. Most social enterprise employees had not worked in the past year and reported frustration with labor market experiences, but they would like to be employed.
Many people hired by SEs had limited employment histories (Figure II.1). Although the average age of a person hired by the SE was about 41 (Appendix C, Table C.2), about one-quarter said they had never worked in a regular job for pay, and only 63 percent had worked in the year before they were hired by an SE. People who worked in the past year were likely to have had more than one job.
9 People who were referred for SE employment but were not hired are excluded from this analysis.
Key Findings • Individuals hired by social enterprises face a variety of barriers to employment. Only 63
percent had worked in the year before intake, and 25 percent reported never having had a job. Government transfers were 68 percent of monthly incomes, with only 23 percent of the average income coming from work before starting in the SE. More than four-fifths had been arrested, and only 16 percent used only their own (owned or rented) home for housing in the past year.
• Individuals hired by social enterprises have backgrounds suggesting they faced greater barriers to employment than individuals seeking employment services from parent organizations who were not referred to social enterprise employment. Individuals hired by SEs are 9 percentage points more likely to report being unemployed for the past year, 7 percentage points more likely to report using temporary housing in the past year, and 23 percentage points more likely to have ever been arrested.
• Individuals who meet REDF’s hours requirement do not appear to differ from those who do not. Employees who do and do not meet the hours requirement tend to have similar demographic characteristics and employment barriers, as measured by employment history, housing stability, and arrest records.
II. Characteristics of Social Enterprise Workers Mathematica Policy Research
12
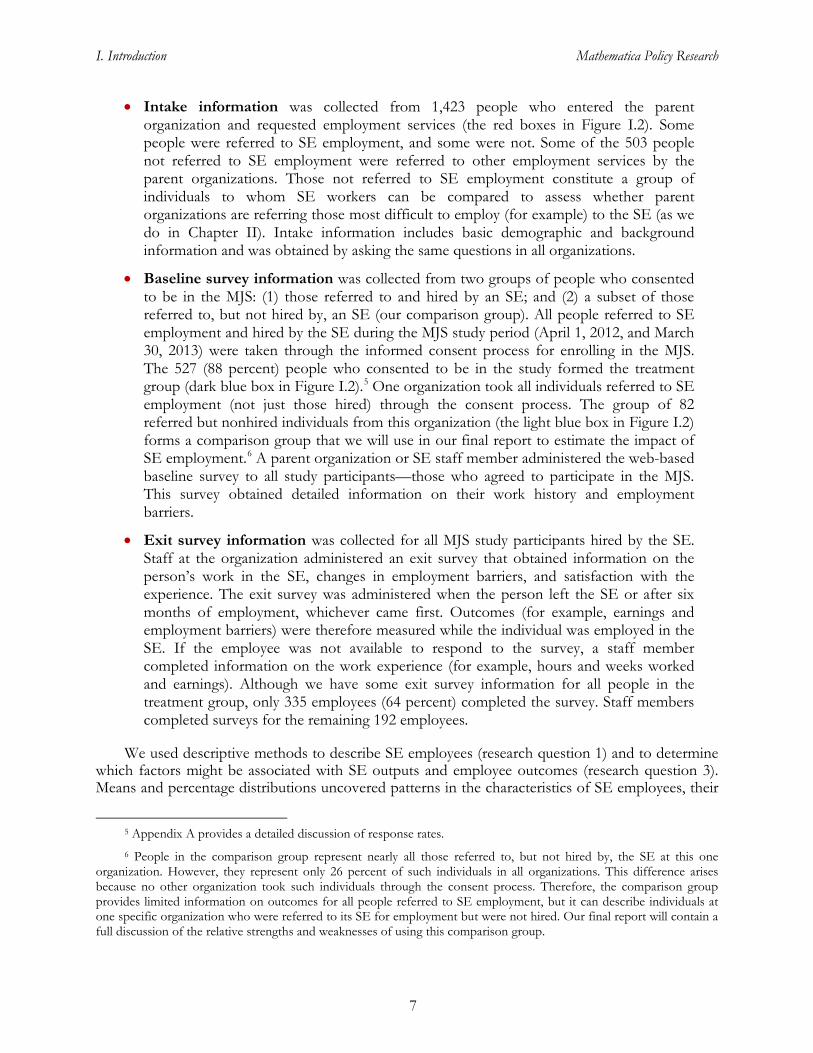
Figure II.1. Employment History When Hired by Social Enterprise
Source: Appendix C, Table C.4.
Note: Information is based on the 527 people hired by the SE.
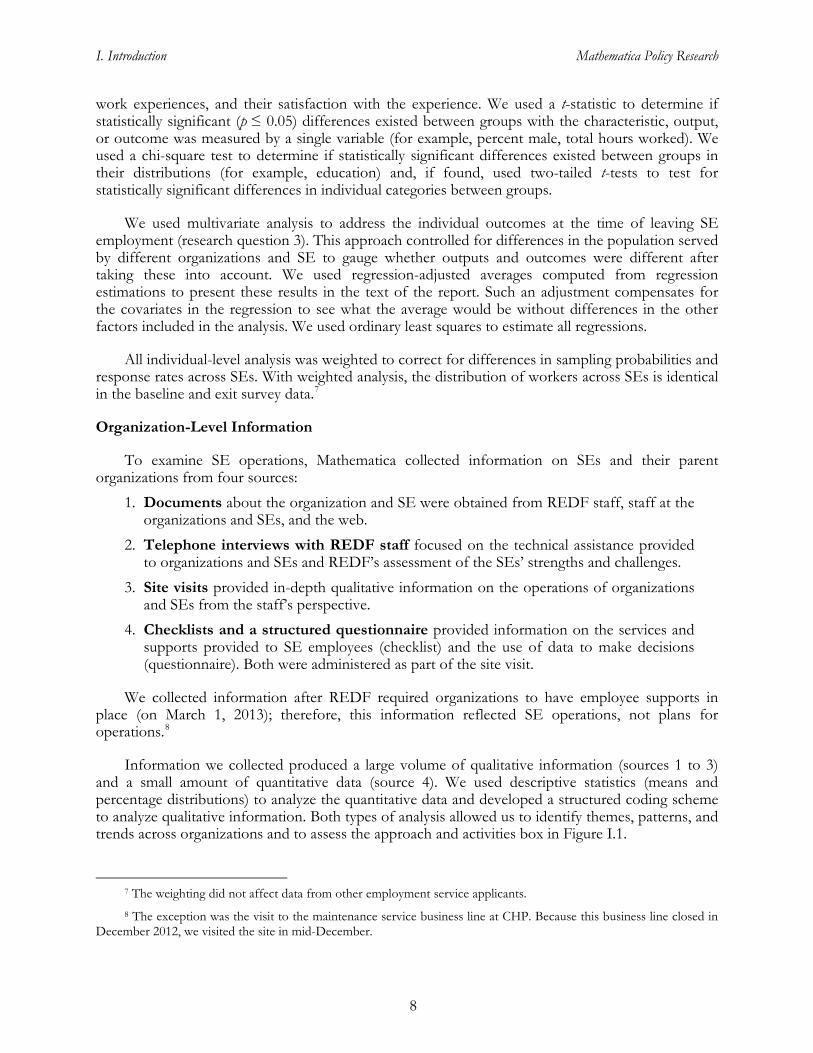
People who had not worked the week before they were hired by the SE reported a variety of reasons for their lack of employment, with most suggesting they had negative experiences with the labor market (Figure II.2). Nearly half said they had been discouraged by past experience looking for work, 27 percent reported they did not have sufficient qualifications for employment, and 26 percent reported that they could not find a desirable job (individuals could select more than one option). Other commonly cited reasons for lack of employment included a criminal record (21 percent, a write-in category), health or substance abuse issues (14 percent), and lack of transportation (9 percent). Despite the large proportion of respondents who appear to be disconnected from the labor force, individuals reported relatively positive attitudes toward employment: 80 percent reported they would like to be employed, even if they did not need to earn money (Appendix C, Table C.9).
Figure II.2. Reasons Given for Not Working in Week Before Hire
Source: Appendix C, Table C.4.
Note: Information is based on the 414 people who were hired by the SE and did not work the week before hire.
0
20
40
60
80
100
Worked in week before intake
Worked in year before intake
Ever worked 1 2-3 4 or more
Perc
enta
ge
Number jobs worked in year before hire
0
20
40
60
80
100
Discouraged Lack of qualifications
Cannot find a desirable job
Criminal history/record
Health limitations or substance
abuse
Lack of transportation
Other
Perc
enta
ge

II. Characteristics of Social Enterprise Workers Mathematica Policy Research
13
2. Social enterprise employees struggled to maintain permanent housing.
Without permanent housing, it can be difficult for an employee to come to work on time and prepared. Survey data show a patchwork of arrangements in which SE workers use many forms of shelter. Only 33 percent reported using a single housing method in the past year. Even in the week before they were hired by the SE, 24 percent used more than one housing arrangement, and nearly 40 percent had lived in temporary housing (Appendix C, Table C.5). During the year before being hired by the SE, only about half had their own home, and 41 percent stayed with family or friends because they could not obtain adequate housing on their own (Figure II.3). Others relied on transitional housing (23 percent) and emergency shelters/vouchers (15 percent); 11 percent slept outdoors or in public places in the prior year.
Figure II.3. Housing Arrangements Used in Year Before Being Hired by the Social Enterprise
Source: Appendix C, Table C.5.
Note: Information is based on the 527 people hired by the social enterprise.
3. Most social enterprise employees had been involved with the criminal justice system.
When asked why they were not working, one-fifth of nonemployed individuals wrote in a response suggesting they had been unable to find a job because of past criminal activity. Figure II.4 shows several key statistics describing individuals’ criminal records just before they began SE employment. More than 80 percent had been arrested in the past, and 69 percent had been convicted of a crime and sentenced to serve time in jail or prison. Nearly half of those sentenced to serve time were sentenced to serve five or more years.
Figure II.4. Criminal History of Respondents When Hired by the Social Enterprise
Source: Appendix C, Table C.6.
Note: Information is based on the 527 people hired by the social enterprise. Ever convicted includes sentencing.
0
20
40
60
80
100
Owned or rented room, apartment, or
home
Home of family or friend
Jail,prison,
or juveniledetention
Transitionalhousing
Psychiatric hospital or treatment facility
Emergencyshelter orvoucher
Outside or in public
Perc
enta
ge
020406080
100
Everarrested
Ever convicted Less than 1 year
1-2 years 2 to 5 years 5 + years
Perc
enta
ge
Total Time Sentenced (If Ever Convicted)
II. Characteristics of Social Enterprise Workers Mathematica Policy Research
14
4. Many workers faced barriers related to health and substance abuse issues.
People hired by the SE reported several behaviors that suggest health and substance abuse issues might be employment barriers for a relatively large portion of SE employees, even though only about five percent (each) reported a physical injury or illness or mental or emotional disorder that made it difficult for them to work. About 14 percent of individuals not working in the week before they were hired by an SE stated that their health or an issue related to substance abuse kept them from working (Appendix C, Table C.7). Higher numbers reported behaviors that could be considered self destructive, however. More than one-fifth (21 percent) had been in counseling or therapy for some form of substance abuse in the past year, reported drinking in excess (22 percent), and smoked marijuana or hashish (21 percent), at some point in the past 12 months. Seven percent of individuals also reported using hard drugs in the past year. Those who reported using drugs did so often: 1.6 (marijuana) or 1.7 (other drugs) times per week, on average (not shown). Individuals also often reported being bothered by negative feelings. Although only about 3 percent had suicidal thoughts in the past week, 22 percent were bothered by feelings of worthlessness and 27 percent by feelings of hopelessness about their future.
5. Nearly all workers had income below 200 percent of the federal poverty level (FPL) at hire, with most income coming from government transfers.
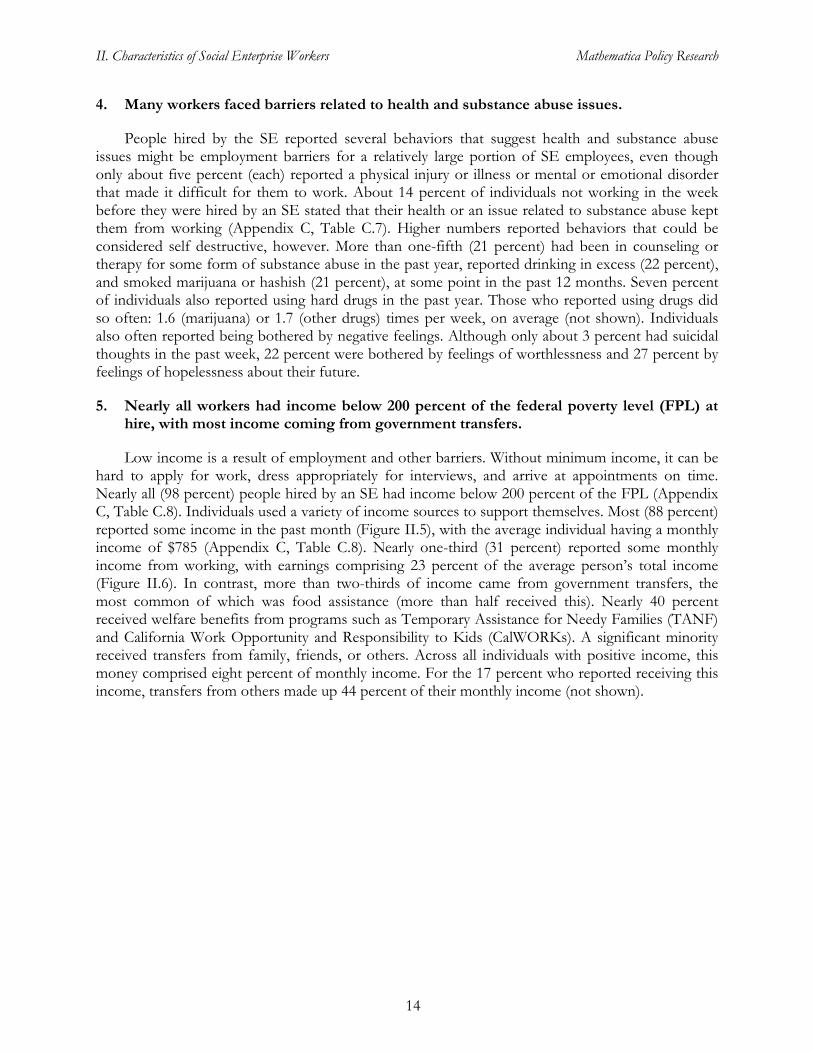
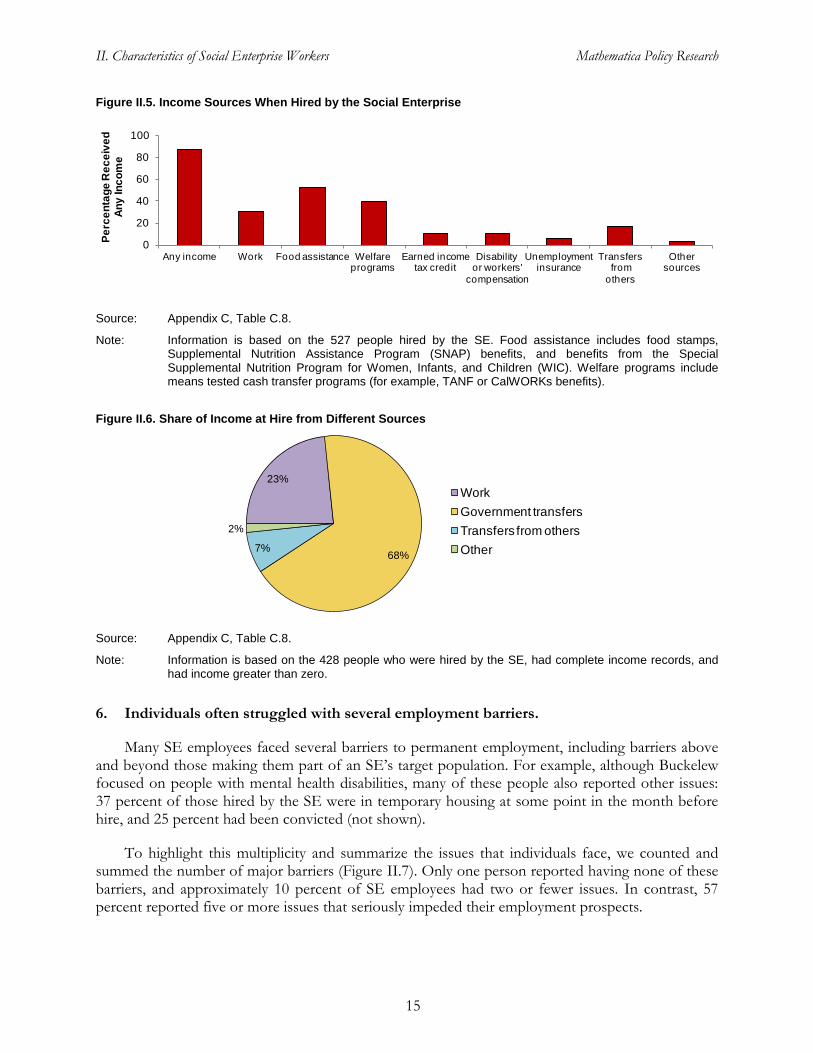
Low income is a result of employment and other barriers. Without minimum income, it can be hard to apply for work, dress appropriately for interviews, and arrive at appointments on time. Nearly all (98 percent) people hired by an SE had income below 200 percent of the FPL (Appendix C, Table C.8). Individuals used a variety of income sources to support themselves. Most (88 percent) reported some income in the past month (Figure II.5), with the average individual having a monthly income of $785 (Appendix C, Table C.8). Nearly one-third (31 percent) reported some monthly income from working, with earnings comprising 23 percent of the average person’s total income (Figure II.6). In contrast, more than two-thirds of income came from government transfers, the most common of which was food assistance (more than half received this). Nearly 40 percent received welfare benefits from programs such as Temporary Assistance for Needy Families (TANF) and California Work Opportunity and Responsibility to Kids (CalWORKs). A significant minority received transfers from family, friends, or others. Across all individuals with positive income, this money comprised eight percent of monthly income. For the 17 percent who reported receiving this income, transfers from others made up 44 percent of their monthly income (not shown).
II. Characteristics of Social Enterprise Workers Mathematica Policy Research
15
Figure II.5. Income Sources When Hired by the Social Enterprise
Source: Appendix C, Table C.8.
Note: Information is based on the 527 people hired by the SE. Food assistance includes food stamps, Supplemental Nutrition Assistance Program (SNAP) benefits, and benefits from the Special Supplemental Nutrition Program for Women, Infants, and Children (WIC). Welfare programs include means tested cash transfer programs (for example, TANF or CalWORKs benefits).
Figure II.6. Share of Income at Hire from Different Sources
Source: Appendix C, Table C.8.
Note: Information is based on the 428 people who were hired by the SE, had complete income records, and had income greater than zero.
6. Individuals often struggled with several employment barriers.
Many SE employees faced several barriers to permanent employment, including barriers above and beyond those making them part of an SE’s target population. For example, although Buckelew focused on people with mental health disabilities, many of these people also reported other issues: 37 percent of those hired by the SE were in temporary housing at some point in the month before hire, and 25 percent had been convicted (not shown).
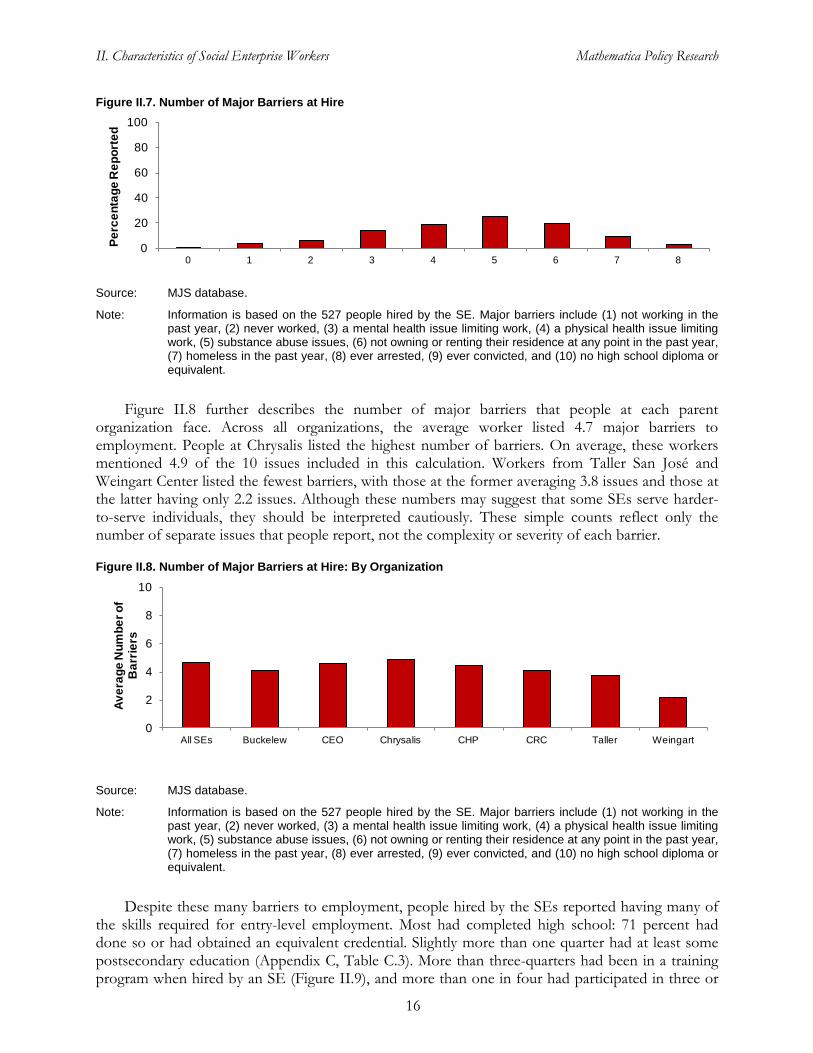
To highlight this multiplicity and summarize the issues that individuals face, we counted and summed the number of major barriers (Figure II.7). Only one person reported having none of these barriers, and approximately 10 percent of SE employees had two or fewer issues. In contrast, 57 percent reported five or more issues that seriously impeded their employment prospects.
0
20
40
60
80
100
Any income Work Food assistance Welfareprograms
Earned incometax credit
Disabilityor workers'
compensation
Unemploymentinsurance
Transfersfrom
others
Othersources
Perc
enta
ge R
ecei
ved
Any
Inco
me
23%
68%7%
2%
WorkGovernment transfersTransfers from othersOther
II. Characteristics of Social Enterprise Workers Mathematica Policy Research
16
Figure II.7. Number of Major Barriers at Hire
Source: MJS database.
Note: Information is based on the 527 people hired by the SE. Major barriers include (1) not working in the past year, (2) never worked, (3) a mental health issue limiting work, (4) a physical health issue limiting work, (5) substance abuse issues, (6) not owning or renting their residence at any point in the past year, (7) homeless in the past year, (8) ever arrested, (9) ever convicted, and (10) no high school diploma or equivalent.
Figure II.8 further describes the number of major barriers that people at each parent organization face. Across all organizations, the average worker listed 4.7 major barriers to employment. People at Chrysalis listed the highest number of barriers. On average, these workers mentioned 4.9 of the 10 issues included in this calculation. Workers from Taller San José and Weingart Center listed the fewest barriers, with those at the former averaging 3.8 issues and those at the latter having only 2.2 issues. Although these numbers may suggest that some SEs serve harder-to-serve individuals, they should be interpreted cautiously. These simple counts reflect only the number of separate issues that people report, not the complexity or severity of each barrier.
Figure II.8. Number of Major Barriers at Hire: By Organization
Source: MJS database.
Note: Information is based on the 527 people hired by the SE. Major barriers include (1) not working in the past year, (2) never worked, (3) a mental health issue limiting work, (4) a physical health issue limiting work, (5) substance abuse issues, (6) not owning or renting their residence at any point in the past year, (7) homeless in the past year, (8) ever arrested, (9) ever convicted, and (10) no high school diploma or equivalent.
Despite these many barriers to employment, people hired by the SEs reported having many of the skills required for entry-level employment. Most had completed high school: 71 percent had done so or had obtained an equivalent credential. Slightly more than one quarter had at least some postsecondary education (Appendix C, Table C.3). More than three-quarters had been in a training program when hired by an SE (Figure II.9), and more than one in four had participated in three or
0
20
40
60
80
100
0 1 2 3 4 5 6 7 8
Perc
enta
ge R
epor
ted
0
2
4
6
8
10
All SEs Buckelew CEO Chrysalis CHP CRC Taller Weingart
Aver
age
Num
ber o
f B
arrie
rs

II. Characteristics of Social Enterprise Workers Mathematica Policy Research
17
more training programs. About half had completed a training program, and 13 percent were enrolled in a training program when they began work at the SE (programs may have been part of a program through an SE’s parent organization). Workers also reported having the cognitive skills required for many entry-level jobs (Appendix C, Table C.3). Nearly all reported being able to use basic math and the ability to read and write as needed for the workplace: 97 percent said they could read work-related books in English, 94 percent said they could use basic math skills, and 92 percent said they could fill out invoices and perform other work-related written tasks.
Figure II.9. Past Participation in Training Programs at Hire
Source: Appendix C, Table C.3.
Note: Information is based on the 524 people hired by the SE. Information was collected on training programs leading to a license, degree, or certificate.
B. Social Enterprise Employees Have Backgrounds Suggesting Greater Barriers than Those Requesting Employment Services and Not Referred to Social Enterprise Employment
The SEs in REDF’s SIF portfolio serve a subset of the clients who receive services from their associated parent organizations. Organizations use a variety of methods to select the people the SEs will hire. These procedures can create differences in the characteristics of people hired by SEs and other people seeking employment services. Differences also may result from differences in the populations that organizations serve and organizations’ different rates of referral. For example, Taller San José sought to serve youth in a predominantly Hispanic area and has a lower referral rate for SE employment that many other organizations (Appendix A). Therefore, we might expect the group of workers hired by SEs to have a lower proportion of Hispanics than the group of other individuals seeking employment services.
0
20
40
60
80
100
Any training program
3 or more training programs
Currently enrolled Any training program
3 or more training programs
Perc
enta
ge
Participated in training programs Completed program
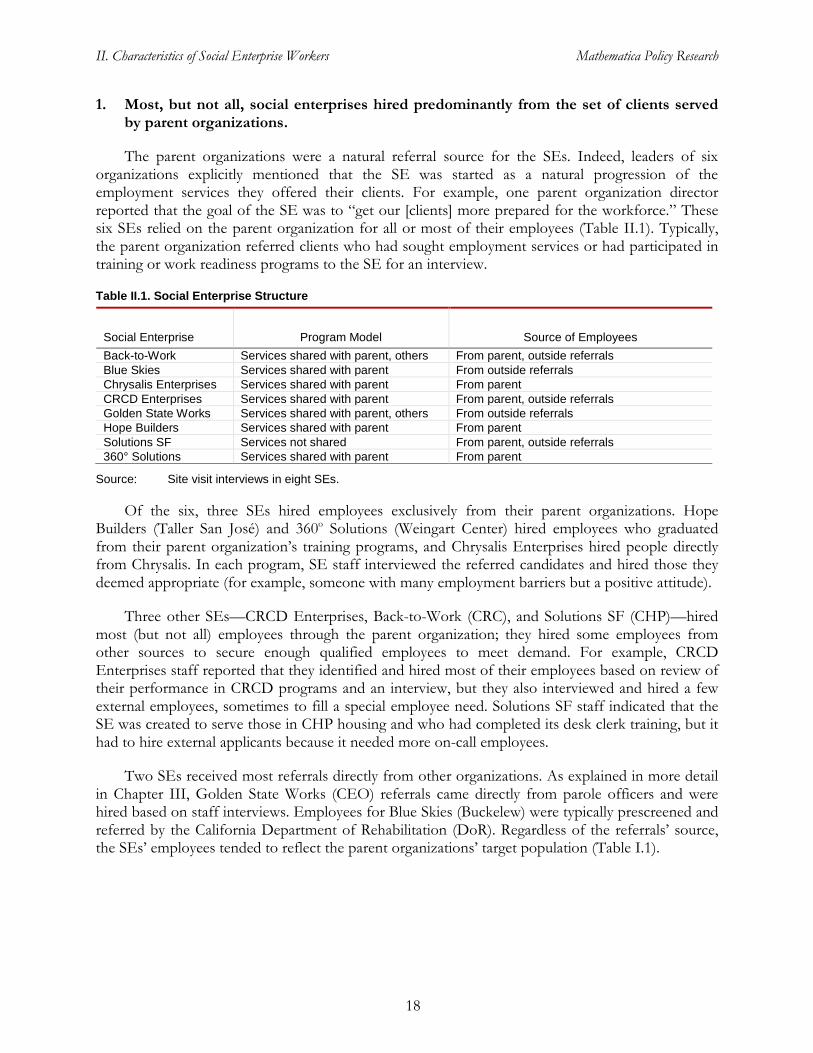
II. Characteristics of Social Enterprise Workers Mathematica Policy Research
18
1. Most, but not all, social enterprises hired predominantly from the set of clients served by parent organizations.
The parent organizations were a natural referral source for the SEs. Indeed, leaders of six organizations explicitly mentioned that the SE was started as a natural progression of the employment services they offered their clients. For example, one parent organization director reported that the goal of the SE was to “get our [clients] more prepared for the workforce.” These six SEs relied on the parent organization for all or most of their employees (Table II.1). Typically, the parent organization referred clients who had sought employment services or had participated in training or work readiness programs to the SE for an interview.
Table II.1. Social Enterprise Structure
Social Enterprise Program Model Source of Employees Back-to-Work Services shared with parent, others From parent, outside referrals Blue Skies Services shared with parent From outside referrals Chrysalis Enterprises Services shared with parent From parent CRCD Enterprises Services shared with parent From parent, outside referrals Golden State Works Services shared with parent, others From outside referrals Hope Builders Services shared with parent From parent Solutions SF Services not shared From parent, outside referrals 360° Solutions Services shared with parent From parent
Source: Site visit interviews in eight SEs.
Of the six, three SEs hired employees exclusively from their parent organizations. Hope Builders (Taller San José) and 360o Solutions (Weingart Center) hired employees who graduated from their parent organization’s training programs, and Chrysalis Enterprises hired people directly from Chrysalis. In each program, SE staff interviewed the referred candidates and hired those they deemed appropriate (for example, someone with many employment barriers but a positive attitude).
Three other SEs—CRCD Enterprises, Back-to-Work (CRC), and Solutions SF (CHP)—hired most (but not all) employees through the parent organization; they hired some employees from other sources to secure enough qualified employees to meet demand. For example, CRCD Enterprises staff reported that they identified and hired most of their employees based on review of their performance in CRCD programs and an interview, but they also interviewed and hired a few external employees, sometimes to fill a special employee need. Solutions SF staff indicated that the SE was created to serve those in CHP housing and who had completed its desk clerk training, but it had to hire external applicants because it needed more on-call employees.
Two SEs received most referrals directly from other organizations. As explained in more detail in Chapter III, Golden State Works (CEO) referrals came directly from parole officers and were hired based on staff interviews. Employees for Blue Skies (Buckelew) were typically prescreened and referred by the California Department of Rehabilitation (DoR). Regardless of the referrals’ source, the SEs’ employees tended to reflect the parent organizations’ target population (Table I.1).

II. Characteristics of Social Enterprise Workers Mathematica Policy Research
19
2. Social enterprise employees appeared to face greater barriers to employment than other employment service applicants.
People interviewed during our site visits reported that the workers hired by SEs could differ from the individuals seeking employment services at the parent organizations. Staff at some SEs reported that the parent organization referred those clients who were least ready for outside employment and would benefit most from the supported work experiences. For example, Chrysalis staff used their own judgment about who to refer to the SE but said they tended to focus on those with “the most significant barriers to employment” (such as a previous incarceration, recent substance abuse, or limited work experience). Conversely, staff at Weingart Center’s 360o Solutions reported that their employees had fewer barriers to employment than others applying for employment services. Across these SEs, staff reported that interviewers referred clients and hired those they considered to be the “best fit” for the work.
To assess differences between people hired by SEs and other employment service applicants, we describe the demographic and background characteristics of both groups. Individuals hired by the SE are significantly more likely to be male (80 versus 62 percent) and black (59 versus 44 percent), and less likely to be Hispanic (17 versus 31 percent) (Figure II.10). Individuals hired by the SE also had lower educational attainment: 29 percent of the individuals hired by an SE and 20 percent of those seeking employment service and not referred to an SE did not have a high school diploma or equivalent, a significant difference.
Figure II.10. Characteristics of People Hired by Social Enterprise and Other Employment Service Applicants
Source: Appendix C, Tables C.2 and C.3.
Note: Information is based on 503 other employment service applicants and 527 people hired by the SE.
*Outcomes differ significantly (p ≤ 0.05) between individuals hired by the SE and other employment service applicants.
Workers hired by SEs appear to have more substantial employment barriers than other employment service applicants (Figure II.11). Other employment service applicants are significantly more likely to have been employed in the week before intake (27 versus 16 percent), significantly less likely to have used temporary housing in the past year (52 versus 59 percent), and less involved in the criminal justice system (58 versus 81 percent had been arrested).
0
20
40
60
80
100
Male* Hispanic* Black* White Single Veteran No high school
degree*
High school degree or equivalent
(only)
At least some college*
Perc
enta
ge
Hired by social enterprise Other employment service applicants
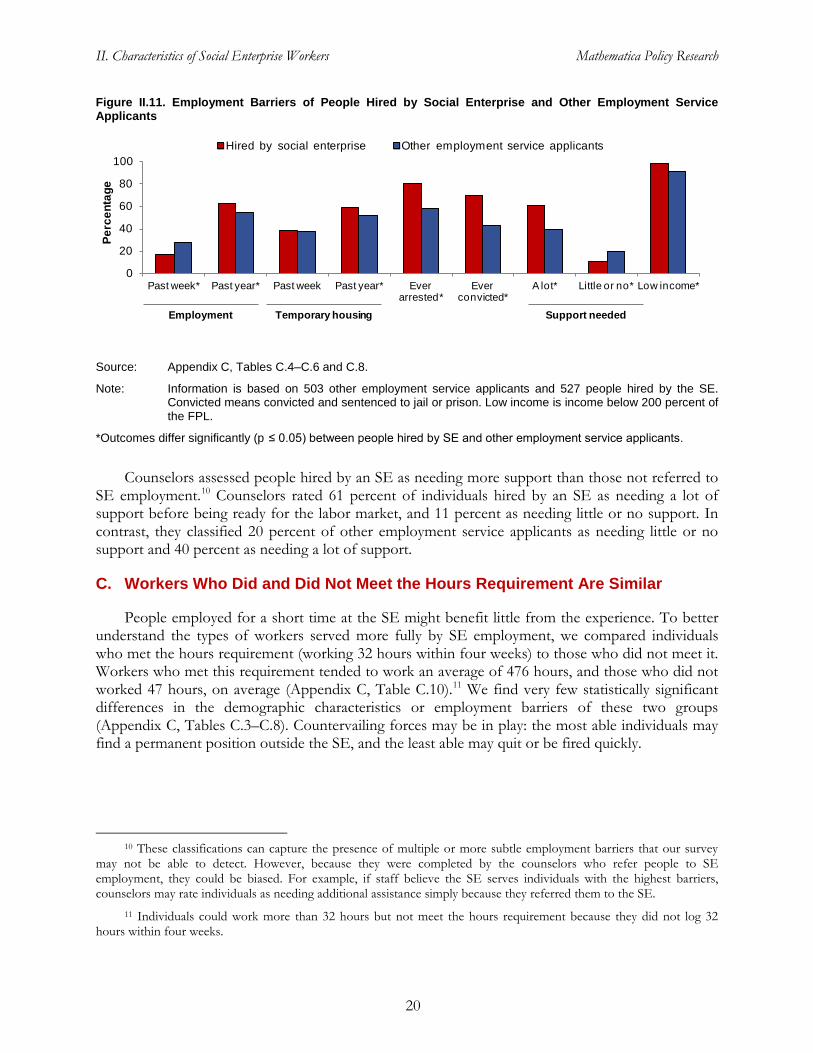
II. Characteristics of Social Enterprise Workers Mathematica Policy Research
20
Figure II.11. Employment Barriers of People Hired by Social Enterprise and Other Employment Service Applicants
Source: Appendix C, Tables C.4–C.6 and C.8.
Note: Information is based on 503 other employment service applicants and 527 people hired by the SE. Convicted means convicted and sentenced to jail or prison. Low income is income below 200 percent of the FPL.
*Outcomes differ significantly (p ≤ 0.05) between people hired by SE and other employment service applicants.
Counselors assessed people hired by an SE as needing more support than those not referred to SE employment.10
C. Workers Who Did and Did Not Meet the Hours Requirement Are Similar
Counselors rated 61 percent of individuals hired by an SE as needing a lot of support before being ready for the labor market, and 11 percent as needing little or no support. In contrast, they classified 20 percent of other employment service applicants as needing little or no support and 40 percent as needing a lot of support.
People employed for a short time at the SE might benefit little from the experience. To better understand the types of workers served more fully by SE employment, we compared individuals who met the hours requirement (working 32 hours within four weeks) to those who did not meet it. Workers who met this requirement tended to work an average of 476 hours, and those who did not worked 47 hours, on average (Appendix C, Table C.10).11
10 These classifications can capture the presence of multiple or more subtle employment barriers that our survey
may not be able to detect. However, because they were completed by the counselors who refer people to SE employment, they could be biased. For example, if staff believe the SE serves individuals with the highest barriers, counselors may rate individuals as needing additional assistance simply because they referred them to the SE.
We find very few statistically significant differences in the demographic characteristics or employment barriers of these two groups (Appendix C, Tables C.3–C.8). Countervailing forces may be in play: the most able individuals may find a permanent position outside the SE, and the least able may quit or be fired quickly.
11 Individuals could work more than 32 hours but not meet the hours requirement because they did not log 32 hours within four weeks.
0
20
40
60
80
100
Past week* Past year* Past week Past year* Ever arrested*
Ever convicted*
A lot* Little or no* Low income*
Perc
enta
ge
Hired by social enterprise Other employment service applicants
Employment Temporary housing Support needed
III. Social Enterprise Operations and Challenges Mathematica Policy Research
21
III. SOCIAL ENTERPRISE OPERATIONS AND CHALLENGES
REDF selected a portfolio of nonprofit organizations in the early stages of starting or already running revenue-generating businesses. It allowed organizations to develop, or continue to operate, REDF-supported SEs in a way that fit with their missions and client populations, but it established some parameters for their operations (Chapter I). In addition to meeting employment targets (discussed in Chapter IV), SEs were to develop employment and supports that would enable employees to transition to other jobs, maintain the financial viability of their enterprise, and use data to build and improve operations. In this chapter, we present our findings on the strengths and challenges SEs faced in providing employment and supports to individuals with a myriad of employment barriers and operating within the REDF-set parameters. Our analysis drew information from (1) documents about the SEs; and (2) visits to sites, which included interviews with REDF, SE, and parent organization staff; focus groups with employees; and structured questions about supportive services and use of data for decision making.12
The analysis was developed, in part, to address the second research question: What activities do SEs undertake, and what challenges do they face?
In this chapter, we describe SE operations and the challenges they face. Section A describes the
implementation of the work experience and supportive services provided. Section B describes the organizational challenges of using a transitional employment model, and Section C describes the challenges SEs face in using data strategically.
12 Appendix B provides details of the data and analysis.
Key Findings • As financially viable businesses, social enterprises often were unable to invest
substantial resources to provide soft skills development and employee supports to address skill gaps and employment barriers in their hard-to-serve populations. Instead, they relied on other organizations to help do this, which sometimes made coordination difficult. As a result, employees did not always have ready access to services, or the services did not always address their needs.
• The issues that social enterprises faced depended, in part, on whether they had many higher-skilled positions. As one might expect, SEs faced more training challenges when many of their jobs required a higher level of skills. Given the limited work experience and skills of most employees, SEs usually had to deliver training or rely on parent organizations or partners to do so. SEs offering low-skilled positions faced fewer such implementation challenges, but some staff were concerned about the future employment prospects of their employees.
• Some social enterprises faced challenges in imposing a limit on the duration of employment at the social enterprise. At the time of our site visits, only four SEs imposed these limits on employment. Staff at SEs without firm employment limits expressed concerns about the need to constantly train new workers or fears that some employees would fare poorly in the labor market after leaving the SE because they had too little time in a supportive employment.
• Most social enterprises lacked the capacity to effectively use data to support their operations. SE or organization staff usually collected detailed data on their employees, but they less commonly reported using data strategically or to learn about their business environment, monitor performance indicators, or track employee outcomes after they left the SE.

III. Social Enterprise Operations and Challenges Mathematica Policy Research
22
A. Supporting Employees was Challenging
All SEs sought to prepare new hires for their jobs and provide additional supports designed to stabilize their lives. At the same time, SEs were expected to become financially viable businesses. In pursuing both these missions, SEs and their parent organizations encountered a variety of challenges. These challenges depended, in large part, on two key factors: (1) the role of the parent organization and other partners in delivering supports, and (2) the level of skills the SE jobs required.
1. The structure of providing employee supports affected the types of challenges SEs faced.
All SEs, or their partners, provided general life and soft skills training, which staff explained were designed to “establish the work ethic” or “impart a structure” and “responsibility” to employees with uneven or nonexistent work histories (Table III.1). In at least four organizations, activities designed to build soft skills included a structured workshop or training that focused on development of communication and conflict resolution skills, financial education, stress management, and work readiness.
Table III.1. Soft Skills Development
Social Enterprise Preemployment Soft Skills Activities Post-Hire Soft Skills Activities Back-to-Work Life skills and soft skills training;
financial literacy Group meetings on life skills and job readiness; ongoing trainings; OJT
Blue Skies Observational assessment; online training Life skills workshops; job readiness training, OJT
Chrysalis Enterprises Work readiness and life skills classes; workshops on soft skills
Workshops on life skills, financial literacy, work readiness (incentives to attend); OJT
CRCD Enterprises Job readiness and soft skills classes OJT Golden State Works Life skills education class OJT Hope Builders Soft skills classes OJT Solutions SF Soft skills training; soft skills workshops Job coaching; soft skills workshops; OJT 360° Solutions Life skills and job readiness training OJT
Source: Site visit interviews and review of program documentation in eight SEs.
Note: “OJT” refers to staff-directed on-the-job training through interactions with supervisors, structured assessments, and interactions with customers. Other activities are structured and occur outside of normal work hours.
In addition to building soft skills, organizations and SEs provided supportive services (see sidebar) to help employees address the many employment barriers that can affect work and life stability (discussed in Chapter II). Staff at six SEs or their parent organizations reported offering case management services of varying intensities to help address worker barriers (Table III.2). In five organizations, this service also included housing assistance or referrals. Case management and housing services were sometimes offered only to a subset of employees, however. For example, at Blue Skies and Solutions SF, employees who live in parent organization housing or who were clients of the parent organization were eligible to receive a more comprehensive menu of supports during employment than other employees. Four
Most Common Supportive Services:
• Housing Assistance • Vocational or Job Skills Training • Substance Abuse Counseling and
Treatment • Transportation Assistance • Legal Services • Mental Health Counseling and Treatment • Domestic Violence Prevention • Financial Education and Asset Building • Work Clothing Assistance

III. Social Enterprise Operations and Challenges Mathematica Policy Research
23
organizations reported offering “wraparound” services—a more comprehensive set of services, including individualized case management and support—to their employees.
Table III.2. Work and Life Supports
Social Enterprise Case Management Housing Described as “Wraparound” Back-to-Work Yes Referral Yes Blue Skies Limited Limited Yes Chrysalis Enterprises No No No CRCD Enterprises Yes Referral No Golden State Works No No No Hope Builders Yes No No Solutions SF Limited Limited Yes 360° Solutions Yes Yes Yes
Source: Site visit interviews and review of program documentation in eight SEs.
Note: “Limited” indicates that the service is provided only to a subset of SE employees. “Referral” denotes that staff provide referrals or vouchers for housing assistance. “Wraparound” services were identified when one or more staff members used that term to describe their supports.
Organizations and SEs also provided activities to promote employees’ transition to employment outside the SE: job readiness training, job coaching or counseling, job search assistance, job mentoring, and job development. Some organizations had weekly or monthly activities or assessments to prepare employees and track their readiness for the transition. Provision of transition supports appeared to be inconsistent, however. Some employees did not receive it because work hours or proximity to services created access barriers or because they failed to engage with support staff once they begin SE employment. Some organizations struggled to provide transitional supports because they were recent adopters of the transitional model or had unsuccessful partnerships with transitional support providers.
In general, the eight SEs used one of three basic structures to provide soft skills training and other supports (Table III.3). Each structure posed different challenges. Next, we describe each model within the context of its challenges.
Table III.3. Program Models for Providing Life and Employment Supports
Social Enterprise Program Model Back-to-Work Parent and service partners deliver support services Blue Skies Parent delivers most support services Chrysalis Enterprises Parent delivers most support services CRCD Enterprises Parent delivers most support services Golden State Works Parent and service partners deliver support services Hope Builders Parent delivers most support services Solutions SF SE delivers most services 360° Solutions Parent delivers most support services
Source: Site visit interviews in eight SEs.
• When the parent organization delivered most support services, it was sometimes difficult for employees to access services. The most common structure for providing soft skills training and supports was one in which the SE provided the work experience, and the parent organization provided most of the supportive services. Five of the eight SEs had this basic structure. Problems arose with this model, however, because employees did not always receive needed services. For example, Blue Skies employees could receive support from a job developer in the parent organization, but the support often depended on whether the employees’ work location was near the job developer’s

III. Social Enterprise Operations and Challenges Mathematica Policy Research
24
office. The SE planned to partner with community organizations to overcome this barrier. Chrysalis Enterprises employees relied on the parent organization for employment services, but, according to staff, many failed to “reconnect” with these services after starting SE employment. Chrysalis planned to establish a “bridge” program to help employees stay in contact with the department providing these services.
• When partners were responsible for delivering support services, the services were not always adequate. In two SEs—Back-to-Work and Golden State Works—partner organizations provided key components of employment skills training and support services. In both cases, the SE found it difficult to maintain service quality. Back-to-Work staff and employees expressed concerns that the partner providing job development services was not doing enough to help employees find jobs. At Golden State Works, the parent organization, CEO, had to step in to provide employee supports after the original partner was unsuccessful in helping employees search for nonsupported employment.
• When the social enterprise was responsible for support services, it had trouble meeting employee needs and becoming financially viable. At Solutions SF, the SE staff was responsible for delivering training and other support services. SE staff reported that limited resources left them unable to adequately address their employees’ needs, and some employees reported receiving few supportive services. SE management suggested that meeting both business goals and employees’ needs would not allow them to become financially viable.
2. Higher-skilled employment created training challenges, and low-skilled employment led to difficulty obtaining employment outside the social enterprise.
The SEs’ business line determined what tasks employees perform and, as a result, the skills they needed. SEs at six (of eight) organizations offered mostly low-skilled employment in occupations such as barista, desk clerk, or janitor (Table III.4). SEs that offered higher-skilled positions (for example, pest control applicator or apprentice home builder) required employees to possess more technical skills. For most of these jobs, the SE, parent organization, or partner needed to train those hired before they could be fully productive.
Table III.4. Work Activities, Skill Level, and Training Provided
Social Enterprise Work activities Skill Level Preparatory
training On-the-Job
Training Back-to-Work Retail thrift store clerk Low No Limited Blue Skies Barista; janitorial Low No Limited Chrysalis Enterprises
Neighborhood improvement; janitorial; desk clerk Low Yes Limited/some
CRCD Enterprises Neighborhood improvement; facilities management Low and higher Yes Yes
Golden State Works Highway clean-up Low No No Hope Builders Construction; rehabilitation Higher Yes Yes Solutions SF Desk clerk; maintenance* pest control* Low and higher* Yes Yes 360° Solutions Pest control Higher Yes Yes
Source: Site visit interviews in eight SEs.
Note: Maintenance, pest control, and facilities management at Solutions SF and CRCD Enterprises had had higher-skilled positions. Other business lines had lower-skilled positions. “Limited” OJT refers to a lower intensity of training that is not a major focus of the work experience, and “some” refers to OJT offered to a subset of employees.
*Business line closed.
III. Social Enterprise Operations and Challenges Mathematica Policy Research
25
Training for employment (even low-skilled employment) can be viewed as occurring in two stages—preparatory and on the job—although not all SEs provided training in both stages (Table III.4). Preparatory training usually lasted between 4 and 16 weeks and was typically provided by parent organizations. Although most SEs provided some type of OJT, the intensity of that training was related to the types of work activities in the SE. For example, some employees of Solutions SF and CRCD Enterprises, and all employees of Hope Builders and 360° Solutions, received OJT with supervisors or mentors to learn technical skills required in their positions and that could potentially help them in the job market.
In some cases, training posed challenges, particularly when it involved collaborating with parent organizations. The parent organizations sometimes were unable to upgrade workers’ skills sufficiently, which may have led to terminations for work performance (Chapter IV). For example, Solutions SF staff felt that graduates of CHP’s eight-week maintenance services training did not receive adequate preparation to serve as maintenance technicians, because the training did not provide sufficient skills to complete work assignments and lacked a “synergy” with the demands of customers and the work environment. They partially blamed their lack of input in the parent organization’s training curriculum for these failures. Solutions SF other business line, lobby services, addressed this challenge by requiring fewer hard skills and increasing the focus on continued training after hire.
In other cases, the training collaborations between parent organizations and SEs appeared to work well. For example, 360° Solutions staff and employees praised the preparatory training that Weingart Center provided to employees at 360° Solutions. Employees felt the training program provided them with “what they needed to know” for their pest control applicator positions and also made them work ready in general. Staff noted that the parent organization developed the training with input from SE staff. Staff at CRCD Enterprises also reported adequate training from a program jointly developed with the parent organization.
Employees, especially those in higher-skilled positions, noted that their capacity to perform job duties depended, in part, on the training they received from supervisors, and SE staff echoed this point. In four organizations, staff (and, in some cases, employees) indicated that hiring supervisors with industry and technical experience was important in providing OJT, in addition to producing quality products and services. For example, staff at the Solutions SF maintenance services business suggested that the supervisors’ lack of technical experience and poor mentoring and training of employees contributed to its failure. Staff at Hope Builders and 360° Solutions noted that hiring supervisors and crew chiefs with business or technical experience helped lead to their operational success and their ability to develop workers’ technical skills on the job.
When employees lacked both technical and soft skills, it was not always sufficient to hire supervisors with industry experience only. On the one hand, staff reported that these supervisors did not always know “how to interact with or communicate with people with…barriers” and how to appropriately provide “soft” supports to employees. On the other hand, some SEs put priority on hiring supervisors and managers with social work backgrounds or with experience working with their hard-to-serve client populations, but such supervisors sometimes lacked industry knowledge. Therefore, a key challenge for SEs was finding a way to provide high quality training to employees in a supportive environment. In many SEs, a single supervisor was responsible for both hard skills training and some soft supports to employees, but this made recruiting the right supervisors challenging. A few SEs had one supervisor responsible for training and supervision, and another focused on providing employees with supports; however, this arrangement could increase costs and make coordination difficult.
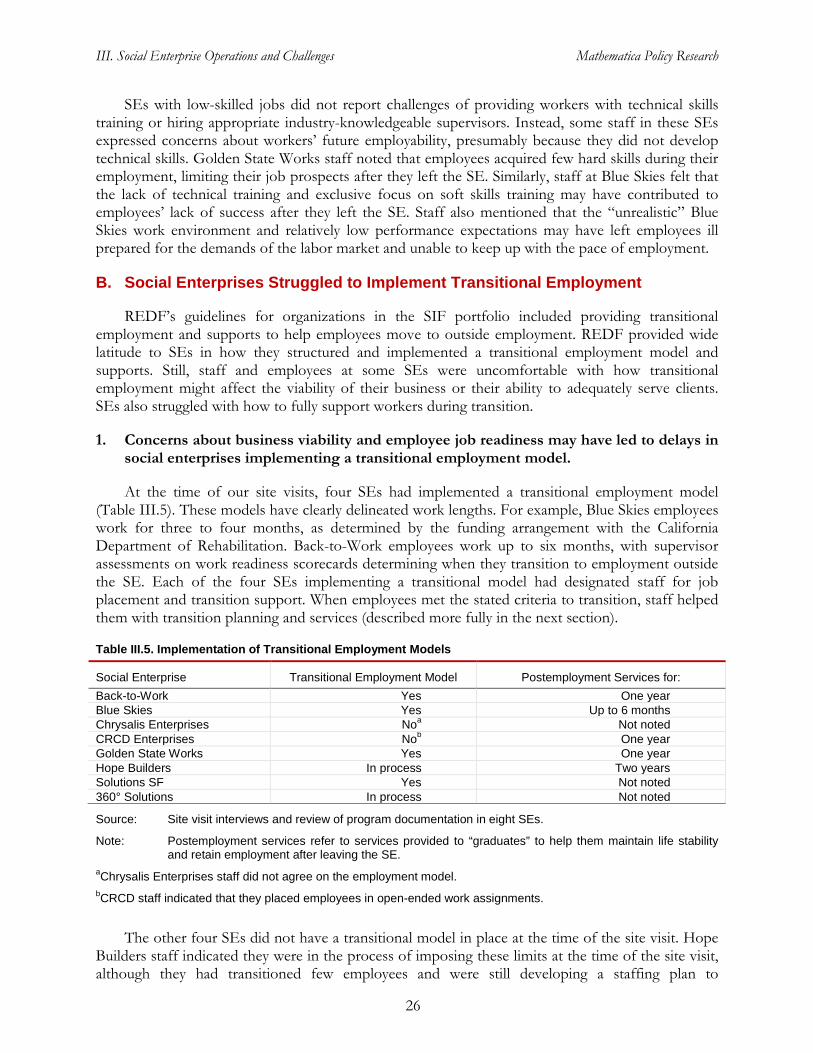
III. Social Enterprise Operations and Challenges Mathematica Policy Research
26
SEs with low-skilled jobs did not report challenges of providing workers with technical skills training or hiring appropriate industry-knowledgeable supervisors. Instead, some staff in these SEs expressed concerns about workers’ future employability, presumably because they did not develop technical skills. Golden State Works staff noted that employees acquired few hard skills during their employment, limiting their job prospects after they left the SE. Similarly, staff at Blue Skies felt that the lack of technical training and exclusive focus on soft skills training may have contributed to employees’ lack of success after they left the SE. Staff also mentioned that the “unrealistic” Blue Skies work environment and relatively low performance expectations may have left employees ill prepared for the demands of the labor market and unable to keep up with the pace of employment.
B. Social Enterprises Struggled to Implement Transitional Employment
REDF’s guidelines for organizations in the SIF portfolio included providing transitional employment and supports to help employees move to outside employment. REDF provided wide latitude to SEs in how they structured and implemented a transitional employment model and supports. Still, staff and employees at some SEs were uncomfortable with how transitional employment might affect the viability of their business or their ability to adequately serve clients. SEs also struggled with how to fully support workers during transition.
1. Concerns about business viability and employee job readiness may have led to delays in social enterprises implementing a transitional employment model.
At the time of our site visits, four SEs had implemented a transitional employment model (Table III.5). These models have clearly delineated work lengths. For example, Blue Skies employees work for three to four months, as determined by the funding arrangement with the California Department of Rehabilitation. Back-to-Work employees work up to six months, with supervisor assessments on work readiness scorecards determining when they transition to employment outside the SE. Each of the four SEs implementing a transitional model had designated staff for job placement and transition support. When employees met the stated criteria to transition, staff helped them with transition planning and services (described more fully in the next section).
Table III.5. Implementation of Transitional Employment Models
Social Enterprise Transitional Employment Model Postemployment Services for: Back-to-Work Yes One year Blue Skies Yes Up to 6 months Chrysalis Enterprises Noa Not noted CRCD Enterprises Nob One year Golden State Works Yes One year Hope Builders In process Two years Solutions SF Yes Not noted 360° Solutions In process Not noted
Source: Site visit interviews and review of program documentation in eight SEs.
Note: Postemployment services refer to services provided to “graduates” to help them maintain life stability and retain employment after leaving the SE.
aChrysalis Enterprises staff did not agree on the employment model.
bCRCD staff indicated that they placed employees in open-ended work assignments.
The other four SEs did not have a transitional model in place at the time of the site visit. Hope Builders staff indicated they were in the process of imposing these limits at the time of the site visit, although they had transitioned few employees and were still developing a staffing plan to
III. Social Enterprise Operations and Challenges Mathematica Policy Research
27
accommodate these transitions without disrupting the business. Staff at 360° Solutions said they were beginning to transition workers out of the SE, but the plan for doing so was not yet fully articulated. In the other two SEs, it was unclear whether staff would be implementing transitional employment. Chrysalis Enterprises staff variously described their employment model as transitional, short-term, or open-ended, with several staff preferring a more semipermanent or permanent employment arrangement for employees. CRCD Enterprises used open-ended work assignments, and staff did not express plans to develop a transitional model, instead focusing on hiring workers for temporary or permanent positions, as business needs and worker productivity dictated.
Staff concerns about business viability and employee readiness appeared to contribute to delays in implementing transitional employment. Staff members at five SEs raised concerns about the business viability of implementing transitional employment. Staff reported higher costs associated with “constantly training” and “[employees leaving] at random times,” difficulty anticipating staffing levels, and wanting to do “what makes sense for the business in terms of retaining folks with skills.” These concerns were most prevalent at SEs with higher-skilled jobs. To address this challenge, staff reported staggering transitions to help maintain a constant level of employee skills and knowledge and retaining highly skilled workers by placing them in mentor or supervisor roles.
Staff in some SEs felt that transitional employment could also work against their social mission, especially if employees were not ready for nonsupported employment or if those employment opportunities were lacking. Some staff reported uneven or poor labor market outcomes for many of their graduates. As a former board member at one organization noted, “We sensed that outcomes were not good” for those leaving the SE, because many returned for additional SE employment. A staff member at another SE reported concerns about their employees finding a job due to a deficit of marketable skills.
2. Social enterprises struggled to add supports to help workers in outside employment.
REDF expected that organizations or SEs would help workers sustain employment outside the SE. Providing that support proved challenging, however. Staff in all but one SE said that their organizations provided post-transition services to help employees adjust to outside employment after leaving the SE, but these supports often amounted to infrequent contacts over a limited period of time. Staff in only five SEs (Table III.5) reported providing postemployment supports with clearly defined durations to their graduates. Employees in focus groups valued these services, which typically included limited case management, job coaching, or additional job search assistance after job loss.
C. Social Enterprises Faced Challenges Using Data Strategically
REDF expects that organizations in its SIF portfolio and their SEs will use data to learn about and improve aspects of their operations and to document their viability and contributions to worker development. Although SEs had access to a broad range of information on their employees, SE staff noted a lack of capacity to fully use data, especially in more strategic ways.
1. Social enterprises and parent organizations collected detailed individual-level data but less operational data.
All SEs or their parent organizations collected detailed employee information (Table III.6). Many SEs collected, or had access to, detailed information on employees’ barriers and life stability before employment, career interests and aptitudes, and educational or training programs. In many

III. Social Enterprise Operations and Challenges Mathematica Policy Research
28
cases, organizations and SEs continued collecting information on individuals after they were hired, including their skill development during SE employment. Employee-level data and worker assessments provided information for case management or employment services and for supervisors’ accountability for employees’ progress.
Organizations and SEs were less likely to collect information on their business operations. Although the majority of SE staff reported collecting or using data about their business environments, about one-third or more indicated that they did not collect or assess data on demand for new types of business, or customer satisfaction with their business services.
Table III.6. Organizational Tracking of Employee Progress
Social Enterprise Individual-Level Data Tracking Performance Indicators Back-to-Work Self-sufficiency; work readiness; case notes; other Developing Blue Skies Work readiness; case notes No Chrysalis Enterprises Case notes; service receipt Dashboard tracks some metrics;
transitioning to integrated database CRCD Enterprises Training; skill development No Golden State Works Soft skills; work progress; case notes; other Dashboard tracks some metrics Hope Builders Case notes; skills assessments Developing Solutions SF Skills assessments; case notes; health care Multiple dashboards track some
metrics 360° Solutions Case notes; general employee progress Developing
Source: Site visit interviews and review of program documentation in eight SEs.
Note: “Individual-level data” refers to detailed data on individual employees. “Tracking performance indicators” refers to performance-related counts or visualizations of key indicators, including outputs and outcomes related to employees and the organization.
2. Organizations lacked the capacity to fully use data collected.
At the time of our site visits, only three organizations had a data system to track important performance indicators at the aggregate level (Table III.6). Three other organizations reported that they were developing Microsoft Excel-driven “dashboards” to track some metrics, including employee service receipts, employee retention and exit, and job placements. Two organizations did not report any plans to develop dashboards or other types of data-aggregating systems. Staff at SEs currently lacking such systems suggested that they probably would be beneficial.
Some SEs had limited organizational capacity to collect or use data. Interviews suggested that limited staff skills and other resource constraints might explain why several organizations failed to deploy these systems. Nearly half of staff interviewed indicated that they had sufficient resources for data collection or an efficient data collection system. Just under two-thirds indicated having staff expertise to analyze data (Figure III.1).

III. Social Enterprise Operations and Challenges Mathematica Policy Research
29
Figure III.1. Staff Attitudes Toward Social Enterprise Data Capacity and Use of Data
Source: Appendix C, Table C.21.
Notes: Information is based on structured interviews with 36 staff members of SEs or parent organizations.
3. Tracking of employees after they left the social enterprise was limited.
REDF considers the SEs as a bridge to future employment. To assess progress toward achieving this goal and to identify unmet needs, staff need to monitor employees after they leave the SE. Four organizations tracked employees for one or two years after they left the SE. One of these organizations monitored employees’ job search activities only, and the other three collected more detailed employment information, including wages and benefits (Table III.7). In the other four organizations, employees who left the SE either were not tracked or were followed for a shorter period. As noted earlier, four organizations were still implementing their transitional employment model. Therefore, these organizations will be able to track post-SE employment outcomes after that model is in place.
Table III.7. Organizational Tracking of Employee Transitions
Social Enterprise Indices Tracked Tracking Timeline Back-to-Work Job search activities Up to 1 year Blue Skies Placements 90 days after exit (nonsystematic) Chrysalis Enterprises Job search activities Not noted CRCD Enterprises Employment details; education Up to 1 year (parent) Golden State Works Employment details Up to 1 year Hope Builders Employment details; support needs Up to 2 years (parent) Solutions SF Not tracked Not tracked 360° Solutions Developing Developing
Source: Site visit interviews and review of program documentation in eight SEs.
Note: “Placements” were a record of whether an employee found a job. “Employment details” were collection of more information about the post-transition job, including pay and benefits. “Job search activities” were a record of the number of applications sent out and interviews received.
Although one-year postemployment outcomes data are not yet available, the MJS has collected information on intermediate outcomes from workers when they left the SE or at six months of employment. We discuss these findings in the next chapter.
0
20
40
60
80
100
There is an efficient data collection system in place
There are sufficient resources to collect data
There are staff with expertise in data analysis
Staff translate discussions of data into actions
Perc
enta
ge A
gree

This page has been left blank for double-sided copying.
IV. Social Enterprise Outputs and Individual Outcomes Mathematica Policy Research
31
IV. SOCIAL ENTERPRISE OUTPUTS AND INDIVIDUAL OUTCOMES
The logic model presented in Figure I.1 highlights an expectation that the SE will produce two outputs: employment (toward REDF’s employment goals), and a positive work experience. These factors should imply changes in the key initial outcomes of SE employment for individuals: (1) increased work experience, (2) greater stability in life, and (3) a positive attitude toward work.13
13 The MJS did not collect data on work attitudes from individuals when they left the SE, so we will examine this
outcome in the final report.
In this chapter, we examine the outputs and outcomes associated with SE employment when employment ends. We focus on describing SE employment, including the number of workers employed, perceptions of the environment, and the nature of the work, as well as how workers’ lives stabilized during employment. Analysis undertaken addressed the question, What are the outputs and outcomes following SE employment? We drew information for this analysis from the MJS database (described in detail in Appendix A). Most information was taken from the exit survey administered to workers when they left the SE or after six months of employment, whichever came first.
Key Findings • Social enterprises in the MJS are helping achieve REDF’s employment goal, having
employed 831 workers who met hours requirements through March 2013. The SEs in the MJS collectively met about one-third of REDF’s 2015 employment target by March 2013. Chrysalis employed the largest number, hiring more than half of all employees. Organizations increased their employment, with the average number of workers meeting the hours requirement increasing from 24 per month between February 2011 and March 2012 to 40 per month between April 2012 and March 2013. On average, 83 percent of people hired by an SE during the MJS period met the hours requirement.
• Substantial variation exists in hours worked, reflecting diverse social enterprise program models and variation in turnover. On average, individuals worked 23 hours per week for 16 weeks in an SE, although considerable variation existed. About 14 percent worked fewer than 32 hours in total, and 26 percent worked more than 640 hours. Adjusting for background characteristics, employees at Taller San José and Weingart Center worked the most hours and had the highest monthly earnings. Employees at Buckelew worked the least hours.
• In general, workers were satisfied with their social enterprise experience, although satisfaction levels varied among the organizations. Employees at CHP and Weingart Center reported the greatest satisfaction, accounting for their background characteristics.
• Total income and earnings increased and the proportion of income from government transfers decreased when individuals were working in a social enterprise. The average employee earned $775 per month at the end of SE employment, with earnings at Taller San José and Weingart Center the highest and those at Chrysalis and CHP the lowest (after regression adjustment). Income increased by more than 75 percent during SE employment, with the largest share at exit coming from earnings (92 percent) and only seven percent coming from government transfers. In contrast, when individuals began SE employment, 23 percent of monthly income came from earnings and 68 percent came from government transfers.
• Individuals may have improved their mental health and had low recidivism rates while working at a social enterprise. Our index of mental health increased by an average of four percentiles, with larger gains occurring for workers at Buckelew and CEO (accounting for background characteristics). Only four percent of workers reported an arrest while working at an SE, with no significant differences across organizations.

IV. Social Enterprise Outputs and Individual Outcomes Mathematica Policy Research
32
Throughout the chapter, we use figures to highlight multifaceted outcomes or notable differences across organizations.14 An asterisk (*) indicates that a significant (p ≤ 0.05) difference exists across organizations or categories. The figures use averages or regression-adjusted averages to highlight outputs, outcomes, and changes that occurred during SE employment. The regression adjustment allows us to estimate averages as if there were no differences in the other variables included in the analysis (for example, past employment experience), all of which are shown in Appendix C, Section B.15 Even though this adjustment allows us to compare outcomes holding other factors constant, it cannot be used to infer the causal effect of SE employment. That is, our analysis is descriptive, and results cannot be interpreted to make causal inferences about the impact of SE employment on postprogram outcomes.16
In this chapter, we describe SE outputs and individual outcomes. Section A examines the number of people SEs employ and how many of them work enough to meet REDF’s definition of employment. Section B considers the dosage of SE employment—how long individuals work—and how this varies by SE. This section also explores some potential sources of variation in hours by examining why individuals chose to leave the SE (if they did so within six months of hire). Section C examines the SE experience from the workers’ perspectives, discussing satisfaction with this experience and changes in measures of life stability that SE employment might influence.
In addition, this chapter captures only a limited number of potential benefits associated with SE employment. Employees’ lives may change as they work in an SE in ways we cannot currently measure; parent organizations may also benefit from their SEs’ operations through remittances or other means not captured in this analysis.
A. Social Enterprises in the MJS Made Progress Toward Employment Goals
REDF set employment targets for each organization to try to meet its goal of employing 2,500 people between 2011 and 2015. Employment is defined as working 32 hours within a four-week period. During the first two years of the strategic plan, the MJS SEs made substantial progress toward achieving these employment targets. From February 1, 2011, to March 30, 2013, a total of 831 people met the hours requirement at an SE that was part of this study. Table IV.1 enumerates the employment at each organization and how it contributes to REDF’s goal. Individuals meeting the hours requirement are concentrated in a small number of SEs; Chrysalis Enterprises, the largest and oldest SE in REDF’s SIF portfolio, employed 55 percent of all SE workers during the period, followed by CEO, which employed about 19 percent of the total. The medium-size SEs run by Buckelew and CHP hired 11 and 7 percent of all workers, respectively. Other organizations ran smaller SEs and contributed more modestly to the goal. On average, 83 percent of workers hired by an SE met the hours requirement (for counting toward employment), although variation existed across organizations in this rate. Between April 1, 2012, and March 30, 2013, all individuals hired by the SEs run by CRC and Weingart Center met the hours requirement, but only 77 percent of those hired by the SEs run by Chrysalis did so.
14 Because most organizations parent a single SE, we used organization, and not SE, fixed-effects. 15 We do not discuss variation in outputs and outcomes across different types of individuals (for example, by race
or age) because the small sample sizes and large number of covariates make it difficult to conclude that any patterns along these dimensions are not simply spurious.
16 Analysis in the final report will use a comparison group and a QED to provide more plausibly causal estimates of the effect of SE employment on outcomes. It will also include more complete information on outcomes.

IV. Social Enterprise Outputs and Individual Outcomes Mathematica Policy Research
33
Table IV.1. Social Enterprise Employment
Time Frame Progress Toward Goal Percentage Hired That Met Hours
Requirement (Hired April 1,
2012, to March 30, 2013)
February 1, 2011, to March 30,
2012
Hired April 1, 2012, to March
30, 2013
Total (February 1,
2011, to March 30, 2013)
Percentage Employed
Through March 30, 2013
Percentage of 2,500
Goal
Total Number Met Requirement 340 491 831 n.a. 33.2 83.4 Buckelew 48 42 90 10.8 3.6 80.8 CEO 60 102 162 19.5 6.5 93.6 CHP 19 43 62 7.5 2.5 93.5 Chrysalis 205 256 461 55.4 18.4 76.7 CRC 0 31 31 3.7 1.2 100.0 CRCD 0 0 0 0.0 0.0 n.a. Taller San José 0 12 12 1.4 0.5 92.3 Weingart Center 1 5 6 0.7 0.2 100.0
Source: MJS database starting April 2012. Before April 2012, individual organizations reported numbers themselves.
n.a. = not applicable.
Employment increased during the period (Table IV.2). About 24 workers met the hours requirement each month between February 1, 2011, and March 30, 2012. About 40 workers met the requirement each month between April 1, 2012, and March 30, 2013. All organizations (except CRCD) participated in the increase.
Table IV.2. Changes in Social Enterprise Employment: Average Monthly Employment
February 1, 2011, to March 30, 2012
April 1, 2012, to March 30, 2013
Total (February 1, 2011, to
March 30, 2013) Average Number Employed per Month 24.3 40.3 31.7
Buckelew 3.4 3.5 3.5 CEO 4.3 8.3 6.1 CHP 1.4 3.6 2.4 Chrysalis 14.6 21.3 17.7 CRC 0.0 2.3 1.1 CRCD 0.0 0.0 0.0 Taller San José 0.0 1.0 0.5 Weingart Center 0.1 0.4 0.2
Source: MJS database starting April 2012. Before April 2012, individual organizations provided data themselves.
B. Time Spent Working in a Social Enterprise Varies across Programs and Individuals
The transitional employment model specifies that employees will work at an SE for a limited amount of time before transitioning to permanent employment. On average, individuals employed by a REDF-supported SE in the MJS worked 23 hours per week for 16 weeks. These means, however, mask substantial differences in the total number of hours worked. Quantitative and qualitative evidence suggests that two key factors drive variation in hours: (1) different SEs use different transitional employment program models; and (2) individuals leave their SEs for a variety of reasons, influencing the length of their tenure.
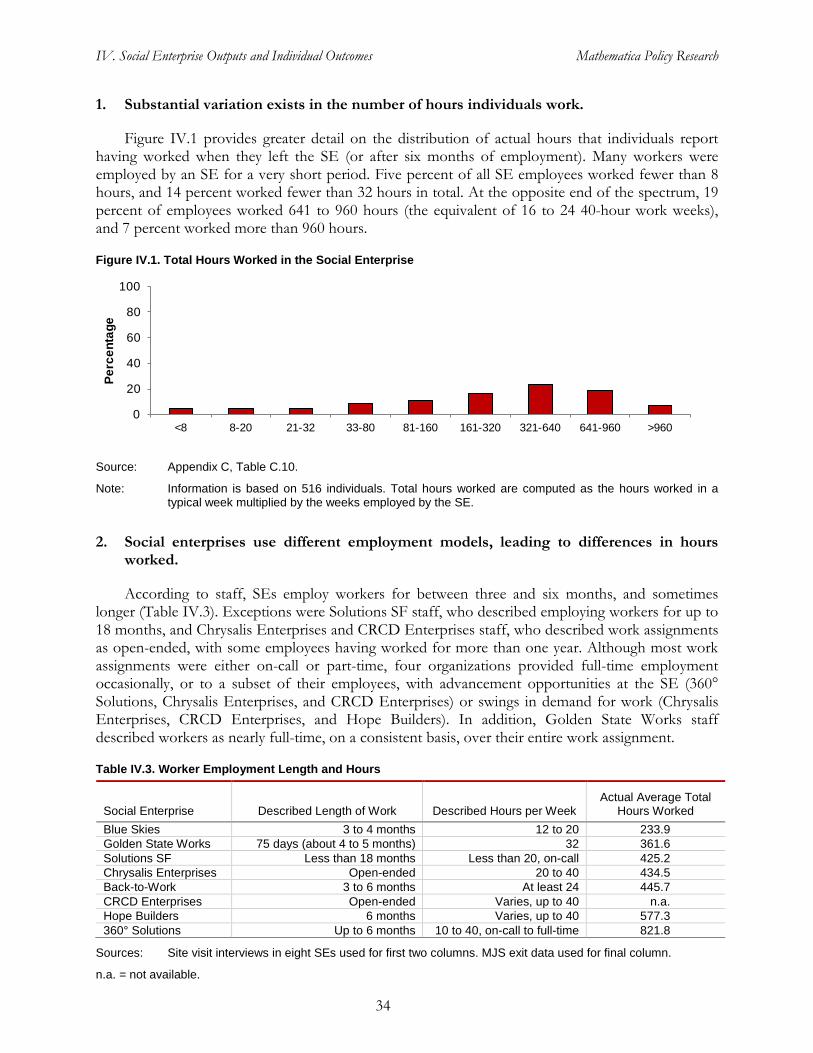
IV. Social Enterprise Outputs and Individual Outcomes Mathematica Policy Research
34
1. Substantial variation exists in the number of hours individuals work.
Figure IV.1 provides greater detail on the distribution of actual hours that individuals report having worked when they left the SE (or after six months of employment). Many workers were employed by an SE for a very short period. Five percent of all SE employees worked fewer than 8 hours, and 14 percent worked fewer than 32 hours in total. At the opposite end of the spectrum, 19 percent of employees worked 641 to 960 hours (the equivalent of 16 to 24 40-hour work weeks), and 7 percent worked more than 960 hours.
Figure IV.1. Total Hours Worked in the Social Enterprise
Source: Appendix C, Table C.10.
Note: Information is based on 516 individuals. Total hours worked are computed as the hours worked in a typical week multiplied by the weeks employed by the SE.
2. Social enterprises use different employment models, leading to differences in hours worked.
According to staff, SEs employ workers for between three and six months, and sometimes longer (Table IV.3). Exceptions were Solutions SF staff, who described employing workers for up to 18 months, and Chrysalis Enterprises and CRCD Enterprises staff, who described work assignments as open-ended, with some employees having worked for more than one year. Although most work assignments were either on-call or part-time, four organizations provided full-time employment occasionally, or to a subset of their employees, with advancement opportunities at the SE (360° Solutions, Chrysalis Enterprises, and CRCD Enterprises) or swings in demand for work (Chrysalis Enterprises, CRCD Enterprises, and Hope Builders). In addition, Golden State Works staff described workers as nearly full-time, on a consistent basis, over their entire work assignment.
Table IV.3. Worker Employment Length and Hours
Social Enterprise Described Length of Work Described Hours per Week Actual Average Total
Hours Worked Blue Skies 3 to 4 months 12 to 20 233.9 Golden State Works 75 days (about 4 to 5 months) 32 361.6 Solutions SF Less than 18 months Less than 20, on-call 425.2 Chrysalis Enterprises Open-ended 20 to 40 434.5 Back-to-Work 3 to 6 months At least 24 445.7 CRCD Enterprises Open-ended Varies, up to 40 n.a. Hope Builders 6 months Varies, up to 40 577.3 360° Solutions Up to 6 months 10 to 40, on-call to full-time 821.8
Sources: Site visit interviews in eight SEs used for first two columns. MJS exit data used for final column.
n.a. = not available.
0
20
40
60
80
100
<8 8-20 21-32 33-80 81-160 161-320 321-640 641-960 >960
Perc
enta
ge

IV. Social Enterprise Outputs and Individual Outcomes Mathematica Policy Research
35
Differences in these program models translate into differences in hours worked. For example, workers at Golden State Works are limited to 75 days of work, contributing to their low number of total hours (362). Individuals could also work a different number of hours per week. Because workers at CRC are generally limited to part-time work, they might work fewer total hours (on average, they worked 446 hours at the SE). Employees at Taller San José are expected to work full-time (when projects are available), which contributes to their relatively high number (577) of hours worked.
By holding the characteristics of workers constant, regression analysis helps us demonstrate that the variation in hours worked across SEs is also likely not a by-product of differences in the populations that SEs serve. Figure IV.2 demonstrates the variation in total hours using regression-adjusted averages. After adjustment, employees at the SE run by Weingart Center still worked the most hours (regression-adjusted average of 949 hours), and those at Buckelew’s SEs worked the least (282 hours).
Figure IV.2. Regression-Adjusted Total Hours Worked, by Organization
Source: Appendix C, Table C.13.
Notes: Information is based on 516 individuals. Figure shows regression-adjusted means. Black bars show 95 percent confidence intervals. Total hours worked are computed as the hours worked in a typical week multiplied by the weeks employed by the SE.
*Outcomes differ significantly (p ≤ 0.05) across organizations.
3. Individuals most often leave social enterprise employment because they find another job or are terminated or dissatisfied. These different reasons for exit imply differences in total hours worked.
Differences in the hours of work could also reflect different reasons and rates of leaving the SE. Employees who become frustrated and leave the SE before their slated period of work is complete might log fewer total hours than other workers. However, workers who quickly transition to outside employment opportunities also might have a smaller number of total hours worked.
0200400600800
1,0001,2001,4001,600
Buckelew CEO Chrysalis CHP CRC Taller Weingart
Tota
l Hou
rs W
orke
d
Organization*
San José Center
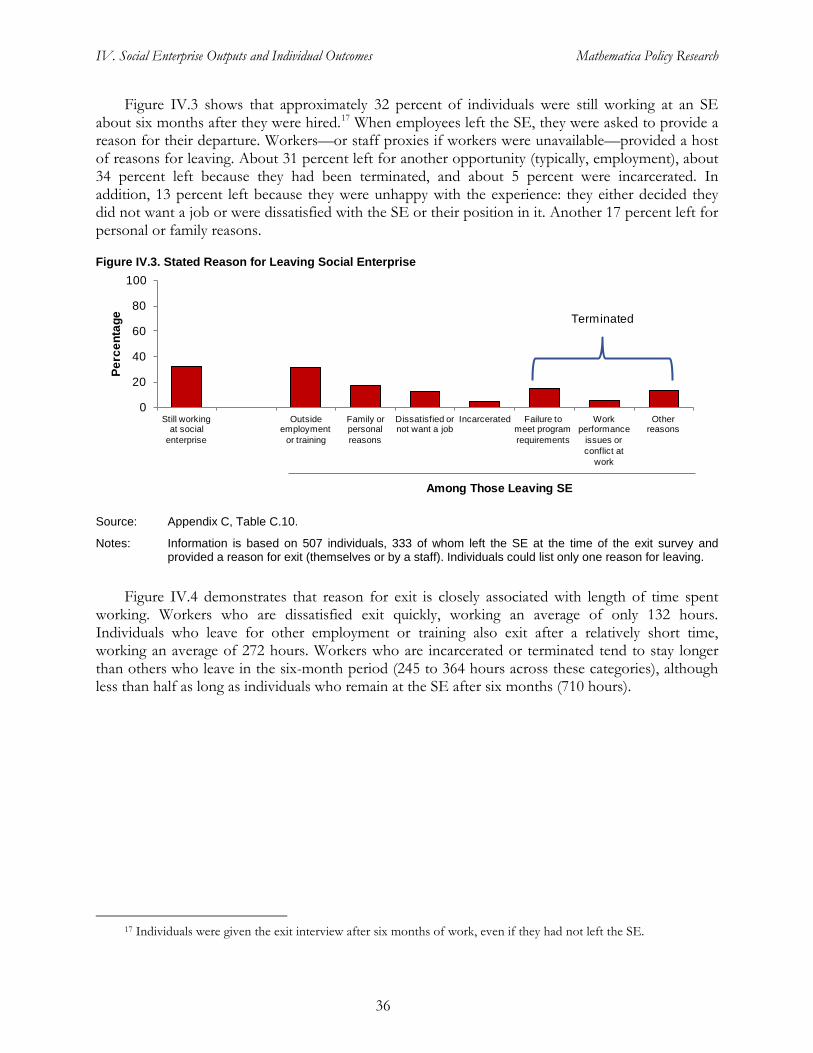
IV. Social Enterprise Outputs and Individual Outcomes Mathematica Policy Research
36
Figure IV.3 shows that approximately 32 percent of individuals were still working at an SE about six months after they were hired.17
Figure IV.3. Stated Reason for Leaving Social Enterprise
When employees left the SE, they were asked to provide a reason for their departure. Workers—or staff proxies if workers were unavailable—provided a host of reasons for leaving. About 31 percent left for another opportunity (typically, employment), about 34 percent left because they had been terminated, and about 5 percent were incarcerated. In addition, 13 percent left because they were unhappy with the experience: they either decided they did not want a job or were dissatisfied with the SE or their position in it. Another 17 percent left for personal or family reasons.
Source: Appendix C, Table C.10.
Notes: Information is based on 507 individuals, 333 of whom left the SE at the time of the exit survey and provided a reason for exit (themselves or by a staff). Individuals could list only one reason for leaving.
Figure IV.4 demonstrates that reason for exit is closely associated with length of time spent working. Workers who are dissatisfied exit quickly, working an average of only 132 hours. Individuals who leave for other employment or training also exit after a relatively short time, working an average of 272 hours. Workers who are incarcerated or terminated tend to stay longer than others who leave in the six-month period (245 to 364 hours across these categories), although less than half as long as individuals who remain at the SE after six months (710 hours).
17 Individuals were given the exit interview after six months of work, even if they had not left the SE.
0
20
40
60
80
100
Still working at social
enterprise
Outsideemployment
or training
Family or personal reasons
Dissatisfied or not want a job
Incarcerated Failure to meet program requirements
Work performance
issues orconflict at
work
Otherreasons
Perc
enta
ge
Among Those Leaving SE
Terminated
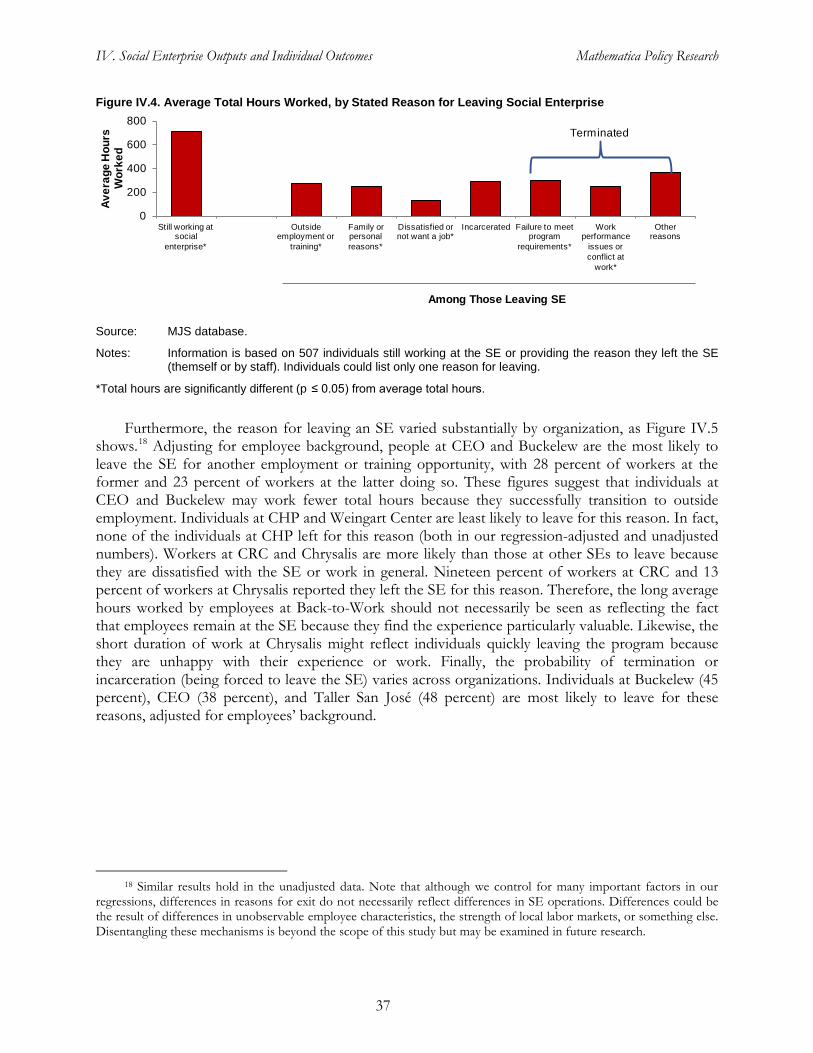
IV. Social Enterprise Outputs and Individual Outcomes Mathematica Policy Research
37
Figure IV.4. Average Total Hours Worked, by Stated Reason for Leaving Social Enterprise
Source: MJS database.
Notes: Information is based on 507 individuals still working at the SE or providing the reason they left the SE (themself or by staff). Individuals could list only one reason for leaving.
*Total hours are significantly different (p ≤ 0.05) from average total hours.
Furthermore, the reason for leaving an SE varied substantially by organization, as Figure IV.5 shows.18
Adjusting for employee background, people at CEO and Buckelew are the most likely to leave the SE for another employment or training opportunity, with 28 percent of workers at the former and 23 percent of workers at the latter doing so. These figures suggest that individuals at CEO and Buckelew may work fewer total hours because they successfully transition to outside employment. Individuals at CHP and Weingart Center are least likely to leave for this reason. In fact, none of the individuals at CHP left for this reason (both in our regression-adjusted and unadjusted numbers). Workers at CRC and Chrysalis are more likely than those at other SEs to leave because they are dissatisfied with the SE or work in general. Nineteen percent of workers at CRC and 13 percent of workers at Chrysalis reported they left the SE for this reason. Therefore, the long average hours worked by employees at Back-to-Work should not necessarily be seen as reflecting the fact that employees remain at the SE because they find the experience particularly valuable. Likewise, the short duration of work at Chrysalis might reflect individuals quickly leaving the program because they are unhappy with their experience or work. Finally, the probability of termination or incarceration (being forced to leave the SE) varies across organizations. Individuals at Buckelew (45 percent), CEO (38 percent), and Taller San José (48 percent) are most likely to leave for these reasons, adjusted for employees’ background.
18 Similar results hold in the unadjusted data. Note that although we control for many important factors in our
regressions, differences in reasons for exit do not necessarily reflect differences in SE operations. Differences could be the result of differences in unobservable employee characteristics, the strength of local labor markets, or something else. Disentangling these mechanisms is beyond the scope of this study but may be examined in future research.
0
200
400
600
800
Still working at social
enterprise*
Outsideemployment or
training*
Family or personal reasons*
Dissatisfied or not want a job*
Incarcerated Failure to meet program
requirements*
Work performance
issues orconflict at
work*
Otherreasons
Aver
age
Hou
rsW
orke
d
Among Those Leaving SE
Terminated

IV. Social Enterprise Outputs and Individual Outcomes Mathematica Policy Research
38
Figure IV.5. Regression-Adjusted Reason for Leaving Social Enterprise, by Organization
Source: Appendix C, Table C.14.
Notes: Information is based on 507 individuals still working at the SE or having information for the main reason left the SE (reasons for leaving are set to zero for those still employed at the SE). The figure shows the regression-adjusted percentage providing each reason. Black bars show 95 percent confidence intervals.
*Outcomes are significantly different (p ≤ 0.05) across organizations.
All together, our examination of time spent working and reasons for exit suggests that the dosage of the SE experience varies a great deal across and within SEs. The program models chosen by the different SEs and differences in reasons for leaving an SE both likely contribute to these differences in acquired work experience.
C. Workers had Positive Experiences While Working in a Social Enterprise
The average person in the MJS spent 16 weeks in an SE, and 29 percent were employed by an SE for six months or more. In this section, we explore individuals’ satisfaction with this time spent at an SE and the changes that occurred in their lives during the SE employment period. As previously noted, we can only describe how individuals’ lives changed and the satisfaction they report with the SE. Life stability may evolve during this period for a variety of reasons unrelated to SE employment, and changes do not necessarily reflect the effect of the SE experience. In addition, any variation in satisfaction or outcomes of SE employment may not necessarily be attributable to differences in SE characteristics or activities; a variety of factors may be responsible for these differences. Therefore, our results suggest that workers had largely positive experiences with SE employment but cannot prove that their lives improved because of this experience.
1. Employees valued their jobs.
The exit survey asked individuals how satisfied they were with various aspects of the SE experience, including those related to activities on the job and compensation. Unlike the information on the reason for leaving the SE, staff did not complete this portion of the survey for individuals who were unavailable. Individuals reported a high level of satisfaction with most elements of the SE experience (Figure IV.6). Nearly all reported they were satisfied with their job’s contribution to society (98 percent), the independence they had on the job (93 percent), the feedback they received at work (90 percent), and the support available at the SE (92 percent). They were somewhat less
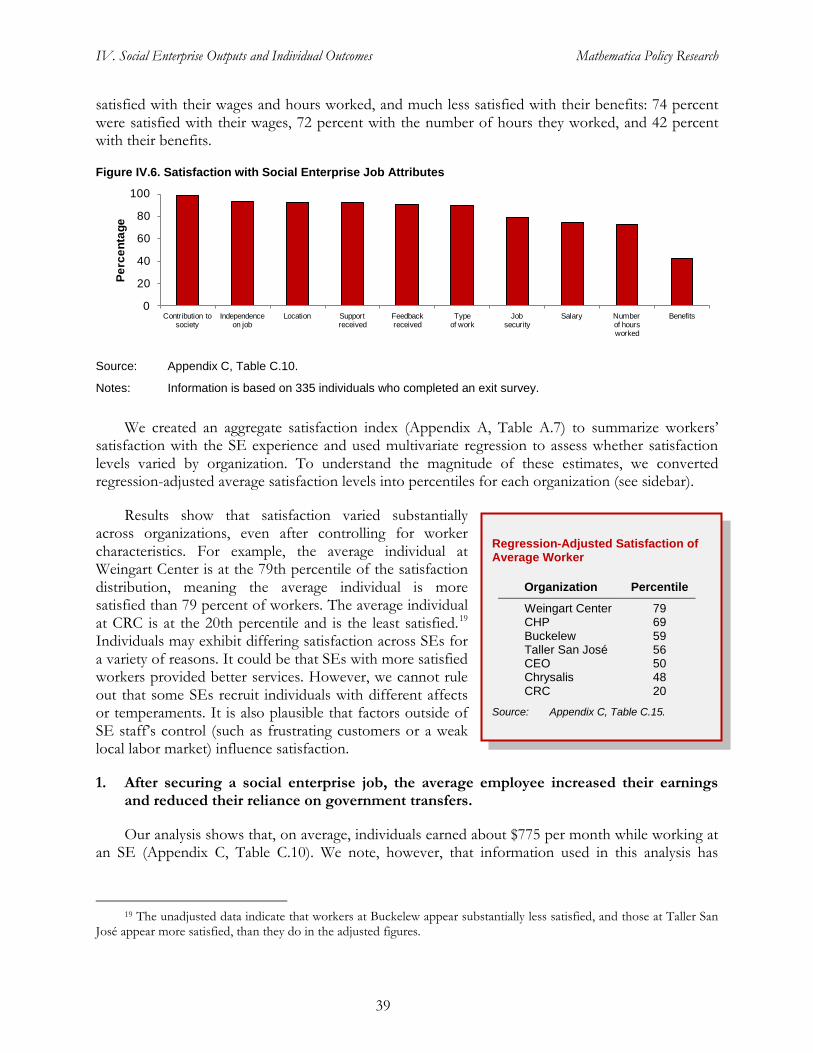
IV. Social Enterprise Outputs and Individual Outcomes Mathematica Policy Research
39
satisfied with their wages and hours worked, and much less satisfied with their benefits: 74 percent were satisfied with their wages, 72 percent with the number of hours they worked, and 42 percent with their benefits.
Figure IV.6. Satisfaction with Social Enterprise Job Attributes
Source: Appendix C, Table C.10.
Notes: Information is based on 335 individuals who completed an exit survey.
We created an aggregate satisfaction index (Appendix A, Table A.7) to summarize workers’ satisfaction with the SE experience and used multivariate regression to assess whether satisfaction levels varied by organization. To understand the magnitude of these estimates, we converted regression-adjusted average satisfaction levels into percentiles for each organization (see sidebar).
Results show that satisfaction varied substantially across organizations, even after controlling for worker characteristics. For example, the average individual at Weingart Center is at the 79th percentile of the satisfaction distribution, meaning the average individual is more satisfied than 79 percent of workers. The average individual at CRC is at the 20th percentile and is the least satisfied.19
1. After securing a social enterprise job, the average employee increased their earnings and reduced their reliance on government transfers.
Individuals may exhibit differing satisfaction across SEs for a variety of reasons. It could be that SEs with more satisfied workers provided better services. However, we cannot rule out that some SEs recruit individuals with different affects or temperaments. It is also plausible that factors outside of SE staff’s control (such as frustrating customers or a weak local labor market) influence satisfaction.
Our analysis shows that, on average, individuals earned about $775 per month while working at an SE (Appendix C, Table C.10). We note, however, that information used in this analysis has
19 The unadjusted data indicate that workers at Buckelew appear substantially less satisfied, and those at Taller San
José appear more satisfied, than they do in the adjusted figures.
0
20
40
60
80
100
Contribution to society
Independence on job
Location Supportreceived
Feedbackreceived
Typeof work
Jobsecurity
Salary Numberof hoursworked
Benefits
Perc
enta
ge
Regression-Adjusted Satisfaction of Average Worker
Organization Percentile
Weingart Center 79 CHP 69 Buckelew 59 Taller San José 56 CEO 50 Chrysalis 48 CRC 20
Source: Appendix C, Table C.15.

IV. Social Enterprise Outputs and Individual Outcomes Mathematica Policy Research
40
relatively high levels of missing data (Appendix A). Therefore caution is dictated in interpreting results in this section.
Earnings varied across organizations, however, reflecting differences in the hours individuals worked and rates of pay. Adjusting for background characteristics, workers at CHP and Chrysalis reported the lowest monthly earnings, with those at CHP earning $452 per month and those at Chrysalis earning $462 per month (after regression-adjustment, see Appendix C, Table C.13). Workers at Taller San José had the highest monthly salaries, averaging regression-adjusted-earnings of $1,696 per month. Many of these differences are the result of different hours worked. When one looks at hourly wages instead of monthly earnings, individuals at CEO and Taller San José reported somewhat higher wages than average (with only the former being statistically different from average wages after regression adjustment). Regression-adjusted hourly wages at all other SEs are not statistically distinguishable and range from $8 to $11 per hour.
On average, employees’ earnings rose substantially after securing an SE position, and unearned income fell, leading to changes in the level and composition of their total income. For individuals who report full income records at both baseline and exit (202 employees), total monthly income increased by more than 75 percent, from $696 to $1,237 (Appendix C, Table C.12). Income growth was most pronounced for workers at CEO (106 percent growth) and Chrysalis (89 percent growth).20
Figure IV.7. Composition of Income at Hire and Exit
Figure IV.7 shows how the sources of income changed as a person worked in an SE. When hired, the average worker reported that about two-thirds of income came from government programs, and eight percent came from family, friends, and transfers like alimony and child support. At exit, earnings comprised 92 percent of monthly income, making it by far the major source of workers’ funds. Few differences existed across organizations in these changes (Appendix C, Table C.17).
Source: Appendix C, Tables C.9 and C.11.
Note: Information is based on 427 individuals at hire providing full income records with non-zero income and 186 individuals at exit providing full income records with non-zero income.
20 Percent changes in average income for individuals reporting full records at hire and exit.
92%
7%
<1%<1%
At Exit
Work
Government Programs
Transfers from Family, Friends, and Others
Other Sources
23%
68%
8%
1%
At Hire
IV. Social Enterprise Outputs and Individual Outcomes Mathematica Policy Research
41
2. Employee housing appears more stable when working at a social enterprise than in the week before being hired.
Our analysis suggests that people moved into more stable housing when employed at an SE.21 In the week before workers were hired by the SE, 26 percent owned or rented a home, apartment, or room for the entire week. In the week before they left the SE (or after six months), 47 percent owned or rented their residence (Appendix C, Table C.12). Additionally, 16 percent reported being homeless at some point in the week before hire, and 14 percent were homeless for most of the week before they exited the SE.22
3. Few workers recidivated while employed by a social enterprise.
Our regression analysis revealed that few patterns emerged across organizations in housing at exit, although workers from Weingart Center were more likely to report having their own home at the time the left the SE, and people at CHP were significantly less likely than those at Chrysalis (the reference category) to have their own home (Appendix C, Table C.16).
Only four percent of individuals reported being arrested while working at an SE (Appendix C, Table C.12). Because individuals who left the organization with incarceration did not complete the exit interview, they were not able to report an arrest, leaving this percentage to underestimate the number of individuals involved in the criminal justice system. No significant differences exist across organizations in our multivariate analysis (Appendix C, Table C.18).
4. Employee struggles with mental health and substance abuse issues lessened while at the social enterprise.
About one in every 20 workers reported having a mental or emotional health problem that impeded their employment prospects at the time they were hired by an SE (Appendix C, Table C.7). To see how mental health might have changed between the time of hire and exit from the SE, we created an index based on a battery of questions at baseline about depression and other bothersome feelings in the past week. This index was designed to have a mean of zero and standard deviation of one, with higher values indicating that an individual is more bothered by negative feelings. By applying the same mean and standard deviation to the data collected on the battery of questions collected at exit, any change in the index represents a change in self-reported mental health. The average fell to -0.09 at exit, which was not significant (Appendix C, Table C.12). This change suggests that mental health improved by 0.09 standard deviations while individuals worked at an SE, or that the average worker at exit reported having mental health better than 54 percent of individuals at the time they were hired by the SE.
In addition, fewer individuals reported drinking in excess or using drugs while employed by the SE than reported these activities in the year before SE hire (Appendix C, Table C.12). When hired, 24 percent of individuals reported drinking in excess, 17 percent reported smoking marijuana or hashish, and 6 percent reported using some hard drug in the past year. At exit (or six months of employment), 11 percent reported drinking four or more alcoholic beverages in one day, 9 percent reported smoking marijuana or hashish, and 1 percent reported using hard drugs while employed by
21 Our housing measures collected at baseline and exit are not identical. Appendix A, Table A.7 explains. 22 Individuals are classified as homeless if they are in transitional housing, use shelters or emergency vouchers for
housing, or sleep outside or in public because other options are not available.
IV. Social Enterprise Outputs and Individual Outcomes Mathematica Policy Research
42
the SE. Still, 14 percent reported having substance abuse issues interfere with their life while working at an SE,23
These outcomes, although mostly positive, do not necessarily establish that SE workers did better than they would have without SEs. However, the outcomes are encouraging and call for further exploration of the impacts of SEs on workers’ lives. Our final report will include analyses of these impacts, using a comparison group of similar employees not hired by SEs.
with individuals reporting such problems at hire more likely to report having them while at the SE (Appendix C, Table C.18). Differences between organizations in substance abuse were generally not statistically significant.
23 Having substance abuse issues interfere with their life is defined as either reporting that alcohol consumption
interfered with life or having been in a counseling or related program for substance abuse. This measure captures only self-reports of substance abuse and therefore must be interpreted cautiously. Individuals who did not report substance abuse issues include those who do not have these issues and those who abuse alcohol or drugs but do not feel this impedes their life and have not sought treatment.

References Mathematica Policy Research
43
REFERENCES
California Office of the Legislative Analyst. Judicial & Criminal Justice 2007-08 Analysis. Sacramento, CA: COLA, 2008. Available at [http://www.lao.ca.gov/analysis_2007/crim_justice/ crimjust_anl07.pdf]. Accessed June 8, 2011.
Sattar, Samina. “Evidence Scan of Work Experience Programs.” Oakland, CA: Mathematica Policy Research, 2010.
Stuart, H. “Mental Illness and Employment Discrimination.” Current Opinion in Psychiatry, vol. 19, no. 5, 2006, pp. 522–526.

This page has been left blank for double-sided copying.

APPENDIX A
DATA COLLECTION AND ANALYSIS FOR INDIVIDUALS

This page has been left blank for double-sided copying.
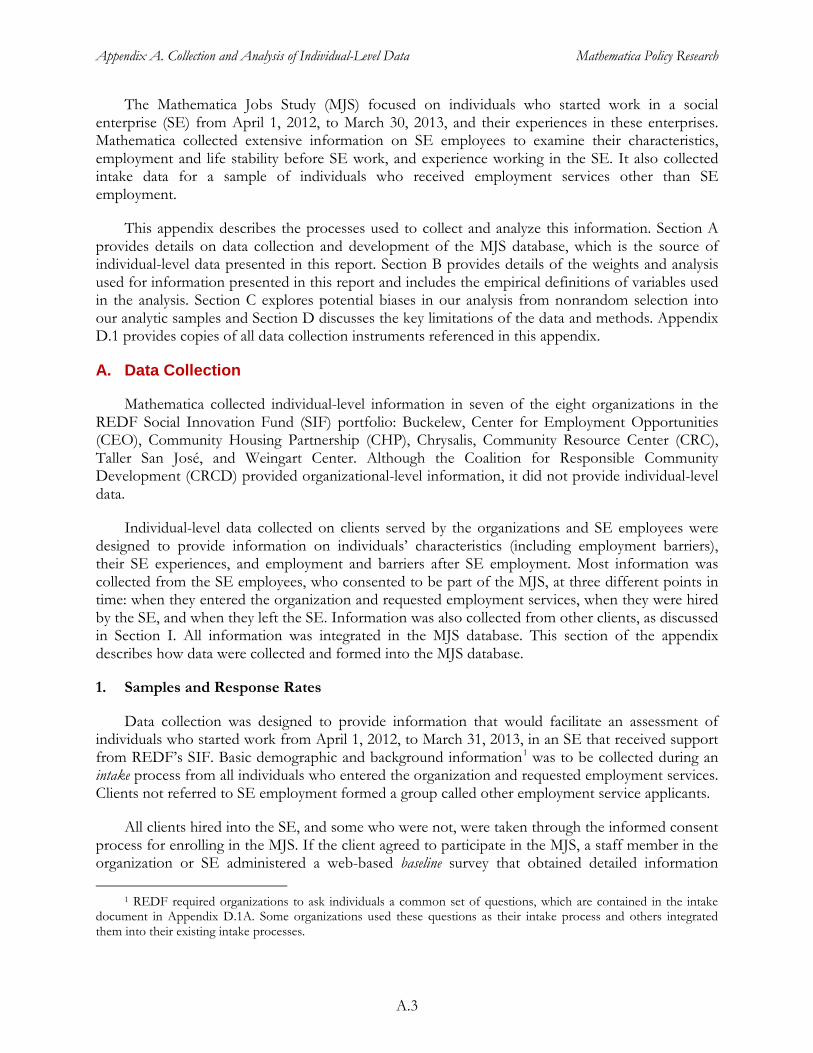
Appendix A. Collection and Analysis of Individual-Level Data Mathematica Policy Research
A.3
The Mathematica Jobs Study (MJS) focused on individuals who started work in a social enterprise (SE) from April 1, 2012, to March 30, 2013, and their experiences in these enterprises. Mathematica collected extensive information on SE employees to examine their characteristics, employment and life stability before SE work, and experience working in the SE. It also collected intake data for a sample of individuals who received employment services other than SE employment.
This appendix describes the processes used to collect and analyze this information. Section A provides details on data collection and development of the MJS database, which is the source of individual-level data presented in this report. Section B provides details of the weights and analysis used for information presented in this report and includes the empirical definitions of variables used in the analysis. Section C explores potential biases in our analysis from nonrandom selection into our analytic samples and Section D discusses the key limitations of the data and methods. Appendix D.1 provides copies of all data collection instruments referenced in this appendix.
A. Data Collection
Mathematica collected individual-level information in seven of the eight organizations in the REDF Social Innovation Fund (SIF) portfolio: Buckelew, Center for Employment Opportunities (CEO), Community Housing Partnership (CHP), Chrysalis, Community Resource Center (CRC), Taller San José, and Weingart Center. Although the Coalition for Responsible Community Development (CRCD) provided organizational-level information, it did not provide individual-level data.
Individual-level data collected on clients served by the organizations and SE employees were designed to provide information on individuals’ characteristics (including employment barriers), their SE experiences, and employment and barriers after SE employment. Most information was collected from the SE employees, who consented to be part of the MJS, at three different points in time: when they entered the organization and requested employment services, when they were hired by the SE, and when they left the SE. Information was also collected from other clients, as discussed in Section I. All information was integrated in the MJS database. This section of the appendix describes how data were collected and formed into the MJS database.
1. Samples and Response Rates
Data collection was designed to provide information that would facilitate an assessment of individuals who started work from April 1, 2012, to March 31, 2013, in an SE that received support from REDF’s SIF. Basic demographic and background information1
All clients hired into the SE, and some who were not, were taken through the informed consent process for enrolling in the MJS. If the client agreed to participate in the MJS, a staff member in the organization or SE administered a web-based baseline survey that obtained detailed information
was to be collected during an intake process from all individuals who entered the organization and requested employment services. Clients not referred to SE employment formed a group called other employment service applicants.
1 REDF required organizations to ask individuals a common set of questions, which are contained in the intake
document in Appendix D.1A. Some organizations used these questions as their intake process and others integrated them into their existing intake processes.

Appendix A. Collection and Analysis of Individual-Level Data Mathematica Policy Research
A.4
about the client’s work history and employment barriers. The survey took about 25 minutes to administer. When study participants left the SE or worked in it for six months (whichever came first), a Mathematica-trained staff member at the organization administered an exit survey that obtained information about working in the SE and employment barriers. The exit survey generally took about 25 minutes to complete and participants received a $20 gift card upon its completion. Additional information is being collected on study participants about one year after they were referred to SE work; however, that information is not used in this report.
The MJS collected intake information from 1,423 individuals (Table A.1). Nearly 65 percent of these individuals (918) were referred for SE employment, with 596 (65 percent) ultimately hired by an SE. The 505 individuals who were not referred to an SE (35 percent) comprise the group of other employment services applicants. Because organizations used different intake processes, the composition of clients included in the intake sample varies across organizations. Intake information at Taller San José, Weingart Center, and Buckelew generally contains information on all clients who requested employment services from April 1, 2012, through March 31, 2013. Intake information for clients at CHP and Chrysalis reflects a sample of those who requested employment services, with information collected on everyone making this request during a set period (for example, a two-week window). Because virtually all clients at CRC and CEO are referred to SE employment, intake information in these organizations reflects almost everyone referred to SE employment (that is, only a small group of individuals are in the set of other employment service applicants in these organizations).
Table A.1. Number of Individuals with Intake Information
Total Buckelew CEO Chrysalis CHP CRC
Taller San José
Weingart Center
Intake Information 1,423 116 129 620 97 158 107 196 Not Referred for SE Employment (other employment service applicants) 505 31 2 134 50 8 93 187 Referred for SE Employment 918 85 127 486 47 150 14 9
Source: MJS database.
Of the 918 individuals referred to SE employment, 596 (65 percent) were hired by an SE from April 1, 2012, to March 30, 2013.2 Nearly 90 percent of these individuals consented to become MJS study participants (treatment group).3
2 Individuals hired by the SE before or after outside the study period were not counted as hired for purposes of
data collection. Of the 322 clients referred to SE employment but not hired, 105 (33 percent) comprise a comparison group. All were from Chrysalis, because it was the only organization that administered the baseline survey to clients not ultimately hired by the SE. Individuals in the comparison group are not part of the analysis presented in this report.
The 524 individuals in the treatment group are the focus of the quantitative analysis presented in this report. Table A.2 shows their distribution across organizations. The 300 individuals at Chrysalis constitute 57 percent of the treatment group. The 94 individuals at CEO constitute 18 percent of the treatment group. In contrast, Taller San José and Weingart Center contribute a very small number of observations to the treatment group, with and 13 from Taller San José and 3 from Weingart Center.
3 Four individuals at CEO were hired but did not begin work. They are considered part of the treatment group because they were offered the opportunity to work in the SE.
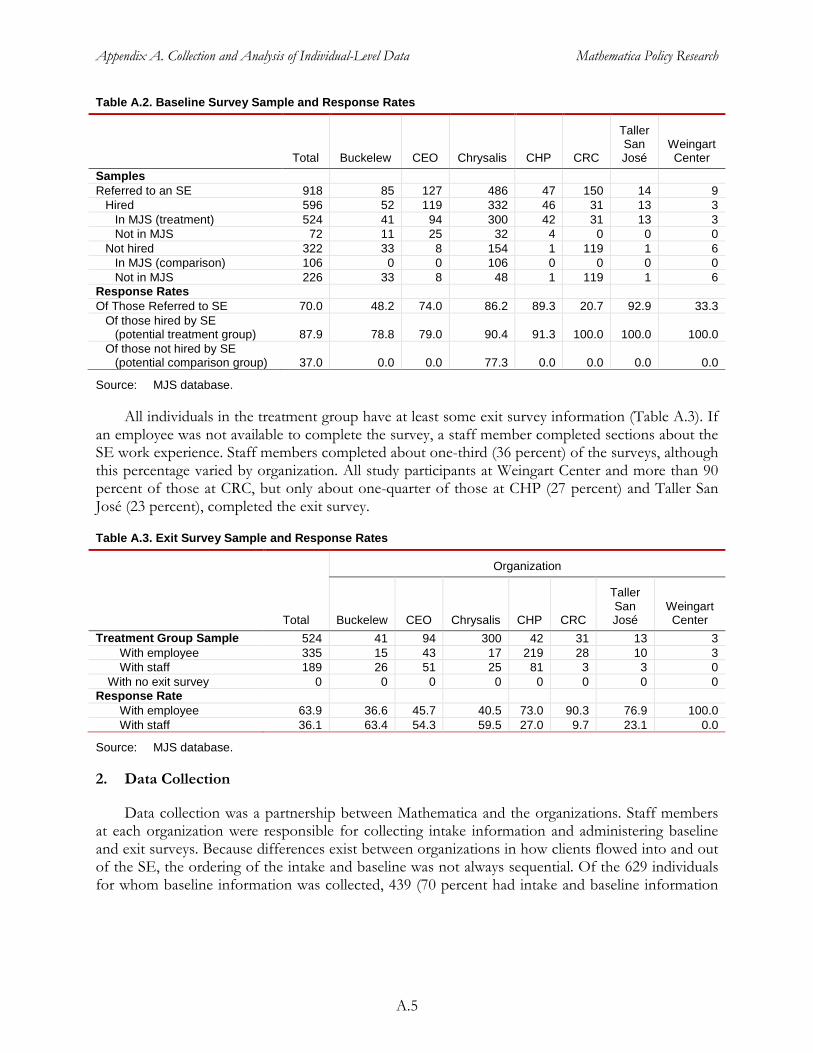
Appendix A. Collection and Analysis of Individual-Level Data Mathematica Policy Research
A.5
Table A.2. Baseline Survey Sample and Response Rates
Total Buckelew CEO Chrysalis CHP CRC
Taller San José
Weingart Center
Samples Referred to an SE 918 85 127 486 47 150 14 9
Hired 596 52 119 332 46 31 13 3 In MJS (treatment) 524 41 94 300 42 31 13 3 Not in MJS 72 11 25 32 4 0 0 0
Not hired 322 33 8 154 1 119 1 6 In MJS (comparison) 106 0 0 106 0 0 0 0 Not in MJS 226 33 8 48 1 119 1 6
Response Rates Of Those Referred to SE 70.0 48.2 74.0 86.2 89.3 20.7 92.9 33.3
Of those hired by SE (potential treatment group) 87.9 78.8 79.0 90.4 91.3 100.0 100.0 100.0
Of those not hired by SE (potential comparison group) 37.0 0.0 0.0 77.3 0.0 0.0 0.0 0.0
Source: MJS database.
All individuals in the treatment group have at least some exit survey information (Table A.3). If an employee was not available to complete the survey, a staff member completed sections about the SE work experience. Staff members completed about one-third (36 percent) of the surveys, although this percentage varied by organization. All study participants at Weingart Center and more than 90 percent of those at CRC, but only about one-quarter of those at CHP (27 percent) and Taller San José (23 percent), completed the exit survey.
Table A.3. Exit Survey Sample and Response Rates
Organization
Total Buckelew CEO Chrysalis CHP CRC
Taller San José
Weingart Center
Treatment Group Sample 524 41 94 300 42 31 13 3 With employee 335 15 43 17 219 28 10 3 With staff 189 26 51 25 81 3 3 0
With no exit survey 0 0 0 0 0 0 0 0 Response Rate
With employee 63.9 36.6 45.7 40.5 73.0 90.3 76.9 100.0 With staff 36.1 63.4 54.3 59.5 27.0 9.7 23.1 0.0
Source: MJS database.
2. Data Collection
Data collection was a partnership between Mathematica and the organizations. Staff members at each organization were responsible for collecting intake information and administering baseline and exit surveys. Because differences exist between organizations in how clients flowed into and out of the SE, the ordering of the intake and baseline was not always sequential. Of the 629 individuals for whom baseline information was collected, 439 (70 percent had intake and baseline information
Appendix A. Collection and Analysis of Individual-Level Data Mathematica Policy Research
A.6
collected on the same day, 171 (27 percent) had intake data collected before baseline data, and 19 (3 percent) had baseline information collected before intake.4
a. Intake Information
Intake data consist of five different types of information, with clients providing details on demographics, work history, and individual-assessed employment barriers and organization staff providing a brief assessment of employment barriers and information on SE employment:
1. Demographics, including gender, ethnicity, race, date of birth, marital status, schooling, and dependents and veteran’s status
2. Past work, including whether the client worked in the last week, month, six months, and year, and the last time the client worked continuously (more than 20 hours and six months for the same employer)
3. Individual-assessed barriers, including housing, arrests, and convictions
4. Counselor-assessed barriers, including support needed, English language ability, and poverty-level income
5. SE employment, including whether clients were referred for employment and, if they were, the date they started work and whether they worked 32 hours in four weeks
Intake data had very low rates of missing values, as shown in Table A.4. More than 95 percent of individuals reported full demographic records. Data on employment history and barriers are more often missing, but we still have a response rate greater than 90 percent for these questions.
4The baseline survey could have been administered before intake for several reasons. For example, some SEs hire
workers referred from a partner organization. These individuals might complete a baseline survey when they were hired and then complete intake a short time later as part of the MJS.
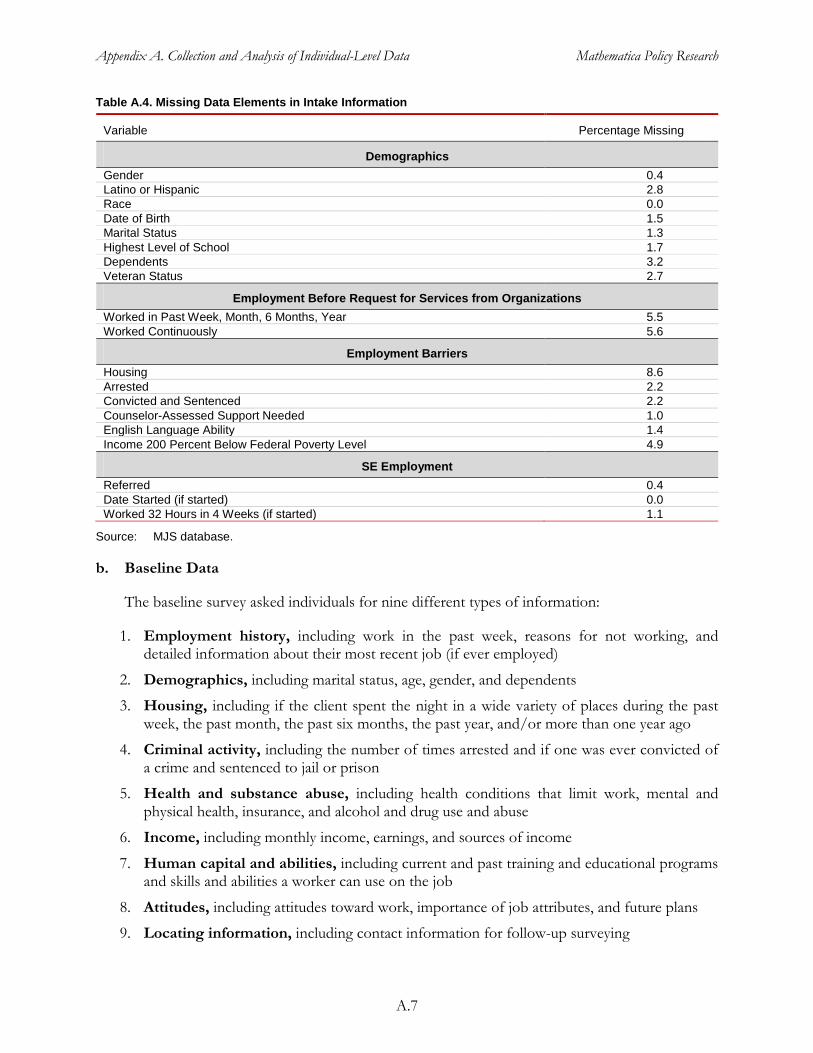
Appendix A. Collection and Analysis of Individual-Level Data Mathematica Policy Research
A.7
Table A.4. Missing Data Elements in Intake Information
Variable Percentage Missing
Demographics Gender 0.4 Latino or Hispanic 2.8 Race 0.0 Date of Birth 1.5 Marital Status 1.3 Highest Level of School 1.7 Dependents 3.2 Veteran Status 2.7
Employment Before Request for Services from Organizations Worked in Past Week, Month, 6 Months, Year 5.5 Worked Continuously 5.6
Employment Barriers Housing 8.6 Arrested 2.2 Convicted and Sentenced 2.2 Counselor-Assessed Support Needed 1.0 English Language Ability 1.4 Income 200 Percent Below Federal Poverty Level 4.9
SE Employment Referred 0.4 Date Started (if started) 0.0 Worked 32 Hours in 4 Weeks (if started) 1.1
Source: MJS database.
b. Baseline Data
The baseline survey asked individuals for nine different types of information:
1. Employment history, including work in the past week, reasons for not working, and detailed information about their most recent job (if ever employed)
2. Demographics, including marital status, age, gender, and dependents
3. Housing, including if the client spent the night in a wide variety of places during the past week, the past month, the past six months, the past year, and/or more than one year ago
4. Criminal activity, including the number of times arrested and if one was ever convicted of a crime and sentenced to jail or prison
5. Health and substance abuse, including health conditions that limit work, mental and physical health, insurance, and alcohol and drug use and abuse
6. Income, including monthly income, earnings, and sources of income
7. Human capital and abilities, including current and past training and educational programs and skills and abilities a worker can use on the job
8. Attitudes, including attitudes toward work, importance of job attributes, and future plans
9. Locating information, including contact information for follow-up surveying
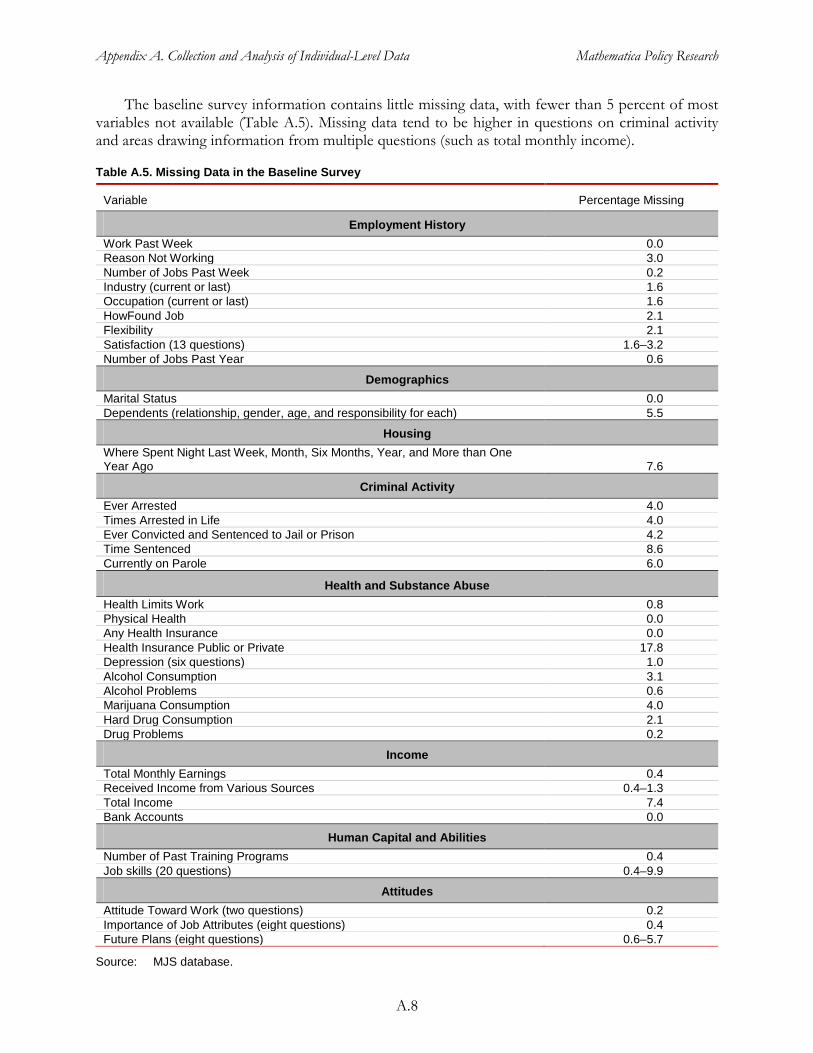
Appendix A. Collection and Analysis of Individual-Level Data Mathematica Policy Research
A.8
The baseline survey information contains little missing data, with fewer than 5 percent of most variables not available (Table A.5). Missing data tend to be higher in questions on criminal activity and areas drawing information from multiple questions (such as total monthly income).
Table A.5. Missing Data in the Baseline Survey
Variable Percentage Missing
Employment History Work Past Week 0.0 Reason Not Working 3.0 Number of Jobs Past Week 0.2 Industry (current or last) 1.6 Occupation (current or last) 1.6 HowFound Job 2.1 Flexibility 2.1 Satisfaction (13 questions) 1.6–3.2 Number of Jobs Past Year 0.6
Demographics Marital Status 0.0 Dependents (relationship, gender, age, and responsibility for each) 5.5
Housing Where Spent Night Last Week, Month, Six Months, Year, and More than One Year Ago 7.6
Criminal Activity Ever Arrested 4.0 Times Arrested in Life 4.0 Ever Convicted and Sentenced to Jail or Prison 4.2 Time Sentenced 8.6 Currently on Parole 6.0
Health and Substance Abuse Health Limits Work 0.8 Physical Health 0.0 Any Health Insurance 0.0 Health Insurance Public or Private 17.8 Depression (six questions) 1.0 Alcohol Consumption 3.1 Alcohol Problems 0.6 Marijuana Consumption 4.0 Hard Drug Consumption 2.1 Drug Problems 0.2
Income Total Monthly Earnings 0.4 Received Income from Various Sources 0.4–1.3 Total Income 7.4 Bank Accounts 0.0
Human Capital and Abilities Number of Past Training Programs 0.4 Job skills (20 questions) 0.4–9.9
Attitudes Attitude Toward Work (two questions) 0.2 Importance of Job Attributes (eight questions) 0.4 Future Plans (eight questions) 0.6–5.7
Source: MJS database.
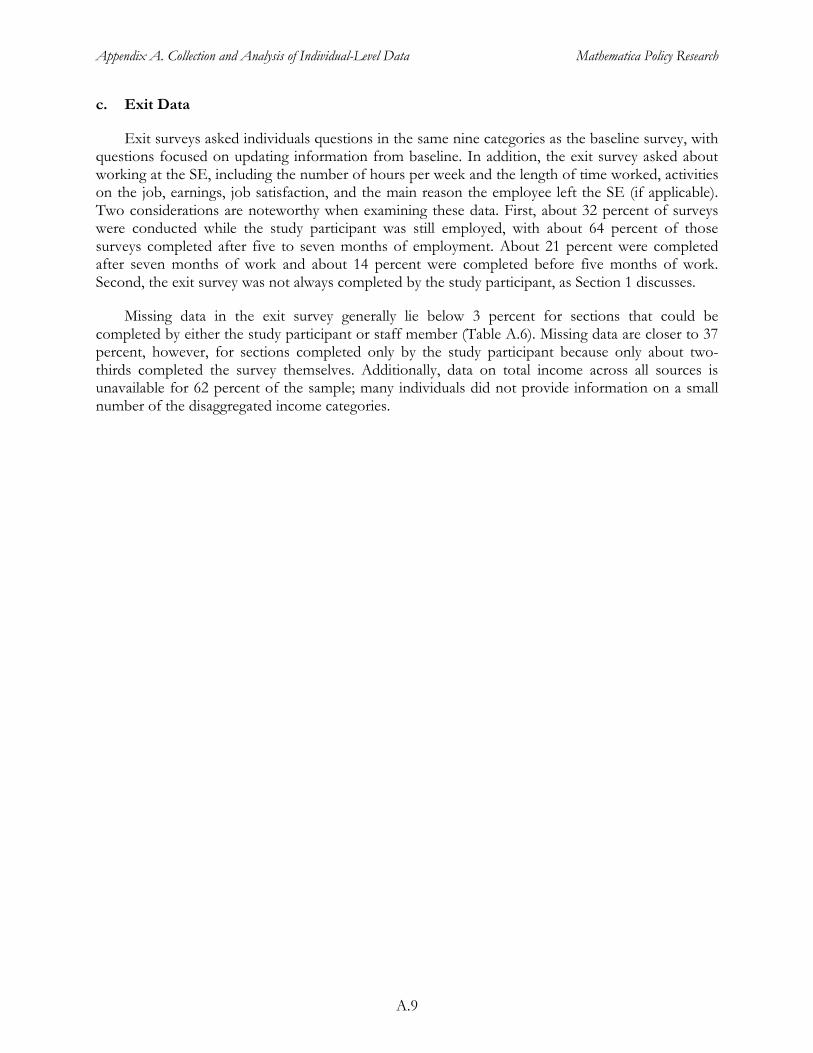
Appendix A. Collection and Analysis of Individual-Level Data Mathematica Policy Research
A.9
c. Exit Data
Exit surveys asked individuals questions in the same nine categories as the baseline survey, with questions focused on updating information from baseline. In addition, the exit survey asked about working at the SE, including the number of hours per week and the length of time worked, activities on the job, earnings, job satisfaction, and the main reason the employee left the SE (if applicable). Two considerations are noteworthy when examining these data. First, about 32 percent of surveys were conducted while the study participant was still employed, with about 64 percent of those surveys completed after five to seven months of employment. About 21 percent were completed after seven months of work and about 14 percent were completed before five months of work. Second, the exit survey was not always completed by the study participant, as Section 1 discusses.
Missing data in the exit survey generally lie below 3 percent for sections that could be completed by either the study participant or staff member (Table A.6). Missing data are closer to 37 percent, however, for sections completed only by the study participant because only about two-thirds completed the survey themselves. Additionally, data on total income across all sources is unavailable for 62 percent of the sample; many individuals did not provide information on a small number of the disaggregated income categories.
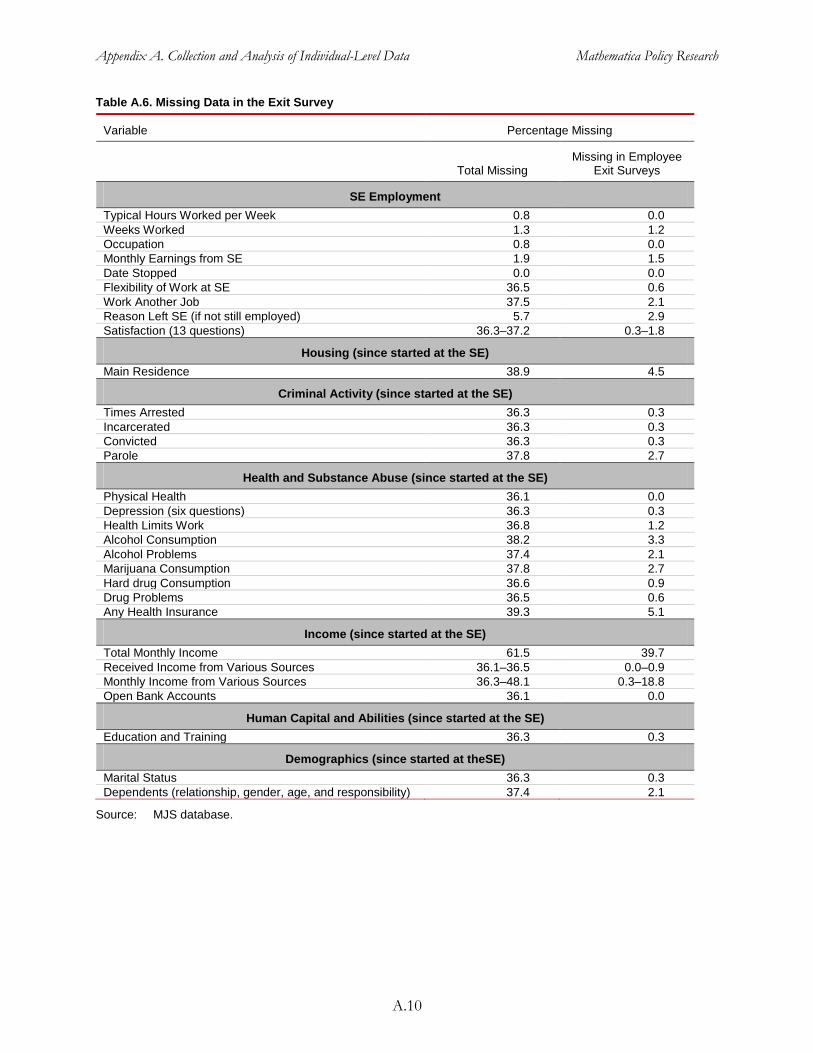
Appendix A. Collection and Analysis of Individual-Level Data Mathematica Policy Research
A.10
Table A.6. Missing Data in the Exit Survey
Variable Percentage Missing
Total Missing Missing in Employee
Exit Surveys
SE Employment Typical Hours Worked per Week 0.8 0.0 Weeks Worked 1.3 1.2 Occupation 0.8 0.0 Monthly Earnings from SE 1.9 1.5 Date Stopped 0.0 0.0 Flexibility of Work at SE 36.5 0.6 Work Another Job 37.5 2.1 Reason Left SE (if not still employed) 5.7 2.9 Satisfaction (13 questions) 36.3–37.2 0.3–1.8
Housing (since started at the SE) Main Residence 38.9 4.5
Criminal Activity (since started at the SE) Times Arrested 36.3 0.3 Incarcerated 36.3 0.3 Convicted 36.3 0.3 Parole 37.8 2.7
Health and Substance Abuse (since started at the SE) Physical Health 36.1 0.0 Depression (six questions) 36.3 0.3 Health Limits Work 36.8 1.2 Alcohol Consumption 38.2 3.3 Alcohol Problems 37.4 2.1 Marijuana Consumption 37.8 2.7 Hard drug Consumption 36.6 0.9 Drug Problems 36.5 0.6 Any Health Insurance 39.3 5.1
Income (since started at the SE) Total Monthly Income 61.5 39.7 Received Income from Various Sources 36.1–36.5 0.0–0.9 Monthly Income from Various Sources 36.3–48.1 0.3–18.8 Open Bank Accounts 36.1 0.0
Human Capital and Abilities (since started at the SE) Education and Training 36.3 0.3
Demographics (since started at theSE) Marital Status 36.3 0.3 Dependents (relationship, gender, age, and responsibility) 37.4 2.1
Source: MJS database.

Appendix A. Collection and Analysis of Individual-Level Data Mathematica Policy Research
A.11
d. MJS Database
The information from intake, baseline, and exit surveys was combined to form the MJS database. It includes the data elements listed in Tables A.4, A.5, and A.6 in a single record for each of the 1,423 individuals with intake information. It was created in four steps:
1. All individuals were assigned a unique Mathematica ID. For the 524 employees in the treatment group and 105 individuals in the comparison group, this identifier was the Mathematica ID they obtained when they completed the baseline survey.
2. Names were removed.
3. Data were merged using the Mathematica ID to form a single record for each client.
4. Missing codes were assigned to variables in the baseline and exit surveys for clients who were not MJS study participants.
B. Analysis
Differences across organizations in the proportion of study participants (Table A.2) created distortions in the representation of employees in the MJS sample. Of the clients hired into an SE—the target population for MJS inclusion—88 percent became part of the study. All SE employees at CRC, Taller San José, and Weingart Center became part of the treatment group, compared with only about 79 percent of those at Buckelew and CEO. As a result, unless data are weighted, SE employees at Taller San José, Weingart Center, and CRC are over-represented in our analytic sample and SE employees at Buckelew and CEO are under-represented.
Our intent was that the analyses characterize the average individual starting work at a REDF-supported SE from April 1, 2012, to March 31, 2013, which we defined as either starting employment during this period or being hired by an SE and completing the baseline survey during this period, but never beginning work. To have statistics reflect the average employee, we calculated and applied weights for two samples of workers: (1) SE employees who are MJS study participants and (2) MJS study participants who completed the exit survey. Weights were calculated at the SE level and become larger as the SE’s share of all employees increased but smaller as the SE’s share of the sample of interest increased, which gave increased weight to observations from SEs that employed many workers but did not have high rates of study participation. Across all observations, the weights have an average value of one to allow their sum to reflect the number of observations in the data.
Formally, in sample j, study participant i at SE s received a weight wij(s), defined as
(1) ijnumber of employees hired at all SEs in sample j number of employees hired as SE sw ( s )number of employees hired at SE s in sample j number of employees hired at all SEs
= ∗
Appendix A. Collection and Analysis of Individual-Level Data Mathematica Policy Research
A.12
The weighting scheme corrected for differences in sampling probabilities and response rates across SEs. After weighting, the distribution of workers across SEs is identical in the baseline and exit survey data and is the same as the distribution of all SE workers, regardless of MJS status.5
We now discuss the type of analysis to which weights are applied.
Unless a table explicitly notes that analysis is unweighted, weights are applied to all analyses presented in the text of the report.
1. Descriptive Analysis
The research summarized in this report addressed three specific research questions, two of which were addressed using individual-level data. We relied on descriptive statistics to answer the first question, What are the characteristics of SE employees?
Most frequently, we assessed differences in the means of variables measuring individuals’ characteristics to compare SE employees with other employment service applicants. Given that individual i receives weight wi, we estimated the mean of any variable x as
(2) i i i i ix x w / wΣ Σ=
To test for statistically significant (p < 0.05) differences in means between the two groups, we used t-statistics, such as
(3) 1 22 21 1 2 2
x xts /n s /n
−=+
,
where si denotes the weighted standard deviation for x within group i and ni is the number of individuals in group i. If the t-statistic was significant (p < 0.05), we concluded that differences existed between the two groups in the characteristic being assessed. We used the same analysis to compare characteristics across other groups of interest (for example, those who met the hours requirement and those who did not).
We also assessed differences in the distributions of a given characteristic across groups using chi-squared tests. This test looked at all categories of a variable to consider if the distributions were statistically different. For example, if we were interested in the differences between the other employment service applicants and SE employees in terms of racial composition, we used this test to assess if the entire distribution of races (share of white, share black, share multiple races, and so on) was equal. If the chi-square was significant (p < 0.05), we used a t-test to detect significant differences in individual categories (for example, share white).
5 The weighting does not affect data from individuals who requested employment services but wre not referred to
to SE employment.
Appendix A. Collection and Analysis of Individual-Level Data Mathematica Policy Research
A.13
2. Multivariate Regressions
We used multivariate analysis to assess the third research question posed in this study: What are the outputs and outcomes following SE employment? This analysis enabled us, for example, to identify whether SE employees who had worked in the week before their hire by an SE were more likely to leave the SE for positive (such as employment or training) or negative (such as termination) reasons. This analysis enabled us only to identify correlations, it did not identify causation (for example, we cannot say prior employment caused an individual to be more likely to leave the SE for positive reasons) because factors that cannot be observed in our data (such as motivation) could be correlated with both prior employment and successful SE employment.
To understand associations between characteristics and outcomes of interest among all individuals in the intake database, we estimated linear regressions using ordinary least squares. Regressions are of the form
(4) 1i i g iY a bX γ ε= + + +
where Yi is a specific outcome of interest, X1i is a vector of variables available in the intake database, and γg is a fixed-effect for the organization running the SE.6
When our analysis was restricted to individuals in the MJS who were hired by an SE, we estimated ordinary least squares regressions of the form
The subscript i indexes the individual and g indexes the organization. As with all regressions in this report, X includes both the variables of interest and a set of variables indicating if information on explanatory factors is missing. All missing values are set to the mean of observed values to include all observations in the regressions.
(5) 2i i s iY a bX γ ε= + + +
The control variables (X2) used in these analyses include demographic characteristics from the intake data and a parsimonious set of controls from the baseline survey, accounting for employment barriers at the time the employee was hired by the SE. Characteristics were carefully chosen to represent employees’ situations without overcomplicating the regression specifications.
Note that in both equations (4) and (5), we used linear regression even when our outcome variable was binary. This type of regression, known as a linear probability model, yields results interpretable as the change in the probability of an outcome occurring. Thus, when Yi is a binary variable, we can interpret our results using the following equations:
(6) ( ) 21 1 1i i sPr Y if a bX γ= = + + ≥
(7) ( ) 2 21 0 1i i s i sPr Y a bX if a bXγ γ= = + + < + + <
(8) ( ) 21 0 0i i sPr Y if a bX γ= = + + ≤ .
6 Because most organizations parent a single SE, we used organization, and not SE, fixed-effects.
Appendix A. Collection and Analysis of Individual-Level Data Mathematica Policy Research
A.14
The linear probability model is preferable over other methods of dealing with binary data because it enables all observations to be included in the estimation procedure. Other models, such as the probit, require dropping observations if all individuals with a given characteristic have Yi = 1 or Yi = 0. We used the linear probability model because we wished to use all available data in each of our regressions. Nonetheless, when we estimated probit regressions as a sensitivity analysis, our results were similar to those presented in this report.
In all specifications, if a coefficient was found to be significantly different from 0 (p < 0.05), we concluded that the characteristic was associated with the output or outcome.
In addition to reporting the results of our regressions, we also used the coefficients to estimate regression-adjusted mean values for outputs and outcomes. Suppose we were interested in comparing individuals with z = 1 with those with z = 0. To do this, we estimated
(9) i i i g iY a bX cz γ ε= + + + +
We know that c is then the difference in Y for individuals with z = 1 and z = 0, holding X and organizational characteristics constant. But we can also estimate the regression-adjusted mean values of Y for z = 1 and z = 0 as:
(10) 0z i gY a bX γ= = + + and 1z gY a bXi c γ= = + + + ,
where iX is the mean of the covariates in X and gγ is the average organization fixed-effect. Yz=1 is interpreted as the mean value for Y if everyone in the sample had z = 1. Likewise, Yz=0 is the mean that would result if all individuals had z = 0. The difference between these values is still c. But using the regression-adjusted means instead of only the regression coefficients enabled us to give a sense of both the difference between Y for z = 1 and z = 0 and the magnitude of Y.
3. Definitions of Analytic Variables
We used these three components of the MJS database to create a number of constructs for our analysis. Table A.7 provides the name of the variable, its source, and its definition. The source indicates where we drew the information from: intake, baseline survey (baseline), exit survey completed by staff or study participant (exit), or exit survey completed by study participant (exit-e).
Appendix A. Collection and Analysis of Individual-Level Data Mathematica Policy Research
A.15
Table A.7. Empirical Variables from the MJS Database
Variable Source Definition
Employment Worked for Pay in
the Past Intake and Baseline
A series of indicators for working in the past week, month, 6 months, or year. 1 = worked in period, 0 = did not. Cumulative variable (for example, if worked in the past week, worked in the past month, 6 months, and year).
Ever Worked Intake and Baseline
An indicator with 1 = worked in past year in intake or ever worked in the baseline survey, 0 = no work in the past year in intake and never having worked in the baseline survey.
Last Time Worked Continuously
Intake Set of mutually exclusive indicators for the last time worked continuously for at least 6 months and at least 20 hours per week. Categories include past year, one to two years, two to five years, five or more years, and never. 1 = last worked continuously in the interval, 0 = did not.
Employment Status Baseline A series of indicators for working last week, last year, or ever. 1 = worked in period, 0 = did not. Cumulative variable (for example, if worked in the past week, also worked in the past month, year, and ever).
Industry Baseline and Exit
A set of mutually exclusive indicators with 1 = job in this industry, 0 = not in industry. Categories for SE work include temporary support provision (Chrysalis); waste management and remediation (CEO, Weingart Center, and Blue Skies Cleaning); accommodation and food services (CHP and Buckelew); retail (CRC); and construction (Taller San José).
Occupation Baseline and Exit
A set of mutually exclusive indicators with 1 = job is in occupation, 0 = another occupation. Categories (standard occupational codes) for SE work include: transportation and material moving (533, 537); cleaning and maintenance (372, 373, 499); food and personal service (339, 353, 399, 396); construction worker (472, 473, 474); sales (412, 419); and other.
Jobs Last Week Baseline A count variable for the number of jobs an individual held in the past week. Jobs Last Year Baseline A count variable for the number of jobs an individual held in the past year. Reason Last Job
Ended Baseline A series of mutually exclusive indicators for last job ending due to being laid off, quitting, being
fired or no longer capable of performing job, and last job being temporary. 1 = this was reason last job ended, 0 = job ended for another reason.
Reason Not Working
Baseline A series of indicators for reason(s) not working. 1 = not working for this reason, 0 = reason not a factor. Reasons are health limitations or substance abuse, lack of qualifications, lack of transportation, cannot find a desirable job, discouraged, criminal background, and other (including family responsibilities).
Job Satisfaction at Current or Last Job or SE Job
Baseline and Exit-e
A set of indicators with 1 = very or somewhat satisfied with this characteristic of current or last job, 0 = somewhat or very dissatisfied. Indicators are combined into an index with answers normalized by subtracting the mean answer and dividing by the standard deviation; the standardized scores are combined into an index.
Characteristics: type of work, independence on the job, responsibility on the job, feedback received, job’s contribution to society, support received, job location, salary, number of hours worked, job security, intellectual challenge of job, opportunities for advancement, and benefits.
Social Enterprise Employment Experience Staff Complete Exit An indicator with 1 = a—staff not study participant—completed the exit survey; 0 = did not. Hired by SE and
Met Hours Requirement
Intake An indicator with 1 = worked 40 hours within 4 weeks; 0 = did not.
Hours Worked per Week
Exit A numeric variable for the average weekly hours worked at the SE.
Weeks Worked Exit A numeric variable for number of weeks worked at the SE. Also a series of mutually exclusive indicators, where 1 = worked this many weeks, 0 = worked a different number of weeks. Categories: less than one month, one to four months (exclusive), four to six month (exclusive), and six or more months.
Total Hours Worked
Exit The product of the two measures above. Also a series of mutually exclusive indicators for total hours worked, where 1 = worked this many hours, 0 = worked more or fewer hours. Categories include: (0,8), (8,20), (20,33), (33,81), (81,161), (161,321), (321,641), (641,961), and 961 or more
Monthly Earnings Exit Continuous variable for monthly earnings from work at SE. Reason Left Exit A set of mutually exclusive indicators for the main reason left the SE (set to missing if still
working at SE at time of exit survey). Categories: found outside employment or started other training, family or personal reasons, dissatisfied with job or firm or decided did not want a job, became incarcerated, terminated due to failure to meet program requirements, terminated due to conflict with others or poor performance, and terminated for other reasons.
Work Other Job Exit-e An indicator for working another job while employed at the SE. 1 = worked another job, 0 = did not work another job.
Work Flexibility Exit-e An indicator with 1 = found it not difficult at all or not too difficult to leave work at the SE for one or two hours to handle personal issues, 0 = somewhat or very difficult.
JobSsatisfaction Exit-e A set of indicators with 1 = very or somewhat satisfied with this characteristic of current or last job, 0 = somewhat or very dissatisfied. Indicators are combined into an index with answers normalized by subtracting the mean answer and dividing by the standard deviation; the

Appendix A. Collection and Analysis of Individual-Level Data Mathematica Policy Research
A.16
Variable Source Definition standardized scores are combined into an index.
Characteristics: type of work, independence on the job, responsibility on the job, feedback received, job’s contribution to society, support received, job location, salary, number of hours worked, job security, intellectual challenge of job, opportunities for advancement, and benefits.
Demographics Male Intake An indicator with 1 = male or transgendered female to male, 0 = respondent reports being
female or transgendered male to female. Hispanic Intake An indicator with 1 = Hispanic origin, 0 = not report Hispanic origin. Race Intake A series of mutually exclusive indicators with 1 = race reported, 0 = not. Categories include
black, white; Native American, Native Alaskan, Native Pacific Islander, Native Hawaiian, or Pacific Islander, or multiracial; some other race (for example Mexican, Middle Eastern); or race not given. Categories contain both Hispanic and non-Hispanic individuals.
Age Intake A continuous variable for age, calculated as (interview date - -birth date). Marital Status Intake and
Exit-e A series of mutually exclusive indicators with 1 = this marital status, 0 = other marital status.
Categories: married/in a domestic partnership, divorced/widowed, separated, and single. Military Veteran Status Intake An indicator with 1 = served in active duty, 0 = did not serve in active duty. Era Served in
Military Intake A series of indicators for service era: Gulf War period or later (after 8/1990), 5/1975 to 7/1990,
Vietnam era or before (before 5/1975), or missing/cannot be categorized. 1 = served during that period, 0 = did not serve during that period.
Dependents Number of
Dependents Intake, Baseline and Exit-e
A count variable for number of individuals the employee supports financially or has responsibility for day-to-day activities.
Number of Financial Dependents
Baseline and Exit-e
A count variable for number of individuals the employee supports financially.
Number of Physical Dependents
Baseline and Exit-e
A count variable for number of individuals for whom the employee has responsibility for day-to-day activities.
Barriers to Employment Housing Temporary Housing Intake A series of indicators for using temporary housing in the past week, month, 6 months, or year.
1 = did not have a fixed, regular, and adequate nighttime residence; 0 = had stable housing. Cumulative variable (for example, used temporary housing in the past week means having used it in the past month, 6 months, and year.)
Housing Used in Past Year(week)
Baseline and Exit-e
Baseline: A set of indicators for the different housing arrangements used (1 = used, 0 = not). Own home: An indicator with 1 = owned or rented room, apartment, or home is only housing
used; 0 = other housing used. Literally homeless: An indicator with 1 = emergency shelter or voucher, transitional housing,
permanent housing for previously homeless people or outside or in public (and did not have fixed, regular nighttime residence); 0 = other.
All variables created using weekly and annual horizons. Exit: A set of mutually exclusive indicators for the main source of housing in the past week (1 =
used, 0 = not). Categories are: emergency shelter or voucher; transitional housing, permanent housing for previously homeless people; psychiatric hospital, substance abuse treatment facility, or other related facility; jail, prison, juvenile detention, halfway home for those with criminal history, or similar facility; owned or rented room, apartment, or home; hotel or motel (not from voucher, used as housing because did not have fixed, regular nighttime residence); home of family member or friend (because did not have fixed, regular nighttime residence); outside or in public (and did not have fixed, regular nighttime residence; or other (including nonpsychiatric hospitals and group homes).
Criminal Activity Arrested Intake,
Baseline, and Exit-e
Intake, baseline: An indicator with 1 = ever arrested, 0 = never arrested Exit: was arrested since starting SE employment.
Number of Arrests Baseline and Exit-e
A count variable for total number of times an individual has been arrested (or arrested since starting SE employment in exit survey).
Convicted and Sentenced to Jail or Prison
Intake, Baseline, and Exit-e
An indicator with 1 = ever convicted and sentenced to time in jail or prison, 0 = never convicted or sentenced to time in jail or prison (or convicted since starting SE employment in exit survey).
Time Since Last Conviction
Intake A mutually exclusive series of indicators for time since last conviction. 1 = last convicted in period, 0 = not. Categories are last 6 months, 6 months to one year, 1 to 2 years, 2 to 5 years, 5 or more years, never, and missing/unknown.
Months Since Last Baseline If ever convicted, the number of months since last conviction.
Appendix A. Collection and Analysis of Individual-Level Data Mathematica Policy Research
A.17
Variable Source Definition Conviction A series of indicators with 1 = last convicted in this time period, 0 = last convicted at a different
time. Categories: last year, 1 to 2 years, 2 to 5 years, and 5 or more years. Total Time
Sentenced Baseline If sentenced to any time, the number of months sentenced to serve in jail or prison.
A series of indicators with 1 = sentenced this amount of time, 0 = not. Categories: less than one year, one to two years, and more than two years.
Parole Baseline and Exit-e
Baseline: If ever convicted, an indicator with 1 = currently on probation or parole, 0 = not currently on probation or parole.
Exit: If convicted since began work at SE, an indicator with 1 = currently on probation or parole, 0 = not currently on probation or parole.
Time Remaining on Parole
Baseline and Exit-e
A continuous variable for the number of months remaining probation or parole. A series of indicators where 1 = category of time remaining, 0 = not. Categories: less than one
year, one to two years, and more than two years. Health and Substance Abuse Health Condition Baseline &
Exit-e An indicator with 1= any health condition limiting work, 0 = not. If any health condition, indicator for mental health condition with 1 = mental health condition, 0
= other health condition. If any health condition, indicator for physical health condition with 1 = physical health condition,
0 = other health condition. Self-Reported
Health Status Baseline and Exit-e
A series of mutually exclusive indicators of self-reported health with 1 = report this level of health, 0 = report another level. Categories: excellent, very good, good, fair, and poor.
Mental Health Battery
Baseline and Exit-e
A series of indicators for the following feelings in the past seven days: feeling no interest in things, feeling lonely, feeling blue, feeling worthless, feeling hopeless about the future, and thoughts of ending your life. Options on a 1 to 5 scale were never, a little bit, moderately, quite a bit, and extremely often.
Three set of variables: (1) Persistently bothered by: 1 = bothered quite a bit or extremely often by feelings, 0 =
bothered less than this by feelings. (2) Bothered at all by: 1 = bothered a little bit or more by feelings, 0 = not bothered by feelings. (3) Indicators are combined into an index by subtracting the mean and dividing by the standard
deviation (to standardize answers) and summing the standardized score. Alcohol Use Baseline
and Exit-e Baseline time period: past 12 months. Exit time period: since starting SE employment. An indicator with 1 = drank four or more drinks in one day in time period, 0 = did not. A count variable for number of times drank four or more drinks in one day, if any. An indicator with 1 = drinking or being hung over interfered with life in time period, 0 = did not.
Marijuana Use Baseline and Exit-e
Baseline time period: past 12 months. Exit time period: since starting SE employment. An indicator with 1 = smoked marijuana or hashish in time period, 0 = did not do so. A count variable for number of times smoked marijuana or hashish in time period, if any.
Hard Drug Use Baseline and Exit-e
Baseline time period: past 12 months. Exit time period: since starting SE employment. An indicator with 1 = used hard drugs in time period, 0 = did not. A count variable for number of times used hard drugs in time period, if any.
Drug/Alcohol Counseling
Baseline and Exit-e
Baseline time period: past 12 months. Exit time period: since starting SE employment. An indicator with 1 = was in counseling or therapy for alcohol or drug problems, 0 = was not or
reports no drug use and not drinking four or more drinks in the same day. Alcohol Problems Baseline
and Exit-e An indicator with 1 = individual reports that drinking or being hung over has interfered with
individual’s life in the past year (or since beginning work at SE), 0 = individual does not report this issue.
Substance Abuse Baseline and Exit-e
An indicator with 1 = individual reports entering counseling or related treatment for alcohol or drug use in the past year (or since beginning work at SE) or reports alcohol problems as defined above, 0 = does not report these issues.
Insurance Baseline and Exit-e
An indicator with 1 = had health insurance, 0 = did not have. An indicator with 1 = had public health insurance, 0 = had only private insurance. An indicator with 1 = had private health insurance, 0 = had only public insurance.
Dependents’ Insurance Coverage
Baseline and Exit-e
Three distinct continuous variables for share of dependent children (under age 18) with health insurance, with private health insurance (if any), and with public health insurance (if any).
English Language Ability Native English
Speaker Intake An indicator for an individual being a native English speaker. 1 = native speaker, 0 = non-
native speaker. English Fluency Intake A set of mutually exclusive indicators for the English fluency of non-native speakers: good, fair,
or poor spoken skills. 1 = individual has that skill level, 0 = not that level. General Support Needed Counselor-
Assessed Level of Support
Intake A mutually exclusive set of indicators for a counselor’s assessment of support likely needed to succeed in the labor force. 1 = needs a lot of support and 5 = needs no support. A lot of support is 1 or 2, needs some support is 3 or 4, and needs no support is 5.
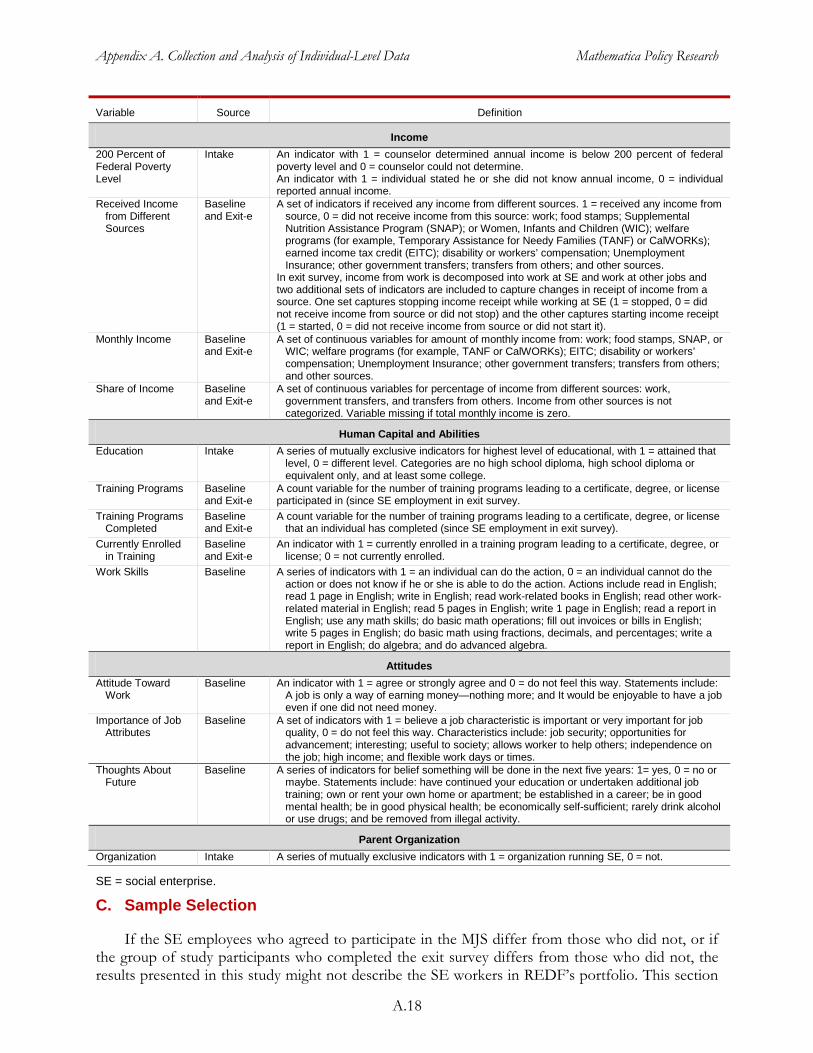
Appendix A. Collection and Analysis of Individual-Level Data Mathematica Policy Research
A.18
Variable Source Definition
Income 200 Percent of Federal Poverty Level
Intake An indicator with 1 = counselor determined annual income is below 200 percent of federal poverty level and 0 = counselor could not determine. An indicator with 1 = individual stated he or she did not know annual income, 0 = individual reported annual income.
Received Income from Different Sources
Baseline and Exit-e
A set of indicators if received any income from different sources. 1 = received any income from source, 0 = did not receive income from this source: work; food stamps; Supplemental Nutrition Assistance Program (SNAP); or Women, Infants and Children (WIC); welfare programs (for example, Temporary Assistance for Needy Families (TANF) or CalWORKs); earned income tax credit (EITC); disability or workers’ compensation; Unemployment Insurance; other government transfers; transfers from others; and other sources.
In exit survey, income from work is decomposed into work at SE and work at other jobs and two additional sets of indicators are included to capture changes in receipt of income from a source. One set captures stopping income receipt while working at SE (1 = stopped, 0 = did not receive income from source or did not stop) and the other captures starting income receipt (1 = started, 0 = did not receive income from source or did not start it).
Monthly Income Baseline and Exit-e
A set of continuous variables for amount of monthly income from: work; food stamps, SNAP, or WIC; welfare programs (for example, TANF or CalWORKs); EITC; disability or workers’ compensation; Unemployment Insurance; other government transfers; transfers from others; and other sources.
Share of Income Baseline and Exit-e
A set of continuous variables for percentage of income from different sources: work, government transfers, and transfers from others. Income from other sources is not categorized. Variable missing if total monthly income is zero.
Human Capital and Abilities Education Intake A series of mutually exclusive indicators for highest level of educational, with 1 = attained that
level, 0 = different level. Categories are no high school diploma, high school diploma or equivalent only, and at least some college.
Training Programs Baseline and Exit-e
A count variable for the number of training programs leading to a certificate, degree, or license participated in (since SE employment in exit survey.
Training Programs Completed
Baseline and Exit-e
A count variable for the number of training programs leading to a certificate, degree, or license that an individual has completed (since SE employment in exit survey).
Currently Enrolled in Training
Baseline and Exit-e
An indicator with 1 = currently enrolled in a training program leading to a certificate, degree, or license; 0 = not currently enrolled.
Work Skills Baseline A series of indicators with 1 = an individual can do the action, 0 = an individual cannot do the action or does not know if he or she is able to do the action. Actions include read in English; read 1 page in English; write in English; read work-related books in English; read other work-related material in English; read 5 pages in English; write 1 page in English; read a report in English; use any math skills; do basic math operations; fill out invoices or bills in English; write 5 pages in English; do basic math using fractions, decimals, and percentages; write a report in English; do algebra; and do advanced algebra.
Attitudes Attitude Toward
Work Baseline An indicator with 1 = agree or strongly agree and 0 = do not feel this way. Statements include:
A job is only a way of earning money—nothing more; and It would be enjoyable to have a job even if one did not need money.
Importance of Job Attributes
Baseline A set of indicators with 1 = believe a job characteristic is important or very important for job quality, 0 = do not feel this way. Characteristics include: job security; opportunities for advancement; interesting; useful to society; allows worker to help others; independence on the job; high income; and flexible work days or times.
Thoughts About Future
Baseline A series of indicators for belief something will be done in the next five years: 1= yes, 0 = no or maybe. Statements include: have continued your education or undertaken additional job training; own or rent your own home or apartment; be established in a career; be in good mental health; be in good physical health; be economically self-sufficient; rarely drink alcohol or use drugs; and be removed from illegal activity.
Parent Organization Organization Intake A series of mutually exclusive indicators with 1 = organization running SE, 0 = not.
SE = social enterprise.
C. Sample Selection
If the SE employees who agreed to participate in the MJS differ from those who did not, or if the group of study participants who completed the exit survey differs from those who did not, the results presented in this study might not describe the SE workers in REDF’s portfolio. This section
Appendix A. Collection and Analysis of Individual-Level Data Mathematica Policy Research
A.19
focuses on potential differences in the characteristics of the samples used in our analysis. It describes those who were (1) hired by an SE, (2) SE employees who are MJS study participants, and (3) MJS study participants who completed the exit survey.
Table A.8 compares these samples using unweighted means and test statistics (weights are not used because groups overlap). A few differences emerge, although no clear pattern can be seen in those differences. Compared with those hired into the SE, individuals who were in the MJS and individuals who completed an exit survey were significantly more likely to have been employed in the past year and to have worked continuously during that time. Despite these differences, counselors’ assessments suggest that the MJS sample of hired individuals needed more support than all workers hired into the SE. Individuals in the sample of workers who provided exit information tended to have been arrested and convicted of a crime significantly less often than others. There are no significant differences in counselor-assessed barriers between individuals hired into the SE and those providing information at exit. Although some demographic characteristics differed significantly across groups, such differences were small.
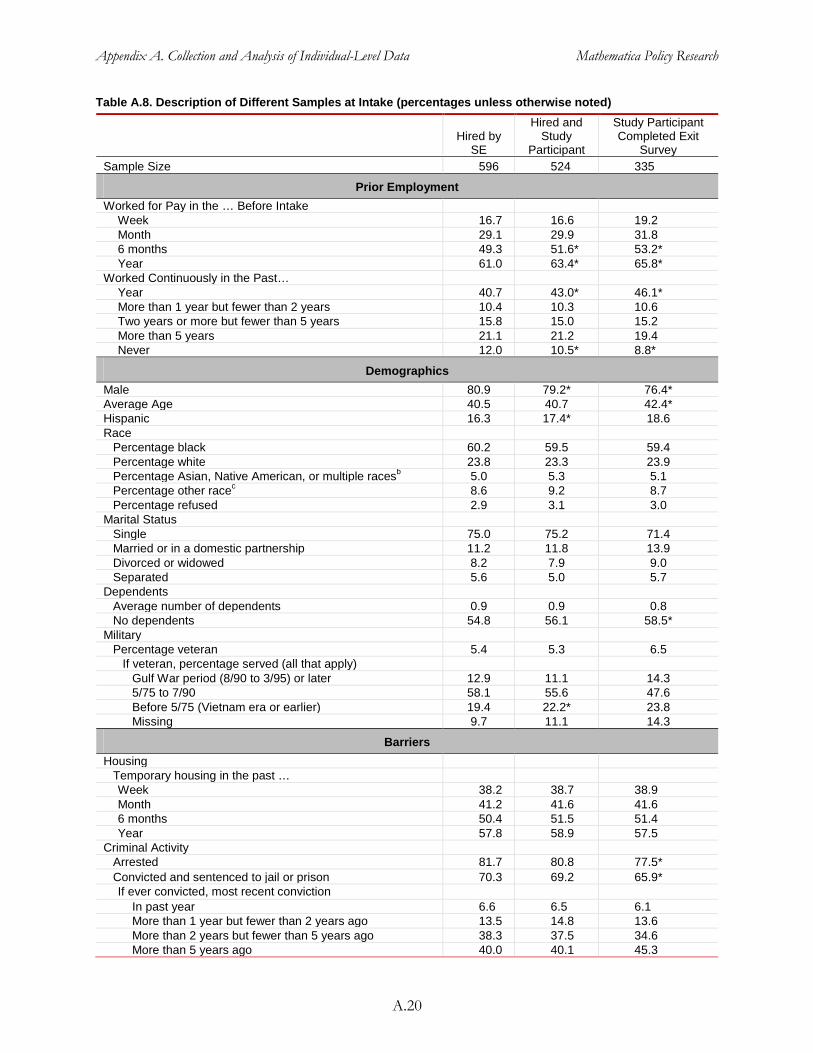
Appendix A. Collection and Analysis of Individual-Level Data Mathematica Policy Research
A.20
Table A.8. Description of Different Samples at Intake (percentages unless otherwise noted)
Hired by
SE
Hired and Study
Participant
Study Participant Completed Exit
Survey Sample Size 596 524 335
Prior Employment Worked for Pay in the … Before Intake
Week 16.7 16.6 19.2 Month 29.1 29.9 31.8 6 months 49.3 51.6* 53.2* Year 61.0 63.4* 65.8*
Worked Continuously in the Past… Year 40.7 43.0* 46.1* More than 1 year but fewer than 2 years 10.4 10.3 10.6 Two years or more but fewer than 5 years 15.8 15.0 15.2 More than 5 years 21.1 21.2 19.4 Never 12.0 10.5* 8.8*
Demographics Male 80.9 79.2* 76.4* Average Age 40.5 40.7 42.4* Hispanic 16.3 17.4* 18.6 Race
Percentage black 60.2 59.5 59.4 Percentage white 23.8 23.3 23.9 Percentage Asian, Native American, or multiple racesb 5.0 5.3 5.1 Percentage other racec 8.6 9.2 8.7 Percentage refused 2.9 3.1 3.0
Marital Status Single 75.0 75.2 71.4 Married or in a domestic partnership 11.2 11.8 13.9 Divorced or widowed 8.2 7.9 9.0 Separated 5.6 5.0 5.7
Dependents Average number of dependents 0.9 0.9 0.8 No dependents 54.8 56.1 58.5*
Military Percentage veteran 5.4 5.3 6.5
If veteran, percentage served (all that apply) Gulf War period (8/90 to 3/95) or later 12.9 11.1 14.3 5/75 to 7/90 58.1 55.6 47.6 Before 5/75 (Vietnam era or earlier) 19.4 22.2* 23.8 Missing 9.7 11.1 14.3
Barriers Housing
Temporary housing in the past … Week 38.2 38.7 38.9 Month 41.2 41.6 41.6 6 months 50.4 51.5 51.4 Year 57.8 58.9 57.5
Criminal Activity Arrested 81.7 80.8 77.5* Convicted and sentenced to jail or prison 70.3 69.2 65.9* If ever convicted, most recent conviction
In past year 6.6 6.5 6.1 More than 1 year but fewer than 2 years ago 13.5 14.8 13.6 More than 2 years but fewer than 5 years ago 38.3 37.5 34.6 More than 5 years ago 40.0 40.1 45.3

Appendix A. Collection and Analysis of Individual-Level Data Mathematica Policy Research
A.21
Hired by
SE
Hired and Study
Participant
Study Participant Completed Exit
Survey English Language Ability
Percentage native English speaker 96.6 96.3 95.5 Percentage good English (if not native) 47.1 47.1 38.5 Percentage fair English (if not native) 41.2 41.2 46.2 Percentage poor English (if not native) 11.8 11.8 15.4
General Support Needs a lot of support 59.3 61.8* 63.4 Needs some support 30.1 28.0* 27.3 Needs no support 10.7 10.2 9.3
Income Income Below 200 Percent of Federal Poverty Level 98.0 98.1 98.5 Don’t Know Income 1.7 1.7 1.2
Education No High School Diploma 27.5 28.2 22.5* High School Diploma/Graduate/GED 44.6 43.4 45.9 At Least Some College 28.0 28.4 31.5*
Parent Organization Buckelew 8.7 7.8 4.5 CEO 20.0 17.9 12.8 CHP 7.7 8.0 5.1 Chrysalis 55.7 57.3 65.4 CRC 5.2 5.9 8.4 CRCD 0.0 0.0 0.0 Taller San José 2.2 2.5 3.0 Weingart Center 8.7 7.8 0.9
Source: MJS database. Note: See Table A.7 for definitions of variables. Item-specific nonresponse reduced the number of individuals
in some cells. An asterisk (*) indicates a significant difference from those hired into the SE (p < 0.05) as measured by a two-tailed t-test. A chi-square test is computed for sets of mutually exclusive categorical variables (for example, race), with a two-tailed t-test to test for significant differences between each category in the distribution if the chi-square test showed significant differences in the distribution.
To better understand factors associated with being in the analytic samples, we estimated a series of linear probability models. These regressions enabled us to assess characteristics associated with inclusion in the analytic sample when other variables were accounted for and predict sample inclusion.
The regressions used to address these questions are of the form
(11) i i g iZ a bX γ ε= + + +
Zi is an indicator for individual i employed in an SE run by organization g being included in a given sample and the γ variables are organization fixed effects. X includes a reduced set of the variables available for all individuals seeking employment assistance at the organizations of interest. These variables were selected from the full set listed in Table A.8 to control for background factors while maintaining the regressions’ tractability. As with all regressions in this report, X includes a set of variables indicating if information on explanatory factors is missing. All missing values are set to the mean of observed values to include all observations in the regressions.
Appendix A. Collection and Analysis of Individual-Level Data Mathematica Policy Research
A.22
Table A.9 presents the results of these regressions. Again, although these results suggest the analytic samples differ to some extent from all individuals hired into the SE, differences do not appear to be systematic. The first column of this table shows the factors associated with whether an individual hired into a SE was in the MJS. We see the following:
• Employees in temporary housing at some point in the past year, though not in the week before they began employment, were more likely to be in the MJS than those who had permanent housing for the past year.
• Individuals judged to need some support to succeed in the labor market were less likely to be in the MJS than those judged to need a lot of support.
• Individuals with no dependents were more likely to be in the MJS than those with dependents.
• Employees at CRC and Taller San José were more likely to be in the MJS than those in Chrysalis.
The second and third columns of Table A.9 compare the sample of SE employees providing information at exit with (1) those hired by the SE and (2) employees in the MJS. Our results suggest that the sample of individuals providing data at SE exit did not differ greatly from clients hired by the SE or SE employees in the MJS.
• Only one of the variables describing employment barriers (the indicator for fair or poor English fluency) was associated with if an individual provided exit survey information.
• Employees without a high school diploma were less likely to provide information at exit than other SE employees.
• Controlling for other factors, SE employees at Buckelew, CEO, and CHP were less likely to provide exit data than those at Chrysalis. Employees at Weingart Center and CRC (in the regression using all hired individuals only) were more likely to provide this information. Our weighting scheme addressed these differences by giving each organization the weight it would receive in the population of workers.

Appendix A. Collection and Analysis of Individual-Level Data Mathematica Policy Research
A.23
Table A.9. Regressions Predicting Sample Inclusion: Linear Probability Models
Outcome Study Participant
Study Participant and Completed Exit
Survey
Study Participant and Completed
Exit Survey
Sample Hired by SE Hired by SE Study
Participants Sample size 596 596 524
Employment Not Employed Last Week 0.053 -0.043 -0.085 (0.038) (0.059) (0.060) Not Employed Last Year -0.072 -0.006 0.022 (0.037) (0.053) (0.054) Work History (worked continuously in the past year)
Worked continuously for six months one to five years ago
-0.048 -0.020 0.025 (0.040) (0.055) (0.055)
Worked continuously for six months more than five years ago
0.014 -0.028 -0.019 (0.043) (0.070) (0.073)
Never worked continuously -0.104 -0.065 0.025 (0.059) (0.080) (0.086)
Barriers Used Temporary Housing in Past Week 0.022 -0.040 -0.055
(0.031) (0.046) (0.048) Used Temporary Housing in Past Year (but Not Past Week)
0.077* 0.007 -0.034 (0.036) (0.053) (0.056)
Ever arrested -0.048 -0.041 -0.020 (0.045) (0.066) (0.069) Ever convicted and sentenced to jail or prison 0.018 -0.055 -0.056
(0.039) (0.062) (0.066) English Language Fluency (non-native English speaker)
Non-native English speaker—good 0.020 -0.059 -0.086 (0.046) (0.196) (0.202)
Non-native English speaker—fair or poor 0.015 0.218* 0.200* (0.045) (0.077) (0.072)
Counselor Assessed Needs (needs a lot of support) Counselor suggests client needs some support -0.092* -0.001 0.079
(0.041) (0.052) (0.053) Counselor suggests client needs little or no support -0.072 -0.018 0.050
(0.062) (0.080) (0.085)
Demographics Male -0.051 -0.108* -0.077 (0.029) (0.052) (0.052) Age -0.000 0.003 0.004* (0.001) (0.002) (0.002) No Dependents 0.058* 0.070 0.056 (0.029) (0.043) (0.046) Veteran 0.028 0.075 0.031 (0.071) (0.093) (0.104) Hispanic 0.008 0.014 0.013 (0.042) (0.067) (0.069) Race (Black)
White -0.034 -0.033 -0.023 (0.044) (0.059) (0.061) Other race 0.059 0.022 -0.008
(0.042) (0.074) (0.074)

Appendix A. Collection and Analysis of Individual-Level Data Mathematica Policy Research
A.24
Outcome Study Participant
Study Participant and Completed Exit
Survey
Study Participant and Completed
Exit Survey Marital Status (single)
Married or In a domestic partnership 0.033 0.138* 0.126 (0.040) (0.063) (0.065)
Divorced, widowed, or separated -0.066 0.024 0.089 (0.045) (0.060) (0.059)
Education No High School Diploma 0.045 -0.134* -0.171* (0.034) (0.049) (0.054) Some College or More 0.001 -0.042 -0.035 (0.034) (0.051) (0.051)
Parent Organization (Chrysalis) Buckelew 0.007 -0.305* -0.368* (0.068) (0.093) (0.102) CEO -0.045 -0.172* -0.183* (0.058) (0.076) (0.081) CHP 0.077 -0.300* -0.378* (0.056) (0.091) (0.094) CRC 0.178* 0.217* 0.091 (0.049) (0.082) (0.082) Taller San José 0.152* 0.190 0.085 (0.072) (0.145) (0.148) Weingart Center 0.124 0.304* 0.228* (0.098) (0.100) (0.112) R-squared 0.156 0.214 0.215
Source: MJS database.
Note: See Table A.7 for definitions of variables. Data are not weighted. The regressions also control for missing value indicators. An asterisk (*) indicates the coefficient is significantly different from zero at the p < 0.05 level.
D. Key Limitations
Although the methods we used to collect data met the highest possible standards for rigor, they faced three limitations.
1. They are based only on a relatively small set of SEs, all of which were funded as part of REDF’s SIF portfolio. Other SEs or other transitional work programs would have different funding structures, locations, and resources. As a result, our results cannot be used to describe employees or SE outcomes outside of this study.
2. Causal inferences cannot be made. Even though the analyses of SE outputs and outcomes and employee characteristics provide interesting insights into the experiences at SEs, all analyses are descriptive and results cannot be interpreted to make causal inferences about the impact of SE employment on post-program outcomes.
3. The accuracy and reliability of the information obtained cannot be verified. Two issues might be of concern. First, staff who completed the exit survey could have information on SE employment (from administrative data or their own experiences with an employee), which might differ from the information from the employee’s own information, based on recall. Such discrepancies might be particularly great on the reason an employee left the SE, because proxies might not be aware of an employee’s true motivations. Second, responses to all questions are subject to individuals correctly
Appendix A. Collection and Analysis of Individual-Level Data Mathematica Policy Research
A.25
recalling and truthfully reporting answers to survey questions. Truthful and accurate reporting can be particularly problematic for sensitive topics, such as those in our surveys (for example, arrest record, housing, income, and mental health). Additionally, SE staff could have an incentive to misreport information at exit if they believe REDF might react to this information by altering the support it provides the SE. The survey questions were designed to minimize these types of bias, but without reliability tests it is difficult to rule out the possibility that individuals did not truthfully and correctly answer all questions.

This page has been left blank for double-sided copying.
APPENDIX B
INFORMATION AND ANALYSIS FOR ORGANIZATIONS

This page has been left blank for double-sided copying.
Appendix B. Collection and Analysis of Organization-level Information Mathematica Policy Research
B.3
Mathematica Policy Research collected information about both social enterprises (SEs) and the organizations that run them from several sources to address the second research question in the Mathematica Jobs Study (MJS): What activities do SEs undertake and what challenges do they face? The majority of information was qualitative, although two quantitative instruments were developed and fielded to provide information on (1) employment and life stability supports provided to SE workers and (2) the use of data in decision making. This appendix describes the processes used to collect and analyze information about SEs and organizations and the limitations of the methods and information. Section A provides details on information collected, Section B provides details of the coding and analyzing of qualitative information, and Section C discusses key limitations of the information and methods.
A. Information Collected
Mathematica collected information on all eight organizations in the REDF Social Innovation Fund (SIF) portfolio: Buckelew, Center for Employment Opportunities (CEO), Community Housing Partnership (CHP), Chrysalis, Community Resource Center (CRC), Coalition for Responsible Community Development (CRCD), Taller San José, and Weingart Center. Information collection methods were designed to provide insights into processes and structures that REDF funded. Mathematica timed the collection of this information to occur after REDF required organizations to have employee supports in place (on March 1, 2013) to attempt to secure information about SE operations, rather than only plans for such operations.
Mathematica collected information on organizations from two sources:
1. Documents and telephone interviews with REDF staff provided background information about organizations and SEs.
2. Site visits provided in-depth information about how organizations and SEs operated.
1. Documents and Telephone Interviews with REDF Staff
Mathematica reviewed documents and conducted telephone interviews with REDF staff before visiting each site. The documents and interviewers were reviewed and conducted mainly in February and March 20137
Mathematica researchers conducted telephone interviews with 10 REDF staff, using the following structure: overview of the interview’s purpose, oral informed consent, and a facilitated discussion. We conducted two types of interviews (Appendix D.3.E contains protocols):
and were used to inform preparation and focus discussions at site visits. Both REDF and the organizations identified a set of materials that provided details on the parent organization and SE’s structures, plans, activities, and contexts. REDF provided documents pertaining to its work with the organizations and its support of the SE; each organization provided internal documents (for example, client intake and assessment forms, job descriptions, staffing information, employee handbooks, organization charts, and training curricula). Information in these documents was later augmented with pictures of the physical locations taken during site visits to document the daily experiences of the clients.
7 The exception was the maintenance service business line at CHP, which closed in December 2012.

Appendix B. Collection and Analysis of Organization-level Information Mathematica Policy Research
B.4
1. Organizations. Interviews with six REDF staff (portfolio directors, Farber Fellows,8
• Organizational background and development of partnerships
consultants, and portfolio associates) focused on the organization and its REDF-supported SE in the following topic areas (staff were interviewed about than one organization):
• SEs’ target groups and barriers to employment
• REDF-provided training and technical assistance
• Implementation of the SE and support programs, including challenges and successes
• Lessons learned and future plans or views of the SE
• Other topics related to distinctive features or the environment of an SE that might be useful to investigate on site
2. Strategies. Interviews with four members of REDF’s leadership team focused on the following topics:
• Strategies to build a portfolio of SEs
• Technical assistance to sites
• Overall challenges that SEs face
• Plans for the future of the SIF portfolio and work with SEs more broadly
Table B.1 shows the number of staff involved in these interviews.
Table B.1. REDF Staff Interviewed
Number of Staff Involved Organizations 6
Buckelew 2 Center for Employment Opportunities (CEO) 1 Community Housing Partnership (CHP), lobby services 2 CHP, maintenance services 2 Chrysalis 3 Community Resource Center (CRC) 3 Coalition for Responsible Community Development (CRCD) 3 Taller San José 3 Weingart Center 2
Strategies 4
Total unique staff 10
8 A Farber Fellow is an individual working at REDF for a year as a liaison to co-lead to an SE.

Appendix B. Collection and Analysis of Organization-level Information Mathematica Policy Research
B.5
2. Site Visits
Mathematica staff conducted site visits to each organization during April 2013 and visited the CHP’s maintenance services business line in December 2012, just before it closed. Before the visits, site visitors participated in an internal training session. The training focused on the correct use of all study protocols, consent procedures and forms, telephone and email scripts, document and site visit data tracking and management, incentives, interview and focus group note-taking, daily post-site visit debriefing, on-site behavior and professionalism, on-site observations and document collection, following up with organizations, site visit reports, coding processes, analysis, and the purpose of and processes for developing the implementation report.
The site visits included one-on-one and small-group interviews with administrative and program staff and separate focus groups with SE employees. Researchers used semistructured protocols to guide the discussions (Appendix D.3 provides copies). Table B.2 shows the number of individuals involved in site visits in each organization: executive directors from seven organizations, SE directors from all organizations, 21 organization staff, and 31 SE staff. The site visits also included 13 focus groups with 68 different current or former SE employees.
Table B.2. Number of Individuals Involved in Site Visits
Directors Staff Focus Groups
Executive SE Organization SE
Number of
Groups
Total Number of
Participants Buckelew 0 1 2 4 2 10 CEO 0 1 4 5 1 5 CHP, Lobby Services 1 1 1 2 2 12 CHP, Maintenance Services 1 1 0 4 1 3 Chrysalis 2 1 1 6 2 16 CRC 1 1 5 2 1 7 CRCD 0 1 5 3 1 3 Taller San José 1 1 3 3 1 6 Weingart Center 1 1 0 2 2 6
Total 7 9 21 31 13 68
Note: We did not interview the executive director of (1) CEO because the person is not involved with the day-to-day operations of CEO in California, (2) CRCD because the person also serves as the director of the SE and was counted there, or (3) Buckelew because the position had recently turned over.
Three different types of interviews were conducted. One set were with staff at the director level: the executive director of the organization and the director of the SE. Specific topics asked in those interviews included the following:
• Organization and SE background
• Role of partner organizations
• Technical assistance received in starting or implementing the SE
Appendix B. Collection and Analysis of Organization-level Information Mathematica Policy Research
B.6
Another set of interviews were with staff, including front-line managers in the SE. Topics asked of these groups included the following:
• Challenges in setting up and running the SE
• Services and supports offered to the SE
• Description of clients/employees, including their barriers to and attitudes toward work
• The employment experience, including type of work
• Participant tracking and data
• Post-SE employment
• Intake and assessment of new employees
Finally, focus groups of employees were asked about several SE topics: their entry, experiences working in, supports and services offered while working, challenges, and favorite elements. They were also asked about how to strengthen the SE experience and their future work and life plans.
Mathematica developed an analytical template to guide the preparation of in-depth site visit reports. Reports were based on site visit notes and additional information gained through document collection and/or telephone interviews conducted prior to the site visits. The overarching purpose of the template was to help site visitors to (1) produce a comprehensive and detailed portrait of each SE and (2) facilitate comparison of information across sites and study themes. Site visitors completed the report shortly after returning from the visit. Each report went through reviews at two different levels—the implementation study task lead or project director and a Mathematica senior researcher—to ensure that information had adequate detail and did not contain information that could identify a specific individual. After a site visit report was prepared, carefully reviewed, and any follow-up data collection had been conducted and incorporated, we asked each organization to review it for factual information and to correct or offer different interpretations on information included. Organizations were not allowed to change any information or perspectives offered.
Site visitors also administered two structured instruments. The first collected information about the role data played in making decisions regarding the SE in four different areas (Appendix D.2B contains a copy): (1) data the SE collected and with what frequency; (2) the ways in which individuals within the organization used data in decision making; (3) the capabilities of the organization to use data and the thoughts and attitudes held by the respondent and the organization with respect to using data to make decisions; and (4) the individuals in the organization who used the data and who led efforts to use it in decision making. Organization staff completed 37 instruments with staff ranging from the executive level (6), to SE directors (7), to staff who worked directly with clients (24) (Table B.3).
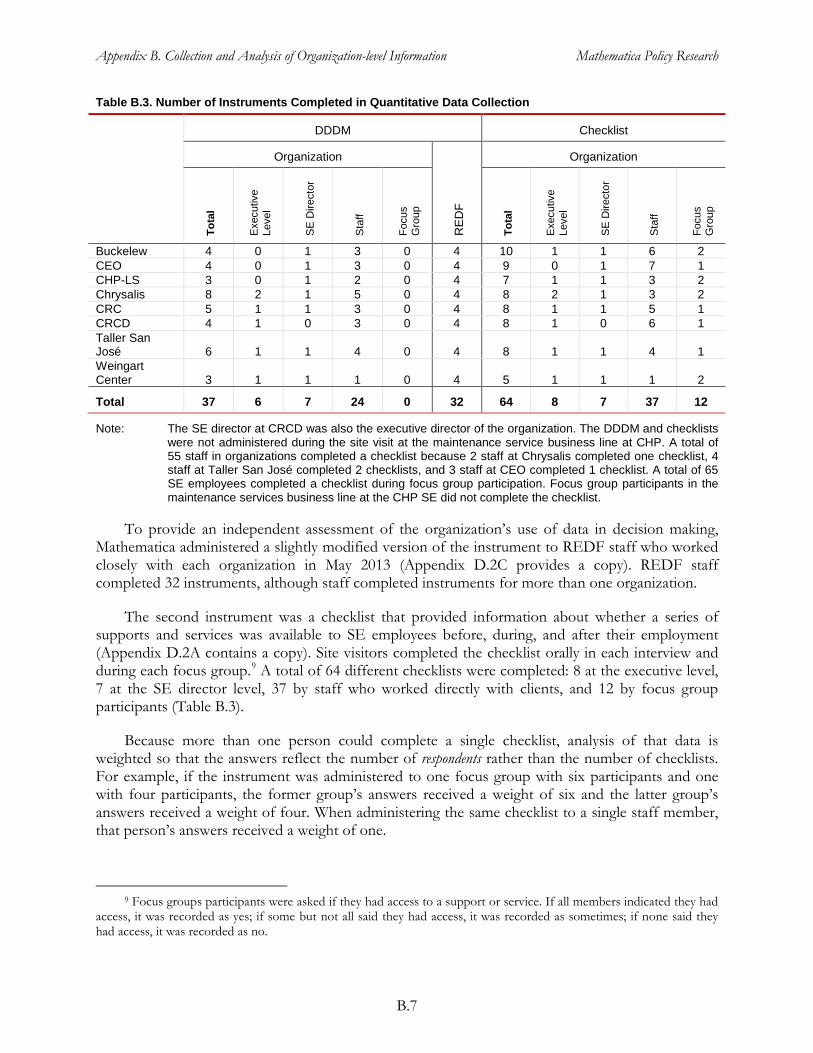
Appendix B. Collection and Analysis of Organization-level Information Mathematica Policy Research
B.7
Table B.3. Number of Instruments Completed in Quantitative Data Collection
DDDM Checklist
Organization Organization
Tota
l
Exe
cutiv
e Le
vel
SE
Dire
ctor
Sta
ff
Focu
s G
roup
RE
DF
Tota
l
Exe
cutiv
e Le
vel
SE
Dire
ctor
Sta
ff
Focu
s G
roup
Buckelew 4 0 1 3 0 4 10 1 1 6 2 CEO 4 0 1 3 0 4 9 0 1 7 1 CHP-LS 3 0 1 2 0 4 7 1 1 3 2 Chrysalis 8 2 1 5 0 4 8 2 1 3 2 CRC 5 1 1 3 0 4 8 1 1 5 1 CRCD 4 1 0 3 0 4 8 1 0 6 1 Taller San José 6 1 1 4 0 4 8 1 1 4 1 Weingart Center 3 1 1 1 0 4 5 1 1 1 2
Total 37 6 7 24 0 32 64 8 7 37 12
Note: The SE director at CRCD was also the executive director of the organization. The DDDM and checklists were not administered during the site visit at the maintenance service business line at CHP. A total of 55 staff in organizations completed a checklist because 2 staff at Chrysalis completed one checklist, 4 staff at Taller San José completed 2 checklists, and 3 staff at CEO completed 1 checklist. A total of 65 SE employees completed a checklist during focus group participation. Focus group participants in the maintenance services business line at the CHP SE did not complete the checklist.
To provide an independent assessment of the organization’s use of data in decision making, Mathematica administered a slightly modified version of the instrument to REDF staff who worked closely with each organization in May 2013 (Appendix D.2C provides a copy). REDF staff completed 32 instruments, although staff completed instruments for more than one organization.
The second instrument was a checklist that provided information about whether a series of supports and services was available to SE employees before, during, and after their employment (Appendix D.2A contains a copy). Site visitors completed the checklist orally in each interview and during each focus group.9
Because more than one person could complete a single checklist, analysis of that data is weighted so that the answers reflect the number of respondents rather than the number of checklists. For example, if the instrument was administered to one focus group with six participants and one with four participants, the former group’s answers received a weight of six and the latter group’s answers received a weight of four. When administering the same checklist to a single staff member, that person’s answers received a weight of one.
A total of 64 different checklists were completed: 8 at the executive level, 7 at the SE director level, 37 by staff who worked directly with clients, and 12 by focus group participants (Table B.3).
9 Focus groups participants were asked if they had access to a support or service. If all members indicated they had
access, it was recorded as yes; if some but not all said they had access, it was recorded as sometimes; if none said they had access, it was recorded as no.
Appendix B. Collection and Analysis of Organization-level Information Mathematica Policy Research
B.8
B. Coding and Analytic Methods
We used descriptive statistics (means and percentage distributions) to analyze the aggregate (all organizations) information from the DDDM and checklist instruments. We developed a structured coding scheme and used qualitative data analysis software to consistently code qualitative data to analyze information from the documents, telephone interviews, and site visits. Both descriptive statistics of quantitative data and annotated coded qualitative data enabled us to identify themes, patterns, and trends across organizations.
The process for coding and analyzing qualitative information from documents, telephone interviews, and site visits centered on a qualitative database developed using NVivo, a qualitative data analysis software program that supports hierarchical coding and a systematic review of textual information for comprehensive, consistent, and transparent analysis of the qualitative data. Our codes captured both site- and respondent-level attributes and information in the documents and notes in areas identified in Table B.4. We used NVivo to retrieve information, using the codes to identify themes and triangulate information across data sources and respondents. We retrieved information by organization to produce the site visit reports and the across organizations and cross-cutting themes to produce the analysis presented in the text.
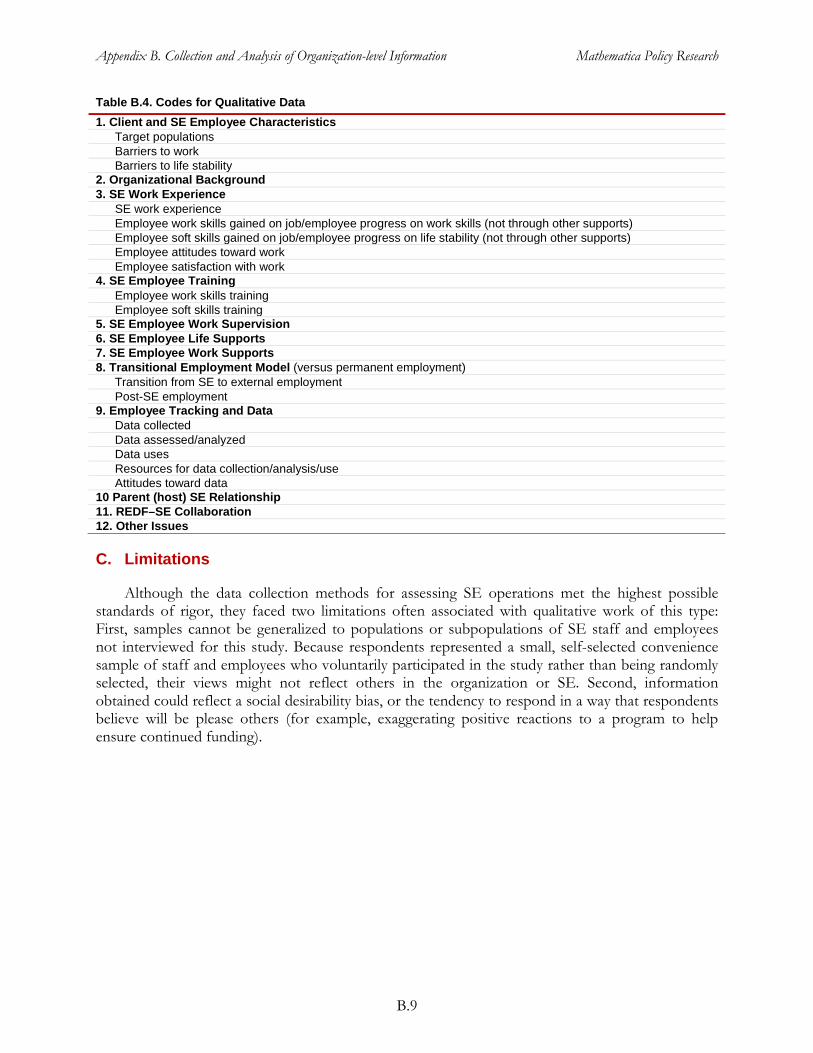
Appendix B. Collection and Analysis of Organization-level Information Mathematica Policy Research
B.9
Table B.4. Codes for Qualitative Data 1. Client and SE Employee Characteristics
Target populations Barriers to work Barriers to life stability
2. Organizational Background 3. SE Work Experience
SE work experience Employee work skills gained on job/employee progress on work skills (not through other supports) Employee soft skills gained on job/employee progress on life stability (not through other supports) Employee attitudes toward work Employee satisfaction with work
4. SE Employee Training Employee work skills training Employee soft skills training
5. SE Employee Work Supervision 6. SE Employee Life Supports 7. SE Employee Work Supports 8. Transitional Employment Model (versus permanent employment)
Transition from SE to external employment Post-SE employment
9. Employee Tracking and Data Data collected Data assessed/analyzed Data uses Resources for data collection/analysis/use Attitudes toward data
10 Parent (host) SE Relationship 11. REDF–SE Collaboration 12. Other Issues
C. Limitations
Although the data collection methods for assessing SE operations met the highest possible standards of rigor, they faced two limitations often associated with qualitative work of this type: First, samples cannot be generalized to populations or subpopulations of SE staff and employees not interviewed for this study. Because respondents represented a small, self-selected convenience sample of staff and employees who voluntarily participated in the study rather than being randomly selected, their views might not reflect others in the organization or SE. Second, information obtained could reflect a social desirability bias, or the tendency to respond in a way that respondents believe will be please others (for example, exaggerating positive reactions to a program to help ensure continued funding).

This page has been left blank for double-sided copying.

APPENDIX C
DETAILED TABLES

This page has been left blank for double-sided copying.
Appendix C. Data Tables Mathematica Policy Research
C.3
This appendix contains the data tables that serve as the basis for our main analyses. It is organized into three sections. Tables in Section A show the descriptive statistics (for example, averages, percentage distributions) of the data on individuals employed in a social enterprise (SE). Data are taken from the intake information provided to Mathematica Policy Research and the information in the baseline and exit surveys (see Appendix A for a description). Tables in Section B show the results of the multivariate analysis that examines associations between SE employment and individual outcomes and draws information from sources described in Section A. Variables in the tables in Sections A and B are defined in Appendix A, Table A.7. Tables in Section C provide the quantitative information collected at the site visits about organizations, as described in Appendix B.
A. Descriptive Statistics of Employee Data
We applied the following definitions and conditions when creating the tables in this section:
• A dependent is defined as someone the employee supports financially or the employee has responsibility for on a day-to-day basis.
- A financial dependent is someone the employee supports financially only.
- A physical dependent is someone the employee has responsibility for day-to-day activities only.
• Temporary housing is defined as without a fixed, regular, and adequate nighttime residence. Examples include an emergency shelter; transitional housing for the homeless; hospital or treatment center; jail or halfway house; group home; hotel paid for with an emergency shelter voucher; or places not meant for human habitation, such as the street or park.
• Categories were combined if they comprised less than 5 percent of the unweighted distribution. Exceptions are the other and refused categories, when applicable, which were always retained and categories developed for conceptual reasons (for example as part of a battery).
• Answers to a single question or type of question are in descending ordered based on raw frequencies in the data unless the questions constitute an established battery.
• Item-specific nonresponse reduced the number of reviews in some cells. Appendix A, Tables A.4 to A.6 show cells affected by missing data for variables.
• An asterisk (*) indicates a significant difference (p ≤ 0.05) between either other employment service applicants and individuals hired by an SE or between individuals who met or failed to meet an hours requirement as measured by a two-tailed t-test. For mutually exclusive categorical variables (for example, categories for race), a chi-square test was first computed, with a two-tailed t-test to test for significant differences between each category in the distribution only if the chi-square test showed significant differences in the distribution.10
• The following groups are referenced in this section:
10 We conducted t-tests and chi-square tests using the assumption of unequal variances.

Appendix C. Data Tables Mathematica Policy Research
C.4
- Other Employment Service Applicants: individuals who sought employment services from an organization but were not referred to an SE
- Hired by SE: individuals who were offered employment in an SE (and consented to be part of the MJS)
- Hired by SE and Met Hours Requirement: individuals hired into an SE and who worked 32 hours or more over four weeks in an SE
- Hired by SE But Did Not Meet Hours Requirement: individuals hired into an SE who did not work 32 or more hours over four weeks
• The tables use the following abbreviations and symbol:
- GED: general educational development test
- MJS: Mathematica Jobs Study
- SE: social enterprise
- --: not reported
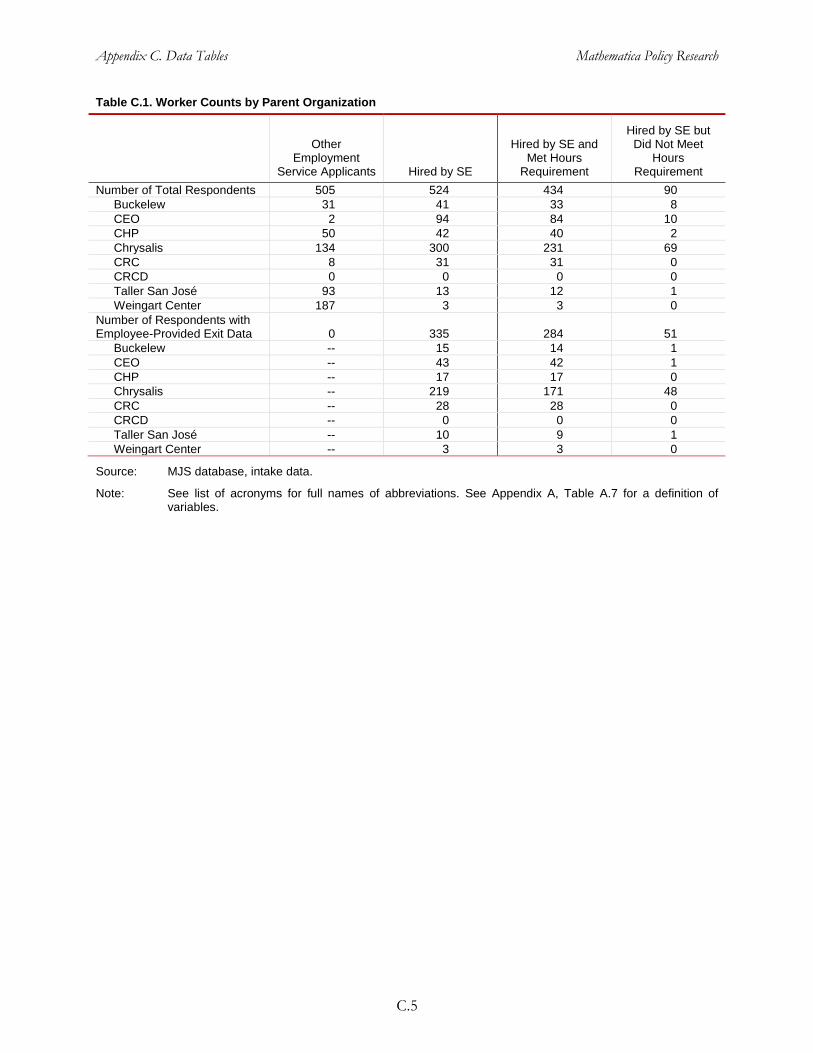
Appendix C. Data Tables Mathematica Policy Research
C.5
Table C.1. Worker Counts by Parent Organization
Other Employment
Service Applicants Hired by SE
Hired by SE and Met Hours
Requirement
Hired by SE but Did Not Meet
Hours Requirement
Number of Total Respondents 505 524 434 90 Buckelew 31 41 33 8 CEO 2 94 84 10 CHP 50 42 40 2 Chrysalis 134 300 231 69 CRC 8 31 31 0 CRCD 0 0 0 0 Taller San José 93 13 12 1 Weingart Center 187 3 3 0
Number of Respondents with Employee-Provided Exit Data 0 335 284 51
Buckelew -- 15 14 1 CEO -- 43 42 1 CHP -- 17 17 0 Chrysalis -- 219 171 48 CRC -- 28 28 0 CRCD -- 0 0 0 Taller San José -- 10 9 1 Weingart Center -- 3 3 0
Source: MJS database, intake data.
Note: See list of acronyms for full names of abbreviations. See Appendix A, Table A.7 for a definition of variables.

Appendix C. Data Tables Mathematica Policy Research
C.6
Table C.2. Characteristics (percentages unless otherwise reported)
Other Employment
Service Applicants Hired by SE
Hired by SE and Met Hours
Requirement
Hired by SE but Did Not Meet Hours Requirement
Number of Respondents 505 524 434 90 Demographics
Male 62.0* 79.9 80.3 77.9 Average age 39.0 40.4 40.1 42.2 Hispanic 31.9* 17.0 16.6 19.1 Race
Black 44.2* 59.6 60.8 53.9 White 23.0 23.1 21.9 29.0 Asian, Native American, or multiple racesb 8.3 5.5 5.5 5.7 Other racec 13.7* 9.2 9.4 8.0 Refused 11.1* 3.0 2.9 3.4
Marital Status Single 73.3 75.4 74.7 79.1 Married or in a domestic partnership 9.0 11.8 12.6 7.9 Divorced or widowed 12.5 7.9 8.0 7.1 Separated 5.0 4.9 4.7 5.8
Dependents Average number of dependents -- 0.7 0.8 0.6 No dependents -- 64.3 62.9 70.6 Average number of financial dependents -- 0.6 0.6 0.5 No financial dependents -- 69.4 68.3 74.7 Average number of physical dependents -- 0.4 0.4 0.4 No physical dependents -- 78.2 77.9 79.9
Military Veteran 7.6 5.2 4.6 7.8 If served, period served (all that apply)
Gulf War period (8/90 to 3/95) or later 27.0 11.2 15.2 0.0 5/75 to 7/90 63.2 55.2 59.6 42.9 Before 5/75 (Vietnam era or earlier) 16.2 22.4 15.2 42.9 Missing 2.7 11.2 10.1 14.3
Source: MJS database, intake data except for dependents (baseline).
Note: See Appendix A, Table A.7 for a definition of variables.
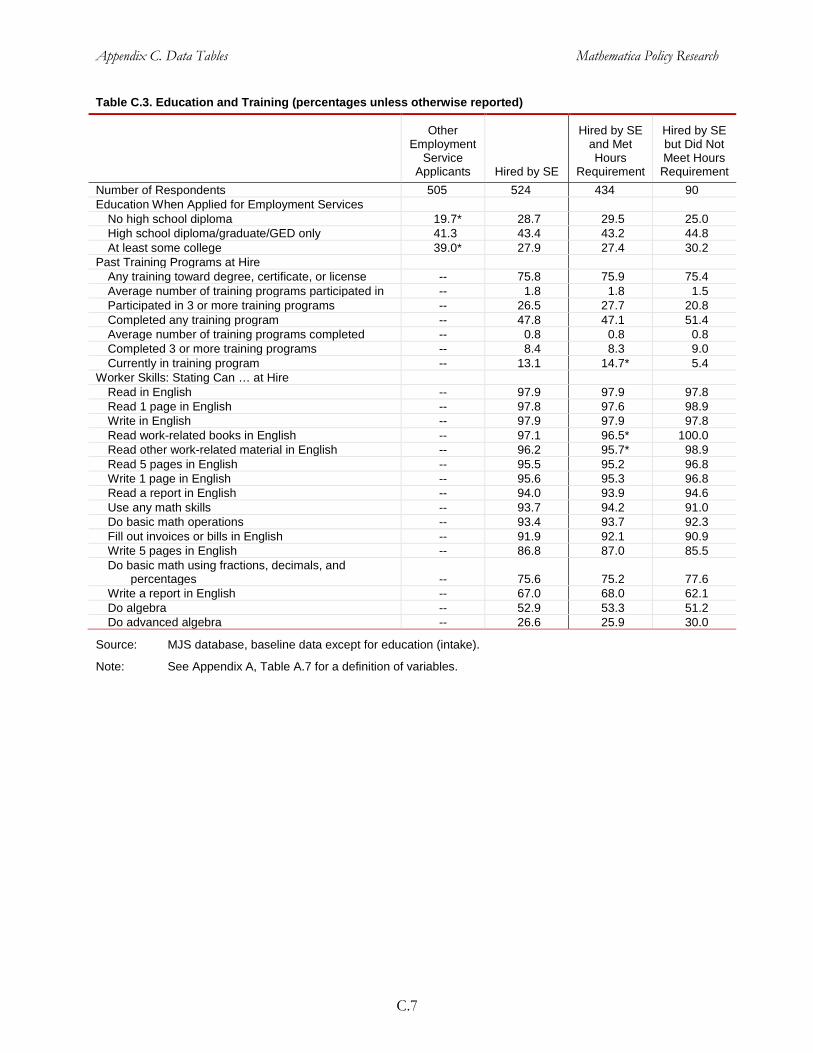
Appendix C. Data Tables Mathematica Policy Research
C.7
Table C.3. Education and Training (percentages unless otherwise reported)
Other Employment
Service Applicants Hired by SE
Hired by SE and Met Hours
Requirement
Hired by SE but Did Not Meet Hours Requirement
Number of Respondents 505 524 434 90 Education When Applied for Employment Services
No high school diploma 19.7* 28.7 29.5 25.0 High school diploma/graduate/GED only 41.3 43.4 43.2 44.8 At least some college 39.0* 27.9 27.4 30.2
Past Training Programs at Hire Any training toward degree, certificate, or license -- 75.8 75.9 75.4 Average number of training programs participated in -- 1.8 1.8 1.5 Participated in 3 or more training programs -- 26.5 27.7 20.8 Completed any training program -- 47.8 47.1 51.4 Average number of training programs completed -- 0.8 0.8 0.8 Completed 3 or more training programs -- 8.4 8.3 9.0 Currently in training program -- 13.1 14.7* 5.4
Worker Skills: Stating Can … at Hire Read in English -- 97.9 97.9 97.8 Read 1 page in English -- 97.8 97.6 98.9 Write in English -- 97.9 97.9 97.8 Read work-related books in English -- 97.1 96.5* 100.0 Read other work-related material in English -- 96.2 95.7* 98.9 Read 5 pages in English -- 95.5 95.2 96.8 Write 1 page in English -- 95.6 95.3 96.8 Read a report in English -- 94.0 93.9 94.6 Use any math skills -- 93.7 94.2 91.0 Do basic math operations -- 93.4 93.7 92.3 Fill out invoices or bills in English -- 91.9 92.1 90.9 Write 5 pages in English -- 86.8 87.0 85.5 Do basic math using fractions, decimals, and
percentages -- 75.6 75.2 77.6 Write a report in English -- 67.0 68.0 62.1 Do algebra -- 52.9 53.3 51.2 Do advanced algebra -- 26.6 25.9 30.0
Source: MJS database, baseline data except for education (intake).
Note: See Appendix A, Table A.7 for a definition of variables.
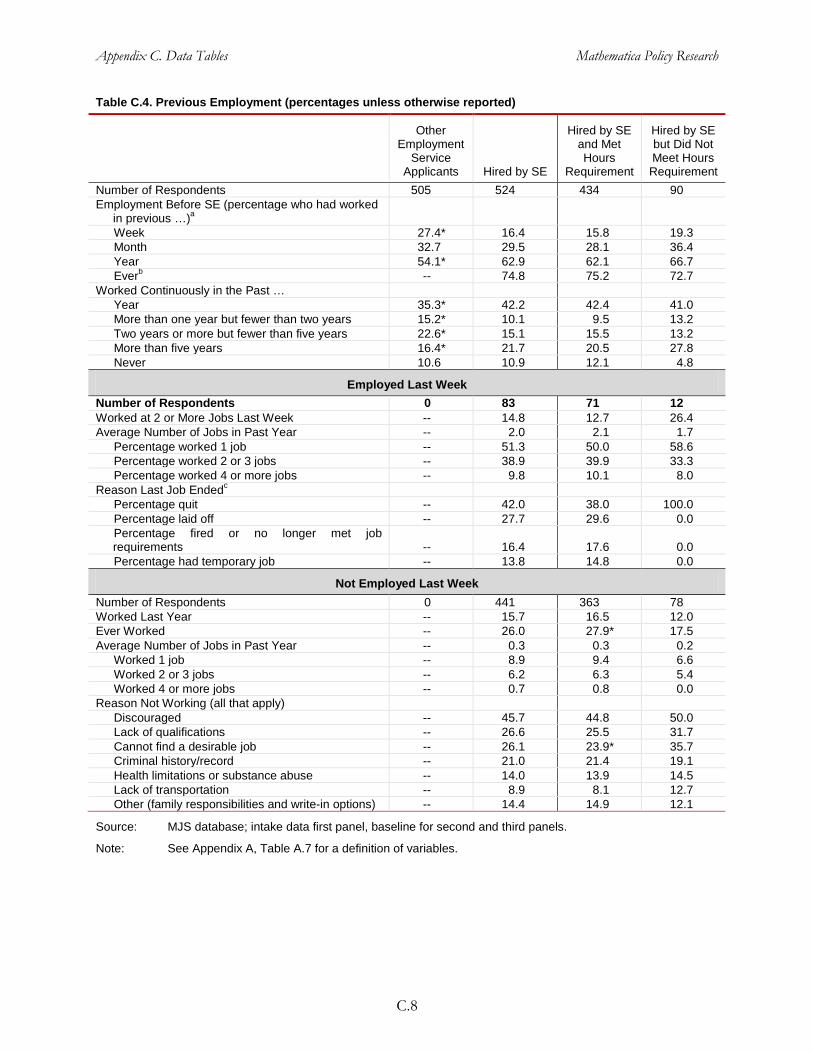
Appendix C. Data Tables Mathematica Policy Research
C.8
Table C.4. Previous Employment (percentages unless otherwise reported)
Other Employment
Service Applicants Hired by SE
Hired by SE and Met Hours
Requirement
Hired by SE but Did Not Meet Hours Requirement
Number of Respondents 505 524 434 90 Employment Before SE (percentage who had worked
in previous …)a Week 27.4* 16.4 15.8 19.3 Month 32.7 29.5 28.1 36.4 Year 54.1* 62.9 62.1 66.7 Everb -- 74.8 75.2 72.7
Worked Continuously in the Past … Year 35.3* 42.2 42.4 41.0 More than one year but fewer than two years 15.2* 10.1 9.5 13.2 Two years or more but fewer than five years 22.6* 15.1 15.5 13.2 More than five years 16.4* 21.7 20.5 27.8 Never 10.6 10.9 12.1 4.8
Employed Last Week Number of Respondents 0 83 71 12 Worked at 2 or More Jobs Last Week -- 14.8 12.7 26.4 Average Number of Jobs in Past Year -- 2.0 2.1 1.7
Percentage worked 1 job -- 51.3 50.0 58.6 Percentage worked 2 or 3 jobs -- 38.9 39.9 33.3 Percentage worked 4 or more jobs -- 9.8 10.1 8.0
Reason Last Job Endedc Percentage quit -- 42.0 38.0 100.0 Percentage laid off -- 27.7 29.6 0.0 Percentage fired or no longer met job requirements -- 16.4 17.6 0.0 Percentage had temporary job -- 13.8 14.8 0.0
Not Employed Last Week Number of Respondents 0 441 363 78 Worked Last Year -- 15.7 16.5 12.0 Ever Worked -- 26.0 27.9* 17.5 Average Number of Jobs in Past Year -- 0.3 0.3 0.2
Worked 1 job -- 8.9 9.4 6.6 Worked 2 or 3 jobs -- 6.2 6.3 5.4 Worked 4 or more jobs -- 0.7 0.8 0.0
Reason Not Working (all that apply) Discouraged -- 45.7 44.8 50.0 Lack of qualifications -- 26.6 25.5 31.7 Cannot find a desirable job -- 26.1 23.9* 35.7 Criminal history/record -- 21.0 21.4 19.1 Health limitations or substance abuse -- 14.0 13.9 14.5 Lack of transportation -- 8.9 8.1 12.7 Other (family responsibilities and write-in options) -- 14.4 14.9 12.1
Source: MJS database; intake data first panel, baseline for second and third panels.
Note: See Appendix A, Table A.7 for a definition of variables.
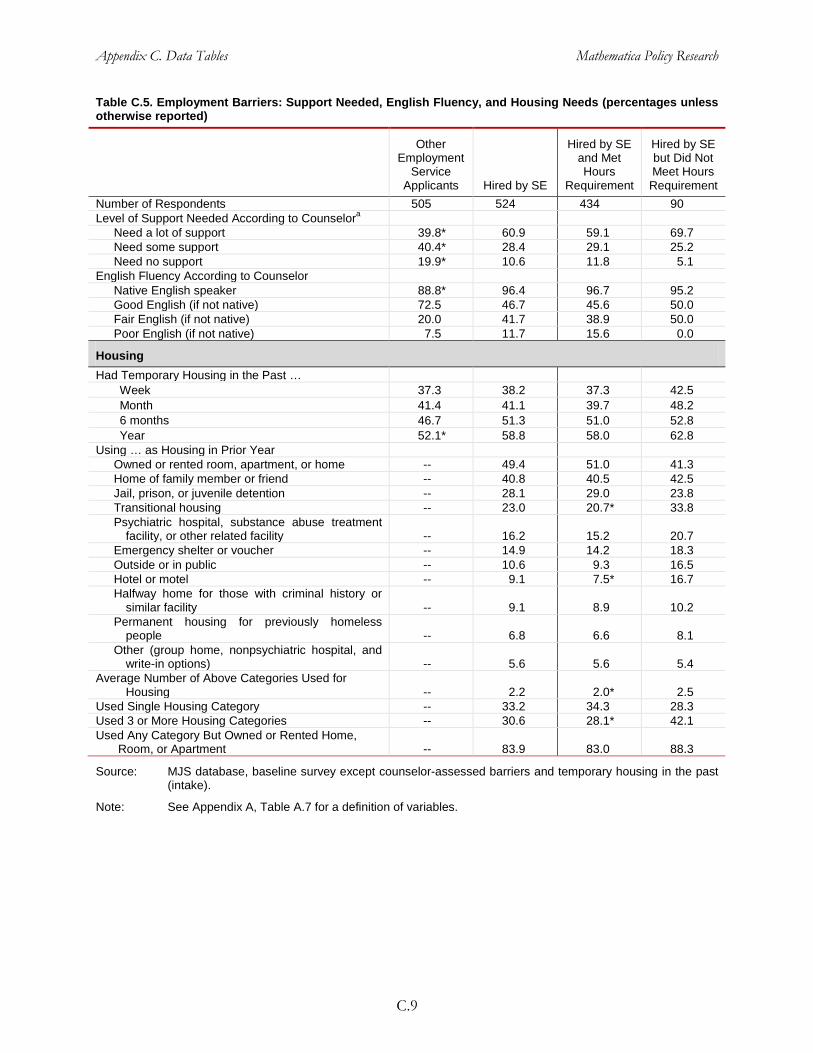
Appendix C. Data Tables Mathematica Policy Research
C.9
Table C.5. Employment Barriers: Support Needed, English Fluency, and Housing Needs (percentages unless otherwise reported)
Other Employment
Service Applicants Hired by SE
Hired by SE and Met Hours
Requirement
Hired by SE but Did Not Meet Hours Requirement
Number of Respondents 505 524 434 90 Level of Support Needed According to Counselora
Need a lot of support 39.8* 60.9 59.1 69.7 Need some support 40.4* 28.4 29.1 25.2 Need no support 19.9* 10.6 11.8 5.1
English Fluency According to Counselor Native English speaker 88.8* 96.4 96.7 95.2 Good English (if not native) 72.5 46.7 45.6 50.0 Fair English (if not native) 20.0 41.7 38.9 50.0 Poor English (if not native) 7.5 11.7 15.6 0.0
Housing Had Temporary Housing in the Past …
Week 37.3 38.2 37.3 42.5 Month 41.4 41.1 39.7 48.2 6 months 46.7 51.3 51.0 52.8 Year 52.1* 58.8 58.0 62.8
Using … as Housing in Prior Year Owned or rented room, apartment, or home -- 49.4 51.0 41.3 Home of family member or friend -- 40.8 40.5 42.5 Jail, prison, or juvenile detention -- 28.1 29.0 23.8 Transitional housing -- 23.0 20.7* 33.8 Psychiatric hospital, substance abuse treatment
facility, or other related facility -- 16.2 15.2 20.7 Emergency shelter or voucher -- 14.9 14.2 18.3 Outside or in public -- 10.6 9.3 16.5 Hotel or motel -- 9.1 7.5* 16.7 Halfway home for those with criminal history or
similar facility -- 9.1 8.9 10.2 Permanent housing for previously homeless
people -- 6.8 6.6 8.1 Other (group home, nonpsychiatric hospital, and
write-in options) -- 5.6 5.6 5.4 Average Number of Above Categories Used for
Housing -- 2.2 2.0* 2.5 Used Single Housing Category -- 33.2 34.3 28.3 Used 3 or More Housing Categories -- 30.6 28.1* 42.1 Used Any Category But Owned or Rented Home,
Room, or Apartment -- 83.9 83.0 88.3
Source: MJS database, baseline survey except counselor-assessed barriers and temporary housing in the past (intake).
Note: See Appendix A, Table A.7 for a definition of variables.

Appendix C. Data Tables Mathematica Policy Research
C.10
Table C.6. Employment Barriers: Criminal Activity (percentages unless otherwise reported)
Other Employment
Service Applicants Hired by SE
Hired by SE and Met Hours
Requirement
Hired by SE but Did Not Meet Hours
Requirement Number of Respondents 505 524 434 90 Ever Arrested 57.3* 81.0 82.4 74.0 Average Number of Arrests -- 7.1 7.5* 5.6 Conviction
Ever convicted and sentenced to time in jail or prison 43.2* 69.8 70.9* 59.6 If convicted Average months since last conviction 62.1* 78.2 77.5 82.4
Most recent conviction in past year 20.7* 6.7 6.9 6.0 Most recent conviction more than 1 year but
fewer than 2 years ago 14.9 14.7 14.0 18.8 Most recent conviction more than 2 years but
fewer than 5 years ago 26.1* 37.9 39.2 30.8 Most recent conviction more than 5 years ago 30.6* 39.4 39.3 40.5
Sentencing Average total time sentenced (months, if any) -- 106.3 106.4 105.9
Sentenced to less than 1 year -- 12.2 12.2 12.3 Sentenced to 1 to 2 years -- 16.0 15.4 19.1 Sentenced to more than 2 years -- 71.8 72.4 68.5
Probation or Parole Currently on probation or parole (if ever convicted) -- 67.3 68.9 57.7 Average months remaining on probation or parole (if
any) -- 20.9 21.5 16.8 Less than 1 year remaining -- 29.9 29.6 32.0 1 to 2 years remaining -- 39.7 38.2 51.1 More than 2 years remaining -- 30.5 32.2 16.9
Source: MJS database: intake data for ever arrested and conviction data, baseline for all other variables.
Note: See Appendix A, Table A.7 for a definition of variables.
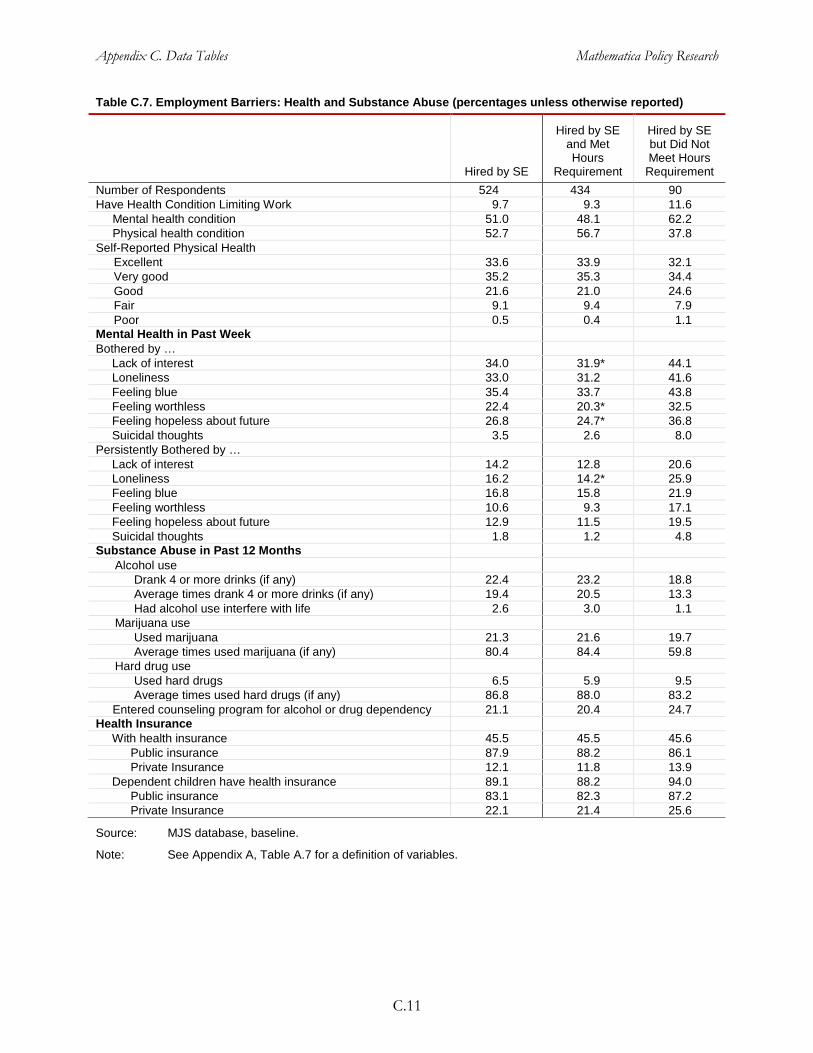
Appendix C. Data Tables Mathematica Policy Research
C.11
Table C.7. Employment Barriers: Health and Substance Abuse (percentages unless otherwise reported)
Hired by SE
Hired by SE and Met Hours
Requirement
Hired by SE but Did Not Meet Hours
Requirement Number of Respondents 524 434 90 Have Health Condition Limiting Work 9.7 9.3 11.6
Mental health condition 51.0 48.1 62.2 Physical health condition 52.7 56.7 37.8
Self-Reported Physical Health Excellent 33.6 33.9 32.1 Very good 35.2 35.3 34.4 Good 21.6 21.0 24.6 Fair 9.1 9.4 7.9 Poor 0.5 0.4 1.1
Mental Health in Past Week Bothered by …
Lack of interest 34.0 31.9* 44.1 Loneliness 33.0 31.2 41.6 Feeling blue 35.4 33.7 43.8 Feeling worthless 22.4 20.3* 32.5 Feeling hopeless about future 26.8 24.7* 36.8 Suicidal thoughts 3.5 2.6 8.0
Persistently Bothered by … Lack of interest 14.2 12.8 20.6 Loneliness 16.2 14.2* 25.9 Feeling blue 16.8 15.8 21.9 Feeling worthless 10.6 9.3 17.1 Feeling hopeless about future 12.9 11.5 19.5 Suicidal thoughts 1.8 1.2 4.8
Substance Abuse in Past 12 Months Alcohol use
Drank 4 or more drinks (if any) 22.4 23.2 18.8 Average times drank 4 or more drinks (if any) 19.4 20.5 13.3 Had alcohol use interfere with life 2.6 3.0 1.1
Marijuana use Used marijuana 21.3 21.6 19.7 Average times used marijuana (if any) 80.4 84.4 59.8
Hard drug use Used hard drugs 6.5 5.9 9.5 Average times used hard drugs (if any) 86.8 88.0 83.2
Entered counseling program for alcohol or drug dependency 21.1 20.4 24.7 Health Insurance
With health insurance 45.5 45.5 45.6 Public insurance 87.9 88.2 86.1 Private Insurance 12.1 11.8 13.9
Dependent children have health insurance 89.1 88.2 94.0 Public insurance 83.1 82.3 87.2 Private Insurance 22.1 21.4 25.6
Source: MJS database, baseline.
Note: See Appendix A, Table A.7 for a definition of variables.

Appendix C. Data Tables Mathematica Policy Research
C.12
Table C.8. Income (percentages unless otherwise reported)
Other Employment
Service Applicants Hired by SE
Hired by SE and Met Hours
Requirement
Hired by SE but Did Not Meet Hours
Requirement Number of Respondents 505 524 434 90
Income below 200 percent of federal poverty level 90.5* 98.1 98.2 97.5 Don’t know income 8.5* 1.7 1.5 2.5 With bank account -- 37.5 37.6 36.7
Receiving Any Income from Work -- 30.4 30.9 28.1 Food stamps; Supplemental Nutrition Assistance
Program; or Women, Infants and Children Program -- 52.8 49.8* 67.4
Welfare programs (for example, Temporary Assistance for Needy Families [TANF] or CalWORKs) -- 39.3 38.2 44.4
Earned income tax credit -- 10.6 9.2 17.5 Disability or worker’s compensation -- 10.2 10.8 7.1 Unemployment Insurance -- 6.7 7.4 3.5 Other government transfers -- 1.0 0.7 2.2 Transfers from others -- 16.9 17.4 14.3 Other sources -- 3.3 3.1 4.4
Average Monthly Income from … When Started All sources -- 787.1 809.6 675.9 Salary or wage income from work -- 338.0 362.3 221.5 Food stamps; Supplemental Nutritional Assistance
Program; or Women, Infants and Children Program -- 110.9 105.7* 136.4
Welfare programs (for example, TANF or CalWORKs) -- 97.2 94.2 111.6
Earned income tax credit -- 14.9 12.4 27.7 Disability or worker’s compensation -- 78.1 82.4 57.3 Unemployment Insurance -- 48.6 54.0 22.4 Other government transfers -- 4.0 3.7 5.6 Transfers from others -- 68.1 68.4 66.9 Other sources -- 22.4 20.7 30.8
Share of Income from … When Started Work -- 22.9 23.4 21.0 Government transfers -- 67.8 67.0 71.5 Transfers from others -- 7.6 8.2 4.6
Source: MJS database, baseline except income below federal poverty (intake).
Note: See Appendix A, Table A.7 for a definition of variables.

Appendix C. Data Tables Mathematica Policy Research
C.13
Table C.9. Goals and Employment Attitudes (percentages)
Hired by SE
Hired by SE and Met Hours
Requirement
Hired by SE but Did Not Meet Hours
Requirement Number of Respondents 524 434 90 In 5 Years, Do You Think You Will …
Have continued your education or undertaken additional job training 81.7 81.9 80.8
Own or rent your own home or apartment 90.6 91.4 86.7 Be established in a career 87.5 88.7 81.7 Be in good mental health 93.0 93.5 90.6 Be in good physical health 93.7 94.3 90.9 Be economically self-sufficient 93.4 93.5 93.2 Rarely drink alcohol or use drugs 84.4 84.0 86.0 Be removed from illegal activity 94.3 94.3 94.0 Percentage with other stated goal (write-in) 4.0 3.9 4.6
Percentage Believe Job Is Only a Way to Earn Money—Nothing More 20.2 19.6 23.0
Percentage Would Enjoy Having a Job Even If Did Not Need Money 80.7 80.9 79.9
Percentage Believe the Following Are Important or Very Important for Job Quality
Job security 97.9 97.7 98.8 Opportunities for advancement 96.9 97.2 95.5 Interesting 95.6 95.8 94.4 Useful to society 94.4 94.5 94.3 Allows worker to help others 94.0 93.9 94.7 Independence on the job 80.6 80.8 79.3 High income 80.0 80.9 75.6 Flexible work days or times 51.6 51.9 49.7
Percentage Satisfied with Job Aspects, Current or Last Job Type of work 91.8 91.2 96.2 Independence on the job 92.6 92.1 96.2 Responsibility on the job 91.1 91.4 88.7 Feedback received 86.8 87.2 83.8 Job’s contribution to society 86.4 86.2 87.6 Support received 84.5 85.2 80.0 Job location 84.6 84.7 83.8 Salary 78.5 77.6 84.3 Number of hours worked 77.6 77.1 80.5 Job security 77.7 77.2 81.1 Intellectual challenge of job 69.2 68.0 76.8 Opportunities for advancement 51.0 50.8 52.4 Benefits 41.9 42.2 39.4
Source: MJS database, baseline.
Note: See Appendix A, Table A.7 for a definition of variables.
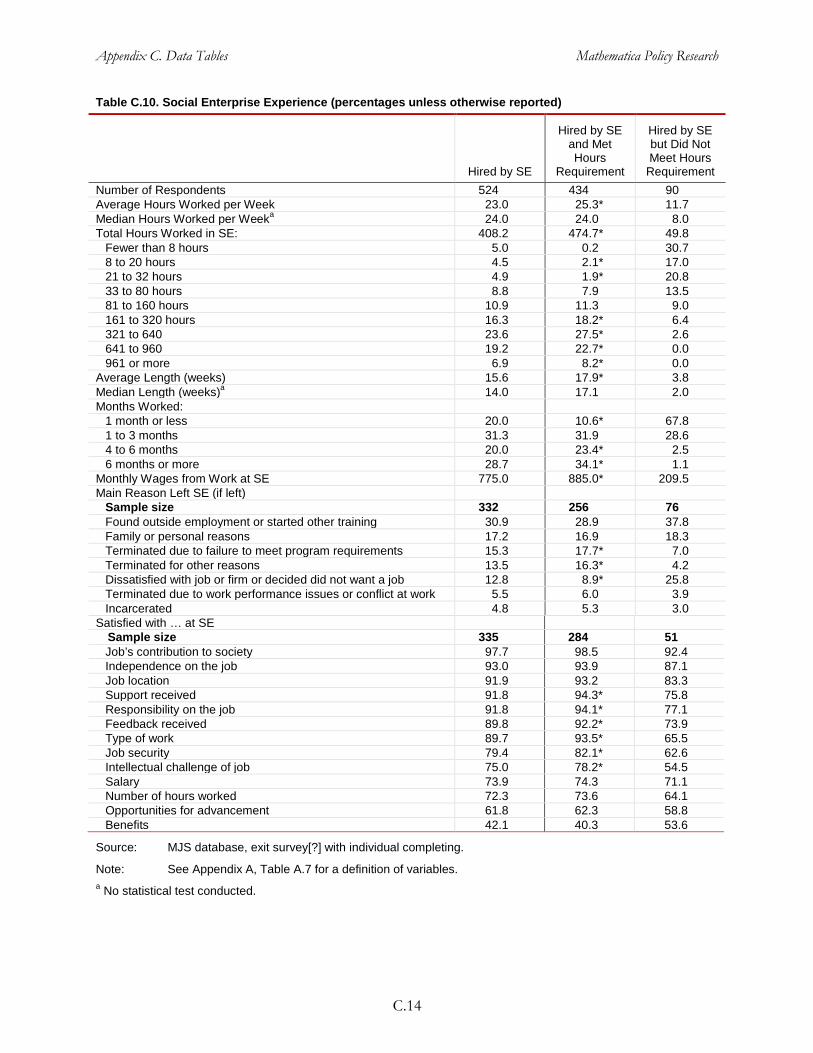
Appendix C. Data Tables Mathematica Policy Research
C.14
Table C.10. Social Enterprise Experience (percentages unless otherwise reported)
Hired by SE
Hired by SE and Met Hours
Requirement
Hired by SE but Did Not Meet Hours
Requirement Number of Respondents 524 434 90 Average Hours Worked per Week 23.0 25.3* 11.7 Median Hours Worked per Weeka 24.0 24.0 8.0 Total Hours Worked in SE: 408.2 474.7* 49.8
Fewer than 8 hours 5.0 0.2 30.7 8 to 20 hours 4.5 2.1* 17.0 21 to 32 hours 4.9 1.9* 20.8 33 to 80 hours 8.8 7.9 13.5 81 to 160 hours 10.9 11.3 9.0 161 to 320 hours 16.3 18.2* 6.4 321 to 640 23.6 27.5* 2.6 641 to 960 19.2 22.7* 0.0 961 or more 6.9 8.2* 0.0
Average Length (weeks) 15.6 17.9* 3.8 Median Length (weeks)a 14.0 17.1 2.0 Months Worked:
1 month or less 20.0 10.6* 67.8 1 to 3 months 31.3 31.9 28.6 4 to 6 months 20.0 23.4* 2.5 6 months or more 28.7 34.1* 1.1
Monthly Wages from Work at SE 775.0 885.0* 209.5 Main Reason Left SE (if left)
Sample size 332 256 76 Found outside employment or started other training 30.9 28.9 37.8 Family or personal reasons 17.2 16.9 18.3 Terminated due to failure to meet program requirements 15.3 17.7* 7.0 Terminated for other reasons 13.5 16.3* 4.2 Dissatisfied with job or firm or decided did not want a job 12.8 8.9* 25.8 Terminated due to work performance issues or conflict at work 5.5 6.0 3.9 Incarcerated 4.8 5.3 3.0
Satisfied with … at SE Sample size 335 284 51 Job’s contribution to society 97.7 98.5 92.4 Independence on the job 93.0 93.9 87.1 Job location 91.9 93.2 83.3 Support received 91.8 94.3* 75.8 Responsibility on the job 91.8 94.1* 77.1 Feedback received 89.8 92.2* 73.9 Type of work 89.7 93.5* 65.5 Job security 79.4 82.1* 62.6 Intellectual challenge of job 75.0 78.2* 54.5 Salary 73.9 74.3 71.1 Number of hours worked 72.3 73.6 64.1 Opportunities for advancement 61.8 62.3 58.8 Benefits 42.1 40.3 53.6
Source: MJS database, exit survey[?] with individual completing.
Note: See Appendix A, Table A.7 for a definition of variables. a No statistical test conducted.
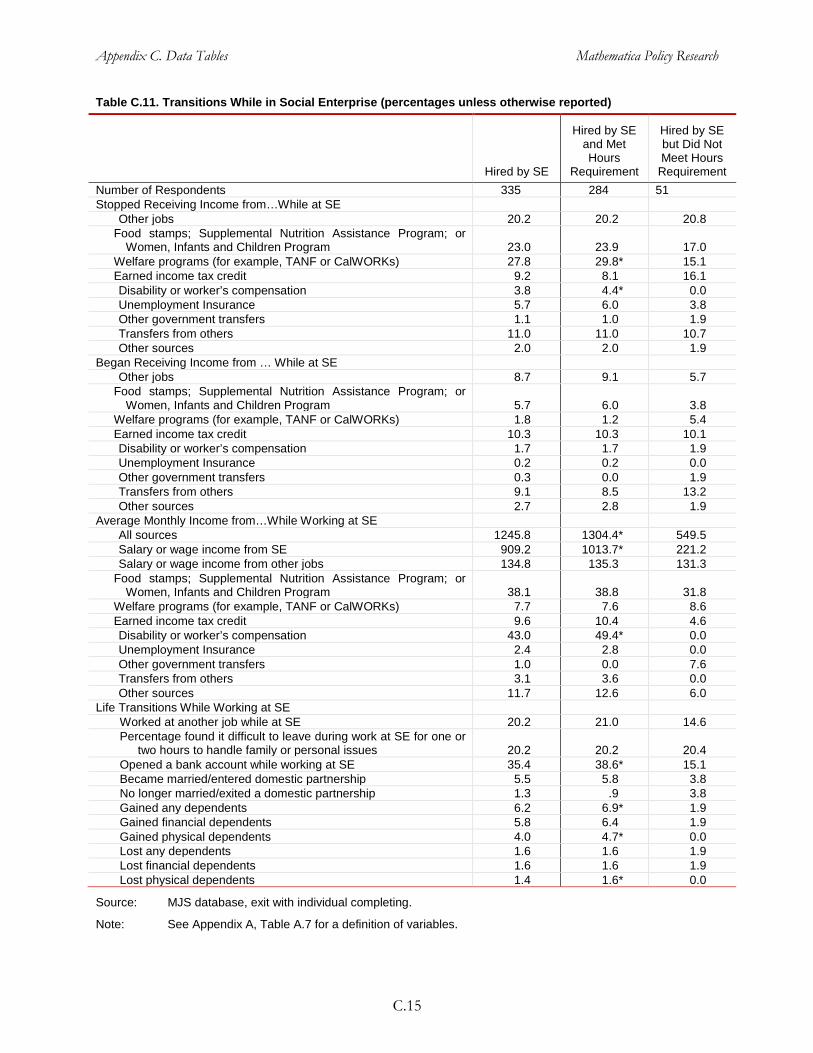
Appendix C. Data Tables Mathematica Policy Research
C.15
Table C.11. Transitions While in Social Enterprise (percentages unless otherwise reported)
Hired by SE
Hired by SE and Met Hours
Requirement
Hired by SE but Did Not Meet Hours
Requirement Number of Respondents 335 284 51 Stopped Receiving Income from…While at SE
Other jobs 20.2 20.2 20.8 Food stamps; Supplemental Nutrition Assistance Program; or
Women, Infants and Children Program 23.0 23.9 17.0 Welfare programs (for example, TANF or CalWORKs) 27.8 29.8* 15.1 Earned income tax credit 9.2 8.1 16.1 Disability or worker’s compensation 3.8 4.4* 0.0 Unemployment Insurance 5.7 6.0 3.8 Other government transfers 1.1 1.0 1.9 Transfers from others 11.0 11.0 10.7 Other sources 2.0 2.0 1.9
Began Receiving Income from … While at SE Other jobs 8.7 9.1 5.7
Food stamps; Supplemental Nutrition Assistance Program; or Women, Infants and Children Program 5.7 6.0 3.8
Welfare programs (for example, TANF or CalWORKs) 1.8 1.2 5.4 Earned income tax credit 10.3 10.3 10.1 Disability or worker’s compensation 1.7 1.7 1.9 Unemployment Insurance 0.2 0.2 0.0 Other government transfers 0.3 0.0 1.9 Transfers from others 9.1 8.5 13.2 Other sources 2.7 2.8 1.9
Average Monthly Income from…While Working at SE All sources 1245.8 1304.4* 549.5 Salary or wage income from SE 909.2 1013.7* 221.2 Salary or wage income from other jobs 134.8 135.3 131.3
Food stamps; Supplemental Nutrition Assistance Program; or Women, Infants and Children Program 38.1 38.8 31.8
Welfare programs (for example, TANF or CalWORKs) 7.7 7.6 8.6 Earned income tax credit 9.6 10.4 4.6 Disability or worker’s compensation 43.0 49.4* 0.0 Unemployment Insurance 2.4 2.8 0.0 Other government transfers 1.0 0.0 7.6 Transfers from others 3.1 3.6 0.0 Other sources 11.7 12.6 6.0
Life Transitions While Working at SE Worked at another job while at SE 20.2 21.0 14.6 Percentage found it difficult to leave during work at SE for one or
two hours to handle family or personal issues 20.2 20.2 20.4 Opened a bank account while working at SE 35.4 38.6* 15.1 Became married/entered domestic partnership 5.5 5.8 3.8 No longer married/exited a domestic partnership 1.3 .9 3.8 Gained any dependents 6.2 6.9* 1.9 Gained financial dependents 5.8 6.4 1.9 Gained physical dependents 4.0 4.7* 0.0 Lost any dependents 1.6 1.6 1.9 Lost financial dependents 1.6 1.6 1.9 Lost physical dependents 1.4 1.6* 0.0
Source: MJS database, exit with individual completing.
Note: See Appendix A, Table A.7 for a definition of variables.
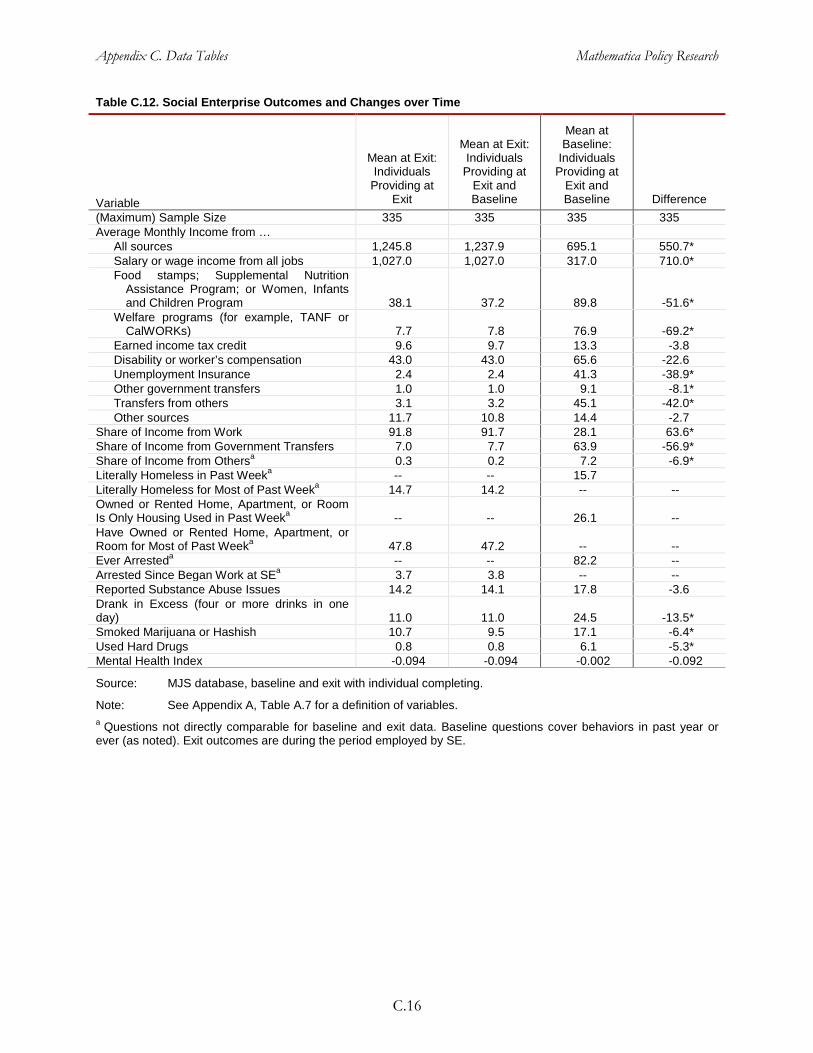
Appendix C. Data Tables Mathematica Policy Research
C.16
Table C.12. Social Enterprise Outcomes and Changes over Time
Variable
Mean at Exit: Individuals
Providing at Exit
Mean at Exit: Individuals
Providing at Exit and Baseline
Mean at Baseline:
Individuals Providing at
Exit and Baseline Difference
(Maximum) Sample Size 335 335 335 335 Average Monthly Income from …
All sources 1,245.8 1,237.9 695.1 550.7* Salary or wage income from all jobs 1,027.0 1,027.0 317.0 710.0* Food stamps; Supplemental Nutrition
Assistance Program; or Women, Infants and Children Program 38.1 37.2 89.8 -51.6*
Welfare programs (for example, TANF or CalWORKs) 7.7 7.8 76.9 -69.2*
Earned income tax credit 9.6 9.7 13.3 -3.8 Disability or worker’s compensation 43.0 43.0 65.6 -22.6 Unemployment Insurance 2.4 2.4 41.3 -38.9* Other government transfers 1.0 1.0 9.1 -8.1* Transfers from others 3.1 3.2 45.1 -42.0* Other sources 11.7 10.8 14.4 -2.7
Share of Income from Work 91.8 91.7 28.1 63.6* Share of Income from Government Transfers 7.0 7.7 63.9 -56.9* Share of Income from Othersa 0.3 0.2 7.2 -6.9* Literally Homeless in Past Weeka -- -- 15.7 Literally Homeless for Most of Past Weeka 14.7 14.2 -- -- Owned or Rented Home, Apartment, or Room Is Only Housing Used in Past Weeka -- -- 26.1 -- Have Owned or Rented Home, Apartment, or Room for Most of Past Weeka 47.8 47.2 -- -- Ever Arresteda -- -- 82.2 -- Arrested Since Began Work at SEa 3.7 3.8 -- -- Reported Substance Abuse Issues 14.2 14.1 17.8 -3.6 Drank in Excess (four or more drinks in one day) 11.0 11.0 24.5 -13.5* Smoked Marijuana or Hashish 10.7 9.5 17.1 -6.4* Used Hard Drugs 0.8 0.8 6.1 -5.3* Mental Health Index -0.094 -0.094 -0.002 -0.092
Source: MJS database, baseline and exit with individual completing.
Note: See Appendix A, Table A.7 for a definition of variables. a Questions not directly comparable for baseline and exit data. Baseline questions cover behaviors in past year or ever (as noted). Exit outcomes are during the period employed by SE.
Appendix C. Data Tables Mathematica Policy Research
C.17
B. Multivariate Analysis of Participant Data
We used multivariate regression analysis to assess the organizational and individual characteristics associated with SE outputs and outcomes. This analysis enabled us to isolate the relationship between a single characteristic and an outcome or output of interest, holding other factors constant. This section presents the findings of our multivariate analysis. Appendix A, Table A..B.2 describes the regressions we estimated in detail and Chapter IV of our report details our key findings. Definitions for all variables can be found in Appendix A, Table A.7.
We applied the following definitions and conditions when creating the tables in this section:
• Some categories were combined:
- If they comprised less than 5 percent of the unweighted distribution. Exceptions are the other and refused categories, when applicable, which were always retained, and categories developed for conceptual reasons (for example as part of a battery).
- To increase specification parsimony.
• Each variable took the value of its mean with indicator variables (1 = missing and 0 = not missing value) for inclusion in the analysis. These variables were excluded from estimations if they perfectly predicted a binary outcome and are not included in tables.
• Regressions with continuous outcomes were estimated using ordinary least squares and those with binary outcomes were estimated with a linear probability model. Results are robust to using alternative statistical models.
• The category with the highest frequency is made the comparison category and is noted in parentheses in the row heading for the category.
• All tables present estimated coefficients with robust standard errors in parenthesis.
• All tables use two asterisks (**) to indicate regression coefficients that are significantly different from zero at the 5 percent level (p ≤ 0.05) and a single asterisk (*) to indicate they are significantly different from zero at the 10 percent level (p ≤ 0.10).
• The following groups were used in analysis:
- Referred to SE: individuals who sought employment services from an organization and were referred to an SE for employment services. These groups might have followed up on their referral by contacting the SE. They also might have been hired by the SE
- Hired by SE: individuals who were offered employment in an SE (and consented to be part of the MJS).
- Hired by SE and Exit: individuals hired by an SE who completed an exit survey (that is, the staff did not complete the shorter, proxy version of the exit survey for them).
• We use the following abbreviations and symbol in the tables:
- n.a.: not applicable
- OLS: ordinary least squares
- SE: social enterprise

Appendix C. Data Tables Mathematica Policy Research
C.18
Table C.13. Hours Worked, Weeks Worked, and Pay in Social Enterprise
Hired by SE and Met Hours Requirement Total Hours Worked
Monthly Earnings (Logged + 1)
Sample Hired by SE Hired by SE Hired by SE
Estimation Method Linear Probability
Model OLS OLS Dependent Variable Mean 0.828 408.2 775.98 (level) Observations 524 513 514
Barriers to Employment Employment History Not Employed Last Week 0.015 3.305 0.240
(0.071) (64.903) (0.183) Not Employed Last Year -0.023 52.572 0.101
(0.055) (47.368) (0.130) Ever Employed 0.024 35.936 0.093
(0.044) (41.020) (0.131) Reasons Not Working, If Not
Employed (all that apply)
Discouraged 0.020 13.046 -0.318** (0.042) (39.210) (0.121) Lack of qualifications -0.001 13.439 0.053 (0.047) (38.562) (0.117) Cannot find a desirable job -0.061 -107.768** -0.175 (0.048) (37.117) (0.111) Criminal history/record 0.029 52.951 0.014 (0.050) (51.447) (0.133) Health limitations or substance
abuse 0.069 43.435 -0.019
(0.070) (56.667) (0.163) Lack of transportation -0.058 35.810 0.096 (0.074) (54.823) (0.145) Other 0.006 46.015 0.078
(0.053) (50.459) (0.124) Housing
Literally Homeless in Past Year -0.072 -81.692** -0.088 (0.044) (38.575) (0.102)
Used Own Home Only for Housing in Past Year
0.064 77.339 0.114 (0.051) (49.218) (0.160)
Criminal Activity Ever Arrested -0.005 -53.864 0.219 (0.072) (61.711) (0.181) Ever Convicted and Sentenced to
Jail or Prison 0.098 45.561 0.125
(0.061) (48.758) (0.136) Health and Substance Abuse Health Issue Limiting Work -0.039 -17.950 -0.241
(0.068) (54.523) (0.154) Mental Health Battery Index -0.044* -6.962 0.031
(0.025) (19.205) (0.054) Substance Abuse Issues in Past
Year -0.002 -47.581 -0.060 (0.047) (40.837) (0.113)
Education (high school diploma) No High School Diploma 0.002 -36.600 -0.071 (0.042) (40.488) (0.119) Some College or More -0.014 -34.742 -0.118 (0.044) (41.663) (0.115)
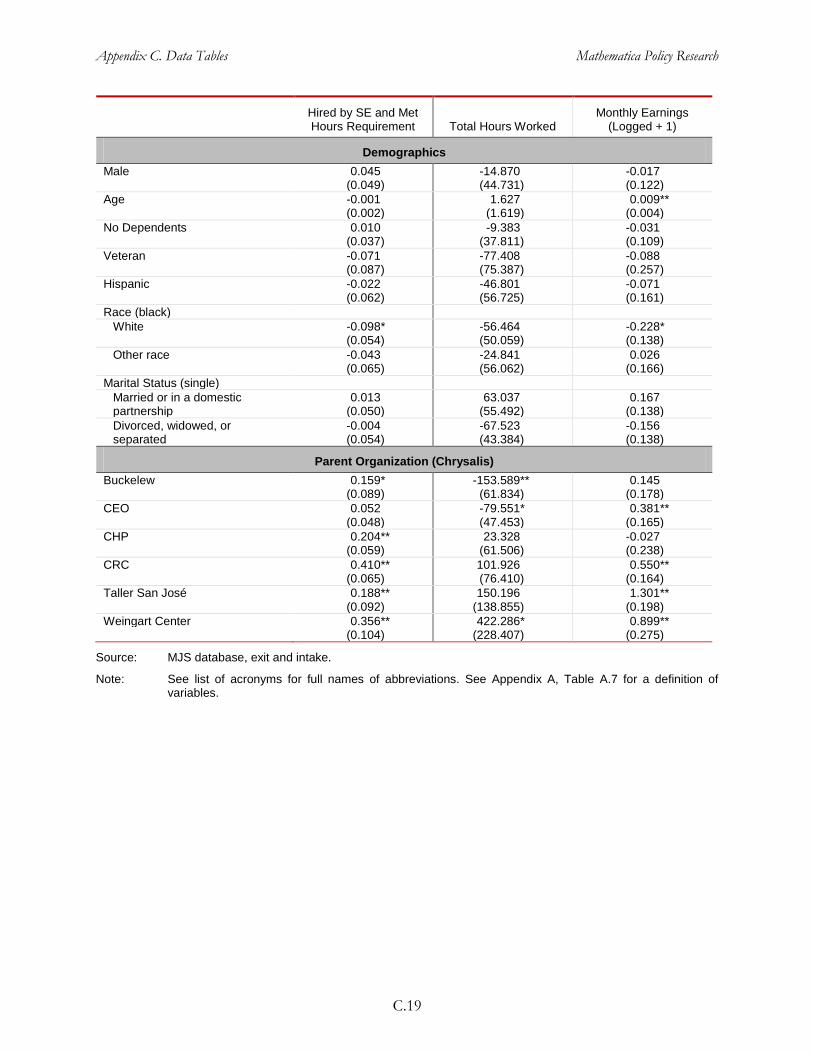
Appendix C. Data Tables Mathematica Policy Research
C.19
Hired by SE and Met Hours Requirement Total Hours Worked
Monthly Earnings (Logged + 1)
Demographics Male 0.045 -14.870 -0.017 (0.049) (44.731) (0.122) Age -0.001 1.627 0.009** (0.002) (1.619) (0.004) No Dependents 0.010 -9.383 -0.031 (0.037) (37.811) (0.109) Veteran -0.071 -77.408 -0.088 (0.087) (75.387) (0.257) Hispanic -0.022 -46.801 -0.071 (0.062) (56.725) (0.161) Race (black)
White -0.098* -56.464 -0.228* (0.054) (50.059) (0.138) Other race -0.043 -24.841 0.026
(0.065) (56.062) (0.166) Marital Status (single)
Married or in a domestic partnership
0.013 63.037 0.167 (0.050) (55.492) (0.138)
Divorced, widowed, or separated
-0.004 -67.523 -0.156 (0.054) (43.384) (0.138)
Parent Organization (Chrysalis) Buckelew 0.159* -153.589** 0.145 (0.089) (61.834) (0.178) CEO 0.052 -79.551* 0.381** (0.048) (47.453) (0.165) CHP 0.204** 23.328 -0.027 (0.059) (61.506) (0.238) CRC 0.410** 101.926 0.550** (0.065) (76.410) (0.164) Taller San José 0.188** 150.196 1.301** (0.092) (138.855) (0.198) Weingart Center 0.356** 422.286* 0.899** (0.104) (228.407) (0.275)
Source: MJS database, exit and intake.
Note: See list of acronyms for full names of abbreviations. See Appendix A, Table A.7 for a definition of variables.
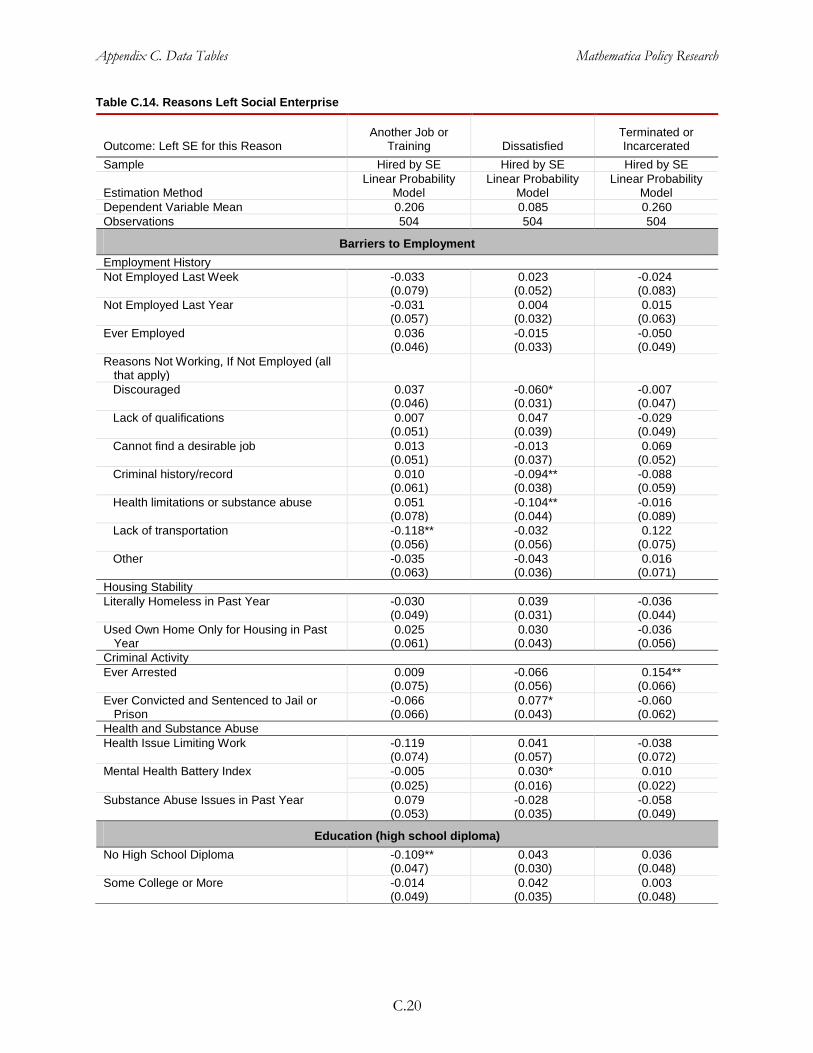
Appendix C. Data Tables Mathematica Policy Research
C.20
Table C.14. Reasons Left Social Enterprise
Another Job or Training Dissatisfied
Terminated or Incarcerated Outcome: Left SE for this Reason
Sample Hired by SE Hired by SE Hired by SE
Estimation Method Linear Probability
Model Linear Probability
Model Linear Probability
Model Dependent Variable Mean 0.206 0.085 0.260 Observations 504 504 504
Barriers to Employment Employment History Not Employed Last Week -0.033 0.023 -0.024
(0.079) (0.052) (0.083) Not Employed Last Year -0.031 0.004 0.015
(0.057) (0.032) (0.063) Ever Employed 0.036 -0.015 -0.050
(0.046) (0.033) (0.049) Reasons Not Working, If Not Employed (all
that apply)
Discouraged 0.037 -0.060* -0.007 (0.046) (0.031) (0.047) Lack of qualifications 0.007 0.047 -0.029 (0.051) (0.039) (0.049) Cannot find a desirable job 0.013 -0.013 0.069 (0.051) (0.037) (0.052) Criminal history/record 0.010 -0.094** -0.088 (0.061) (0.038) (0.059) Health limitations or substance abuse 0.051 -0.104** -0.016
(0.078) (0.044) (0.089) Lack of transportation -0.118** -0.032 0.122 (0.056) (0.056) (0.075) Other -0.035 -0.043 0.016
(0.063) (0.036) (0.071) Housing Stability Literally Homeless in Past Year -0.030 0.039 -0.036
(0.049) (0.031) (0.044) Used Own Home Only for Housing in Past
Year 0.025 0.030 -0.036
(0.061) (0.043) (0.056) Criminal Activity Ever Arrested 0.009 -0.066 0.154** (0.075) (0.056) (0.066) Ever Convicted and Sentenced to Jail or
Prison -0.066 0.077* -0.060 (0.066) (0.043) (0.062)
Health and Substance Abuse Health Issue Limiting Work -0.119 0.041 -0.038
(0.074) (0.057) (0.072) Mental Health Battery Index -0.005 0.030* 0.010
(0.025) (0.016) (0.022) Substance Abuse Issues in Past Year 0.079 -0.028 -0.058
(0.053) (0.035) (0.049)
Education (high school diploma) No High School Diploma -0.109** 0.043 0.036 (0.047) (0.030) (0.048) Some College or More -0.014 0.042 0.003 (0.049) (0.035) (0.048)
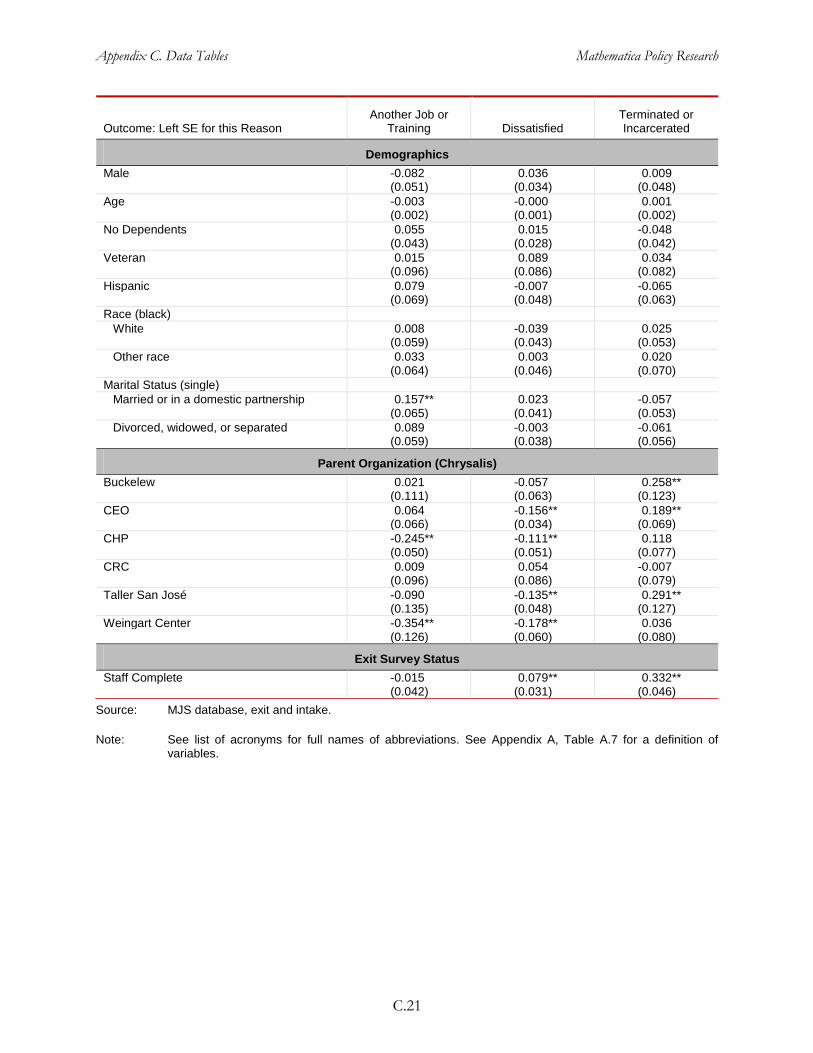
Appendix C. Data Tables Mathematica Policy Research
C.21
Another Job or
Training Dissatisfied Terminated or Incarcerated Outcome: Left SE for this Reason
Demographics Male -0.082 0.036 0.009 (0.051) (0.034) (0.048) Age -0.003 -0.000 0.001 (0.002) (0.001) (0.002) No Dependents 0.055 0.015 -0.048 (0.043) (0.028) (0.042) Veteran 0.015 0.089 0.034 (0.096) (0.086) (0.082) Hispanic 0.079 -0.007 -0.065 (0.069) (0.048) (0.063) Race (black)
White 0.008 -0.039 0.025 (0.059) (0.043) (0.053) Other race 0.033 0.003 0.020
(0.064) (0.046) (0.070) Marital Status (single)
Married or in a domestic partnership 0.157** 0.023 -0.057 (0.065) (0.041) (0.053)
Divorced, widowed, or separated 0.089 -0.003 -0.061 (0.059) (0.038) (0.056)
Parent Organization (Chrysalis) Buckelew 0.021 -0.057 0.258** (0.111) (0.063) (0.123) CEO 0.064 -0.156** 0.189** (0.066) (0.034) (0.069) CHP -0.245** -0.111** 0.118 (0.050) (0.051) (0.077) CRC 0.009 0.054 -0.007 (0.096) (0.086) (0.079) Taller San José -0.090 -0.135** 0.291** (0.135) (0.048) (0.127) Weingart Center -0.354** -0.178** 0.036 (0.126) (0.060) (0.080)
Exit Survey Status Staff Complete -0.015 0.079** 0.332** (0.042) (0.031) (0.046)
Source: MJS database, exit and intake.
Note: See list of acronyms for full names of abbreviations. See Appendix A, Table A.7 for a definition of variables.

Appendix C. Data Tables Mathematica Policy Research
C.22
Table C.15. Satisfaction with Social Enterprise Employment
Overall Satisfaction
Index Satisfied with Type of Work
Satisfied with Salary
Satisfied with Benefits
Satisfied with Hours of
Work Sample
Hired by SE (and exit)
Hired by SE (and exit)
Hired by SE (and exit)
Hired by SE (and exit)
Hired by SE (and exit)
Estimation Method OLS
Linear Probability
Model
Linear Probability
Model
Linear Probability
Model
Linear Probability
Model Dependent Variable Mean 0.000 0.897 0.739 0.421 0.723 Observations 316 334 334 329 330
Barriers to Employment Employment History Not Employed Last Week 0.012 -0.053 -0.089 0.069 -0.089
(0.213) (0.071) (0.106) (0.132) (0.100) Not Employed Last Year 0.096 0.013 0.067 0.045 -0.035
(0.165) (0.053) (0.095) (0.105) (0.095) Ever Employed -0.135 0.035 -0.020 -0.187** -0.048
(0.147) (0.046) (0.067) (0.074) (0.063) Reasons Not Working, If Not
Employed (all that apply)
Discouraged -0.029 0.045 -0.015 0.022 0.044 (0.124) (0.041) (0.063) (0.073) (0.063) Lack of qualifications -0.063 -0.058 -0.041 -0.090 0.107* (0.167) (0.054) (0.073) (0.080) (0.062) Cannot find a desirable job -0.121 -0.004 0.135* -0.026 -0.021 (0.185) (0.055) (0.072) (0.081) (0.074) Criminal history/record 0.031 0.045 -0.110 -0.149 0.055 (0.166) (0.053) (0.085) (0.097) (0.082) Health limitations or substance
abuse -0.195 -0.016 -0.164 -0.069 -0.053 (0.243) (0.092) (0.118) (0.116) (0.098)
Lack of transportation -0.124 0.051 -0.103 0.082 -0.287** (0.224) (0.066) (0.113) (0.133) (0.112) Other 0.161 0.001 0.137* -0.110 -0.032
(0.156) (0.058) (0.080) (0.106) (0.091) Housing Literally Homeless in Past Year 0.176 0.009 0.081 0.042 0.088
(0.142) (0.046) (0.063) (0.074) (0.060) Used Own Home Only for
Housing in Past Year 0.025 0.020 -0.028 -0.176** 0.042
(0.159) (0.055) (0.077) (0.079) (0.071) Criminal Activity Ever Arrested 0.231 -0.003 0.116 0.117 0.150 (0.218) (0.084) (0.105) (0.106) (0.097) Ever Convicted and Sentenced to
Jail or Prison -0.066 0.038 -0.022 -0.046 -0.173** (0.157) (0.059) (0.083) (0.094) (0.078)
Health and Substance Abuse Health Issue Limiting Work 0.069 -0.046 -0.019 0.038 0.079
(0.234) (0.080) (0.096) (0.111) (0.095) Mental Health Battery Index -0.176** 0.002 -0.028 -0.018 -0.085**
(0.088) (0.023) (0.030) (0.034) (0.031) Substance Abuse Issues in Past
Year -0.034 0.043 0.027 -0.053 0.042 (0.188) (0.048) (0.075) (0.085) (0.075)
Education (high school diploma) No High School Diploma 0.275* 0.018 -0.015 0.156** 0.087 (0.142) (0.046) (0.066) (0.078) (0.063) Some College or More 0.146 0.014 -0.032 0.117 -0.008 (0.156) (0.048) (0.064) (0.074) (0.064)
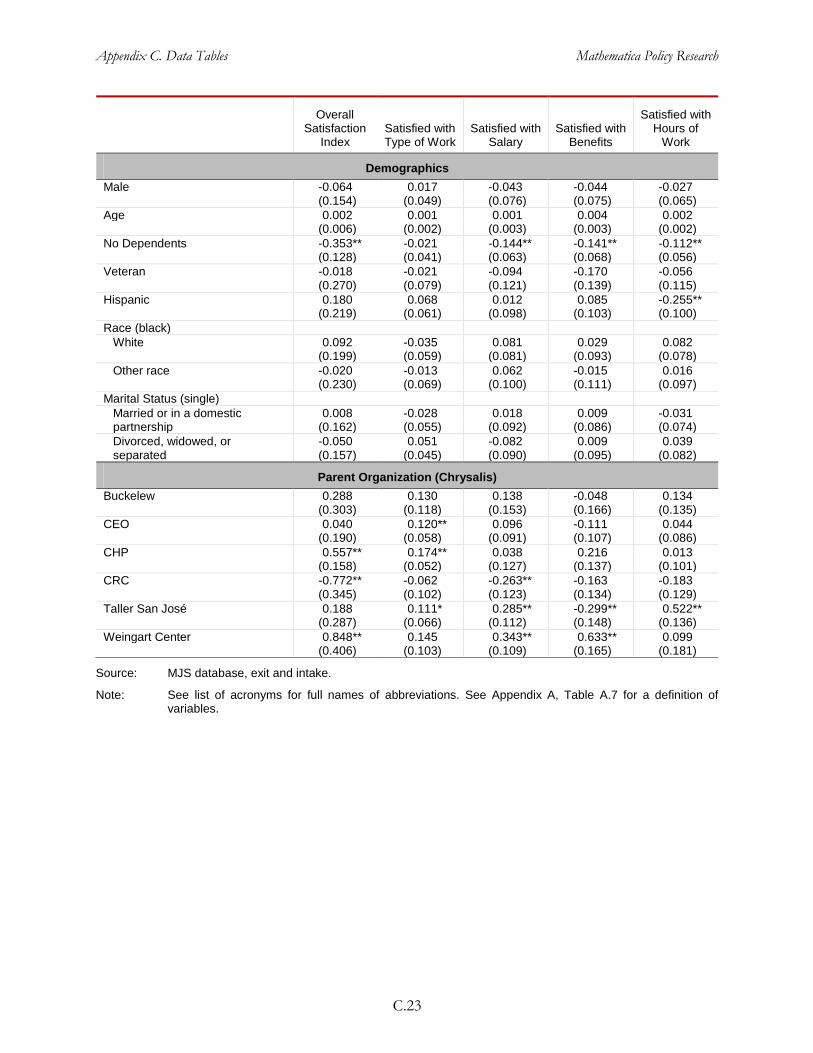
Appendix C. Data Tables Mathematica Policy Research
C.23
Overall
Satisfaction Index
Satisfied with Type of Work
Satisfied with Salary
Satisfied with Benefits
Satisfied with Hours of
Work Demographics Male -0.064 0.017 -0.043 -0.044 -0.027 (0.154) (0.049) (0.076) (0.075) (0.065) Age 0.002 0.001 0.001 0.004 0.002 (0.006) (0.002) (0.003) (0.003) (0.002) No Dependents -0.353** -0.021 -0.144** -0.141** -0.112** (0.128) (0.041) (0.063) (0.068) (0.056) Veteran -0.018 -0.021 -0.094 -0.170 -0.056 (0.270) (0.079) (0.121) (0.139) (0.115) Hispanic 0.180 0.068 0.012 0.085 -0.255** (0.219) (0.061) (0.098) (0.103) (0.100) Race (black)
White 0.092 -0.035 0.081 0.029 0.082 (0.199) (0.059) (0.081) (0.093) (0.078) Other race -0.020 -0.013 0.062 -0.015 0.016
(0.230) (0.069) (0.100) (0.111) (0.097) Marital Status (single)
Married or in a domestic partnership
0.008 -0.028 0.018 0.009 -0.031 (0.162) (0.055) (0.092) (0.086) (0.074)
Divorced, widowed, or separated
-0.050 0.051 -0.082 0.009 0.039 (0.157) (0.045) (0.090) (0.095) (0.082)
Parent Organization (Chrysalis) Buckelew 0.288 0.130 0.138 -0.048 0.134 (0.303) (0.118) (0.153) (0.166) (0.135) CEO 0.040 0.120** 0.096 -0.111 0.044 (0.190) (0.058) (0.091) (0.107) (0.086) CHP 0.557** 0.174** 0.038 0.216 0.013 (0.158) (0.052) (0.127) (0.137) (0.101) CRC -0.772** -0.062 -0.263** -0.163 -0.183 (0.345) (0.102) (0.123) (0.134) (0.129) Taller San José 0.188 0.111* 0.285** -0.299** 0.522** (0.287) (0.066) (0.112) (0.148) (0.136) Weingart Center 0.848** 0.145 0.343** 0.633** 0.099 (0.406) (0.103) (0.109) (0.165) (0.181)
Source: MJS database, exit and intake.
Note: See list of acronyms for full names of abbreviations. See Appendix A, Table A.7 for a definition of variables.

Appendix C. Data Tables Mathematica Policy Research
C.24
Table C.16. Housing Outcomes
Literally Homeless for Most of Past Week
Used Own Home as Main Housing in Past Week
Sample Hired by SE (and exit) Hired by SE (and exit) Estimation Method Linear Probability Model Linear Probability Model Dependent Variable Mean 0.146 0.478 Observations 317 321
Barriers to Employment Past Housing Stability Literally Homeless in Year Before Hire 0.272** -0.035
(0.055) (0.073) Used Own Home Only for Housing in Year Before Hire 0.017 0.493**
(0.054) (0.079) Employment History Not Employed Last Week -0.106 0.181
(0.065) (0.126) Not Employed Last Year 0.158** -0.214**
(0.051) (0.100) Ever Employed 0.061 -0.057
(0.049) (0.074) Reasons Not Working, If Not Employed (all that apply)
Discouraged 0.006 0.099 (0.044) (0.073) Lack of qualifications 0.049 0.006 (0.050) (0.073) Cannot find a desirable job 0.018 -0.087 (0.050) (0.073) Criminal history/record 0.048 0.054 (0.062) (0.091) Health limitations or substance abuse 0.001 0.040
(0.078) (0.125) Lack of transportation -0.012 -0.040 (0.083) (0.143) Other 0.029 0.078
(0.062) (0.103) Criminal Activity Ever Arrested 0.005 0.070 (0.067) (0.110) Ever Convicted and Sentenced to Jail or Prison -0.100 -0.086
(0.064) (0.098) Health and Substance Abuse Health Issue Limiting Work -0.021 0.070
(0.067) (0.102) Mental Health Battery Index 0.001 0.021
(0.023) (0.031) Substance Abuse Issues in Past Year 0.021 0.114
(0.067) (0.091)
Education (high school diploma) No High School Diploma -0.051 -0.036 (0.042) (0.075) Some College or More 0.024 0.003 (0.049) (0.071)
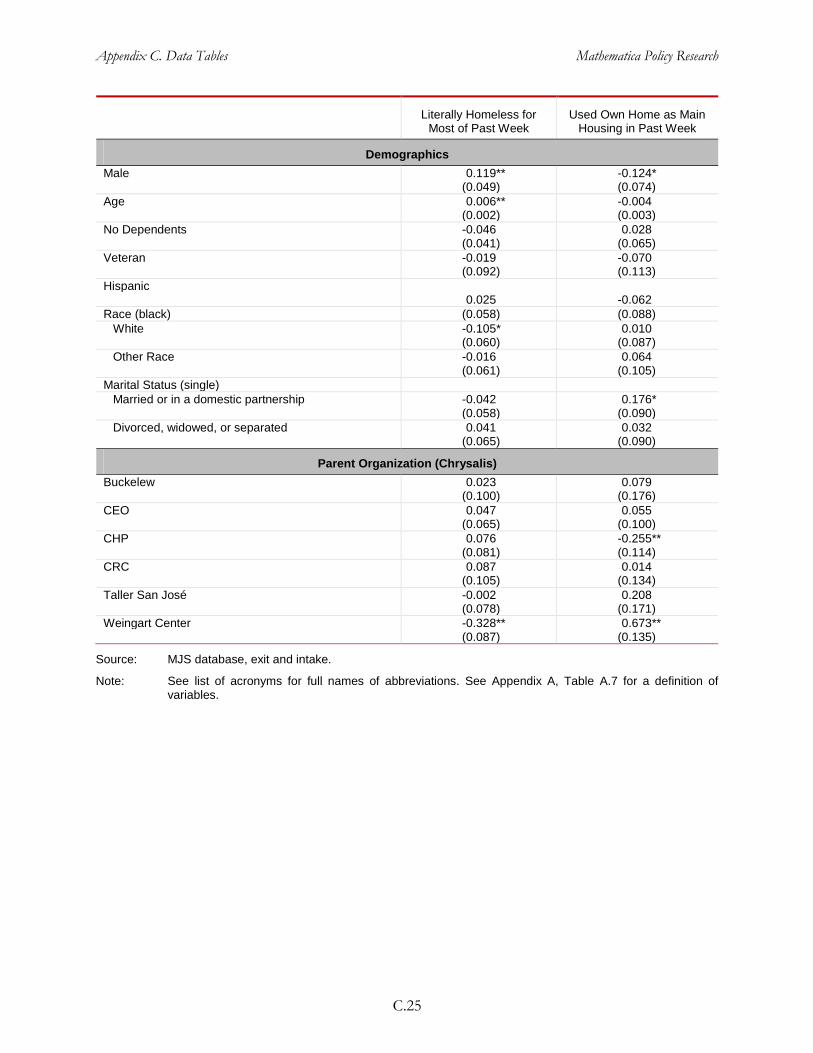
Appendix C. Data Tables Mathematica Policy Research
C.25
Literally Homeless for
Most of Past Week Used Own Home as Main
Housing in Past Week
Demographics Male 0.119** -0.124* (0.049) (0.074) Age 0.006** -0.004 (0.002) (0.003) No Dependents -0.046 0.028 (0.041) (0.065) Veteran -0.019 -0.070 (0.092) (0.113) Hispanic
0.025 -0.062 Race (black) (0.058) (0.088)
White -0.105* 0.010 (0.060) (0.087) Other Race -0.016 0.064 (0.061) (0.105)
Marital Status (single) Married or in a domestic partnership -0.042 0.176*
(0.058) (0.090) Divorced, widowed, or separated 0.041 0.032
(0.065) (0.090)
Parent Organization (Chrysalis) Buckelew 0.023 0.079 (0.100) (0.176) CEO 0.047 0.055 (0.065) (0.100) CHP 0.076 -0.255** (0.081) (0.114) CRC 0.087 0.014 (0.105) (0.134) Taller San José -0.002 0.208 (0.078) (0.171) Weingart Center -0.328** 0.673** (0.087) (0.135)
Source: MJS database, exit and intake.
Note: See list of acronyms for full names of abbreviations. See Appendix A, Table A.7 for a definition of variables.
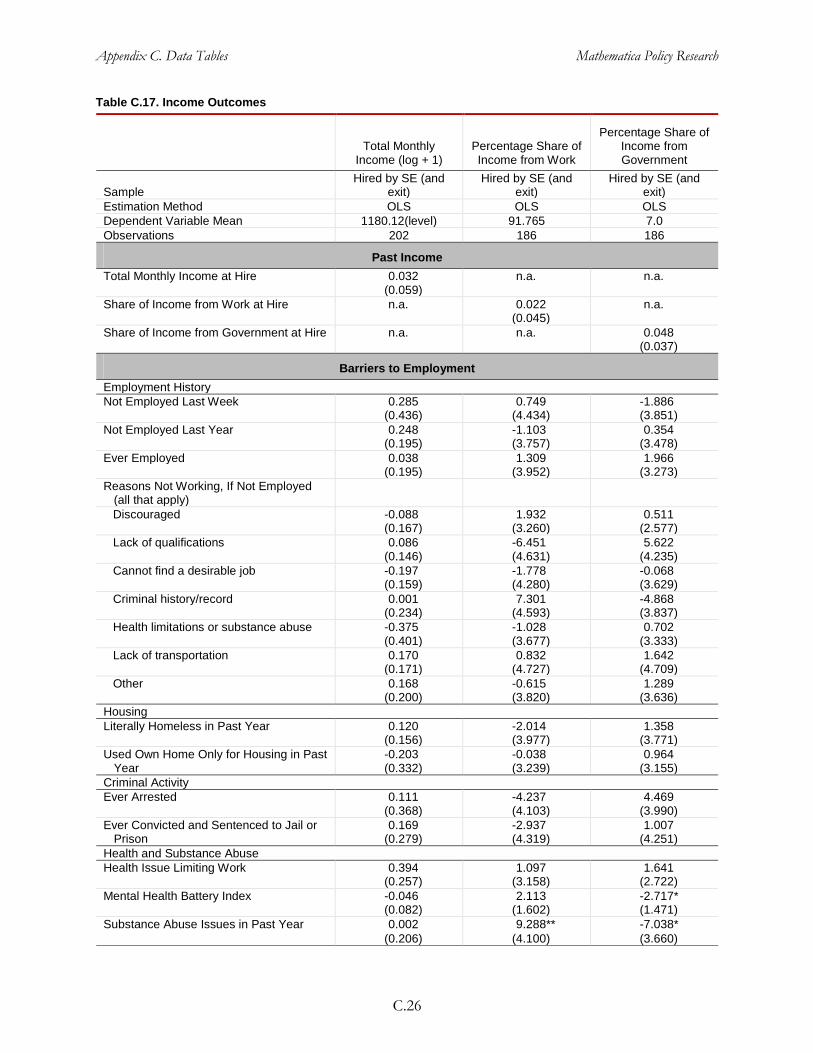
Appendix C. Data Tables Mathematica Policy Research
C.26
Table C.17. Income Outcomes
Total Monthly Income (log + 1)
Percentage Share of Income from Work
Percentage Share of Income from Government
Sample
Hired by SE (and exit)
Hired by SE (and exit)
Hired by SE (and exit)
Estimation Method OLS OLS OLS Dependent Variable Mean 1180.12(level) 91.765 7.0 Observations 202 186 186
Past Income Total Monthly Income at Hire 0.032 n.a. n.a.
(0.059) Share of Income from Work at Hire n.a. 0.022 n.a.
(0.045) Share of Income from Government at Hire n.a. n.a. 0.048
(0.037)
Barriers to Employment Employment History Not Employed Last Week 0.285 0.749 -1.886
(0.436) (4.434) (3.851) Not Employed Last Year 0.248 -1.103 0.354 (0.195) (3.757) (3.478) Ever Employed 0.038 1.309 1.966 (0.195) (3.952) (3.273) Reasons Not Working, If Not Employed
(all that apply)
Discouraged -0.088 1.932 0.511 (0.167) (3.260) (2.577) Lack of qualifications 0.086 -6.451 5.622 (0.146) (4.631) (4.235) Cannot find a desirable job -0.197 -1.778 -0.068 (0.159) (4.280) (3.629) Criminal history/record 0.001 7.301 -4.868 (0.234) (4.593) (3.837) Health limitations or substance abuse -0.375 -1.028 0.702
(0.401) (3.677) (3.333) Lack of transportation 0.170 0.832 1.642 (0.171) (4.727) (4.709) Other 0.168 -0.615 1.289 (0.200) (3.820) (3.636)
Housing Literally Homeless in Past Year 0.120 -2.014 1.358
(0.156) (3.977) (3.771) Used Own Home Only for Housing in Past
Year -0.203 -0.038 0.964 (0.332) (3.239) (3.155)
Criminal Activity Ever Arrested 0.111 -4.237 4.469 (0.368) (4.103) (3.990) Ever Convicted and Sentenced to Jail or
Prison 0.169 -2.937 1.007
(0.279) (4.319) (4.251) Health and Substance Abuse Health Issue Limiting Work 0.394 1.097 1.641
(0.257) (3.158) (2.722) Mental Health Battery Index -0.046 2.113 -2.717*
(0.082) (1.602) (1.471) Substance Abuse Issues in Past Year 0.002 9.288** -7.038*
(0.206) (4.100) (3.660)

Appendix C. Data Tables Mathematica Policy Research
C.27
Total Monthly Income (log + 1)
Percentage Share of Income from Work
Percentage Share of Income from Government
Education (high school diploma) No High School Diploma -0.232 -3.688 1.596 (0.181) (3.910) (2.958) Some College or More -0.142 -3.827 3.069 (0.231) (3.276) (2.889)
Demographics Male -0.466 2.215 -2.077 (0.327) (5.254) (5.169) Age 0.003 0.228* -0.164 (0.008) (0.122) (0.113) No Dependents -0.379** -4.913 3.286 (0.188) (3.067) (2.581) Veteran 0.197 0.988 -2.721 (0.242) (4.044) (3.622) Hispanic
-0.105 7.199* -6.546** Race (black) (0.264) (4.317) (2.928)
White 0.147 0.848 -1.230 (0.226) (3.790) (3.209) Other race 0.199 -0.186 -1.959 (0.262) (4.693) (2.844)
Marital Status (single)
Married or in a domestic partnership 0.129 1.795 -1.457
(0.288) (3.053) (2.908) Divorced, widowed, or separated 0.091 5.425 -3.938
(0.165) (3.537) (2.899)
Parent Organization (Chrysalis) Buckelew 0.270 -25.853** 23.704** (0.322) (8.721) (9.657) CEO 0.487** 5.075 -6.321* (0.178) (3.879) (3.763) CHP -0.361 8.923 -9.690 (0.769) (6.074) (5.877) CRC 0.217 -5.280 -1.095 (0.282) (6.377) (4.485) Taller San José 0.853** 7.286 -3.532 (0.377) (5.658) (4.618) Weingart Center 0.768** 4.961 -2.768 (0.334) (6.500) (6.619)
Source: MJS database, exit and intake.
Notes: See list of acronyms for full names of abbreviations. See Appendix A, Table A.7 for a definition of variables.

Appendix C. Data Tables Mathematica Policy Research
C.28
Table C.18. Criminal Activity, Substance Abuse, and Mental Health Outcomes
Arrested After Began SE
Substance Abuse Issues After Began
SE Mental Health Index Sample
Hired by SE (and exit)
Hired by SE (and exit)
Hired by SE (and exit)
Estimation Method Linear Probability
Model Linear Probability
Model OLS Dependent Variable Mean 0.037 0.142 -0.094 Observations 334 327 334
Lagged Value of Outcome Ever Arrested 0.008 n.a. n.a.
(0.033) Substance Abuse Issues in Past Year n.a. 0.271** n.a.
(0.074) Mental Health Battery Index at Hire n.a. n.a. 0.372**
(0.091)
Barriers to Employment Employment History Not Employed Last Week 0.083** -0.118 0.179
(0.041) (0.083) (0.248) Not Employed Last Year -0.039 0.007 0.005 (0.044) (0.055) (0.170) Ever Employed -0.060* 0.017 -0.051 (0.033) (0.051) (0.175) Reasons Not Working, If Not Employed (all
that apply)
Discouraged 0.004 0.073 -0.166 (0.032) (0.049) (0.135) Lack of qualifications -0.075** -0.018 -0.171 (0.026) (0.052) (0.203) Cannot find a desirable job 0.026 0.052 -0.033 (0.031) (0.050) (0.158) Criminal history/record -0.025 0.123 -0.388** (0.041) (0.087) (0.161) Health limitations or substance abuse 0.010 -0.000 0.662
(0.045) (0.095) (0.498) Lack of transportation 0.055 0.068 -0.113 (0.048) (0.072) (0.223) Other -0.056** 0.110 -0.364*
(0.027) (0.072) (0.201) Housing Literally Homeless in Past Year 0.005 0.161** -0.218
(0.028) (0.055) (0.167) Used Own Home Only for Housing in Past
Year -0.030 -0.035 -0.125 (0.022) (0.041) (0.152)
Criminal Activity Ever Arrested n.a. 0.097** 0.417
(0.049) (0.274)
Ever Convicted and Sentenced to Jail or Prison
0.042 0.035 -0.178 (0.031) (0.055) (0.266)
Health and Substance Abuse Health Issue Limiting Work 0.041 0.039 0.181
(0.036) (0.080) (0.300) Mental Health Battery Index -0.001 -0.048** n.a. (0.011) (0.021) Substance Abuse Issues in Past Year 0.019 n.a. 0.178
(0.038)
(0.198)
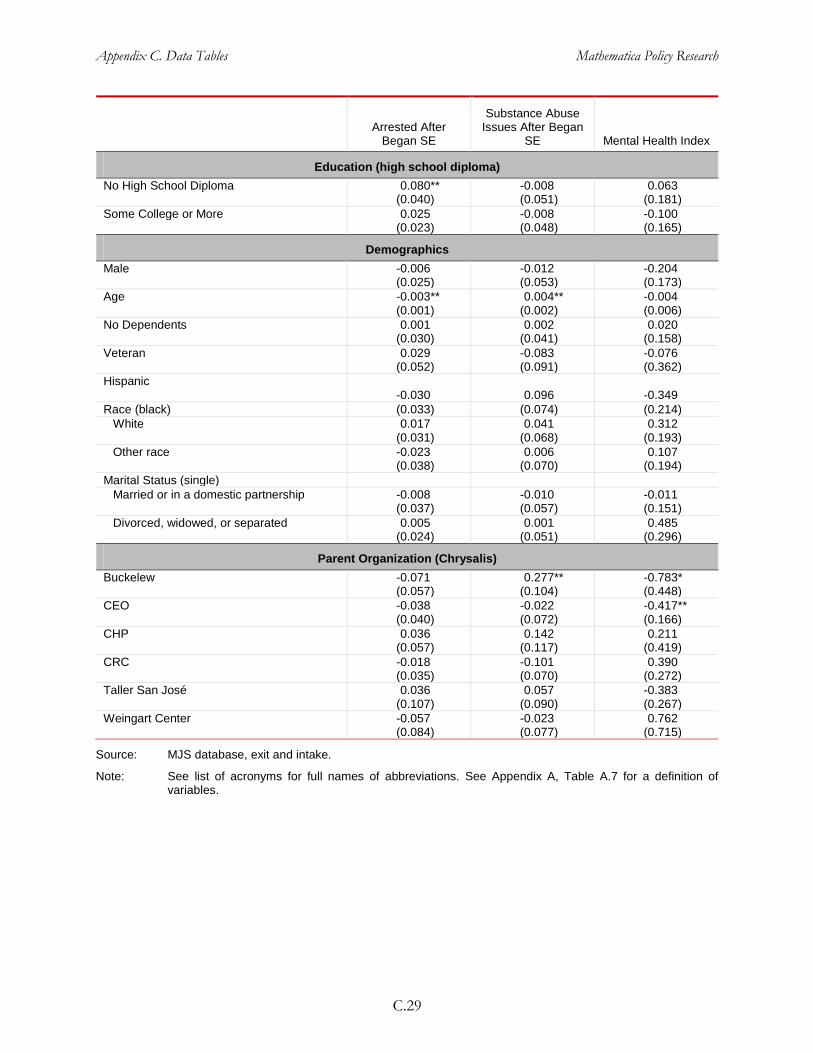
Appendix C. Data Tables Mathematica Policy Research
C.29
Arrested After Began SE
Substance Abuse Issues After Began
SE Mental Health Index
Education (high school diploma) No High School Diploma 0.080** -0.008 0.063 (0.040) (0.051) (0.181) Some College or More 0.025 -0.008 -0.100 (0.023) (0.048) (0.165)
Demographics Male -0.006 -0.012 -0.204 (0.025) (0.053) (0.173) Age -0.003** 0.004** -0.004 (0.001) (0.002) (0.006) No Dependents 0.001 0.002 0.020 (0.030) (0.041) (0.158) Veteran 0.029 -0.083 -0.076 (0.052) (0.091) (0.362) Hispanic
-0.030 0.096 -0.349 Race (black) (0.033) (0.074) (0.214)
White 0.017 0.041 0.312 (0.031) (0.068) (0.193) Other race -0.023 0.006 0.107 (0.038) (0.070) (0.194)
Marital Status (single)
Married or in a domestic partnership -0.008 -0.010 -0.011
(0.037) (0.057) (0.151) Divorced, widowed, or separated 0.005 0.001 0.485
(0.024) (0.051) (0.296)
Parent Organization (Chrysalis) Buckelew -0.071 0.277** -0.783* (0.057) (0.104) (0.448) CEO -0.038 -0.022 -0.417** (0.040) (0.072) (0.166) CHP 0.036 0.142 0.211 (0.057) (0.117) (0.419) CRC -0.018 -0.101 0.390 (0.035) (0.070) (0.272) Taller San José 0.036 0.057 -0.383 (0.107) (0.090) (0.267) Weingart Center -0.057 -0.023 0.762 (0.084) (0.077) (0.715)
Source: MJS database, exit and intake.
Note: See list of acronyms for full names of abbreviations. See Appendix A, Table A.7 for a definition of variables.
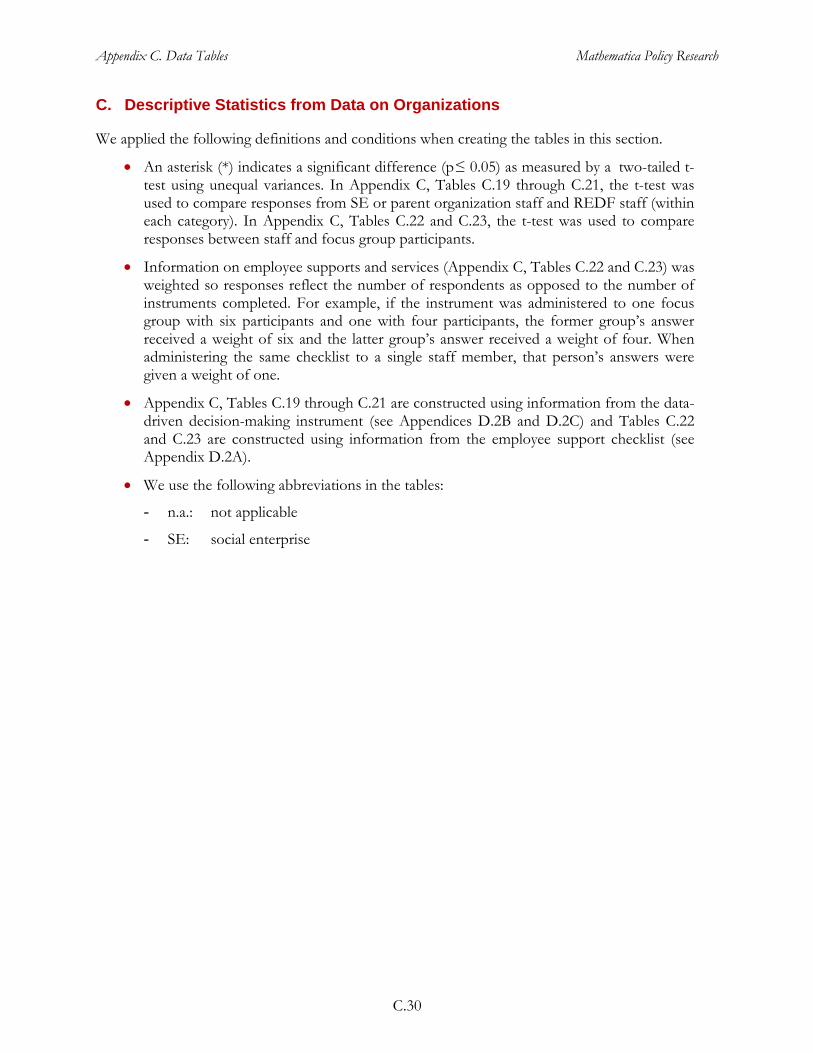
Appendix C. Data Tables Mathematica Policy Research
C.30
C. Descriptive Statistics from Data on Organizations
We applied the following definitions and conditions when creating the tables in this section.
• An asterisk (*) indicates a significant difference (p ≤ 0.05) as measured by a two-tailed t-test using unequal variances. In Appendix C, Tables C.19 through C.21, the t-test was used to compare responses from SE or parent organization staff and REDF staff (within each category). In Appendix C, Tables C.22 and C.23, the t-test was used to compare responses between staff and focus group participants.
• Information on employee supports and services (Appendix C, Tables C.22 and C.23) was weighted so responses reflect the number of respondents as opposed to the number of instruments completed. For example, if the instrument was administered to one focus group with six participants and one with four participants, the former group’s answer received a weight of six and the latter group’s answer received a weight of four. When administering the same checklist to a single staff member, that person’s answers were given a weight of one.
• Appendix C, Tables C.19 through C.21 are constructed using information from the data-driven decision-making instrument (see Appendices D.2B and D.2C) and Tables C.22 and C.23 are constructed using information from the employee support checklist (see Appendix D.2A).
• We use the following abbreviations in the tables:
- n.a.: not applicable
- SE: social enterprise

Appendix C. Data Tables Mathematica Policy Research
C.31
Table C.19. Data-Driven Decision Making, Collects and Assesses (percentages unless otherwise reported)
Percentage Very Often or Often
Percentage Rarely or Very Rarely
Percentage Don't Know, n.a.
Organization/ SE REDF
Organization/ SE REDF
Organization/SE REDF
Number of Respondents 36 32 36 32 36 32
Before an employee starts work at SE, the organization COLLECTS data on his or her: Work Knowledge, Skills, and Abilities 86.1 53.1* 5.6 9.4 2.8 34.4* Need for Supports Necessary for Work (for
example, transportation or clothing) 83.3 46.9* 11.1 3.1 0.0 40.6* Need for Supports Outside of Work (for
example, counseling or health care) 66.7 43.8 19.4 3.1* 5.6 40.6*
While working in the SE, the organization COLLECTS data on an employee’s: Job Performance (including attendance
and reprimands or conflicts with customers, other employees, or managers) 91.7 53.1* 0.0 3.1 5.6 28.1*
Work Assignments (for example, type of work or hours or days worked) 86.1 59.4 2.8 3.1 8.3 34.4
Job Development or Job Placement Services Received 88.9 34.4* 0.0 15.6* 5.6 31.3*
Work or Life Stability Supports Received (for example, transportation, child care, housing, or substance counseling) 69.4 18.8* 8.3 18.8 5.6 34.4*
After an employee leaves the SE, the organization COLLECTS data on his or her: Life Circumstances (for example, whether
the employee has stable housing) 55.6 15.6* 22.2 31.3 2.8 37.5* Employment Status 77.8 37.5* 8.3 21.9 0.0 21.9*
The organization COLLECTS data on: Demand for New Types of Businesses or
Expansion of Current Business(es) 52.8 12.5* 11.1 21.9 13.9 56.3* Customer Satisfaction 63.9 28.1* 11.1 6.3 5.6 56.3*
The organization ASSESSES data on:
Employees’ Skills and Supports Needs Before They Start in the SE 72.2 34.4* 13.9 9.4 5.6 46.9*
Employees’ Job Performance While They Work in the Social Enterprise 80.6 37.5* 2.8 9.4 11.1 28.1
Work and Life Stability Support Services Used While Employees Are Employed 66.7 12.5* 13.9 18.8 11.1 40.6*
Development of Employees’ Skills While Employed 69.4 28.1* 5.6 28.1* 16.7 21.9
Employees’ Employment After They Leave the SE 77.8 31.3* 5.6 9.4 5.6 34.4*
Demand for New Types of Businesses or Expansion of Current Business(es) 44.4 15.6* 16.7 15.6 19.4 56.3*
Customer Satisfaction 61.1 25.0* 2.8 12.5 13.9 56.3*
Source: Data-driven decision-making instrument.
Note: The percentages are based on responses on a 5-point scale in which 1 = very often, 2 = often, 3 = neither often nor rarely, 4 = rarely, and 5 = very rarely. Respondents could also select don’t know. The percentage of answers stating neither often nor rarely is not reported in the table. Staff were asked to report on data collection and assessment in the parent organization as a whole, including its SE(s).
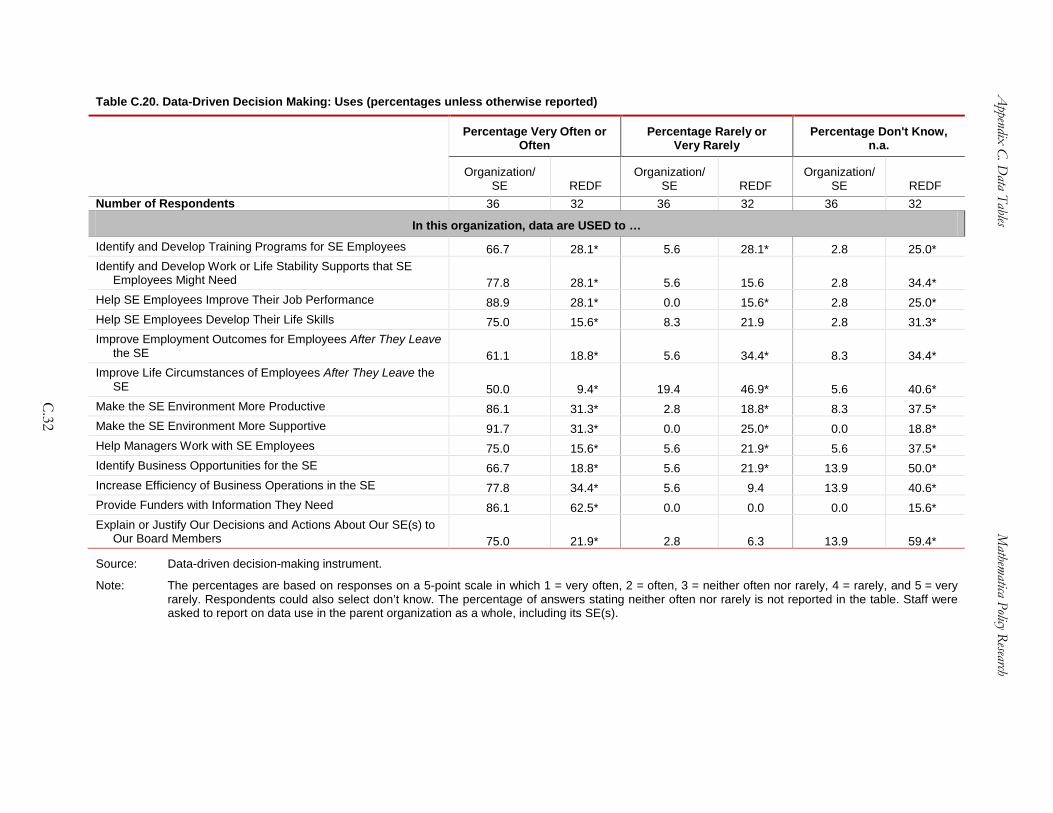
Appendix C. D
ata Tables Mathematica Policy Research
C.32
Table C.20. Data-Driven Decision Making: Uses (percentages unless otherwise reported)
Percentage Very Often or Often
Percentage Rarely or Very Rarely
Percentage Don't Know, n.a.
Organization/ SE REDF
Organization/ SE REDF
Organization/SE REDF
Number of Respondents 36 32 36 32 36 32
In this organization, data are USED to …
Identify and Develop Training Programs for SE Employees 66.7 28.1* 5.6 28.1* 2.8 25.0* Identify and Develop Work or Life Stability Supports that SE
Employees Might Need 77.8 28.1* 5.6 15.6 2.8 34.4* Help SE Employees Improve Their Job Performance 88.9 28.1* 0.0 15.6* 2.8 25.0* Help SE Employees Develop Their Life Skills 75.0 15.6* 8.3 21.9 2.8 31.3* Improve Employment Outcomes for Employees After They Leave
the SE 61.1 18.8* 5.6 34.4* 8.3 34.4* Improve Life Circumstances of Employees After They Leave the
SE 50.0 9.4* 19.4 46.9* 5.6 40.6* Make the SE Environment More Productive 86.1 31.3* 2.8 18.8* 8.3 37.5* Make the SE Environment More Supportive 91.7 31.3* 0.0 25.0* 0.0 18.8* Help Managers Work with SE Employees 75.0 15.6* 5.6 21.9* 5.6 37.5* Identify Business Opportunities for the SE 66.7 18.8* 5.6 21.9* 13.9 50.0* Increase Efficiency of Business Operations in the SE 77.8 34.4* 5.6 9.4 13.9 40.6* Provide Funders with Information They Need 86.1 62.5* 0.0 0.0 0.0 15.6* Explain or Justify Our Decisions and Actions About Our SE(s) to
Our Board Members 75.0 21.9* 2.8 6.3 13.9 59.4*
Source: Data-driven decision-making instrument.
Note: The percentages are based on responses on a 5-point scale in which 1 = very often, 2 = often, 3 = neither often nor rarely, 4 = rarely, and 5 = very rarely. Respondents could also select don’t know. The percentage of answers stating neither often nor rarely is not reported in the table. Staff were asked to report on data use in the parent organization as a whole, including its SE(s).

Appendix C. D
ata Tables Mathematica Policy Research
C.33
Table C.21. Data-Driven Decision Making: Resources and Beliefs (percentages unless otherwise reported)
Percentage Strongly Agree or Agree
Percentage Disagree or Strongly Disagree
Percentage Don't Know, n.a.
Organization/ SE REDF
Organization/ SE REDF
Organization/ SE REDF
Number of Respondents 36 32 36 32 36 32
In this Organization … There is an efficient data collection system in place 44.4 21.9* 33.3 43.8 0.0 25.0* There are sufficient resources to collect data 50.0 28.1 36.1 40.6 0.0 28.1* There are staff with expertise in data analysis 61.1 28.1* 25.0 25.0 0.0 28.1* Staff translate discussions of data into actions 69.4 37.5* 19.4 15.6 5.6 31.3* There is a focus on quality products and customer
satisfaction 94.4 34.4* 0.0 3.1 0.0 46.9* There is a focus on developing SE employees into
productive employees 97.2 37.5* 0.0 15.6* 0.0 21.9*
I BELIEVE that Using Data … To make decisions is part of the culture of my organization 72.2 31.3* 19.4 21.9 0.0 21.9* Can improve the services organizations provide to
employees 100.0 40.6* 0.0 3.1 0.0 31.3* Takes away from the time spent helping SE employees 11.1 12.5 66.7 40.6* 2.8 37.5* Builds an understanding of how an SE operates 86.1 43.8* 0.0 15.6 0.0 28.1* Makes me uncomfortable 5.6 18.8 83.3 40.6* 0.0 25.0* Benefits the work my organization does 100.0 40.6* 0.0 6.3 0.0 34.4* Runs counter to my experience of how to help SE
employees 5.6 0.0 80.6 59.4 2.8 28.1* Is not done well in my organization 30.6 31.3 58.3 25.0* 2.8 25.0* Should be required by funders to support their funding
decisions 72.2 12.5* 8.3 6.3 0.0 68.8*
Source: Data-driven decision-making instrument.
Note: The percentages are based on responses on a 5-point scale in which 1 = strongly agree, 2 = agree, 3 = neither agree nor disagree, 4 = disagree, and 5 = strongly disagree. Respondents could also select don’t know. The percentage of answers stating neither agree nor disagree is not reported in the table. For the top panel, staff were asked to report on the parent organization as a whole, including its SE(s). In the bottom panel, staff report on their own organization and beliefs.

Appendix C. Data Tables Mathematica Policy Research
C.34
Table C.22. Employee Services and Supports Before and During Employment (percentages unless otherwise reported)
Percentage Report Provide/Conduct
Percentage Sometimes
Provide/Conduct
Percentage Report Do Not
Provide/Conduct
Staff Focus Group Staff
Focus Group Staff
Focus Group
Number of Respondents 54 65 54 65 54 65 Number of Interviews/Focus Groups 49 12 49 12 49 12
Assessments Conducted of: Job History 77.8 92.3* 1.9 7.7 5.6 0.0 Level of Education 79.6 83.1 0.0 7.7* 7.4 0.0* Work Supports Needs Assessment 90.7 70.8* 1.9 29.2* 1.9 0.0 Housing Assessment 85.2 43.1* 0.0 47.7* 11.1 0.0* Health Care Needs Assessment 59.3 29.2* 3.7 43.1* 16.7 18.5 Other Life Circumstances Needs Assessment 59.3 40.0* 9.3 47.7* 20.4 7.7
On-Site or Referral to Education and Training in: Soft Skills Training 88.9 73.8* 1.9 18.5* 1.9 0.0 Adult Basic Education or GED Preparation 55.6 49.2 5.6 27.7* 24.1 18.5 English Language Proficiency Supports 31.5 0.0* 11.1 7.7 38.9 49.2 Vocational or Job-Specific Skills Training 90.7 81.5 3.7 0.0 1.9 18.5* Computer Literacy or Skills and Technology
Training 61.1 49.2 5.6 33.8* 20.4 7.7
On-Site or Referral to Work Supports for: Housing or Rental Assistance 66.7 47.7* 5.6 10.8 14.8 41.5* Transportation Assistance 77.8 61.5 9.3 21.5 9.3 7.7 Assistance Getting a Phone/Phone Services 38.9 29.2 7.4 7.7 33.3 46.2 Child Care Assistance 33.3 21.5 1.9 7.7 42.6 43.1 Work Clothing Assistance 92.6 89.2 1.9 10.8 3.7 0.0 Assistance with Immigration Status 22.2 0.0* 5.6 0.0 42.6 52.3 Assistance with Obtaining Legal Services 68.5 23.1* 5.6 21.5* 14.8 38.5* Assistance Correcting Errors in Background
Checks or Legal Records 48.1 32.3 3.7 20.0* 22.2 26.2 Assistance with Expunging a Criminal Record 50.0 43.1 3.7 16.9 24.1 18.5
On-Site or Referral to Life Stability Supports: Child Custody Assistance 35.2 16.9* 5.6 0.0 33.3 53.8* Physical Health Services 59.3 60.0 1.9 10.8* 16.7 29.2 Assistance with a Physical or Learning
Disability 48.1 20.0* 0.0 7.7* 25.9 43.1* Mental Health Services 68.5 63.1 0.0 10.8* 16.7 26.2 Substance Abuse Counseling or Treatment 72.2 84.6 0.0 0.0 9.3 15.4 Domestic Abuse Protection 66.7 50.8 0.0 10.8* 14.8 26.2 Financial Education and Asset-Building 68.5 76.9 0.0 10.8* 18.5 7.7 Help with Setting up a Bank Account 70.4 64.6 5.6 10.8 20.4 7.7 Assistance with Legal Services 57.4 16.9* 3.7 10.8 18.5 55.4* Assistance with Food Stability or Food Security 59.3 46.2 1.9 10.8 24.1 30.8 Access to Public Benefits 50.0 52.3 9.3 10.8 27.8 32.3 Help with Tax Preparation 57.4 60.0 1.9 9.2 22.2 7.7 Help Plan to Avoid Relapse of Behavior 68.5 35.4* 0.0 4.6 14.8 18.5
Source: Checklist.
Note: Answers of don’t know and refusals to answer are not included in this table.

Appendix C. Data Tables Mathematica Policy Research
C.35
Table C.23. Employee Services and Supports Transitioning out of the Social Enterprise (percentages unless otherwise reported)
Type of Support
Percentage Report Provide/Conduct
Percentage Sometimes
Provide/Conduct
Percentage Report Do Not
Provide/Conduct
Staff Focus Group Staff
Focus Group Staff
Focus Group
Number of Respondents 54 65 54 65 54 65 Number of Independent Interviews 49 12 49 12 49 12
SE Employment Transition Supports Job Readiness Skills Training 92.6 95.4 1.9 4.6 3.7 0.0 Career Counseling or Job Coaching 90.7 84.6 3.7 0.0 3.7 0.0 Job Search Assistance 92.6 80.0* 3.7 0.0 3.7 4.6 Job Mentoring 88.9 66.2* 0.0 0.0 5.6 0.0 Job Development 85.2 89.2 3.7 0.0 9.3 0.0*
Post-SE Services Access to Employment Counselor or Other
Services Related to Employment 79.6 75.4 3.7 0.0 5.6 0.0 Access to Staff or Services that Support Life
Stability 70.4 50.8* 5.6 0.0 13.0 15.4 Support Groups 38.9 52.3 3.7 7.7 33.3 30.8
Source: Checklist.
Note: Answers of don’t know and refusals to answer are not included in this table.

This page has been left blank for double-sided copying.

APPENDIX D
DATA COLLECTION INSTRUMENTS

This page has been left blank for double-sided copying.

D.1. PARTICIPANTS

This page has been left blank for double-sided copying.

D.1A. INTAKE QUESTIONS

This page has been left blank for double-sided copying.
1
INTAKE QUESTIONS
INSTRUCTIONS TO INTAKE COUNSELOR. Please provide client’s name and their case ID number (if the organization has one), date of intake, your organization, your location or site, and your name. Please ask each client the questions listed in Section A and provide your insights about the client in Section B after the intake form is complete. If the client is referred to a REDF-supported social enterprise, make sure Section C is completed by the appropriate person.
Name of Client:
Participant ID Number: (Organization’s) Client ID Number:
Organization: Intake site:
Date: Name of Person Doing Intake:
A. CLIENT INFORMATION
A1. What is your gender?
MARK ONE ONLY 1 □ Male 2 □ Female 3 □ Transgender male to female 4 □ Transgender female to male 5 □ Other (Please specify) r □ Refused
A2. Are you Latino or Hispanic (of Cuban, Mexican, Puerto Rican, South or Central American, or other Spanish culture of origin)?
1 □ Yes 0 □ No r □ Refused
A3. What is your race (you may name more than one race)? MARK ALL THAT APPLY 1 □ American Indian or Alaskan Native (origins in any of the original peoples in North, Central, and South America, and who maintains tribal affiliation or community
attachment)
2 □ Asian (origins in any of the original peoples of the Far East, Southeast Asia, or the Indian subcontinent) 3 □ Black or African American (origins in any of the black racial groups of Africa) 4 □ Native Hawaiian or other Pacific Islander (origins in any of the original peoples of Hawaii, Guam, Samoa, or other Pacific Islands) 5 □ White (origins in any of the original peoples of Europe, the Middle East, or North Africa) 6 □ Other (Please specify)
r □ Refused
2
A4. What is your date of birth?
| | |/| | |/| | | | | Month Day Year
A5. What is your current marital status? Are you now…
MARK ONE ONLY 1 □ Married 2 □ In a domestic partnership 3 □ Separated 4 □ Divorced 5 □ Widowed 6 □ Single
A6. What was the highest level of school that you completed or the highest diploma or degree you received?
MARK ONLY ONE 1 □ Less than 9th grade 2 □ Some high school (no diploma) 3 □ High school graduate 4 □ High school diploma equivalent such as GED 5 □ Some college but no degree 6 □ Associate degree (includes, associate degree in college
occupational, vocational program, or associate degree in college academic program)
7 □ Bachelor’s degree (for example, B.A., A.B., B.S.) 8 □ Graduate degree (for example, Masters, M.D., J.D., Ph.D.) 9 □ Other (Please specify)
A7. Have you worked for pay sometime in the past…
Please consider both part-time and full-time jobs, as well as any self-employment jobs held for pay or profit.
YES NO DON’T KNOW REFUSED
a. week? ................... 1 □ 0 □ d □ r □
b. month? .................. 1 □ 0 □ d □ r □
c. 6 months? ............. 1 □ 0 □ d □ r □
d. year? ..................... 1 □ 0 □ d □ r □
A8. When was the last time you worked continuously
for the same employer for at least 20 hours per week and at least 6 months? Please tell us the month and year you left that employment. Your best guess is fine.
| | |/| | | | | Month Year
A8a. If exact date is not known, about how many years ago was it?
| | | YEARS AGO
A9. Was your housing temporary at some point in the past…
By temporary we mean without a fixed, regular, and adequate nighttime residence. Examples of temporary housing include an emergency shelter, transitional housing for the homeless, hospital or treatment center, jail or half-way house, group home, hotel paid for with emergency shelter voucher, or places not meant for human habitation such as the street or park.
YES NO DON’T KNOW REFUSED
a. week? ................... 1 □ 0 □ d □ r □
b. month? ................. 1 □ 0 □ d □ r □
c. 6 months? ............. 1 □ 0 □ d □ r □
d. year? .................... 1 □ 0 □ d □ r □
A10. How many people do you support financially or are responsible for their day-to-day activities? The people do not necessarily have to live with you.
| | | PEOPLE
A11. Are you a U.S. military veteran?
MARK ONE ONLY 1 □ Yes, was on active duty in the past 2 □ Yes, was in training for reserves or National Guard 0 □ No r □ Refused
GO TO A13

3
A12. When did you serve on active duty in the U.S.
Armed Forces?
Please mark EACH period that you served.
MARK ALL THAT APPLY 1 □ April 1995 or later 2 □ August 1990 to March 1995 (including Persian Gulf War) 3 □ September 1980 to July 1990 4 □ May 1975 to August 1980 5 □ Vietnam era (August 1964 to April 1975) 6 □ February 1955 to July 1964 7 □ Korean conflict (June 1950 to January 1955) 8 □ World War II (September 1940 to July 1947) 9 □ Some other time
A13. Have you ever been arrested?
Please include all arrests whether you were guilty or not.
1 □ Yes 0 □ No r □ Refused
A14. Have you ever been convicted and sentenced to go to jail or prison?
Please include any sentence you received, even if you did not serve any time.
1 □ Yes 0 □ No r □ Refused
A15. When was your most recent conviction? Please tell us the month and year you received that conviction. Your best guess is fine.
| | |/| | | | | Month Year
A15a. If exact date is not known, about how many years ago was it?
| | | YEARS AGO
After the intake is finished, please provide your insights about the client in Section B. If the client is referred to a REDF-supported social enterprise, make sure Section C is completed by the appropriate person.
B. INTAKE COUNSELOR ASSESSMENT
After the intake is complete, please provide your insights in this section.
B1. On a scale from 1 to 5, how much support does this individual need before performing well in a job in today’s job market? Use 5 to indicate someone who needs no support and 1 to indicate someone who needs a lot of support.
Needs A Lot of
Support
Needs No Support
1 □ 2 □ 3 □ 4 □ 5 □
B2. Is this individual a native English speaker?
1 □ Yes GO TO B3 0 □ No
B2a. If no, is the individual’s English language fluency…
1 □ Good 2 □ Fair 3 □ Poor 4 □ Cannot determine
B3. Does this individual meet REDF’s criteria for having income that lies below 200 percent of the federal poverty level (FPL)?
1 □ Yes 0 □ No d □ Don’t know
B4. Did you refer this person for social enterprise employment?
MARK ONE ONLY 1 □ Yes, to a REDF-supported social enterprise 2 □ Yes, to a social enterprise not supported by REDF 0 □ No, referred to employment services 3 □ Other (Please specify)
If the client is referred to a REDF-supported social enterprise, make sure Section C is completed by the appropriate person.
END CLIENT INTERVIEW
END CLIENT INTERVIEW

4
C. SOCIAL ENTERPRISE STATUS
Social Enterprise Counselor: Please answer the following questions about the client.
C1. Please record the date the participant started social enterprise employment.
| | |/| | |/| | | | | Month Day Year
If you don’t know the day, please enter the month and year.
C2. Did this person meet REDF’s criteria for social enterprise employment?
(worked 32 hours in 4 weeks)
Information can be obtained only after the individual starts social enterprise work. After 32 hours are worked, assuming it is during four weeks, mark yes. If after four weeks 32 hours have not been worked, mark No.
1 □ Yes, met hours 2 □ No, still working toward hours 0 □ No, failed to work 32 hours in 4 weeks
C2a. Please record the date the participant met REDF’s criteria for social enterprise employment.
| | |/| | |/| | | | | Month Day Year

D.1B. BASELINE SURVEY

This page has been left blank for double-sided copying.

Reference No.: 40004
Mathematica Job Study
Baseline Survey
March 22, 2012

This page has been left blank for double-sided copying.

Prepared by Mathematica Policy Research i
ALL
REQUIRED
INTERVIEWER: WHEN COMPLETING THIS SURVEY, PLEASE CHOOSE THE ANSWER CATEGORY THAT BEST FITS THE CLIENT’S ANSWER OR FILL IN THE BLANK PROVIDED.
INTERVIEWER: TO MOVE THROUGH THE SURVEY, PLEASE USE THE ‘START’ BUTTON BELOW’
1. Is this the Baseline or the Exit Survey?
Baseline ................................................................................................................ 1 Go to Baseline
Exit ........................................................................................................................ 0 Go to Exit ALL
REQUIRED
2. Thank you for participating in the Mathematica Job Study! The information you and other participants give us will be used to help us understand what it is like to work in a social enterprise.
The length of the survey is different for different people, but it usually takes about 25 minutes, depending on your answers. After you complete the survey, we will give you a magnet. If you get tired or need a break at any time
Everything you tell me will be kept strictly confidential and will not be shared with anyone but Mathematica. Mathematica will keep your responses in a secured location until after the study is completed. When the study is complete, the data will be destroyed. Only the researchers will be able to see information you provide and nothing will ever be said about you as an individual. Instead, information about you will be combined with information about everybody else in the study, so the researchers can say things like “30 percent of participants in enterprises funded by REDF found jobs within one year of leaving the enterprise.”
, please let me know and you can come back later to finish the survey.
Your participation in the survey is completely voluntary. You can withdraw at any point without penalty or you can choose not to answer specific questions during the surveys. Your decision whether to participate in this survey will have no influence on any present or future benefits.
Some of the information you will be asked to provide in this survey will be used to help find you in the future so that you can continue to participate in the study. Any contact information that you provide, such as addresses, emails, or phone numbers, will not be used as part of the research, and will be used only to find you.
If you have any questions about the survey or if you would ever like to update your contact information please don’t hesitate to contact us. You can reach us by calling 1-866-205-4649 or e-mailing [email protected].
INTERVIEWER: PLEASE USE THE NEXT BUTTON TO MOVE TO THE NEXT PAGE AND BEGIN THE SURVEY.
1
SECTION 1: INTRODUCTION
ALL
NOT REQUIRED
I2. What is the participant’s name? PARTICIPANT’S FIRST NAME (STRING 50)
PARTICIPANT’S LAST NAME (STRING 50)
ALL
REQUIRED
I3. What is the name of the social enterprise the participant will be working in?
ORGANIZATION (STRING 50)
2
SECTION 2: EMPLOYMENT
ALL
REQUIRED
A1. In the last week did you work at a job for pay? Include both part-time and full-time jobs, as well as any self-employment jobs held for pay or profit.
Yes ........................................................................................................................ 1 GO TO A3
No ......................................................................................................................... 0
DON’T KNOW/REFUSED .................................................................................... 99 IF A1=0 OR 99
REQUIRED
A2. People say that they are not working for a number of reasons. The following are some of the reasons people sometimes give for not working. Please tell me all of the reasons why you are not currently working.
INTERVIEWER: HAND THE CLIENT THE CARD THAT LISTS THE RESPONSES BELOW. THEN MARK ALL THE ANSWERS THAT APPLY.
A physical or mental condition prevents me from working ................................... 1 GO TO A5
I cannot find a job that I am qualified for .............................................................. 2 GO TO A5
I do not have reliable transportation to and from work ......................................... 3 GO TO A5
I am caring for someone else ............................................................................... 4 GO TO A5
I cannot find a job I want ....................................................................................... 5 GO TO A5
I am waiting to finish school or a training program ............................................... 6 GO TO A5
Workplaces are not accessible to people with my disability ................................. 7 GO TO A5
I do not want to lose benefits such as disability, worker's compensation, or Medicaid ............................................................................................................... 8 GO TO A5
Previous attempts to work have been discouraging ............................................. 9 GO TO A5
Others do not think I can work .............................................................................. 10 GO TO A5
Employers will not give me a chance to show that I can work ............................. 11 GO TO A5
I lack skills ............................................................................................................. 12 GO TO A5
There are other reasons why I am not working ................................................... 98 GO TO A2a
DON’T KNOW/REFUSED .................................................................................... 99 GO TO A5

3
IF A2=98
NOT REQUIRED
A2a. Please specify the other reason you are not currently working.
OTHER SPECIFY (STRING 300) GO TO A5 IF A1=1
REQUIRED
A3. In the past week, did you have more than one job, including part time, evening, or weekend work? Please count work for an employment agency or as a consultant as one job.
Yes ........................................................................................................................ 1
No ......................................................................................................................... 0 GO TO A5
DON’T KNOW/REFUSED .................................................................................... 99 GO TO A5 IF A1=1 AND A3=1
NOT REQUIRED
A4. Altogether, how many jobs did you have IN THE LAST WEEK? Please count work for an employment agency or as a consultant as one job.
NUMBER OF JOBS (RANGE 1-50)
ALL
NOT REQUIRED
A5. For the job at which you worked the most hours LAST WEEK what was the name of the employer where you worked? If you’re not currently employed, what was the name of the employer where you worked most recently?
NAME OF EMPLOYER (STRING 70)
Never worked........................................................................................................ 0 GO TO B1 A5 DOES NOT EQUAL 0
NOT REQUIRED
A6. What kind of business or industry is this company? What kinds of things do they do?
BUSINESS OR INDUSTRY (STRING 75)
4
A5 DOES NOT EQUAL 0
NOT REQUIRED
A7. What kind of work do (did) you do, that is what is or was your occupation?
OCCUPATION (STRING 75) A5 DOES NOT EQUAL 0
NOT REQUIRED
A8. What are (were) your usual activities or duties at this job?
ACTIVITIES OR DUTIES (STRING 75) A5 DOES NOT EQUAL 0
NOT REQUIRED
A9. How did you find this job? How did you hear about it?
INTERVIEWER: HAND THE CLIENT THE CARD THAT LISTS THE RESPONSES BELOW. THEN MARK ALL THE ANSWERS THAT APPLY.
Recall by former employer .................................................................................... 1
State employer agency/state job service .............................................................. 2
Private employment agency ................................................................................. 3
Friends/relatives/colleagues ................................................................................. 4
Want ads/newspaper/local paper ......................................................................... 5
Directly with employer .......................................................................................... 6
Union .................................................................................................................... 7
Self-employed ....................................................................................................... 8
Through school ..................................................................................................... 9
Internet/internet job service/TV/Craig’s list ........................................................... 10
Other (SPECIFY) .................................................................................................. 98
Specify (STRING 75)

5
A5 DOES NOT EQUAL 0
NOT REQUIRED
A10. How difficult is/was it for you to take an hour or two off during work hours at this job to take care of personal or family matters?
Not difficult at all ................................................................................................... 1
Not too difficult ...................................................................................................... 2
Somewhat difficult ................................................................................................ 3
Very difficult .......................................................................................................... 4 A5 DOES NOT EQUAL 0
NOT REQUIRED
A11. Please rate how satisfied you are (were) with this job with respect to each of the following. Would you say you are (were) very satisfied, somewhat satisfied, somewhat dissatisfied, or very dissatisfied with…
VERY SATISFIED
SOMEWHAT SATISFIED
SOMEWHAT DISSATISFIED
VERY DISSATISFIED
a. Your salary (the amount of money you made) 1 2 3 4
b. The benefits you received 1 2 3 4
c. The type of work you did 1 2 3 4
d. The number of hours you worked 1 2 3 4
e. Where the job was located 1 2 3 4
f. How secure you felt in keeping the job 1 2 3 4
g. The opportunities for you to move up in the company 1 2 3 4
h. How much it challenged you intellectually 1 2 3 4
i. The level of responsibility you were given 1 2 3 4
j. How much independence you had in your work 1 2 3 4
k. How much the job contributed to society 1 2 3 4
l. Getting feedback about how well you were doing the job 1 2 3 4
m. Getting the support you needed 1 2 3 4

6
A5 DOES NOT EQUAL 0
NOT REQUIRED
A12. Altogether, how many jobs, other than the one you just told me about, did you have IN THE LAST YEAR? Please count work for an employment agency or as a consultant as one job.
INTERVIEWER: IF THE ONLY JOB THE CLIENT HELD WAS THE ONE THEY JUST TOLD YOU ABOUT, ENTER 0 HERE.
NUMBER OF JOBS (RANGE 0-50)
PROGRAMMER SKIP BOX 1
IF A12=0 GO TO B1
IF A12 GT 0 GO TO A13
7
IF A12 GT 0 AND A5 DOES NOT EQUAL 0
NOT REQUIRED
A13. Other than the job you have just told me about, where else have you worked in the past year? Include any self-employment and any other current jobs.
INTERVIEWER: LIST THE MOST RECENT JOB FIRST, NOT INCLUDING THE MAIN JOB, WHICH IS THE JOB THEY JUST TOLD YOU ABOUT WHERE THEY WORKED THE MOST HOURS.
INTERVIEWER: ALTHOUGH THERE ARE FIVE SPACES BELOW, ONLY ENTER RESPONSES FOR THE NUMBER OF JOBS THE CLIENT HELD.
INTERVIEWER: IF THE CLIENT HELD MORE THAN FIVE ADDITIONAL JOBS, ONLY ENTER THE FIVE MOST RECENT JOBS BELOW.
JOB 2 (STRING 60)
JOB 3 (STRING 60)
JOB 4 (STRING 60)
JOB 5 (STRING 60)
JOB 6 (STRING 60)
PROGRAMMER BOX 1
PLEASE INCORPORATE QUESTIONS A14 THROUGH A20 INTO A GRID WITH 5 COLUMNS SO THAT PARTICIPANTS CAN FILL OUT JOB INFORMATION FOR THE 5 JOBS THEY’VE NAMED. SO JOB NAMES FROM QUESTION A13 SHOULD APPEAR AT THE TOP OF THE COLUMN. THE COLUMN HEADERS SHOULD BE FILLS WITH THE NAME OF EACH OF THE EMPLOYERS. THE FOLLOWING TEXT SHOULD BE INCLUDED AT THE BEGINNING OF THE GRID:
“INTERVIEWER: PLEASE ASK THE CLIENT EACH OF THE QUESTIONS BELOW FOR EACH OF THE JOBS THEY HAVE HELD IN THE PAST YEAR, NOT INCLUDING THE MAIN JOB THEY TOLD YOU ABOUT EARLIER.”
A5 DOES NOT EQUAL 0
NOT REQUIRED
A14. How many hours per week, including regular overtime hours did you usually
HOURS PER WEEK
work on this job?
(RANGE 0-100)

8
A5 DOES NOT EQUAL 0
NOT REQUIRED
A15. When did you start
START DATE
working at this job? Your best guess is fine.
MONTH YEAR (JAN-DEC) (1940-2013)
A5 DOES NOT EQUAL 0
NOT REQUIRED
A16. Was this employer subsidized?
Did they receive funding from an outside source (e.g., grant funding, federal, state, or local government funding) to supplement your employment?
Yes ........................................................................................................................ 1
No ......................................................................................................................... 0
DON’T KNOW/REFUSED .................................................................................... 99 A5 DOES NOT EQUAL 0
NOT REQUIRED
A17. Was this job at a social enterprise?
Did they provide you with support services like a case manager or employment counselor while you were working there?
Yes ........................................................................................................................ 1
No ......................................................................................................................... 0
DON’T KNOW/REFUSED .................................................................................... 99 A5 DOES NOT EQUAL 0
NOT REQUIRED
A18. Was health insurance or membership in an HMO or PPO plan or any other health care service available to you at this job?
Yes ........................................................................................................................ 1
No ......................................................................................................................... 0
DON’T KNOW/REFUSED .................................................................................... 99
9
A5 DOES NOT EQUAL 0
NOT REQUIRED
A19. If you are not currently working at this job, when did you stop working at this job? Your best guess is fine.
INTERVIEWER: IF CLIENT IS CURRENTLY WORKING AT THE JOB, DO NOT ENTER A RESPONSE TO THIS QUESTION.
STOP DATE MONTH YEAR (JAN-DEC) (1940-2013)
A5 DOES NOT EQUAL 0
NOT REQUIRED
A20. What was the main reason this job ended? Was it because…
You are still employed ....................................................................................... 1
You were laid off ................................................................................................. 2
You retired ........................................................................................................... 3
You were discharged or fired ............................................................................ 4
You quit ............................................................................................................... 5
Other reason (SPECIFY) .................................................................................... 98
Specify (STRING (NUM)) A5 DOES NOT EQUAL 0
NOT REQUIRED
A21. If necessary, please specify the other reason this job ended.
WHY POSITION ENDED (STRING 300)
10
SECTION 3: RECIDIVISM
ALL
REQUIRED
B1. How many times have you been arrested in your life?
INTERVIEWER: IF RESPONDENT ANSWERS DON’T KNOW OR REFUSED PLEASE ENTER 99.
NUMBER OF ARRESTS IF 0 OR 99 GO TO C1
(RANGE 0-100) IF B1 GT 0 AND B1 LT 99
NOT REQUIRED
B2. Have you ever been in jail or prison?
INTERVIEWER: IF YOU ARE PART OF CEO, CHOOSE YES AND DO NOT ASK RESPONDENT THIS QUESTION.
Yes ........................................................................................................................ 1
No ......................................................................................................................... 0 GO TO C1
DON’T KNOW/REFUSED .................................................................................... 99 GO TO C1 IF B1 GT 0 AND B1 LT 99 OR B2=1
REQUIRED
B3. Have you ever been convicted and sentenced to jail or prison?
Please include any sentence you received, even if you did not serve any time.
INTERVIEWER: IF YOU ARE PART OF CEO, CHOOSE YES AND DO NOT ASK RESPONDENT THIS QUESTION.
Yes ........................................................................................................................ 1
No ......................................................................................................................... 0 GO TO C1
DON’T KNOW/REFUSED .................................................................................... 99 GO TO C1 IF B3=1
NOT REQUIRED
B4. When was your most recent conviction? Your best guess is fine.
CONVICTION MONTH AND YEAR Month Year (JAN-DEC) (1940-2013)

11
IF B3=1
NOT REQUIRED
B5. Please think about all the prison sentences you’ve ever received.
Please tell us the total length of those prison sentences, even if you did not serve all of them.
PROBE: Your best guess is fine.
NUMBER OF (RANGE 1-365)
Days ...................................................................................................................... 1
Weeks ................................................................................................................... 2
Months .................................................................................................................. 3
Years .................................................................................................................... 4
DON’T KNOW/REFUSED .................................................................................... 99 IF B3=1
REQUIRED
B6. Are you currently on probation or parole?
INTERVIEWER: IF YOU ARE PART OF CEO, CHOOSE YES AND DO NOT ASK RESPONDENT THIS QUESTION.
Yes ........................................................................................................................ 1
No ......................................................................................................................... 0 GO TO C1
DON’T KNOW/REFUSED .................................................................................... 99 GO TO C1 IF B6=1
NOT REQUIRED
B7. How long will you be in touch with your parole or probation officer?
NUMBER OF (RANGE 1-365)
Days ...................................................................................................................... 1
Weeks ................................................................................................................... 2
Months .................................................................................................................. 3
Years .................................................................................................................... 4
DON’T KNOW/REFUSED .................................................................................... 99
12
SECTION 4: LIFE STABILITY
ALL
NOT REQUIRED
C1. Before coming in for services at this organization did you have any bank accounts, including a checking account?
Yes ........................................................................................................................ 1
No ......................................................................................................................... 0 ALL
NOT REQUIRED
C2. What is your best guess of your total monthly earnings (money from work)?
We would like to know how much you made before taxes and other deductions.
Please include tips, commissions, and overtime pay.
If you held more than one job, include your total earnings from all your jobs during the past month. Your best estimate is fine.
TOTAL MONTHLY EARNINGS
(RANGE 0 to 10,416)
IF C2 GT $10, 416 OR LT $100
NOT REQUIRED
C2a. You selected <FILL C2> as your total monthly earnings. If this is wrong, please click the back
button (below) and change it.
ALL
NOT REQUIRED
C3. What was the total amount you received in Earned Income Tax Credit (EITC) last year?
PROBE: Your best guess is fine.
INTERVIEWER: ENTER 0 IF THE CLIENT DID NOT RECEIVE ANY EITC.
EITC LAST YEAR
(RANGE 0 to 20,000)
13
ALL
NOT REQUIRED
C4. Before coming in for services at this organization, did you receive any benefits or income from the following sources.
If you did receive benefits or income from the source, please tell me the amount you received per month.
IF YES
YES NO
TOTAL AMOUNT PER MONTH
a. Food Stamp or SNAP benefits? 1 0
b. Welfare programs such as TANF, General Assistance or GA, CAL Works, or Safety Net? 1 0
c. SSI, SSDI, or other disability benefits? 1 0
d. Social Security or pension benefits? 1 0
e. Unemployment Insurance benefits or UI? 1 0
f. WIC benefits? 1 0
g. Worker’s Compensation benefits? 1 0
h. Alimony, child support, or rent payments? 1 0
i. Interest and/or dividends? 1 0
j. Money from friends or relatives? 1 0
k. Non-monetary support from friends or relatives (for example food, rent support, help paying bills)? 1 0
l. Any other income sources? (SPECIFY) 1 0

14
ALL
NOT REQUIRED
C5. In general would you say your physical health is…
Excellent, ............................................................................................................. 1
Very good, ........................................................................................................... 2
Good, ................................................................................................................... 3
Fair, or .................................................................................................................. 4
Poor? ................................................................................................................... 5 ALL
NOT REQUIRED
C6. During the past 7 days, how often did you feel distressed or bothered by the following feelings—never, a little bit, moderately, quite a bit, or extremely often?
NEVER A LITTLE
BIT MODERATELY QUITE A
BIT EXTREMELY
OFTEN
a. Feeling no interest in things 1 2 3 4 5
b. Feeling lonely 1 2 3 4 5
c. Feeling blue 1 2 3 4 5
d. Feelings of worthlessness 1 2 3 4 5
e. Feeling hopeless about the future 1 2 3 4 5
f. Thoughts of ending your life 1 2 3 4 5
ALL
REQUIRED
C7. Do you now have an emotional or other health condition that limits the amount or type of work you could do?
Yes ........................................................................................................................ 1
No ......................................................................................................................... 0 GO TO C9
DON’T KNOW/REFUSED .................................................................................... 99 GO TO C9 IF C8=1
NOT REQUIRED
C8. What condition is the main reason you are limited?
By what name do doctors call your health condition?
NAME OF CONDITION (STRING 200)
15
ALL
NOT REQUIRED
C9. In the past twelve months, how frequently did you have four or more drinks in one day?
TIMES
Never .................................................................................................................... 0 GO TO C11
DON’T KNOW/REFUSED .................................................................................... 99 GO TO C11 IF C9 DOES NOT EQUAL ‘NEVER’ OR ‘DON’T KNOW/REFUSED’
NOT REQUIRED
C10. In the past twelve months was there ever a time when your drinking or being hung over interfered with your job, school, or home life?
Yes ........................................................................................................................ 1
No ......................................................................................................................... 0
DON’T KNOW/REFUSED .................................................................................... 99 ALL
NOT REQUIRED
C11. In the past twelve months have you been in counseling or therapy for alcohol problems?
Yes ........................................................................................................................ 1
No ......................................................................................................................... 0
DON’T KNOW/REFUSED .................................................................................... 99 ALL
NOT REQUIRED
C12. In the past twelve months, how often did you smoke marijuana or hashish (pot, grass, hash)?
TIMES
Never .................................................................................................................... 0
DON’T KNOW/REFUSED .................................................................................... 99

16
ALL
NOT REQUIRED
C13. In the past twelve months, how often did you use any hard drugs such as heroin, cocaine, or LSD?
TIMES
Never .................................................................................................................... 0
DON’T KNOW/REFUSED .................................................................................... 99 ALL
NOT REQUIRED
C14. In the past twelve months have you been in counseling or therapy for drug problems?
Yes ........................................................................................................................ 1
No ......................................................................................................................... 0
DON’T KNOW/REFUSED .................................................................................... 99
17
ALL
NOT REQUIRED
C15. Please tell me if you spent the night at each of the following places during the last week, the last month, the last six months, the last year and more than one year ago. If you never stayed at the place, please say never. INTERVIEWER: HAND THE CLIENT THE CARD THAT LISTS THE RESPONSES BELOW
AND FOR EACH ROW, MARK THE ANSWER THAT APPLIES.
LAST WEEK
LAST MONTH
LAST SIX
MONTHS LAST YEAR
MORE THAN ONE YEAR AGO NEVER
a. Emergency shelter, including hotel or motel voucher paid for by a social service or charitable organization 1 2 3 4 5 0
b. Transitional housing for homeless persons 1 2 3 4 5 0
c. Permanent supportive housing for formerly homeless persons 1 2 3 4 5 0
d. Psychiatric hospital or other psychiatric facility 1 2 3 4 5 0
e. Substance abuse treatment facility, rehabilitation center, or other detox facility 1 2 3 4 5 0
f. Hospital (non-psychiatric) (because you did not have a fixed, regular nighttime residence) 1 2 3 4 5 0
g. Jail, prison or juvenile detention facility 1 2 3 4 5 0
h. Half-way house or three-quarter-way home for persons with criminal offenses 1 2 3 4 5 0
i. Room, apartment or house that you rent 1 2 3 4 5 0
j. Apartment or house that you own 1 2 3 4 5 0
k. In a friend’s or family member’s room, apartment or house (because you did not have a fixed, regular nighttime residence) 1 2 3 4 5 0
l. Hotel or motel paid for without emergency shelter voucher (because you did not have a fixed, regular nighttime residence) 1 2 3 4 5 0
m. Foster care home or foster care group home 1 2 3 4 5 0
n. Group home or other supervised residential care facility (because you did not have a fixed, regular nighttime residence) 1 2 3 4 5 0
o. Street, car, park, other place outside (because you did not have a fixed, regular nighttime residence) 1 2 3 4 5 0
p. Other (SPECIFY) 1 2 3 4 5 0
18
ALL
NOT REQUIRED
C16. Please tell me if the following statements are very much like you, mostly like you, somewhat like you, not much like you or not like you at all.
VERY MUCH
LIKE ME MOSTLY LIKE ME
SOME-WHAT
LIKE ME
NOT MUCH
LIKE ME
NOT LIKE ME AT ALL
a. I have overcome setbacks to conquer an important challenge 1 2 3 4 5
b. New ideas and projects sometimes distract me from previous ones 1 2 3 4 5
c. My interests change from year to year 1 2 3 4 5
d. Setbacks don’t discourage me 1 2 3 4 5
e. I have been obsessed with a certain idea or project for a short time but later lost interest 1 2 3 4 5
f. I am a hard worker 1 2 3 4 5
g. I often set a goal but later choose to pursue a different one 1 2 3 4 5
h. I have difficulty maintaining my focus on projects that take more than a few months to complete 1 2 3 4 5
i. I finish whatever I begin 1 2 3 4 5
j. I have achieved a goal that took years of work 1 2 3 4 5
k. I become interested in new pursuits every few months 1 2 3 4 5
l. I am diligent 1 2 3 4 5

19
SECTION 5: FACILITATING FACTORS
ALL
REQUIRED
F1. Have you participated in any education and training programs and courses that were supposed to lead to a degree, certificate or license?
PROBE: Please include training programs that helped you learn job skills or prepare for an occupation, as well as general educational programs, such as college, regular high school, or GED courses.
Yes ........................................................................................................................ 1
No ......................................................................................................................... 0 GO TO F13
DON’T KNOW/ REFUSED ................................................................................... 99 GO TO F13 IF F1=1
NOT REQUIRED
F2. How many different education and training programs have you participated in?
NUMBER OF EDUCATION AND TRAINING PROGRAMS (RANGE 1-30)
IF F1=1
REQUIRED
F3. Are you currently participating in any of these programs?
Yes ........................................................................................................................ 1
No ......................................................................................................................... 0 GO TO F5 and Grid 1-3
DON’T KNOW/REFUSED .................................................................................... 99 GO TO F5 and Grid 1-3
IF F3=1
NOT REQUIRED
F3A. In how many training and education programs are you currently participating?
NUMBER OF EDUCATION AND TRAINING PROGRAMS (RANGE 0-30)
20
IF F3 =1
NOT REQUIRED
F4. What are the names of the programs in which you are currently participating?
INTERVIEWER: IF THERE ARE MORE THAN THREE PROGRAMS MENTIONED, ASK CLIENT TO TELL YOU THE NAMES OF THE THREE PROGRAMS WHERE THEY DEVOTED THE MOST TIME.
PROGRAM 1 (STRING 60)
PROGRAM 2 (STRING 60)
PROGRAM 3 (STRING 60) IF F2 GT 0
NOT REQUIRED
F5. What are the names of the other programs in which you have participated?
INTERVIEWER: IF THERE ARE MORE THAN THREE PROGRAMS MENTIONED, ASK CLIENT TO TELL YOU THE NAMES OF THE THREE PROGRAMS WHERE THEY DEVOTED THE MOST TIME.
PROGRAM 4 (STRING 60)
PROGRAM 5 (STRING 60)
PROGRAM 6 (STRING 60)
Did not participate in any other programs ............................................................ 0
PROGRAMMER BOX 2
PLEASE INCORPORATE QUESTIONS F6 THROUGH F10 INTO A GRID WITH 6 COLUMNS SO THAT PARTICIPANTS CAN FILL OUT TRAINING PROGRAM INFORMATION FOR THE 6 TRAINING PROGRAMS THEY’VE NAMED. THE COLUMN HEADERS SHOULD BE FILLS WITH THE NAME OF EACH OF THE TRAINING PROGRAMS. THE FOLLOWING TEXT SHOULD BE INCLUDED AT THE BEGINNING OF THE GRID:
F6 - F10. (Program 1 - 3)
F6 - F10. (Program 4 - 6)
“INTERVIEWER: PLEASE ASK THE CLIENT THE QUESTIONS BELOW FOR EACH OF THE PROGRAMS THEY JUST TOLD YOU ABOUT.”

21
IF F1=1
NOT REQUIRED
F6. Did you complete this program?
Yes ........................................................................................................................ 1
No ......................................................................................................................... 0 IF F1=1
NOT REQUIRED
F7. What is the name of the certificate, degree, or license you received for completion of this program?
NAME OF CERTIFICATE (STRING 75) IF F1=1
NOT REQUIRED
F8. Is that a certificate, a license, or degree?
Certificate .............................................................................................................. 1
License ................................................................................................................. 2
Degree .................................................................................................................. 3
Other (SPECIFY BELOW) .................................................................................... 98
Specify (STRING (NUM)) ALL
NOT REQUIRED
F8A. If necessary, please specify the other type of certificate, license, or degree:
PROGRAM TYPE (STRING 300) IF F1=1
NOT REQUIRED
F9. What kind of work is this certificate, degree, or license for? That is, what kind of job would you be prepared to do?
KIND OF WORK (STRING 100)
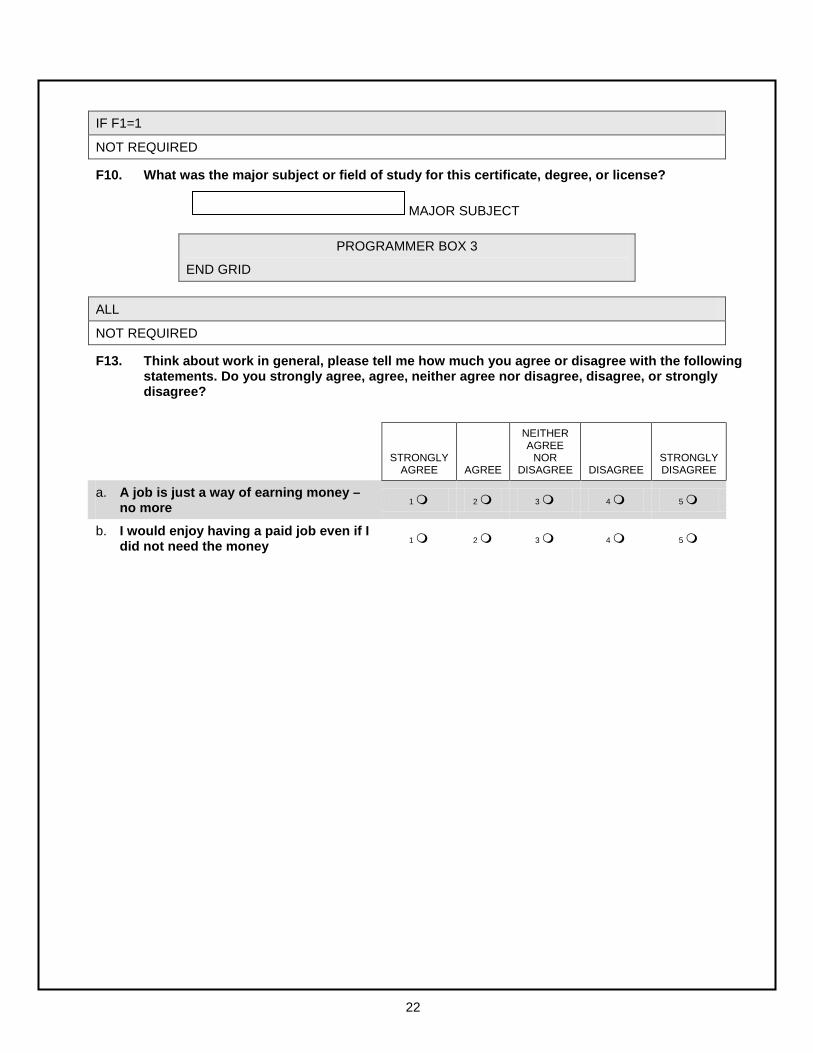
22
IF F1=1
NOT REQUIRED
F10. What was the major subject or field of study for this certificate, degree, or license?
MAJOR SUBJECT
PROGRAMMER BOX 3
END GRID ALL
NOT REQUIRED
F13. Think about work in general, please tell me how much you agree or disagree with the following statements. Do you strongly agree, agree, neither agree nor disagree, disagree, or strongly disagree?
STRONGLY
AGREE AGREE
NEITHER AGREE
NOR DISAGREE DISAGREE
STRONGLY DISAGREE
a. A job is just a way of earning money – no more 1 2 3 4 5
b. I would enjoy having a paid job even if I did not need the money 1 2 3 4 5

23
ALL
NOT REQUIRED
F14. How important do you think the following qualities are in a job: very important, important, neither important nor unimportant, not important, not important at all.
How important is…
VERY IMPORTANT IMPORTANT
NEITHER IMPORTANT
NOR UNIMPORTANT
NOT IMPORTANT
NOT IMPORTANT
AT ALL
a. …job security? 1 2 3 4 5
b. …high income? 1 2 3 4 5
c. …good opportunities for advancement? 1 2 3 4 5
d. …an interesting job? 1 2 3 4 5
e. …a job that allows someone to work independently? 1 2 3 4 5
f. …a job that allows someone to help other people? 1 2 3 4 5
g. …a job that is useful to society? 1 2 3 4 5
h. …a job that allows someone to decide their times or days of work? 1 2 3 4 5

24
ALL
NOT REQUIRED
F15. In 5 years, do you think you will…
YES NO MAYBE
DON’T KNOW/REFUSED
a. Have continued your education or undertaken additional job training? 1 0 2 99
b. Own or rent your own home or apartment? 1 0 2 99
c. Be established in a career? 1 0 2 99
d. Be in good mental health? 1 0 2 99
e. Be in good physical health? 1 0 2 99
f. Be economically self sufficient? 1 0 2 99
g. Rarely drink alcohol and use drugs? 1 0 2 99
h. Be removed from illegal activity? 1 0 2 99
i. Other (SPECIFY) 1 0 2 99
25
ALL
NOT REQUIRED
F17. Do you have the ability to use each of the following skills in a job?
YES NO DON’T
KNOW/REFUSED a. Use math or numbers in any way (e.g., measure or
weigh things, count things, work with money) 1 0 99
b. Use addition or subtraction 1 0 99
c. Use multiplication or division 1 0 99
d. Do math using fractions, decimals, or percentages 1 0 99
e. Use simple algebra to solve for unknown variables 1 0 99
f. Use more advanced algebra to solve complex equations 1 0 99
g. Read anything in English at work, even very short notes or instructions 1 0 99
h. Read anything in English at least one page long, including notes, memos, reports, or letters 1 0 99
i. Read anything in English at least 5 pages long 1 0 99
j. Read articles or reports in trade magazines, newsletters, or newspapers in English 1 0 99
k. Read articles in scholarly, scientific publications, or professional journals in English 1 0 99
l. Read instruction manuals or other reference materials in English 1 0 99
m. Read work-related books in English 1 0 99
n. Read bills or invoices in English 1 0 99
o. Write anything in English at work, even very short notes or instructions only a few sentences long 1 0 99
p. Write anything in English at least one page long, including notes, memos, reports, or letters 1 0 99
q. Write anything in English at least 5 pages long 1 0 99
r. Write articles or reports for magazines, newspapers, or newsletters in English 1 0 99
s. Write books or articles for scholarly, scientific, or professional journals in English 1 0 99
t. Fill out bills or invoices in English 1 0 99

26
SECTION 6: DEMOGRAPHICS
ALL
NOT REQUIRED
D1. What is your current marital status—are you now…
Married, ................................................................................................................ 1
In a domestic partnership, ................................................................................. 2
Separated, ........................................................................................................... 3
Divorced .............................................................................................................. 4
Widowed, or ........................................................................................................ 5
Single? ................................................................................................................. 6 ALL
REQUIRED
D2. How many people do you have where you hold financial responsibility for them or where you are responsible for their day-to-day activities? In other words, how many dependents do you have? The person or people do not necessarily need to live with you. INTERVIEWER: ENTER 0 IF THE RESPONDENT HAS NO DEPENDENTS
INTERVIEWER: ENTER 99 IF THE RESPONDENT SAYS DON’T KNOW OR REFUSES TO ANSWER THE QUESTION.
INTERVIEWER: IF THERE ARE MORE THAN FIFTEEN DEPENDENTS MENTIONED, ENTER 15 IN THE SPACE BELOW AND TELL THE CLIENT THE NEXT QUESTIONS WILL ASK ABOUT THE FIFTEEN DEPENDENTS FOR WHOM THEY HAVE THE BIGGEST FINANCIAL RESPONSIBILITY.
NUMBER OF PEOPLE IF 0 or 99, GO TO D3 (RANGE 0-15)
PROGRAMMER BOX 4
PLEASE INCORPORATE QUESTIONS D2A THROUGH D2F INTO A GRID WITH 5 COLUMNS. THE COLUMNS WILL APPEAR ACROSS 3 SCREENS SO THAT PARTICIPANTS CAN FILL OUT INFORMATION FOR THE 15 HOUSEHOLD MEMBERS THEY’VE NAMED. THE COLUMN HEADERS SHOULD BE “PERSON 1,” “PERSON 2,” ETC.
TOP OF GRID SHOULD READ “INTERVIEWER: PLEASE ASK THE CLIENT EACH OF THE QUESTIONS BELOW FOR EACH DEPENDENT THEY TOLD YOU ABOUT”
27
IF D2 GT 0 AND D2 DOES NOT EQUAL 99
NOT REQUIRED
D2a. What is their relationship to you?
Spouse/partner ..................................................................................................... 1
Boyfriend/girlfriend ................................................................................................ 2
Child (natural, step, or custodial) .......................................................................... 3
Parent or stepparent ............................................................................................. 4
Grandparent, aunt, uncle, ..................................................................................... 5
Sibling (brother or sister) ...................................................................................... 6
Nephew or niece, cousin ...................................................................................... 7
Grandchild ............................................................................................................ 8
Other relative or in-law ......................................................................................... 9
Non-relative (including roomer or boarder) .......................................................... 10
Other (SPECIFY) .................................................................................................. 98
Specify (STRING (NUM)) D2 DOES NOT EQUAL 99
NOT REQUIRED
D2A1. If necessary, please specify their relationship to you:
RELATIONSHIP (STRING 300) IF D2 GT 0 AND D2 DOES NOT EQUAL 99
NOT REQUIRED
D2b. Are they male or female?
Male ...................................................................................................................... 1
Female .................................................................................................................. 2 IF D2 GT 0 AND D2 DOES NOT EQUAL 99
NOT REQUIRED
D2c. Approximately how old are they?
YEARS OLD (RANGE 0-99)
28
IF D2 GT 0 AND D2 DOES NOT EQUAL 99
NOT REQUIRED
D2d. Are you financially responsible for them, responsible for their day-to day activities, or both?
Financially responsible ......................................................................................... 1
Responsible for day-to-day activities .................................................................... 2
Both ...................................................................................................................... 3 IF D2 GT 0 AND D2 DOES NOT EQUAL 99
NOT REQUIRED
D2e. What type of health insurance plans are they currently covered by? INTERVIEWER: IF RESPONDENT CHOOSES MORE THAN ONE, SELECT ONE
RESPONSE IN THE DROP DOWN MENU AND WRITE THE OTHER CHOICES BELOW IN D2f.
Currently not covered by any health insurance .................................................... 1
Medicaid/Medicare ............................................................................................... 2
An employer or union sponsored health plan ....................................................... 3
Military health care ............................................................................................... 4
Other government health plan (SPECIFY) ........................................................... 5
Specify (STRING (NUM))
Insurance purchased directly from an insurer ...................................................... 6
Other type of health insurance (SPECIFY) .......................................................... 98
Specify (STRING (NUM))
DON’T KNOW/REFUSED .................................................................................... 99 IF D2 GT 0 AND D2 DOES NOT EQUAL 99
NOT REQUIRED
D2f. If necessary, please specify the type of health insurance.
HEALTH INSURANCE (STRING 100)
PROGRAMMER BOX 5
END GRID
29
ALL
NOT REQUIRED
D3. What kind of health insurance plans are YOU currently covered by? INTERVIEWER: MARK ALL THAT APPLY
Not currently covered by health insurance ........................................................... 1
Medicaid/Medicare ............................................................................................... 2
An employer or union sponsored health plan ....................................................... 3
A government program other than Medicaid or Medicare .................................... 4
Military health care ............................................................................................... 5
Insurance purchased directly from an insurer ...................................................... 4
Some other type of health insurance (SPECIFY IN NEXT QUESTION) ............. 98
Don’t know ............................................................................................................ 99 ALL
NOT REQUIRED
D3a. If necessary, please specify the type of health insurance.
HEALTH INSURANCE (STRING 100)

30
SECTION 7: LOCATING
We would like to contact you again in the future to see how you are doing and update our information. This information is completely voluntary and you may choose not to answer specific questions without penalty. Your decision whether to answer these questions will have no influence on any present or future benefits from [NAME OF SOCIAL ENTERPRISE FROM QUESTION I3]. ALL
NOT REQUIRED
L1. We would like to start by collecting information about how we might contact you. What is your address?
(STRING 50) Street Address 1 (Include apartment number)
(STRING 50) Street Address 2
(STRING 50) City
(STRING 2) State
(STRING 5)
Zip ALL
REQUIRED
L2. Are there any other names people call you?
Yes ........................................................................................................................ 1
No ......................................................................................................................... 0 GO TO L3
DON’T KNOW/REFUSED .................................................................................... 99 GO TO L3 IF L2=1
NOT REQUIRED
L2a. Please tell me those names.
ALTERNATIVE NAMES (STRING 200)

31
ALL
NOT REQUIRED
L3. Please give me your telephone number, area code first and email address, if you have one.
TELEPHONE NUMBER
E-MAIL ADDRESS (STRING 70) ALL
REQUIRED
L4. Do you have another phone number or e-mail address?
Yes ........................................................................................................................ 1
No ......................................................................................................................... 0 GO TO L5a
DON’T KNOW/REFUSED .................................................................................... 99 GO TO L5a IF L4=1
NOT REQUIRED
L5. What is the other phone number and e-mail address?
SECOND PHONE NUMBER
E-MAIL ADDRESS (STRING 70) ALL
NOT REQUIRED
L5a. We would like to collect information about how we may contact you. Are your benefit checks or other mail sent to the address you just provided?
Yes ........................................................................................................................ 1 GO TO L14a
No ......................................................................................................................... 0
DON’T KNOW/REFUSED .................................................................................... 99 GO TO L14a
32
L5a=1
NOT REQUIRED
L6. Where are your benefit checks or other mail sent?
(STRING 50) Street Address 1 (Include apartment number)
(STRING 50) Street Address 2
(STRING 50) City
(STRING 2) State
(STRING 5)
Zip IF C15a, b, c, f, g, h, k, l, m, n, o= 1, 2, 3, or 4
NOT REQUIRED
L8. In case we have trouble reaching you, could you provide us with the name, address, and phone number of places you have stayed over the past year?
What is the name of the place you stayed most of the time last year?
HOUSING (STRING 200)
DON’T KNOW/REFUSED .................................................................................... 99 GO TO L14a
33
IF C15a, b, c, f, g, h, k, l, m, n, o= 1, 2, 3, or 4 AND L8 DOES NOTE EQUAL 99
NOT REQUIRED
L9. What is the address there?
(STRING 50) Street Address 1 (Include apartment number)
(STRING 50) Street Address 2
(STRING 50) City
(STRING 2) State
(STRING 5)
Zip IF C15a, b, c, f, g, h, k, l, m, n, o= 1, 2, 3, or 4 AND L8 DOES NOTE EQUAL 99
NOT REQUIRED
L10. What is their telephone number, area code first?
TELEPHONE NUMBER IF C15a, b, c, f, g, h, k, l, m, n, o= 1, 2, 3, or 4 AND L8 DOES NOTE EQUAL 99
REQUIRED
L11. Are there any other places that you have frequently stayed in over the past 12 months?
Yes ........................................................................................................................ 1
No ......................................................................................................................... 0 GO TO L14a
DON’T KNOW/REFUSED .................................................................................... 99 GO TO L14a IF L11=1
NOT REQUIRED
L12. What is the name of that place?
HOUSING (STRING 200)
34
IF L11=1
NOT REQUIRED
L13. What is the address there?
(STRING 50) Street Address 1 (Include apartment number)
(STRING 50) Street Address 2
(STRING 50) City
(STRING 2) State
(STRING 5)
Zip IF L11=1
NOT REQUIRED
L14. What is their telephone number, area code first?
TELEPHONE NUMBER ALL
NOT REQUIRED
L14A. In case we have trouble reaching you, could you also provide us with the names, addresses, and phone numbers of three close relatives or friends who are not living with you and are likely to know your location in the future. For example, the individuals could be your mother, father, brother, sister, aunt, uncle, or close friend. Do you have any individuals for whom you can provide contact information?
Yes ........................................................................................................................ 1
No ......................................................................................................................... 0 GO TO L30

35
L14A=1
NOT REQUIRED
L15. What is the name and address of your first contact person?
(STRING 50) First Name
(STRING 1) Middle Initial
(STRING 50) Last Name
(STRING 50) Street Address 1 (Include apartment number)
(STRING 50) Street Address 2
(STRING 50) City
(STRING 2) State
(STRING 5)
Zip L14A=1
NOT REQUIRED
L16. Please give me their telephone number, area code first and email address if they have one.
TELEPHONE NUMBER
E-MAIL ADDRESS (STRING 70)

36
L14A=1
REQUIRED
L17. Do you have another phone number or e-mail address for this person?
Yes ........................................................................................................................ 1
No ......................................................................................................................... 0 GO TO L19
DON’T KNOW/REFUSED .................................................................................... 99 GO TO L19 L14A=1 AND L17=1
NOT REQUIRED
L18. What is the other phone number and e-mail address?
SECOND PHONE NUMBER
E-MAIL ADDRESS (STRING 70) L14A=1
NOT REQUIRED
L19. How are they related to you, if at all?
Spouse/partner ..................................................................................................... 1
Mother ................................................................................................................... 2
Father ................................................................................................................... 3
Son or daughter .................................................................................................... 4
Grandparent.......................................................................................................... 5
Brother/sister ........................................................................................................ 6
Aunt/uncle ............................................................................................................. 7
Other relative ........................................................................................................ 8
Not related ............................................................................................................ 9
Staff at residence .................................................................................................. 10 L14A=1
NOT REQUIRED
L19A. Do you have a second contact person?
Yes ........................................................................................................................ 1
No ......................................................................................................................... 0 GO TO L30

37
L19A=1
NOT REQUIRED
L20. What is the name and address of your second contact person?
(STRING 50) First Name
(STRING 1) Middle Initial
(STRING 50) Last Name
(STRING 50) Street Address 1 (Include apartment number)
(STRING 50) Street Address 2
(STRING 50) City
(STRING 2) State
(STRING 5)
Zip L19A=1
NOT REQUIRED
L21. Please give me their telephone number, area code first and email address if they have one.
TELEPHONE NUMBER
E-MAIL ADDRESS (STRING 70) L19A=1
REQUIRED
L22. Do you have another phone number or e-mail address for this person?
Yes ........................................................................................................................ 1
No ......................................................................................................................... 0 GO TO L24
DON’T KNOW/REFUSED .................................................................................... 99 GO TO L24

38
L19A=1 AND L22=1
NOT REQUIRED
L23. What is the other phone number and e-mail address?
SECOND PHONE NUMBER
E-MAIL ADDRESS (STRING 70) L19A=1
NOT REQUIRED
L24. How are they related to you, if at all?
Spouse/partner ..................................................................................................... 1
Mother ................................................................................................................... 2
Father ................................................................................................................... 3
Son or daughter .................................................................................................... 4
Grandparent.......................................................................................................... 5
Brother/sister ........................................................................................................ 6
Aunt/uncle ............................................................................................................. 7
Other relative ........................................................................................................ 8
Not related ............................................................................................................ 9
Staff at residence .................................................................................................. 10 L19A=1
NOT REQUIRED
L24A. Do you have a third contact person?
Yes ........................................................................................................................ 1
No ......................................................................................................................... 0 GO TO L30
39
L24A=1
NOT REQUIRED
L25. What is the name and address of your third contact person?
(STRING 50) First Name
(STRING 1) Middle Initial
(STRING 50) Last Name
(STRING 50) Street Address 1 (Include apartment number)
(STRING 50) Street Address 2
(STRING 50) City
(STRING 2) State
(STRING 5)
Zip L24A=1
NOT REQUIRED
L26. Please give me their telephone number, area code first and email address if they have one.
TELEPHONE NUMBER
E-MAIL ADDRESS (STRING 70)

40
L24A=1
REQUIRED
L27. Do you have another phone number or e-mail address for this person?
Yes ........................................................................................................................ 1
No ......................................................................................................................... 0 GO TO L29
DON’T KNOW/REFUSED .................................................................................... 99 GO TO L29 L24A=1 AND L27=1
NOT REQUIRED
L28. What is the other phone number and e-mail address?
SECOND PHONE NUMBER
E-MAIL ADDRESS (STRING 70) L24A=1
NOT REQUIRED
L29. How are they related to you, if at all?
Spouse/partner ..................................................................................................... 1
Mother ................................................................................................................... 2
Father ................................................................................................................... 3
Son or daughter .................................................................................................... 4
Grandparent.......................................................................................................... 5
Brother/sister ........................................................................................................ 6
Aunt/uncle ............................................................................................................ 7
Other relative ........................................................................................................ 8
Not related ............................................................................................................ 9
Staff at residence .................................................................................................. 10 ALL
REQUIRED
L30. Do you have a place that you regularly visit or hang out? For example, do you regularly hang out at a community center, coffee shop, soup kitchen, rec center, food bank, church, or rapid food distribution program?
Yes ........................................................................................................................ 1
No ......................................................................................................................... 0 GO TO L33
DON’T KNOW/REFUSED .................................................................................... 99 GO TO L33
41
IF L30=1
NOT REQUIRED
L31. Please tell me the name of this place.
NAME (STRING 75)
IF L30=1
NOT REQUIRED
L32. What is the address of this place?
(STRING 50) Street Address 1 (Include apartment number)
(STRING 50) Street Address 2
(STRING 50) City
(STRING 2) State
(STRING 5)
Zip

42
IF B6=1
NOT REQUIRED
L33. Finally, in case we have trouble reaching you, could you provide us with the name, address, phone number, and email address of your parole or probation officer? This information is completely voluntary.
What is the name and address of your parole or probation officer?
(STRING 50) First Name
(STRING 1) Middle Initial
(STRING 50) Last Name
(STRING 50) Street Address 1 (Include apartment number)
(STRING 50) Street Address 2
(STRING 50) City
(STRING 2) State
(STRING 5)
Zip IF B6=1
NOT REQUIRED
L34. What is your parole or probation officer’s telephone number?
TELEPHONE NUMBER

43
IF B6=1
NOT REQUIRED
L35. What is your parole or probation officer’s cell phone number and e-mail address?
CELL PHONE NUMBER
E-MAIL ADDRESS
Thank you very much for your time. We appreciate your help.
L36. INTERVIEWER: PLEASE ENTER HOW MANY MINUTES IT TOOK YOU TO COMPLETE THIS SURVEY. YOUR BEST GUESS IS FINE.
INTERVIEWER: PLEASE PUSH THE ‘FINISH’ BUTTON TO COMPLETE THE SURVEY.
MINUTES (0-240)

D.1C. EXIT SURVEY

This page has been left blank for double-sided copying.

Reference No.: 40004
MATHEMATICA JOB STUDY
Exit Survey
March 22, 2012

This page has been left blank for double-sided copying.

Prepared by Mathematica Policy Research i
ALL
REQUIRED
INTERVIEWER: WHEN COMPLETING THIS SURVEY, PLEASE CHOOSE THE ANSWER CATEGORY THAT BEST FITS THE CLIENT’S ANSWER OR FILL IN THE BLANK PROVIDED.
INTERVIEWER: TO MOVE THROUGH THE SURVEY, PLEASE USE THE ‘START BUTTON’
1. Is this the Baseline or the Exit Survey?
Baseline ................................................................................................................ 1 Go to Baseline
Exit ........................................................................................................................ 0 Go to Exit ALL
REQUIRED
2. Thank you for participating in the Mathematica Job Study! The information you give us will be used to help us understand what it is like to work in a social enterprise.
The length of the survey is different for different people, but it usually takes about 25 minutes, depending on your answers. In appreciation for your time, we will give you a $20 gift card. If you get tired or need a break at any time
Everything you tell the research team at Mathematica will be kept strictly confidential and will not be shared with any agency. Mathematica will keep your responses in a secured location until after the study is completed. When the study is complete, the data will be destroyed. Only the researchers will be able to see information you provide and nothing will ever be said about you as an individual. Instead, information about you will be combined with information about everybody else in the study, so the researchers can say things like “30 percent of participants in enterprises funded by REDF found jobs within one year of leaving the enterprise.”
, please tell me and you can come back later to finish the survey.
Your participation in the survey is completely voluntary. You can withdraw at any point without penalty or you can choose not to answer specific questions during the surveys. Your decision whether to participate in this survey will have no influence on any present or future benefits.
Some of the information you will be asked to provide in this survey will be used to help find you in the future so that you can continue to participate in the study. Any contact information that you provide, such as addresses, emails, or phone numbers, will not be used as part of the research, and will be used only to find you.
If you have any questions about the survey or if you would ever like to update your contact information please don’t hesitate to contact us. You can reach us by calling 1-866-205-4649 or e-mailing [email protected].
INTERVIEWER: PLEASE USE THE NEXT BUTTON TO MOVE TO THE NEXT PAGE AND BEGIN THE SURVEY.

Prepared by Mathematica Policy Research 1
SECTION 1: INTRODUCTION ALL
NOT REQUIRED
I2. What is the participant’s name?
PARTICIPANT’S FIRST NAME (STRING 50)
PARTICIPANT’S LAST NAME (STRING 50) ALL
NOT REQUIRED
I3. What is the name of the social enterprise in which the participant worked?
SOCIAL ENTERPRISE (STRING 50) ALL
REQUIRED
I1a. Is the individual who worked at [NAME OF SOCIAL ENTERPRISE FROM QUESTION I3] completing the survey?
Yes ........................................................................................................................ 1 GO TO A1
No ......................................................................................................................... 0
PROGRAMMER: IF I1a=0, ASK PROXY QUESTIONS ONLY IF I1=0
NOT REQUIRED
I1b. What is the name of the proxy completing the survey?
Please note that all questions will still be phrased as if you are the respondent.
PROXY’S FIRST NAME (STRING 50)
PROXY’S LAST NAME (STRING 50)
Prepared by Mathematica Policy Research 2
SECTION 2: WORKING AT [NAME OF SOCIAL ENTERPRISE FROM QUESTION I3] ALL
FILL NAME OF SOCIAL ENTERPRISE FROM QUESTION I3
NOT REQUIRED
A1. How many hours per week, including regular overtime hours did you usually
(PROXY)
work at [NAME OF SOCIAL ENTERPRISE FROM QUESTION I3]?
HOURS PER WEEK (0-80)
IF A1 GT 80
FILL A1
NOT REQUIRED
A1a. You entered [FILL A1] hours per week. If this is wrong please click the back button (below) and change it.
ALL
FILL NAME OF SOCIAL ENTERPRISE FROM QUESTION I3
NOT REQUIRED
A1b. How many days, weeks or months did you work at [NAME OF SOCIAL ENTERPRISE FROM QUESTION I3]?
(PROXY)
DAYS, WEEKS, OR MONTHS
DAYS .................................................................................................................... 1
WEEKS ................................................................................................................. 2
MONTHS .............................................................................................................. 3
DON’T KNOW/REFUSED .................................................................................... 99 ALL
FILL NAME OF SOCIAL ENTERPRISE FROM QUESTION I3
NOT REQUIRED
A2. What kind of work did you do at [NAME OF SOCIAL ENTERPRISE FROM QUESTION I3], that is what was your occupation?
(PROXY)
OCCUPATION (STRING 300)

Prepared by Mathematica Policy Research 3
ALL
NOT REQUIRED
A3. What were your usual activities or duties at this job?
(PROXY)
ACTIVITIES OR DUTIES (STRING 300) ALL
FILL NAME OF SOCIAL ENTERPRISE FROM QUESTION I3
NOT REQUIRED
A4. What is your best guess of your total monthly earnings (money from work) that you made at [NAME OF SOCIAL ENTERPRISE FROM QUESTION I3]?
We would like to know how much you made before taxes and other deductions. Please include tips, commissions, and regular overtime.
(PROXY) TOTAL MONTHLY EARNINGS (RANGE 0-10,416)
Not yet paid........................................................................................................... 1 GO TO A4b IF A4 GT $10,416 OR LT $0 AND A4 DOES NOT EQUAL NOT YET PAID
FILL A4
NOT REQUIRED
A4a. You selected [FILL A4] as your usual earnings. If this is wrong, please click the back button (below) and change it.
ALL
REQUIRED
A4b. Are you currently working at [NAME OF SOCIAL ENTERPRISE FROM QUESTION I3]?
(PROXY)
Yes ........................................................................................................................ 1 GO TO A5a
No ......................................................................................................................... 0

Prepared by Mathematica Policy Research 4
ALL
FILL NAME OF SOCIAL ENTERPRISE FROM QUESTION I3
NOT REQUIRED
A5. What was the last day you worked at [NAME OF SOCIAL ENTERPRISE FROM QUESTION I3]? Your best guess is fine.
(PROXY)
STOP DATE GO TO A6 MONTH DAY YEAR (JAN-DEC) (1-31) (2012-2013)
IF A5 DOES NOT HAVE AN ANSWER OR A4b=1
REQUIRED
A5a. Are you currently working in a temporary or permanent position?
(PROXY)
Temporary ............................................................................................................ 1
Permanent ............................................................................................................ 0 A5a HAS A RESPONSE
REQUIRED
A5b. What day did you begin your current position? Your best guess is fine.
Think about your work at [NAME OF SOCIAL ENTERPRISE FROM QUESTION I3] before you started your current position. Please answer the remaining questions about your work during that time.
(PROXY)
START DATE MONTH DAY YEAR (JAN-DEC) (1-31) (2012-2013)
ALL
FILL NAME OF SOCIAL ENTERPRISE FROM QUESTION I3
NOT REQUIRED
A6. How difficult was it for you to take an hour or two off during work hours to take care of personal or family matters when you worked at [NAME OF SOCIAL ENTERPRISE FROM QUESTION I3]?
Not difficult at all ................................................................................................... 1
Not too difficult ...................................................................................................... 2
Somewhat difficult ................................................................................................ 3
Very difficult .......................................................................................................... 4
Prepared by Mathematica Policy Research 5
ALL
FILL NAME OF SOCIAL ENTERPRISE
NOT REQUIRED
A7. Please rate how satisfied you are with the job you held at [NAME OF SOCIAL ENTERPRISE FROM QUESTION I3] with respect to each of the following. Were you very satisfied, somewhat satisfied, somewhat dissatisfied, or very dissatisfied?
VERY SATISFIED
SOMEWHAT SATISFIED
SOMEWHAT DISSATISFIED
VERY DISSATISFIED
a. Your salary (the amount of money you made) 1 2 3 4
b. The benefits you received 1 2 3 4
c. The type of work you did 1 2 3 4
d. The number of hours you worked 1 2 3 4
e. Where the job was located 1 2 3 4
f. How secure you felt in keeping the job 1 2 3 4
g. The opportunities for you to move up in the company 1 2 3 4
h. How much it challenged you intellectually 1 2 3 4
i. The level of responsibility you were given 1 2 3 4
j. How much independence you had in your work 1 2 3 4
k. How much the job contributed to society 1 2 3 4
l. Getting feedback about how well you were doing the job 1 2 3 4
m. Getting the support you needed 1 2 3 4
Prepared by Mathematica Policy Research 6
IF A4b=0
FILL NAME OF SOCIAL ENTERPRISE FROM QUESTION I3
NOT REQUIRED
A8. What was the main reason that you left [NAME OF SOCIAL ENTERPRISE FROM QUESTION I3]? Please tell me the one
(PROXY)
response that best describes why you left [NAME OF SOCIAL ENTERPRISE FROM QUESTION I3].
INTERVIEWER: HAND THE CLIENT THE CARD THAT LISTS THE RESPONSES BELOW. THEN MARK THE ANSWER THAT APPLIES.
I found a job/employed outside of [NAME OF SOCIAL ENTERPRISE FROM QUESTION I3] .......................................................................................... 1
Promoted to a higher level position/permanent position at [NAME OF SOCIAL ENTERPRISE FROM QUESTION I3] ................................................... 2
Moved ................................................................................................................... 3
Started other school/training ................................................................................. 4
Not interested ....................................................................................................... 5
Didn’t like working at [NAME OF SOCIAL ENTERPRISE FROM QUESTION I3] ...................................................................................................... 6
Illness .................................................................................................................... 7
Pregnancy or childcare issues .............................................................................. 8
Other family reasons ............................................................................................ 9
Transportation/logistical problems ........................................................................ 10
Personal problems ................................................................................................ 11
[NAME OF SOCIAL ENTERPRISE FROM QUESTION I3] poorly run ................ 12
I don’t think working at [NAME OF SOCIAL ENTERPRISE FROM QUESTION I3] would help me find another job ................................................... 13
I decided I didn’t want a job .................................................................................. 14
Incarcerated/jail .................................................................................................... 15
Drug use ............................................................................................................... 16
Terminated by [NAME OF SOCIAL ENTERPRISE FROM QUESTION I3] due to conflict with supervisor .............................................................................. 17
Terminated by [NAME OF SOCIAL ENTERPRISE FROM QUESTION I3] due to failure to meet program requirements (e.g., attendance) .......................... 18
Terminated by [NAME OF SOCIAL ENTERPRISE FROM QUESTION I3] due to conflicts with other employees .................................................................. 19
Terminated by [NAME OF SOCIAL ENTERPRISE FROM QUESTION I3] due to work performance issues........................................................................... 20
Terminated for another reason (SPECIFY) .......................................................... 98
Specify (STRING 200)

Prepared by Mathematica Policy Research 7
SECTION 3: RECIDIVISM ALL
FILL NAME OF SOCIAL ENTERPRISE FROM QUESTION I3
REQUIRED
B1. Have you been arrested since you started work at [NAME OF SOCIAL ENTERPRISE FROM QUESTION I3]?
Yes ........................................................................................................................ 1
No ......................................................................................................................... 0 GO TO C1
DON’T KNOW/REFUSED .................................................................................... 99 GO TO C1 IF B1=1
FILL NAME OF SOCIAL ENTERPRISE FROM QUESTION I3
NOT REQUIRED
B1a. How many times have you been arrested since you started work at [NAME OF SOCIAL ENTERPRISE FROM QUESTION I3]?
NUMBER OF ARRESTS (RANGE 0-50)
IF B1 GT 0
FILL NAME OF SOCIAL ENTERPRISE FROM QUESTION I3
NOT REQUIRED
B2. Since you started at [NAME OF SOCIAL ENTERPRISE FROM QUESTION I3] have you ever been in jail or prison?
Yes ........................................................................................................................ 1
No ......................................................................................................................... 0
DON’T KNOW/REFUSED .................................................................................... 99 IF B1 GT 0
FILL NAME OF SOCIAL ENTERPRISE FROM QUESTION I3
REQUIRED
B3. Since you started at [NAME OF SOCIAL ENTERPRISE FROM QUESTION I3], have you ever been convicted and sentenced to jail or prison?
Please include any sentence you received, even if you did not serve any time.
Yes ........................................................................................................................ 1
No ......................................................................................................................... 0 GO TO C1
DON’T KNOW/REFUSED .................................................................................... 99 GO TO C1
Prepared by Mathematica Policy Research 8
IF B3=1
NOT REQUIRED
B4. When was your most recent conviction? Your best guess is fine.
CONVICTION MONTH AND YEAR Month Year
(JAN-DEC) (1940-2013) IF B3=1
FILL NAME OF SOCIAL ENTERPRISE FROM QUESTION I3
NOT REQUIRED
B5. Please think about all the prison sentences you received since you started at [NAME OF SOCIAL ENTERPRISE FROM QUESTION I3]. Please tell us the total length of those prison sentences, even if you did not serve all of them.
Your best guess is fine.
NUMBER OF (RANGE 1-365)
Days ...................................................................................................................... 1
Weeks ................................................................................................................... 2
Months .................................................................................................................. 3
Years .................................................................................................................... 4
DON’T KNOW/REFUSED .................................................................................... 99 IF B3=1
FILL NAME OF SOCIAL ENTERPRISE FROM QUESTION I3
REQUIRED
B6. Did you start on probation or parole since you started at [NAME OF SOCIAL ENTERPRISE FROM QUESTION I3]?
Yes ........................................................................................................................ 1
No ......................................................................................................................... 0 GO TO C1
DON’T KNOW/REFUSED .................................................................................... 99 GO TO C1
Prepared by Mathematica Policy Research 9
IF B6=1
NOT REQUIRED
B7. How long will you be in touch with your parole or probation officer?
NUMBER OF
(RANGE 1-365)
Days ...................................................................................................................... 1
Weeks ................................................................................................................... 2
Months .................................................................................................................. 3
Years .................................................................................................................... 4
DON’T KNOW/REFUSED .................................................................................... 99
Prepared by Mathematica Policy Research 10
SECTION 4: LIFE STABILITY ALL
FILL NAME OF SOCIAL ENTERPRISE FROM QUESTION I3
NOT REQUIRED
C1. Did you open any bank accounts, including a checking account, since you started at [NAME OF SOCIAL ENTERPRISE FROM QUESTION I3]?
Yes ........................................................................................................................ 1
No ......................................................................................................................... 0 ALL
FILL NAME OF SOCIAL ENTERPRISE
NOT REQUIRED
C2. Did you work at another job while working at [NAME OF SOCIAL ENTERPRISE FROM QUESTION I3]?
Yes ........................................................................................................................ 1
No ......................................................................................................................... 0 GO TO C4 IF C2=1
FILL NAME OF SOCIAL ENTERPRISE FROM QUESTION I3
NOT REQUIRED
C3. What is your best guess of your total monthly earnings (money from work) that you made from all of your jobs, including the money you made at [NAME OF SOCIAL ENTERPRISE FROM QUESTION I3]?
We would like to know how much you made before taxes and other deductions. Please include tips, commissions, and regular overtime.
(PROXY)
TOTAL MONTHLY EARNINGS (RANGE $625 TO $10,416) IF C3 GT $10,416 OR LT $625
FILL C3
NOT REQUIRED
C3a. You selected [FILL C3] as your total monthly earnings. If this is wrong, please click the back button (below) and change it.
Prepared by Mathematica Policy Research 11
ALL
FILL NAME OF SOCIAL ENTERPRISE FROM QUESTION I3
NOT REQUIRED
C4. What was the total amount of Earned Income Tax Credit (EITC) you received since you started at [NAME OF SOCIAL ENTERPRISE FROM QUESTION I3]?
Your best guess if fine.
INTERVIEWER: ENTER 0 IF THE CLIENT DID NOT RECEIVE ANY EITC
TOTAL EITC (RANGE 0-40,000)
Prepared by Mathematica Policy Research 12
ALL
FILL NAME OF SOCIAL ENTERPRISE FROM QUESTION I3
NOT REQUIRED
C5. Since you started at [NAME OF SOCIAL ENTERPRISE FROM QUESTION I3], did you stop, start, or never receive benefits or income from the following sources?
If you started receiving benefits or income from the source, please tell me the amount you received per month. INTERVIEWER: IF CLIENT SAYS THEY RECEIVED THE BENEFIT OR INCOME BOTH
BEFORE AND AFTER STARTING AT [NAME OF SOCIAL ENTERPRISE FROM QUESTION I3], PLEASE SELECT ‘RECEIVED BOTH PERIODS.’
IF
STARTED
YES,
STOPPED YES,
STARTED
RECEIVED BOTH
PERIODS NEVER
RECEIVED
TOTAL AMOUNT
PER MONTH
a. Food Stamp or SNAP benefits? 1 2 3 4
b. Welfare programs such as TANF, General Assistance or GA, CAL Works, or Safety Net? 1 2 3 4
c. SSI, SSDI, or other disability benefits? 1 2 3 4
d. Social Security or pension benefits? 1 2 3 4
e. Unemployment Insurance benefits or UI? 1 2 3 4
f. WIC benefits? 1 2 3 4
g. Worker’s Compensation benefits? 1 2 3 4
h. Alimony, child support, or rent payments? 1 2 3 4
i. Interest and/or dividends? 1 2 3 4
j. Money from friends or relatives? 1 2 3 4
k. Non-monetary support from friends or relatives (for example, food, rent support, or help paying bills)? 1 2 3 4
l. Any other income sources? (SPECIFY) 1 2 3 4
(STRING 75)

Prepared by Mathematica Policy Research 13
ALL
NOT REQUIRED
C6. In general would you say your physical health is…
Excellent, ............................................................................................................. 1
Very good, ........................................................................................................... 2
Good, ................................................................................................................... 3
Fair, or .................................................................................................................. 4
Poor? ................................................................................................................... 5 ALL
FILL NAME OF SOCIAL ENTERPRISE FROM QUESTION I3
NOT REQUIRED
C7. Did your physical health change since you started work at [NAME OF SOCIAL ENTERPRISE FROM QUESTION I3]?
Yes ........................................................................................................................ 1
No ......................................................................................................................... 0 ALL
NOT REQUIRED
C8. During the past 7 days, how often did you feel distressed or bothered by the following feelings—never, a little bit, moderately, quite a bit, or extremely often?
NEVER
A LITTLE BIT MODERATELY
QUITE A BIT
EXTREMELY OFTEN
a. feeling no interest in things? 1 2 4 3 4
b. feeling lonely? 1 2 4 3 4
c. feeling blue? 1 2 4 3 4
d. feelings of worthlessness? 1 2 4 3 4
e. feeling hopeless about the future? 1 2 4 3 4
f. thoughts of ending your life? 1 2 4 3 4
Prepared by Mathematica Policy Research 14
ALL
REQUIRED
C9. Do you now have an emotional or other health condition that limits the amount or type of work you could do?
Yes ........................................................................................................................ 1
No ......................................................................................................................... 0 GO TO C11
DON’T KNOW/REFUSED .................................................................................... 99 GO TO C11 IF C9=1
NOT REQUIRED
C10. What condition is the main reason you are limited?
By what name do doctors call your health condition?
NAME OF CONDITION (STRING 75) ALL
FILL NAME OF SOCIAL ENTERPRISE FROM QUESTION I3
NOT REQUIRED
C11. Since you started at [NAME OF SOCIAL ENTERPRISE FROM QUESTION I3], how frequently did you have four or more drinks in one day?
TIMES (RANGE 1-100)
Never .................................................................................................................... 0 GO TO C13
DON’T KNOW/REFUSED .................................................................................... 99 GO TO C13 C11 DOES NOT EQUAL ‘NEVER’ OR ‘DON’T KNOW/REFUSED’
FILL NAME OF SOCIAL ENTERPRISE FROM QUESTION I3
NOT REQUIRED
C12. Since you started at [NAME OF SOCIAL ENTERPRISE FROM QUESTION I3] was there ever a time when your drinking or being hung over interfered with your job, school, or home life?
Yes ........................................................................................................................ 1
No ......................................................................................................................... 0
DON’T KNOW/REFUSED .................................................................................... 99

Prepared by Mathematica Policy Research 15
ALL
FILL NAME OF SOCIAL ENTERPRISE FROM QUESTION I3
NOT REQUIRED
C13. Since you started at [NAME OF SOCIAL ENTERPRISE FROM QUESTION I3] have you been in counseling or therapy for alcohol problems?
Yes ........................................................................................................................ 1
No ......................................................................................................................... 0
DON’T KNOW/REFUSED .................................................................................... 99 ALL
FILL NAME OF SOCIAL ENTERPRISE FROM QUESTION I3
NOT REQUIRED
C14. Since you started at [NAME OF SOCIAL ENTERPRISE FROM QUESTION I3], how often did you smoke marijuana or hashish (pot, grass, hash)?
TIMES (RANGE 1-365)
Never .................................................................................................................... 0
DON’T KNOW/REFUSED .................................................................................... 99 ALL
FILL NAME OF SOCIAL ENTERPRISE FROM QUESTION I3
NOT REQUIRED
C15. Since you started at [NAME OF SOCIAL ENTERPRISE FROM QUESTION I3], how often did you use any hard drugs such as heroin, cocaine, or LSD?
TIMES (RANGE 1-365)
Never .................................................................................................................... 0
DON’T KNOW/REFUSED .................................................................................... 99 ALL
FILL NAME OF SOCIAL ENTERPRISE FROM QUESTION I3
NOT REQUIRED
C16. Since you started at [NAME OF SOCIAL ENTERPRISE FROM QUESTION I3] have you been in counseling or therapy for drug problems?
Yes ........................................................................................................................ 1
No ......................................................................................................................... 0
DON’T KNOW/REFUSED .................................................................................... 99
Prepared by Mathematica Policy Research 16
ALL
FILL NAME OF SOCIAL ENTERPRISE FROM QUESTION I3
REQUIRED
C17. Are you staying in the same place you were staying when you started at [NAME OF SOCIAL ENTERPRISE FROM QUESTION I3]?
Yes ........................................................................................................................ 1 GO TO F1
No ......................................................................................................................... 0
DON’T KNOW/REFUSED .................................................................................... 99 ALL
NOT REQUIRED
C18. Where did you spend the night most of last week? Please tell me the one
INTERVIEWER: HAND THE CLIENT THE CARD THAT LISTS THE RESPONSES BELOW. THEN SELECT THE ANSWER THAT APPLIES.
response that best describes where you stayed the most.
Emergency shelter, including hotel or motel voucher paid for by a social service or charitable organization ......................................................... 1
Transitional housing for homeless persons .................................................... 2
Permanent supportive housing for formerly homeless persons .................. 3
Psychiatric hospital or other psychiatric facility ............................................ 4
Substance abuse treatment facility, rehabilitation center, or other detox facility ........................................................................................................ 5
Hospital (non-psychiatric) ................................................................................. 6
Jail, prison or juvenile detention facility .......................................................... 7
Half-way house or three-quarter-way home for persons with criminal offenses ............................................................................................................... 8
Room, apartment or house that you rent ......................................................... 9
Apartment or house that you own .................................................................... 10
In a friend’s or family member’s room, apartment or house ......................... 11
Hotel or motel paid for without emergency shelter voucher ......................... 12
Foster care home or foster care group home .................................................. 13
Group home or other supervised residential care facility ............................. 14
Street, car, park, other place outside ............................................................... 15
Other (Specify) ..................................................................................................... 98
Specify (STRING 75)

Prepared by Mathematica Policy Research 17
ALL
NOT REQUIRED
C19. How long have you stayed at that place? Your best guess is fine.
NUMBER OF (RANGE 1-365)
Days ...................................................................................................................... 1
Weeks ................................................................................................................... 2
Months .................................................................................................................. 3
Years .................................................................................................................... 4

Prepared by Mathematica Policy Research 18
SECTION 5: FACILITATING FACTORS ALL
FILL NAME OF SOCIAL ENTERPRISE FROM QUESTION I3
REQUIRED
F1. Since you started at [NAME OF SOCIAL ENTERPRISE FROM QUESTION I3], have you participated in any education and training programs and courses that were supposed to lead to a degree, license or certificate?
PROBE: Please include training programs that helped you learn job skills or prepare for an occupation, as well as general educational programs, such as college, regular high school, or GED courses.
Yes ........................................................................................................................ 1
No ......................................................................................................................... 0 GO TO D1
DON’T KNOW/REFUSED .................................................................................... 99 GO TO D1 IF F1=1
FILL NAME OF SOCIAL ENTERPRISE FROM QUESTION I3
NOT REQUIRED
F2. Since you started at [NAME OF SOCIAL ENTERPRISE FROM QUESTION I3], how many different education and training programs have you participated in?
NUMBER OF EDUCATION AND TRAINING PROGRAMS (RANGE 0-30)
IF F1=1
REQUIRED
F3. Are you currently participating in any of these programs?
Yes ........................................................................................................................ 1
No ......................................................................................................................... 0 GO TO F5 and Grid 1-3
DON’T KNOW/REFUSED .................................................................................... 99 GO TO F5 and Grid 1-3
IF F3 = 1
NOT REQUIRED
F3A. In how many training and education programs are you currently participating?
NUMBER OF TRAINING AND EDUCATION PROGRAMS (RANGE 0-30)

Prepared by Mathematica Policy Research 19
IF F3=1
NOT REQUIRED
F4. What are the names of the programs in which you are currently participating?
INTERVIEWER: IF THERE ARE MORE THAN THREE PROGRAMS MENTIONED, ASK CLIENT TO TELL YOU THE NAMES OF THE THREE PROGRAMS WHERE THEY DEVOTED THE MOST TIME.
PROGRAM 1 (STRING 60)
PROGRAM 2 (STRING 60)
PROGRAM 3 (STRING 60) IF F2 GT 0
FILL NAME OF SOCIAL ENTERPRISE FROM QUESTION I3
NOT REQUIRED
F5. What are the names of the other programs in which you have participated since you started at [NAME OF SOCIAL ENTERPRISE FROM QUESTION I3]?
INTERVIEWER: IF THERE ARE MORE THAN THREE PROGRAMS MENTIONED, ASK CLIENT TO TELL YOU THE NAMES OF THE THREE PROGRAMS WHERE THEY DEVOTED THE MOST TIME.
PROGRAM 4 (STRING 60)
PROGRAM 5 (STRING 60)
PROGRAM 6 (STRING 60)
Did not participate in any other programs ............................................................ 1
PROGRAMMER BOX 2
PLEASE INCORPORATE QUESTIONS F6 THROUGH F10 INTO A GRID WITH 6 COLUMNS SO THAT PARTICIPANTS CAN FILL OUT TRAINING PROGRAM INFORMATION FOR THE 6 TRAINING PROGRAMS THEY’VE NAMED. THE COLUMN HEADERS SHOULD BE FILLS WITH THE NAME OF EACH OF THE TRAINING PROGRAMS IN F4 AND F5. THE FOLLOWING TEXT SHOULD BE INCLUDED AT THE BEGINNING OF THE GRID:
“INTERVIEWER: PLEASE ASK THE CLIENT THE QUESTIONS BELOW FOR EACH OF THE PROGRAMS THEY JUST TOLD YOU ABOUT...”
Prepared by Mathematica Policy Research 20
IF F1=1
NOT REQUIRED
F6. Did you complete this program?
Yes ........................................................................................................................ 1
No ......................................................................................................................... 0 IF F1=1
NOT REQUIRED
F7. What is the name of the certificate, degree, or license you received for completion of this program?
NAME OF CERTIFICATE (STRING 75) IF F1=1
NOT REQUIRED
F8. Is that a certificate, a license, or degree?
Certificate .............................................................................................................. 1
License ................................................................................................................. 2
Degree .................................................................................................................. 3
Other (SPECIFY) .................................................................................................. 98
Specify (STRING (NUM)) IF F8=98
NOT REQUIRED
F8A. If necessary, please specify the other type of certificate, license, or degree.
PROGRAM TYPE (STRING 300)
Prepared by Mathematica Policy Research 21
IF F1=1
NOT REQUIRED
F9. What kind of work is this certificate, degree, or license for? That is, what kind of job would you be prepared to do?
KIND OF WORK (STRING 100) IF F1=1
NOT REQUIRED
F10. What was the major subject or field of study for this certificate, degree, or license?
MAJOR SUBJECT
PROGRAMMER BOX 3
END GRID

Prepared by Mathematica Policy Research 22
SECTION 6: DEMOGRAPHICS ALL
NOT REQUIRED
D1. What is your current marital status—are you now…
Married, ................................................................................................................ 1
In a domestic partnership, ................................................................................. 2
Separated, ........................................................................................................... 3
Divorced, ............................................................................................................. 4
Widowed, or ........................................................................................................ 5
Single? ................................................................................................................. 6 ALL
FILL NAME OF SOCIAL ENTERPRISE FROM QUESTION I3
REQUIRED
D2. Did you gain or lose financial responsibility or responsibility for the day-to-day activities of anyone since you started work at [NAME OF SOCIAL ENTERPRISE FROM QUESTION I3], that is, did you gain or lose dependents? The person or people do not necessarily need to live with you.
Yes ........................................................................................................................ 1
No ......................................................................................................................... 0 GO TO D4a
DON’T KNOW/REFUSED .................................................................................... 99 GO TO D4a

Prepared by Mathematica Policy Research 23
IF D2=1
NOT REQUIRED
D2a. How many dependents did you gain or lose? The person or people do not necessarily need to live with you.
INTERVIEWER: ENTER 0 IF THE RESPONDENT HAS NO DEPENDENTS
INTERVIEWER: ENTER 99 IF THE RESPONDENT SAYS DON’T KNOW OR REFUSES TO ANSWER THE QUESTION.
INTERVIEWER: IF THERE ARE MORE THAN FIFTEEN DEPENDENTS MENTIONED, ENTER 15 IN THE SPACE BELOW AND TELL THE CLIENT THE NEXT QUESTIONS WILL ASK ABOUT THE FIFTEEN DEPENDENTS FOR WHOM THEY HAVE THE BIGGEST FINANCIAL RESPONSIBILITY.
NUMBER OF PEOPLE IF 0 OR 99, GO TO D4a (RANGE 0-15)
PROGRAMMER BOX 4
PLEASE INCORPORATE QUESTIONS D3a THROUGH D3g INTO A GRID WITH 5 COLUMNS. THE COLUMNS WILL APPEAR ACROSS 3 SCREENS SO THAT PARTICIPANTS CAN FILL OUT INFORMATION FOR THE 15 HOUSEHOLD MEMBERS THEY’VE NAMED. THE COLUMN HEADERS SHOULD BE “PERSON 1,” “PERSON 2,” ETC.
TOP OF GRID SHOULD READ “INTERVIEWER: PLEASE ASK THE CLIENT EACH OF THE QUESTIONS BELOW FOR EACH DEPENDENT THEY TOLD YOU ABOUT.”
IF D2=1 AND D2a DOES NOT EQUAL 0 AND D2a DOES NOT EQUAL 99
NOT REQUIRED
D3a. Did you gain or lose responsibility for this dependent?
Gain ...................................................................................................................... 1
Lose ...................................................................................................................... 2

Prepared by Mathematica Policy Research 24
IF D2=1 AND D2a DOES NOT EQUAL 0 AND D2a DOES NOT EQUAL 99
NOT REQUIRED
D3b. What is their relationship to you?
Spouse/partner ..................................................................................................... 1
Boyfriend/girlfriend ................................................................................................ 2
Child (natural, step, or custodial) .......................................................................... 3
Parent or stepparent ............................................................................................. 4
Grandparent, aunt, uncle ...................................................................................... 5
Sibling (brother or sister) ...................................................................................... 6
Nephew or niece, cousin ...................................................................................... 7
Grandchild ............................................................................................................ 8
Other relative or in-law ......................................................................................... 9
Non-relative (including roomer or boarder) .......................................................... 10
Other (SPECIFY) .................................................................................................. 98
Specify (STRING (NUM)) IF D2=1 AND D2a DOES NOT EQUAL 0 AND D2a DOES NOT EQUAL 99
NOT REQUIRED
D3b1. If necessary, please specify their relationship to you.
RELATIONSHIP (STRING 300) IF D2=1 AND D2a DOES NOT EQUAL 0 AND D2a DOES NOT EQUAL 99
NOT REQUIRED
D3c. Are they male or female?
Male ...................................................................................................................... 1
Female .................................................................................................................. 2 IF D2=1 AND D2a DOES NOT EQUAL 0 AND D2a DOES NOT EQUAL 99
NOT REQUIRED
D3d. Approximately how old are they?
YEARS OLD (RANGE 0-99)
Prepared by Mathematica Policy Research 25
IF D2=1 AND D2a DOES NOT EQUAL 0 AND D2a DOES NOT EQUAL 99
NOT REQUIRED
D3e. Are you financially responsible for them, responsible for their day-to day activities, or both?
Financially responsible ......................................................................................... 1
Responsible for day-to-day activities .................................................................... 2
Both ...................................................................................................................... 3 IF D2=1 AND D2a DOES NOT EQUAL 0 AND D2a DOES NOT EQUAL 99
NOT REQUIRED
D3g. What type of health insurance plans are they currently covered by? INTERVIEWER: IF RESPONDENT CHOOSES MORE THAN ONE, SELECT ONE
RESPONSE IN THE DROP DOWN MENU AND WRITE THE OTHER CHOICES BELOW IN D3h.
Currently not covered by any health insurance .................................................... 1
Medicaid/Medicare ............................................................................................... 2
An employer or union sponsored health plan ....................................................... 3
Military health care ............................................................................................... 4
Other government health plan (SPECIFY) ........................................................... 5
Specify (STRING (NUM))
Insurance purchased directly from an insurer ...................................................... 6
Other type of health insurance (SPECIFY) .......................................................... 98
Specify (STRING (NUM))
DON’T KNOW/REFUSED .................................................................................... 99 IF D2=1 AND D2a DOES NOT EQUAL 0 AND D2a DOES NOT EQUAL 99
NOT REQUIRED
D3h. If necessary, please specify the type of health insurance.
HEALTH INSURANCE (STRING 100)
PROGRAMMER BOX 5
END GRID
Prepared by Mathematica Policy Research 26
ALL
NOT REQUIRED
D4. What kind of health insurance plans are YOU currently covered by?
INTERVIEWER: MARK ALL THAT APPLY
Not currently covered by health insurance ........................................................... 1
Medicaid/Medicare ............................................................................................... 2
An employer or union sponsored health plan ....................................................... 3
A government program other than Medicaid or Medicare .................................... 4
Military health care ............................................................................................... 5
Insurance purchased directly from an insurer ...................................................... 4
Some other type of health insurance (SPECIFY IN NEXT QUESTION) ............. 98
Don’t know ............................................................................................................ 99 ALL
NOT REQUIRED
D4a. If necessary, please specify the type of health insurance.
HEALTH INSURANCE (STRING 100)
Prepared by Mathematica Policy Research 27
SECTION 7: LOCATING We would like to contact you again in the future to see how you are doing and update our information. This information is completely voluntary and you may choose not to answer specific questions without penalty. Your decision whether to answer these questions will have no influence on any present or future benefits from [NAME OF SOCIAL ENTERPRISE FROM QUESTION I3]. ALL
NOT REQUIRED
L1. We would like to start by collecting information about how we might contact you. What is your address?
(STRING 50) Street Address 1 (Include apartment number)
(STRING 50) Street Address 2
(STRING 50) City
(STRING 2) State
(STRING 5)
Zip ALL
REQUIRED
L2. Are there any other names people call you?
Yes ........................................................................................................................ 1
No ......................................................................................................................... 0 GO TO L3
DON’T KNOW/REFUSED .................................................................................... 99 GO TO L3 IF L2=1
NOT REQUIRED
L2a. Please tell me those names.
ALTERNATIVE NAMES (STRING 200)
Prepared by Mathematica Policy Research 28
ALL
NOT REQUIRED
L3. Please give me your telephone number, area code first and email address if you have one.
TELEPHONE NUMBER
E-MAIL ADDRESS (STRING 70) ALL
REQUIRED
L4. Do you have another phone number or e-mail address?
Yes ........................................................................................................................ 1
No ......................................................................................................................... 0 GO TO L5a
DON’T KNOW/REFUSED .................................................................................... 99 GO TO L5a IF L4=1
NOT REQUIRED
L5. What is the other phone number and e-mail address?
SECOND PHONE NUMBER
E-MAIL ADDRESS (STRING 70) ALL
NOT REQUIRED
L5a. We would like to collect information about how we may contact you. Are your benefit checks or other mail sent to the address you just provided?
Yes ........................................................................................................................ 1 GO TO L14A
No ......................................................................................................................... 0
DON’T KNOW/REFUSED .................................................................................... 99 GO TO L14A
Prepared by Mathematica Policy Research 29
L5a=1
NOT REQUIRED
L6. Where are your benefit checks or other mail sent?
(STRING 50) Street Address 1 (Include apartment number)
(STRING 50) Street Address 2
(STRING 50) City
(STRING 2) State
(STRING 5)
Zip IF C18=1, 2, 3, 6, 7, 8, 11, 12, 13, 14, 15
NOT REQUIRED
L8. In case we have trouble reaching you, could you provide us with the name, address, and phone number of places you have stayed over the past year?
What is the name of the place you stayed most of the time last year?
HOUSING (STRING 200)
DON’T KNOW/REFUSED .................................................................................... 99 GO TO L14A
Prepared by Mathematica Policy Research 30
IF C18=1, 2, 3, 6, 7, 8, 11, 12, 13, 14, 15 AND L8 DOES NOTE EQUAL 99
NOT REQUIRED
L9. What is the address there?
(STRING 50) Street Address 1 (Include apartment number)
(STRING 50) Street Address 2
(STRING 50) City
(STRING 2) State
(STRING 5)
Zip IF C18=1, 2, 3, 6, 7, 8, 11, 12, 13, 14, 15 AND L8 DOES NOTE EQUAL 99
NOT REQUIRED
L10. What is their telephone number, area code first?
TELEPHONE NUMBER IF C18=1, 2, 3, 6, 7, 8, 11, 12, 13, 14, 15 AND L8 DOES NOTE EQUAL 99
REQUIRED
L11. Are there any other places that you have frequently stayed in over the past 12 months?
Yes ........................................................................................................................ 1
No ......................................................................................................................... 0 GO TO L14A
Don’t Know ........................................................................................................... 99 GO TO L14A IF L11=1
NOT REQUIRED
L12. What is the name of that place?
HOUSING (STRING 200)
Prepared by Mathematica Policy Research 31
IF L11=1
NOT REQUIRED
L13. What is the address there?
(STRING 50) Street Address 1 (Include apartment number)
(STRING 50) Street Address 2
(STRING 50) City
(STRING 2) State
(STRING 5)
Zip IF L11=1
NOT REQUIRED
L14. What is their telephone number, area code first?
TELEPHONE NUMBER ALL
NOT REQUIRED
L14A. In case we have trouble reaching you, could you also provide us with the names, addresses, and phone numbers of three close relatives or friends who are not living with you and are likely to know your location in the future. For example, the individuals could be your mother, father, brother, sister, aunt, uncle, or close friend. Please provide information for individuals other than those who work with you at [NAME OF SOCIAL ENTERPRISE]. Do you have any individuals for whom you can provide contact information?
Yes ........................................................................................................................ 0
No ......................................................................................................................... 99 GO TO L30
Prepared by Mathematica Policy Research 32
L14A=1
NOT REQUIRED
L15. What is the name and address of your first contact person?
(STRING 50) First Name
(STRING 1) Middle Initial
(STRING 50) Last Name
(STRING 50) Street Address 1 (Include apartment number)
(STRING 50) Street Address 2
(STRING 50) City
(STRING 2) State
(STRING 5)
Zip L14A=1
NOT REQUIRED
L16. Please give me their telephone number, area code first and e-mail address if they have one.
TELEPHONE NUMBER
E-MAIL ADDRESS (STRING 70) L14A=1
REQUIRED
L17. Do you have another phone number or e-mail address for this person?
Yes ........................................................................................................................ 1
No ......................................................................................................................... 0 GO TO L19
DON’T KNOW/REFUSED .................................................................................... 99 GO TO L19

Prepared by Mathematica Policy Research 33
L14A=1 AND L17=1
NOT REQUIRED
L18. What is the other phone number and e-mail address?
SECOND PHONE NUMBER
E-MAIL ADDRESS (STRING 70) L14A=1
NOT REQUIRED
L19. How are they related to you, if at all?
Spouse/partner ..................................................................................................... 1
Mother ................................................................................................................... 2
Father ................................................................................................................... 3
Son or daughter .................................................................................................... 4
Grandparent.......................................................................................................... 5
Brother/sister ........................................................................................................ 6
Aunt/uncle of ......................................................................................................... 7
Other relative ........................................................................................................ 8
Not related ............................................................................................................ 9
Staff at residence .................................................................................................. 10 L14A=1
REQUIRED
L19A. Do you have a second contact person?
Yes ........................................................................................................................ 1
No ......................................................................................................................... 0 GO TO L30
Prepared by Mathematica Policy Research 34
L19=1
NOT REQUIRED
L20. What is the name and address of your second contact person?
(STRING 50) First Name
(STRING 1) Middle Initial
(STRING 50) Last Name
(STRING 50) Street Address 1 (Include apartment number)
(STRING 50) Street Address 2
(STRING 50) City
(STRING 2) State
(STRING 5)
Zip L19=1
NOT REQUIRED
L21. Please give me their telephone number, area code first and e-mail address if they have one.
TELEPHONE NUMBER
E-MAIL ADDRESS (STRING 70) L19=1
REQUIRED
L22. Do you have another phone number or e-mail address for this person?
Yes ........................................................................................................................ 1
No ......................................................................................................................... 0 GO TO L24
DON’T KNOW/REFUSED .................................................................................... 99 GO TO L24
Prepared by Mathematica Policy Research 35
L19=1 AND L22=1
NOT REQUIRED
L23. What is the other phone number and e-mail address?
SECOND PHONE NUMBER
E-MAIL ADDRESS (STRING 70) L19=1
NOT REQUIRED
L24. How are they related to you, if at all?
Spouse/partner ..................................................................................................... 1
Mother ................................................................................................................... 2
Father ................................................................................................................... 3
Son or daughter .................................................................................................... 4
Grandparent.......................................................................................................... 5
Brother/sister ........................................................................................................ 6
Aunt/uncle ............................................................................................................. 7
Other relative ........................................................................................................ 8
Not related ............................................................................................................ 9
Staff at residence .................................................................................................. 10 L19A=1
REQUIRED
L24A. Do you have a third contact person?
Yes ........................................................................................................................ 1
No ......................................................................................................................... 0 GO TO L30

Prepared by Mathematica Policy Research 36
L24A=1
NOT REQUIRED
L25. What is the name and address of your third contact person?
(STRING 50) First Name
(STRING 1) Middle Initial
(STRING 50) Last Name
(STRING 50) Street Address 1 (Include apartment number)
(STRING 50) Street Address 2
(STRING 50) City
(STRING 2) State
(STRING 5)
Zip L24A=1
NOT REQUIRED
L26. Please give me their telephone number, area code first and e-mail address if they have one.
TELEPHONE NUMBER
E-MAIL ADDRESS (STRING 70) L24A=1
REQUIRED
L27. Do you have another phone number or e-mail address for this person?
Yes ........................................................................................................................ 1
No ......................................................................................................................... 0 GO TO L29
DON’T KNOW/REFUSED .................................................................................... 99 GO TO L29
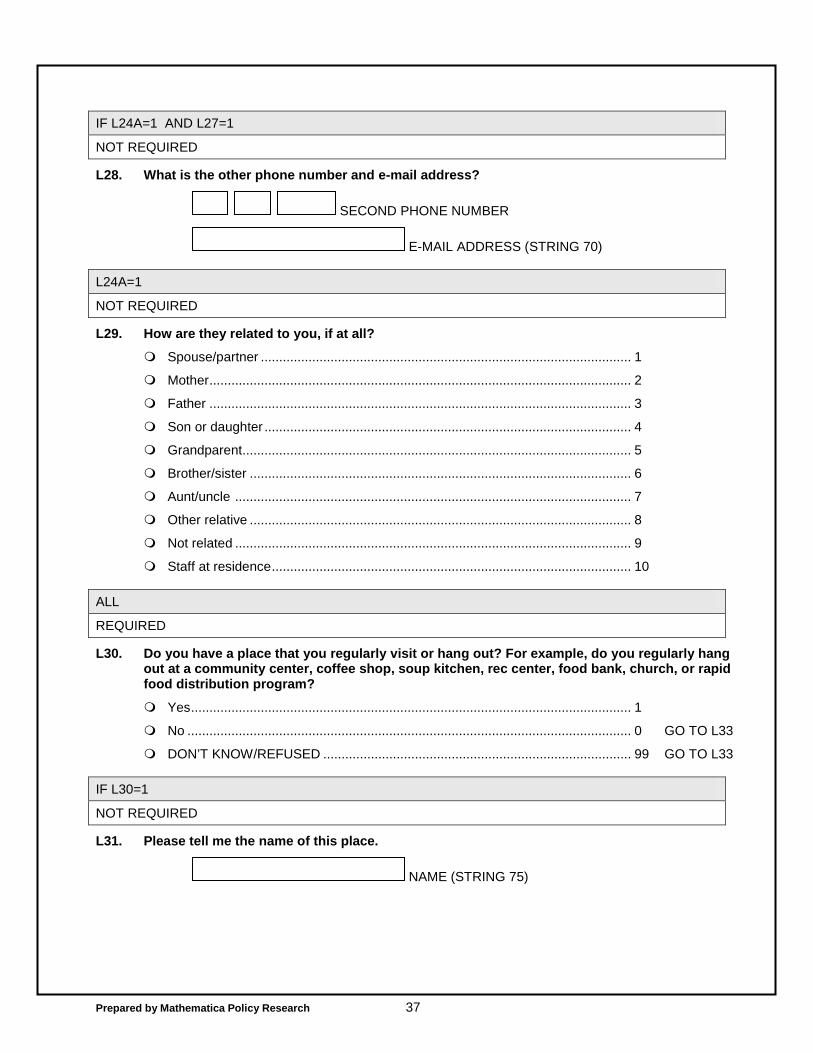
Prepared by Mathematica Policy Research 37
IF L24A=1 AND L27=1
NOT REQUIRED
L28. What is the other phone number and e-mail address?
SECOND PHONE NUMBER
E-MAIL ADDRESS (STRING 70) L24A=1
NOT REQUIRED
L29. How are they related to you, if at all?
Spouse/partner ..................................................................................................... 1
Mother ................................................................................................................... 2
Father ................................................................................................................... 3
Son or daughter .................................................................................................... 4
Grandparent.......................................................................................................... 5
Brother/sister ........................................................................................................ 6
Aunt/uncle ............................................................................................................ 7
Other relative ........................................................................................................ 8
Not related ............................................................................................................ 9
Staff at residence .................................................................................................. 10 ALL
REQUIRED
L30. Do you have a place that you regularly visit or hang out? For example, do you regularly hang out at a community center, coffee shop, soup kitchen, rec center, food bank, church, or rapid food distribution program?
Yes ........................................................................................................................ 1
No ......................................................................................................................... 0 GO TO L33
DON’T KNOW/REFUSED .................................................................................... 99 GO TO L33 IF L30=1
NOT REQUIRED
L31. Please tell me the name of this place.
NAME (STRING 75)

Prepared by Mathematica Policy Research 38
IF L30=1
NOT REQUIRED
L32. What is the address of this place?
(STRING 50) Street Address 1 (Include apartment number)
(STRING 50) Street Address 2
(STRING 50) City
(STRING 2) State
(STRING 5)
Zip

Prepared by Mathematica Policy Research 39
IF B6=1
NOT REQUIRED
L33. Finally, in case we have trouble reaching you, could you provide us with the name, address, phone number, and email address of your parole or probation officer? This information is completely voluntary.
What is the name and address of your parole or probation officer?
(STRING 50) First Name
(STRING 1) Middle Initial
(STRING 50) Last Name
(STRING 50) Street Address 1 (Include apartment number)
(STRING 50) Street Address 2
(STRING 50) City
(STRING 2) State
(STRING 5)
Zip IF B6=1
NOT REQUIRED
L34. What is your parole or probation officer’s telephone number?
TELEPHONE NUMBER

Prepared by Mathematica Policy Research 40
IF B6=1
NOT REQUIRED
L35. What is your parole or probation officer’s cell phone number and e-mail address?
CELL PHONE NUMBER
E-MAIL ADDRESS
Thank you very much for your time. We appreciate your help.
L36. INTERVIEWER: PLEASE ENTER HOW MANY MINUTES IT TOOK YOU TO COMPLETE THIS SURVEY. YOUR BEST GUESS IS FINE.
MINUTES (0-240)
INTERVIEWER: PLEASE PUSH THE ‘FINISH’ BUTTON TO COMPLETE THE SURVEY.

This page has been left blank for double-sided copying.

D.2. ORGANIZATIONS: STRUCTURED INSTRUMENTS

This page has been left blank for double-sided copying.
D.2A. EMPLOYEE SUPPORT CHECKLIST

This page has been left blank for double-sided copying.
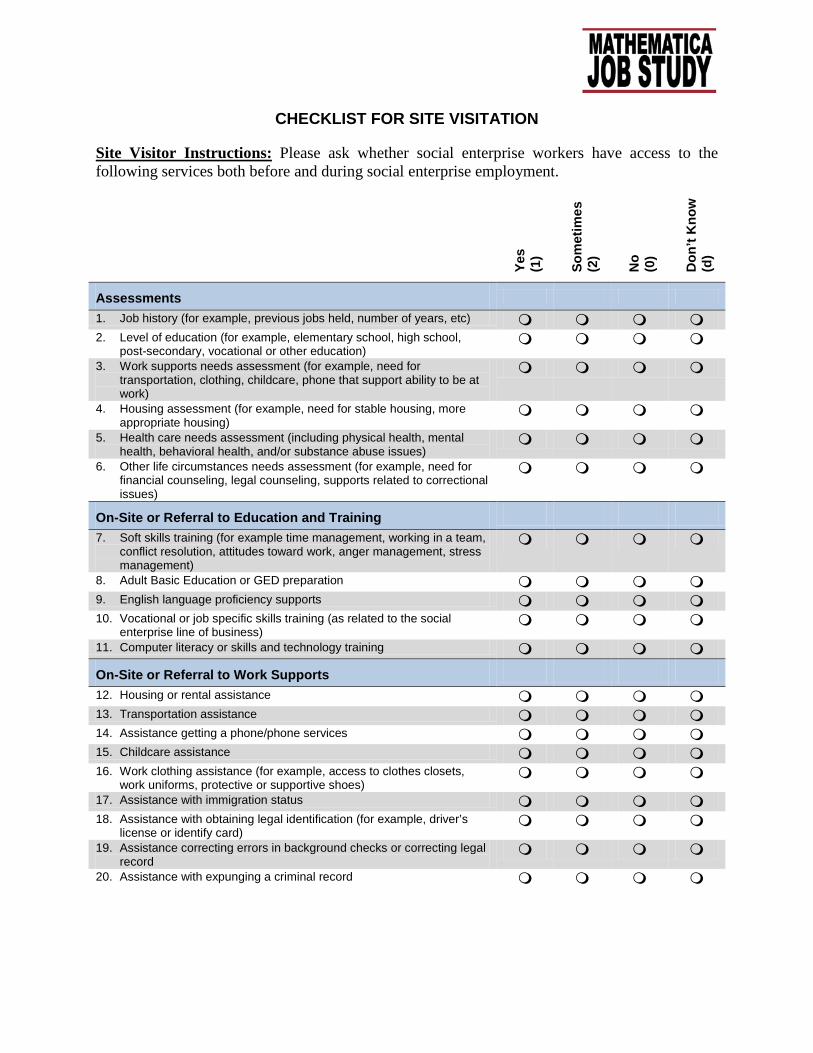
CHECKLIST FOR SITE VISITATION
Site Visitor Instructions:
Please ask whether social enterprise workers have access to the following services both before and during social enterprise employment.
Yes
(1)
Som
etim
es
(2)
No
(0)
Don
’t K
now
(d
)
Assessments
1. Job history (for example, previous jobs held, number of years, etc) 2. Level of education (for example, elementary school, high school,
post-secondary, vocational or other education)
3. Work supports needs assessment (for example, need for transportation, clothing, childcare, phone that support ability to be at work)
4. Housing assessment (for example, need for stable housing, more appropriate housing)
5. Health care needs assessment (including physical health, mental health, behavioral health, and/or substance abuse issues)
6. Other life circumstances needs assessment (for example, need for financial counseling, legal counseling, supports related to correctional issues)
On-Site or Referral to Education and Training 7. Soft skills training (for example time management, working in a team,
conflict resolution, attitudes toward work, anger management, stress management)
8. Adult Basic Education or GED preparation 9. English language proficiency supports 10. Vocational or job specific skills training (as related to the social
enterprise line of business)
11. Computer literacy or skills and technology training
On-Site or Referral to Work Supports 12. Housing or rental assistance 13. Transportation assistance 14. Assistance getting a phone/phone services 15. Childcare assistance 16. Work clothing assistance (for example, access to clothes closets,
work uniforms, protective or supportive shoes)
17. Assistance with immigration status 18. Assistance with obtaining legal identification (for example, driver’s
license or identify card)
19. Assistance correcting errors in background checks or correcting legal record
20. Assistance with expunging a criminal record

Yes
(1)
Som
etim
es
(2)
No
(0)
Don
’t K
now
(d
)
On-Site or Referral to Life Stability Supports 21. Child custody assistance 22. Physical health services 23. Assistance with a physical or learning disability 24. Mental health services 25. Substance abuse counseling or treatment 26. Domestic abuse protection, counseling or other services 27. Financial education and asset building (for example, budgeting, EITC,
savings assistance, financial literacy, IDAs, (re)building credit)
28. Help with setting up a bank account (for example, checking account and direct deposit)
29. Assistance with legal services 30. Assistance with food stability or food security (food pantries, reduced
price meals, nutritional education)
31. Access to public benefits (for example, food stamps, Medicaid, SSI) 32. Help with tax preparation 33. Help plan to avoid relapse of behavior
Social Enterprise Employment Transition Supports 34. Job readiness skills training (for example, resume preparation,
interview skills, goal setting)
35. Career counseling or job coaching (for example, career pathways, advancement)
36. Job search assistance 37. Job mentoring 38. Job development (for example, employer-employee job matching,
individual job counseling, participant job-placement)
Post-Social Enterprise Services 39. Access to employment counselor or other services related to
employment (for example, to address work-related challenges, support job retention and advancement, identify new job opportunities)
40. Access to staff or services that support life stability (for example, to address challenges with substance abuse, mental health, housing, childcare, financial stability, or other services)
41. Support groups (for example, on self-empowerment, job retention) 42. Other (Please specify): Notes:

D.2B. DATA-DRIVEN DECISION MAKING:
ORGANIZATIONS

This page has been left blank for double-sided copying.

DATA DRIVEN DECISION MAKING
INTRODUCTION
Welcome to the Mathematica Job Study survey on using data to make decisions! We invite you to participate in this survey and hope you will find it interesting to describe if and how your organization uses data. By completing this survey, you will help us better understand what types of information organizations like yours collect, review, and use to help support your social enterprise and its employees.
There are no wrong answers to these questions and this survey is in no way an assessment of your job performance, functioning, or role. Indeed, your identity will be kept confidential and will not be shared with anyone beyond the research team and your name will not be on the survey. The information you provide will be combined with information from other individuals to help provide a general portrait of how information is being used to make decisions about social enterprise employees and operations. You may refuse to answer specific questions or discontinue your participation at any time.
The survey asks questions about: (1) the types of information or data that your organization collects on your social enterprise employees; (2) the types of information your organization analyzes; (3) how your organization uses data; (4) resources available for data collection and analysis; (5) your views on data collection and use; (6) who leads and who participates in using data to make decisions; and (7) your additional comments as well as some information about you. The survey should take no more than 15 minutes to complete.
As you read through the survey, answer each question with the response that best fits your experience or opinion. For most questions this means selecting the circle associated with your answer; for a small number of other questions it means filling in a blank.
Please do your best to complete the survey in one sitting, though it is alright if you need to take a break. Answer the questions to the best of your abilities with the knowledge that you have about your organization. Do not compare your answers to the answers of coworkers or other people in the organization.
If you have any questions or concerns about this survey, feel free to contact Nan Maxwell, the project director, at [email protected] or 510-830-3726.
Thank you for your participation!
Before you begin, please record the date and time that you began the survey:
Date: | | | / | | | / | | | | |
Time: | | | : | | | AM / PM (circle)
GENERAL INSTRUCTIONS
PLEASE MARK ALL ANSWERS WITHIN THE CIRCLES PROVIDED
PLEASE READ EACH QUESTION CAREFULLY. There are different ways to answer the questions in this survey. It is important that you follow the instructions when answering each kind of question. Here are some examples.
MARK () ONE FOR EACH QUESTION
a. Please rate how often you do each of the following activities:
VERY OFTEN OFTEN
NEITHER OFTEN NOR
RARELY RARELY VERY
RARELY
1. Before leaving on a trip, you or your family book hotel reservations
MARK () ONE FOR EACH QUESTION
b. Please rate how much you agree or disagree with the following statements:
STRONGLY AGREE AGREE
NEITHER AGREE
NOR DISAGREE DISAGREE
STRONGLY DISAGREE
1. I love ice cream
If you strongly agree, you would check the first circle as shown.
If you rarely, if ever, book hotel reservations, you would check the last circle: very rarely.
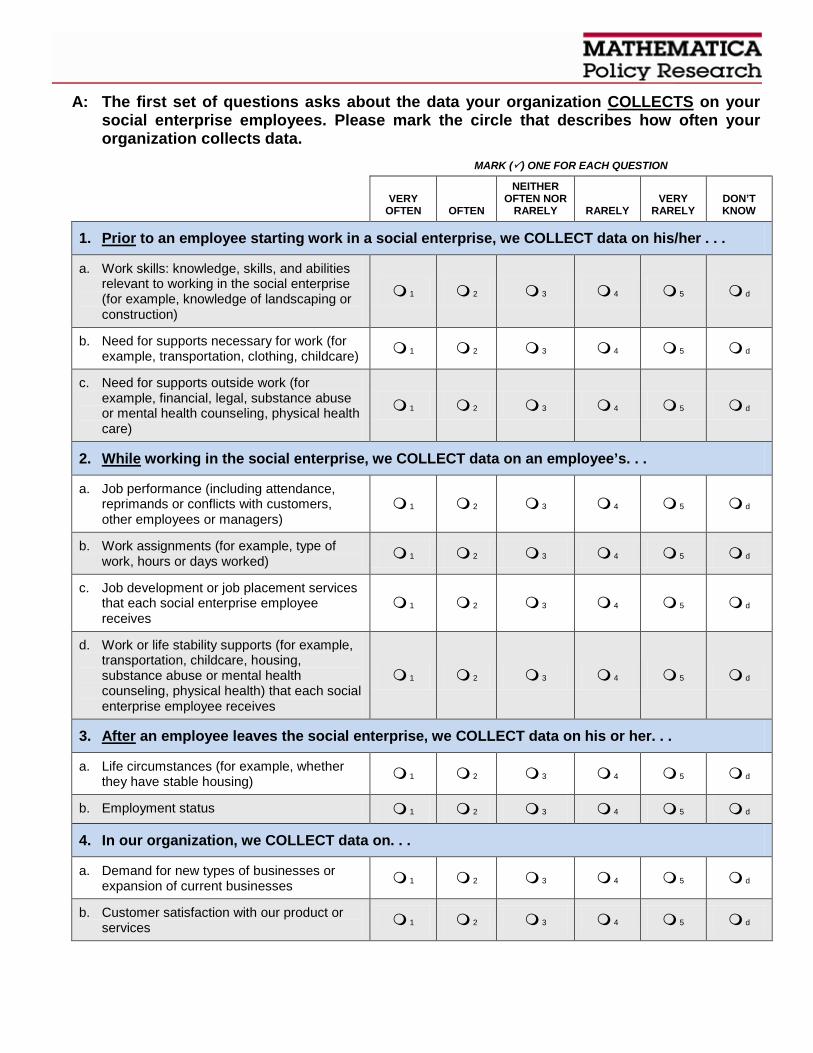
A: The first set of questions asks about the data your organization COLLECTS on your social enterprise employees. Please mark the circle that describes how often your organization collects data.
MARK () ONE FOR EACH QUESTION
VERY OFTEN OFTEN
NEITHER OFTEN NOR
RARELY RARELY VERY
RARELY DON’T KNOW
1. Prior to an employee starting work in a social enterprise, we COLLECT data on his/her . . .
a. Work skills: knowledge, skills, and abilities relevant to working in the social enterprise (for example, knowledge of landscaping or construction)
1 2 3 4 5 d
b. Need for supports necessary for work (for example, transportation, clothing, childcare) 1 2 3 4 5 d
c. Need for supports outside work (for example, financial, legal, substance abuse or mental health counseling, physical health care)
1 2 3 4 5 d
2. While working in the social enterprise, we COLLECT data on an employee’s. . .
a. Job performance (including attendance, reprimands or conflicts with customers, other employees or managers)
1 2 3 4 5 d
b. Work assignments (for example, type of work, hours or days worked) 1 2 3 4 5 d
c. Job development or job placement services that each social enterprise employee receives
1 2 3 4 5 d
d. Work or life stability supports (for example, transportation, childcare, housing, substance abuse or mental health counseling, physical health) that each social enterprise employee receives
1 2 3 4 5 d
3. After an employee leaves the social enterprise, we COLLECT data on his or her. . .
a. Life circumstances (for example, whether they have stable housing) 1 2 3 4 5 d
b. Employment status 1 2 3 4 5 d
4. In our organization, we COLLECT data on. . .
a. Demand for new types of businesses or expansion of current businesses 1 2 3 4 5 d
b. Customer satisfaction with our product or services 1 2 3 4 5 d

B: The next questions ask about the information or data that your organization ASSESSES.
Assess means systematically counting up the characteristics of employees (such as the number enrolled or number working), or looking at trends and patterns in the information you have (such as attendance or most frequently needed supports). Data assessment is one step beyond data collection. It means that you or your organization have some way of organizing and examining the data that you collect. Please mark the circle next to the answer that best describes how often your organization assesses information.
MARK () ONE FOR EACH QUESTION
VERY OFTEN OFTEN
NEITHER OFTEN NOR
RARELY RARELY VERY
RARELY DON’T KNOW
1. In our organization we ASSESS data on. . .
a. Employee skills and supports needs before they start in the social enterprise 1 2 3 4 5 d
b. Employee job performance while they work in the social enterprise 1 2 3 4 5 d
c. Work and life stability support services that employees use while they are employed in the social enterprise
1 2 3 4 5 d
d. Development of employee skills while they are employed in the social enterprise 1 2 3 4 5 d
e. Employment of employees after they leave the social enterprise 1 2 3 4 5 d
f. Local demand for new types of businesses or expansion of our current business(es) 1 2 3 4 5 d
g. Customer satisfaction with our product or services 1 2 3 4 5 d
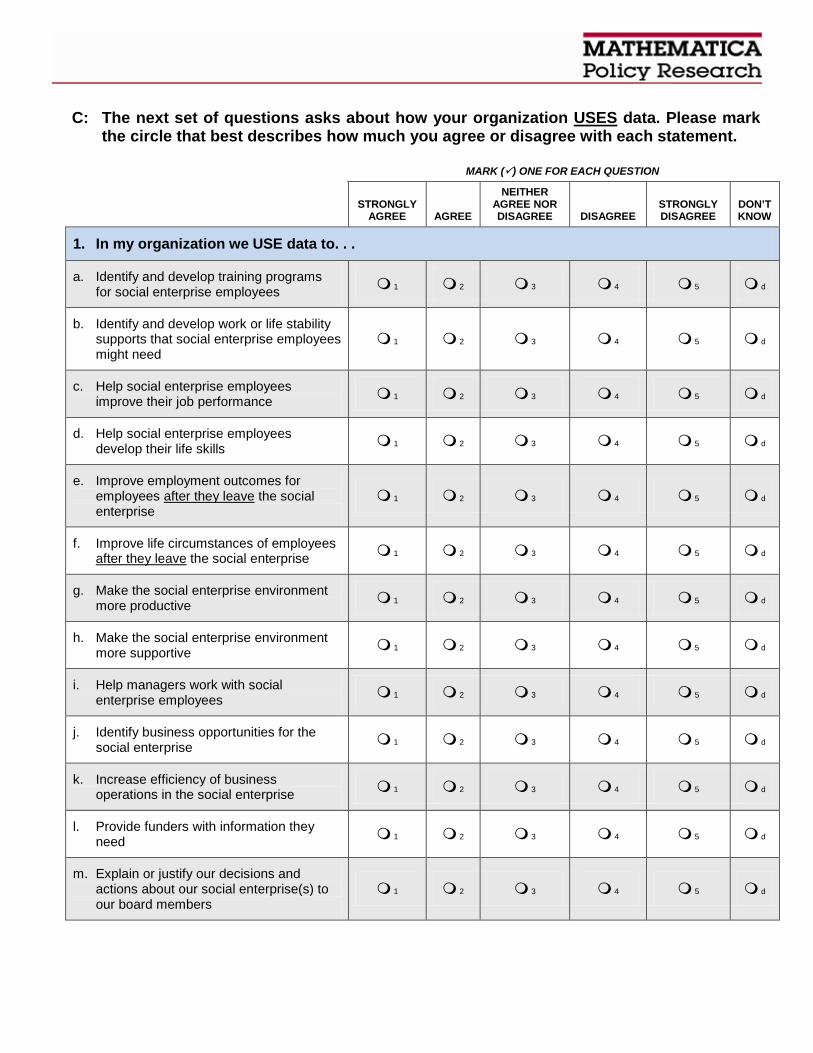
C: The next set of questions asks about how your organization USES data. Please mark the circle that best describes how much you agree or disagree with each statement.
MARK () ONE FOR EACH QUESTION
STRONGLY AGREE AGREE
NEITHER AGREE NOR DISAGREE DISAGREE
STRONGLY DISAGREE
DON’T KNOW
1. In my organization we USE data to. . .
a. Identify and develop training programs for social enterprise employees 1 2 3 4 5 d
b. Identify and develop work or life stability supports that social enterprise employees might need
1 2 3 4 5 d
c. Help social enterprise employees improve their job performance 1 2 3 4 5 d
d. Help social enterprise employees develop their life skills 1 2 3 4 5 d
e. Improve employment outcomes for employees after they leave the social enterprise
1 2 3 4 5 d
f. Improve life circumstances of employees after they leave the social enterprise 1 2 3 4 5 d
g. Make the social enterprise environment more productive 1 2 3 4 5 d
h. Make the social enterprise environment more supportive 1 2 3 4 5 d
i. Help managers work with social enterprise employees 1 2 3 4 5 d
j. Identify business opportunities for the social enterprise 1 2 3 4 5 d
k. Increase efficiency of business operations in the social enterprise 1 2 3 4 5 d
l. Provide funders with information they need 1 2 3 4 5 d
m. Explain or justify our decisions and actions about our social enterprise(s) to our board members
1 2 3 4 5 d
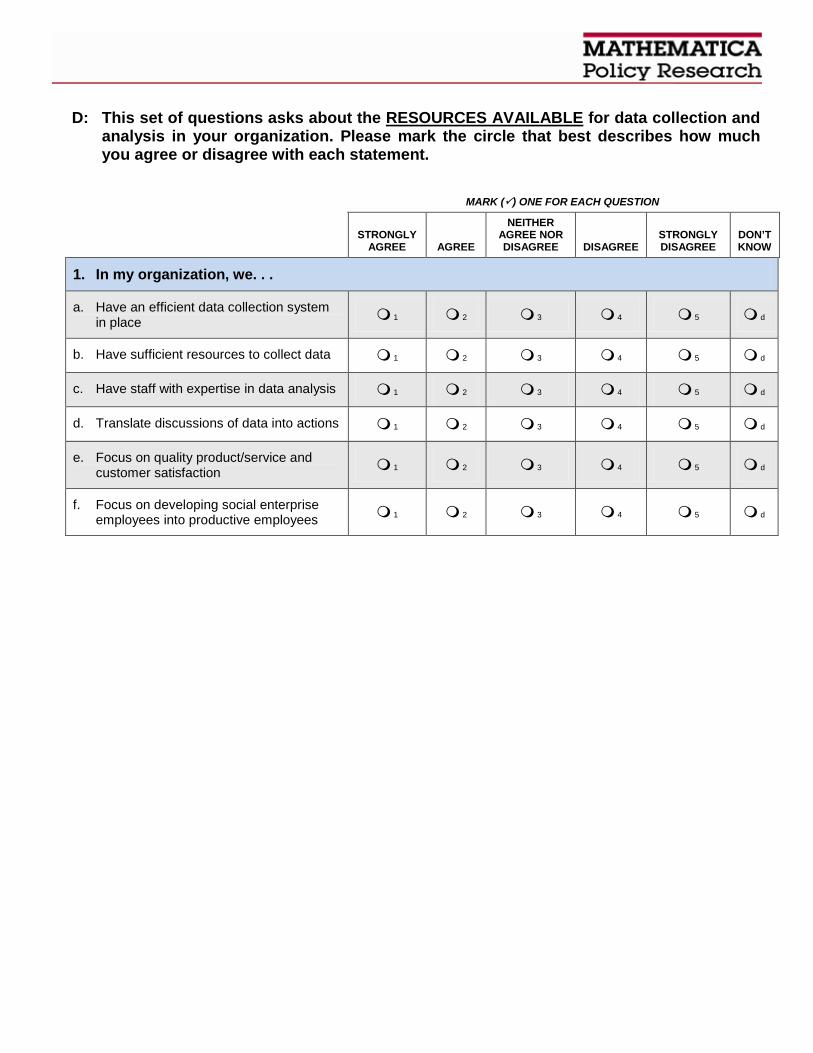
D: This set of questions asks about the RESOURCES AVAILABLE for data collection and analysis in your organization. Please mark the circle that best describes how much you agree or disagree with each statement.
MARK () ONE FOR EACH QUESTION
STRONGLY AGREE AGREE
NEITHER AGREE NOR DISAGREE DISAGREE
STRONGLY DISAGREE
DON’T KNOW
1. In my organization, we. . .
a. Have an efficient data collection system in place 1 2 3 4 5 d
b. Have sufficient resources to collect data 1 2 3 4 5 d
c. Have staff with expertise in data analysis 1 2 3 4 5 d
d. Translate discussions of data into actions 1 2 3 4 5 d
e. Focus on quality product/service and customer satisfaction 1 2 3 4 5 d
f. Focus on developing social enterprise employees into productive employees 1 2 3 4 5 d

E: This set of questions asks about YOUR VIEWS of data collection and use. Please mark the circle that best describes how much you agree or disagree with each statement.
MARK () ONE FOR EACH QUESTION
STRONGLY AGREE AGREE
NEITHER AGREE NOR DISAGREE DISAGREE
STRONGLY DISAGREE
DON’T KNOW
1. I BELIEVE that using data. . .
a. To make decisions is part of the culture of this organization 1 2 3 4 5 d
b. Can improve services we provide to employees 1 2 3 4 5 d
c. Takes away from the time spent helping employees 1 2 3 4 5 d
d. Builds an understanding of how the social enterprise operates 1 2 3 4 5 d
e. Makes me uncomfortable 1 2 3 4 5 d
f. Benefits the work we do with our employees 1 2 3 4 5 d
g. Runs counter to my experience of how to help our target population 1 2 3 4 5 d
h. Is not done well in this organization 1 2 3 4 5 d
i. Should be required by funders to support their funding decisions 1 2 3 4 5 d
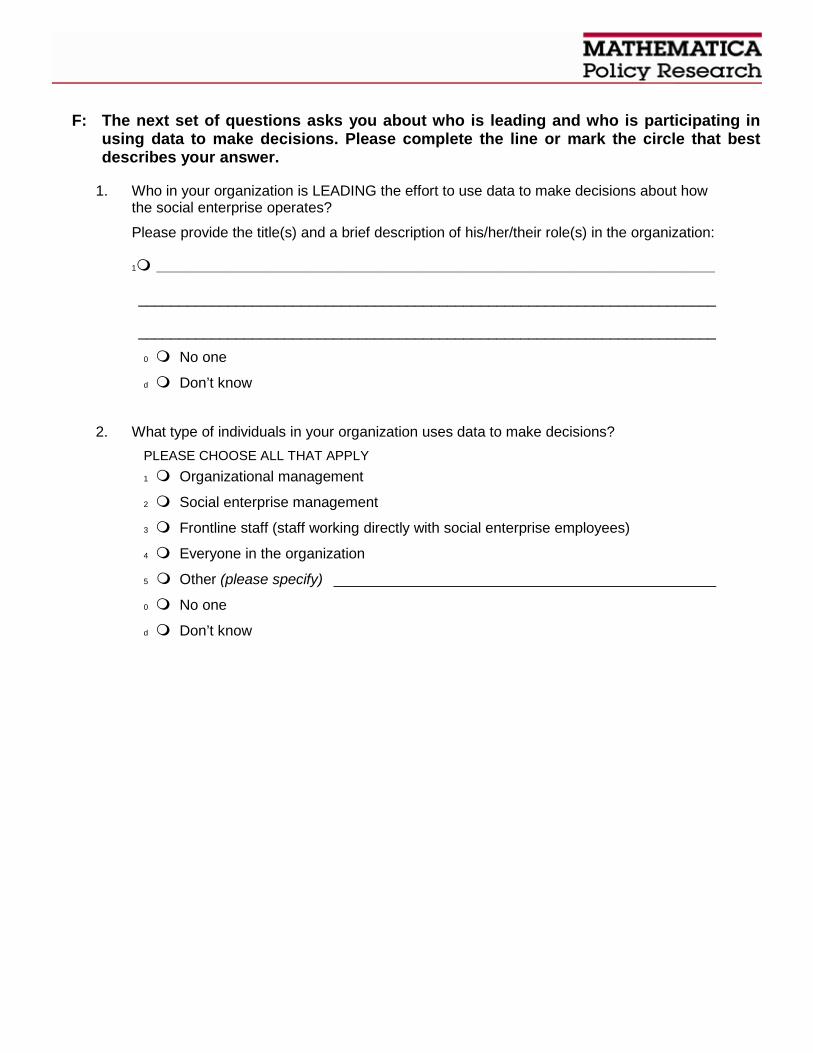
F: The next set of questions asks you about who is leading and who is participating in using data to make decisions. Please complete the line or mark the circle that best describes your answer.
1. Who in your organization is LEADING the effort to use data to make decisions about how the social enterprise operates?
Please provide the title(s) and a brief description of his/her/their role(s) in the organization:
1 _____________________________________________________________________________________________________________________________
_______________________________________________________________________
_______________________________________________________________________
0 No one
d Don’t know
2. What type of individuals in your organization uses data to make decisions? PLEASE CHOOSE ALL THAT APPLY 1 Organizational management
2 Social enterprise management
3 Frontline staff (staff working directly with social enterprise employees)
4 Everyone in the organization
5 Other (please specify) _______________________________________________
0 No one
d Don’t know
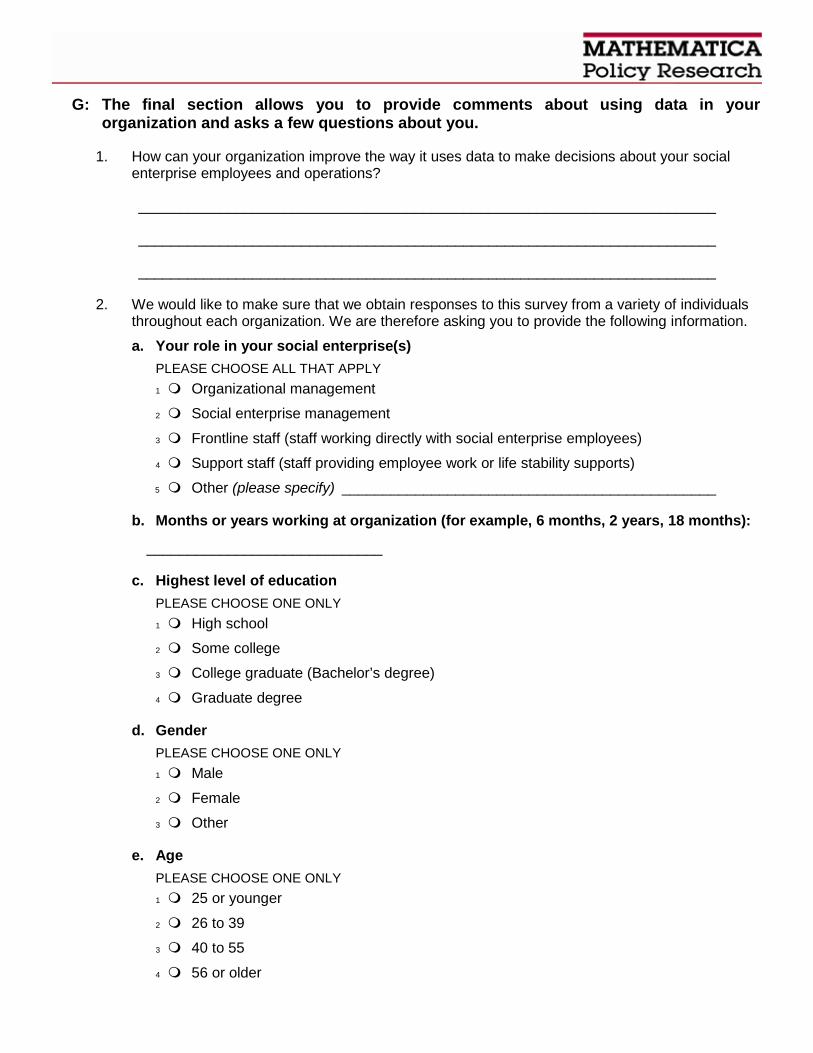
G: The final section allows you to provide comments about using data in your organization and asks a few questions about you.
1. How can your organization improve the way it uses data to make decisions about your social enterprise employees and operations?
_______________________________________________________________________
_______________________________________________________________________
_______________________________________________________________________
2. We would like to make sure that we obtain responses to this survey from a variety of individuals throughout each organization. We are therefore asking you to provide the following information.
a. Your role in your social enterprise(s) PLEASE CHOOSE ALL THAT APPLY 1 Organizational management
2 Social enterprise management
3 Frontline staff (staff working directly with social enterprise employees)
4 Support staff (staff providing employee work or life stability supports)
5 Other (please specify) ______________________________________________
b. Months or years working at organization (for example, 6 months, 2 years, 18 months):
_____________________________
c. Highest level of education PLEASE CHOOSE ONE ONLY 1 High school
2 Some college
3 College graduate (Bachelor’s degree)
4 Graduate degree
d. Gender PLEASE CHOOSE ONE ONLY 1 Male
2 Female
3 Other
e. Age PLEASE CHOOSE ONE ONLY 1 25 or younger
2 26 to 39
3 40 to 55
4 56 or older

This page has been left blank for double-sided copying.

D.2C. DATA-DRIVEN DECISION MAKING:
REDF
This page has been left blank for double-sided copying.

DATA DRIVEN DECISION MAKING: REDF STAFF
INTRODUCTION
Welcome to the Mathematica Job Study survey on using data to make decisions! We would like you to complete one survey for each organization with whom you interact as part of the SIF portfolio to help us better understand what types of information organizations collect, review, and use to help support social enterprises and their employees.
There are no wrong answers to these questions and your identity will be kept confidential and not shared with anyone beyond the research team. The information you provide will be combined with information from other individuals to help provide a general portrait of how information is being used to make decisions about social enterprise employees and operations. You may refuse to answer specific questions or discontinue your participation at any time.
The survey asks questions about: (1) the types of information or data an organization collects on social enterprise employees; (2) the types of information it analyzes; (3) how it uses data; (4) resources available for data collection and analysis; (5) it’s views on data collection and use; (6) who leads and who participates in using data to make decisions; and (7) any additional comments. Each survey should take no more than 10 minutes to complete.
As you read through the survey, answer each question with the response that best fits your experience or opinion. For most questions this means selecting the circle associated with your answer; for a small number of questions it means filling in a blank.
Please do your best to complete each survey in one sitting. Answer the questions to the best of your abilities with the knowledge that you have about the organization. Do not compare your answers to the answers of coworkers or other people.
If you have any questions or concerns about this survey, feel free to contact me at [email protected] or 510-830-3726.
Thank you for your participation!
GENERAL INSTRUCTIONS
PLEASE MARK ALL ANSWERS WITHIN THE CIRCLES PROVIDED
PLEASE READ EACH QUESTION CAREFULLY. There are different ways to answer the questions in this survey. It is important that you follow the instructions when answering each kind of question. Here are some examples.
MARK () ONE FOR EACH QUESTION
a. Please rate how often you do each of the following activities:
VERY OFTEN OFTEN
NEITHER OFTEN NOR
RARELY RARELY VERY
RARELY
1. Before leaving on a trip, you or your family book hotel reservations
MARK () ONE FOR EACH QUESTION
b. Please rate how much you agree or disagree with the following statements:
STRONGLY AGREE AGREE
NEITHER AGREE
NOR DISAGREE DISAGREE
STRONGLY DISAGREE
1. I love ice cream
If you strongly agree, you would check the first circle as shown.
If you rarely, if ever, book hotel reservations, you would check the last circle: very rarely.

Organization:______________________________ A: The first set of questions asks about the data the organization COLLECTS about
social enterprise employees. Please mark the circle that describes how often the organization collects data.
MARK () ONE FOR EACH QUESTION
VERY OFTEN OFTEN
NEITHER OFTEN NOR
RARELY RARELY VERY
RARELY DON’T KNOW
1. Prior to an employee starting work in a social enterprise, they COLLECT data on his/her . . .
a. Work skills: knowledge, skills, and abilities relevant to working in the social enterprise (for example, knowledge of landscaping or construction)
1 2 3 4 5 d
b. Need for supports necessary for work (for example, transportation, clothing, childcare) 1 2 3 4 5 d
c. Need for supports outside work (for example, financial, legal, substance abuse or mental health counseling, physical health care)
1 2 3 4 5 d
2. While working in the social enterprise, they COLLECT data on an employee’s. . .
a. Job performance (including attendance, reprimands or conflicts with customers, other employees or managers)
1 2 3 4 5 d
b. Work assignments (for example, type of work, hours or days worked) 1 2 3 4 5 d
c. Job development or job placement services that each social enterprise employee receives
1 2 3 4 5 d
d. Work or life stability supports (for example, transportation, childcare, housing, substance abuse or mental health counseling, physical health) that each social enterprise employee receives
1 2 3 4 5 d
3. After an employee leaves the social enterprise, they COLLECT data on his or her. . .
a. Life circumstances (for example, whether they have stable housing) 1 2 3 4 5 d
b. Employment status 1 2 3 4 5 d
4. They COLLECT data on. . .
a. Demand for new types of businesses or expansion of current businesses 1 2 3 4 5 d
b. Customer satisfaction with our product or services 1 2 3 4 5 d

B: The next questions ask about the information or data that the organization ASSESSES.
Assess means systematically counting up the characteristics of employees (such as the number enrolled or number working), or looking at trends and patterns in the information you have (such as attendance or most frequently needed supports). Data assessment is one step beyond data collection. It means that the organization has some way of organizing and examining the data collected. Please mark the circle next to the answer that best describes how often the organization assesses information.
MARK () ONE FOR EACH QUESTION
VERY OFTEN OFTEN
NEITHER OFTEN NOR
RARELY RARELY VERY
RARELY DON’T KNOW
1. The organization ASSESSES data on. . .
a. Employee skills and supports needs before they start in the social enterprise 1 2 3 4 5 d
b. Employee job performance while they work in the social enterprise 1 2 3 4 5 d
c. Work and life stability support services that employees use while they are employed in the social enterprise
1 2 3 4 5 d
d. Development of employee skills while they are employed in the social enterprise 1 2 3 4 5 d
e. Employment of employees after they leave the social enterprise 1 2 3 4 5 d
f. Local demand for new types of businesses or expansion of our current business(es) 1 2 3 4 5 d
g. Customer satisfaction with our product or services 1 2 3 4 5 d

C: The next set of questions asks about how the organization USES data. Please mark the circle that best describes how much you agree or disagree with each statement.
MARK () ONE FOR EACH QUESTION
STRONGLY AGREE AGREE
NEITHER AGREE NOR DISAGREE DISAGREE
STRONGLY DISAGREE
DON’T KNOW
1. The organization USES data to. . .
a. Identify and develop training programs for social enterprise employees 1 2 3 4 5 d
b. Identify and develop work or life stability supports that social enterprise employees might need
1 2 3 4 5 d
c. Help social enterprise employees improve their job performance 1 2 3 4 5 d
d. Help social enterprise employees develop their life skills 1 2 3 4 5 d
e. Improve employment outcomes for employees after they leave the social enterprise
1 2 3 4 5 d
f. Improve life circumstances of employees after they leave the social enterprise 1 2 3 4 5 d
g. Make the social enterprise environment more productive 1 2 3 4 5 d
h. Make the social enterprise environment more supportive 1 2 3 4 5 d
i. Help managers work with social enterprise employees 1 2 3 4 5 d
j. Identify business opportunities for the social enterprise 1 2 3 4 5 d
k. Increase efficiency of business operations in the social enterprise 1 2 3 4 5 d
l. Provide funders with information they need 1 2 3 4 5 d
m. Explain or justify our decisions and actions about our social enterprise(s) to our board members
1 2 3 4 5 d
D: This set of questions asks about the RESOURCES AVAILABLE for data collection and analysis in the organization. Please mark the circle that best describes how much you agree or disagree with each statement.
MARK () ONE FOR EACH QUESTION
STRONGLY AGREE AGREE
NEITHER AGREE NOR DISAGREE DISAGREE
STRONGLY DISAGREE
DON’T KNOW
1. The organization. . .
a. Has an efficient data collection system in place 1 2 3 4 5 d
b. Has sufficient resources to collect data 1 2 3 4 5 d
c. Has staff with expertise in data analysis 1 2 3 4 5 d
d. Translates discussions of data into actions 1 2 3 4 5 d
e. Focuses on quality product/service and customer satisfaction 1 2 3 4 5 d
f. Focuses on developing social enterprise employees into productive employees 1 2 3 4 5 d
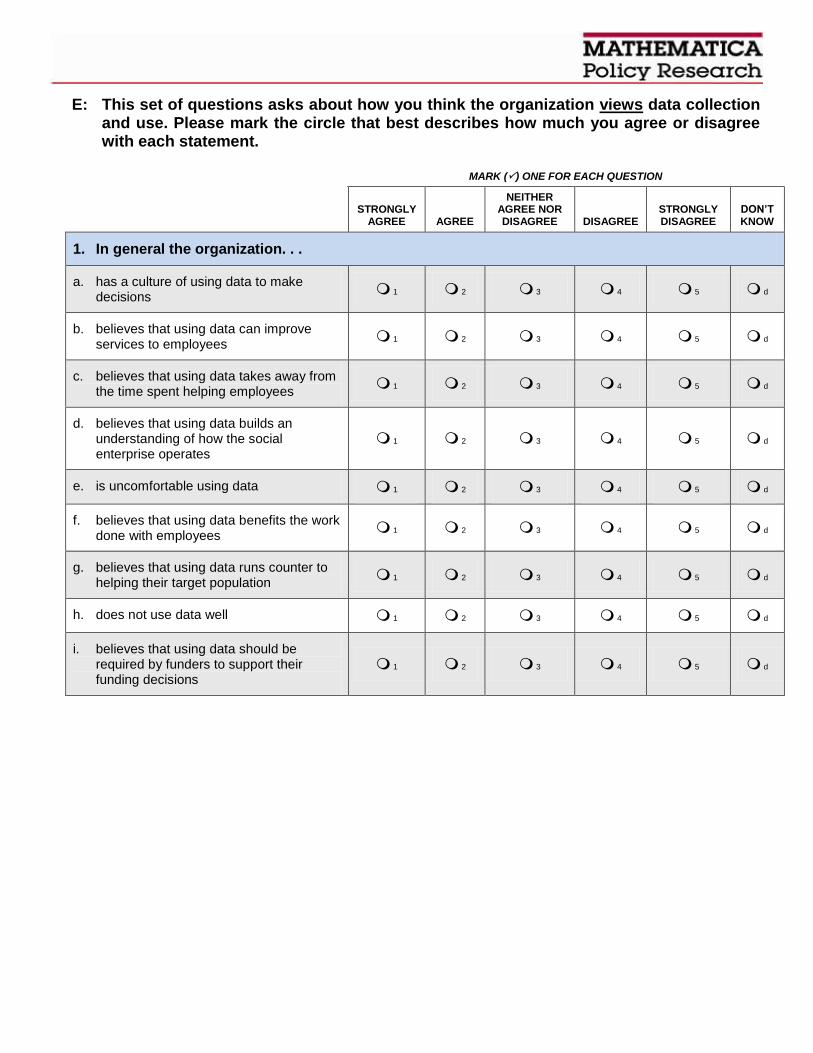
E: This set of questions asks about how you think the organization views data collection and use. Please mark the circle that best describes how much you agree or disagree with each statement.
MARK () ONE FOR EACH QUESTION
STRONGLY AGREE AGREE
NEITHER AGREE NOR DISAGREE DISAGREE
STRONGLY DISAGREE
DON’T KNOW
1. In general the organization. . .
a. has a culture of using data to make decisions 1 2 3 4 5 d
b. believes that using data can improve services to employees 1 2 3 4 5 d
c. believes that using data takes away from the time spent helping employees 1 2 3 4 5 d
d. believes that using data builds an understanding of how the social enterprise operates
1 2 3 4 5 d
e. is uncomfortable using data 1 2 3 4 5 d
f. believes that using data benefits the work done with employees 1 2 3 4 5 d
g. believes that using data runs counter to helping their target population 1 2 3 4 5 d
h. does not use data well 1 2 3 4 5 d
i. believes that using data should be required by funders to support their funding decisions
1 2 3 4 5 d

F: Who in the organization is leading and who is participating in using data to make decisions. Please complete the line or mark the circle that best describes your answer.
1. Who in the organization is LEADING the effort to use data to make decisions about how the social enterprise operates?
Please provide the title(s) and a brief description of his/her/their role(s) in the organization:
1 _____________________________________________________________________________________________________________________________
_______________________________________________________________________
_______________________________________________________________________
0 No one
d Don’t know
2. What type of individuals in the organization use data to make decisions? PLEASE CHOOSE ALL THAT APPLY 1 Organizational management
2 Social enterprise management
3 Frontline staff (staff working directly with social enterprise employees)
4 Everyone in the organization
5 Other (please specify) _______________________________________________
0 No one
d Don’t know
G: The final section allows you to provide comments about the organization and using data.
1. How can the organization improve the way it uses data to make decisions about social enterprise employees and operations?
_______________________________________________________________________
_______________________________________________________________________
_______________________________________________________________________
_______________________________________________________________________
_______________________________________________________________________
_______________________________________________________________________

D.3. ORGANIZATIONS: SEMI-STRUCTURED INSTRUMENTS

This page has been left blank for double-sided copying.

D.3A. EXECUTIVE DIRECTOR, ORGANIZATION

This page has been left blank for double-sided copying.
MATHEMATICA JOB STUDY EXECUTIVE DIRECTOR, HOST ORGANIZATION OF SOCIAL ENTERPRISE
PROTOCOL I. INDIVIDUAL BACKGROUND
I would like to begin by asking you about your roles and responsibilities as the Executive Director of [NAME OF ORGANIZATION].
– What is your official job title?
– How long have you been in your current position? With this organization?
– What are some of your overall job responsibilities?
– What are your specific day-to-day responsibilities?
II. ORGANIZATION
I would like now to ask you a bit about [NAME OF ORGANIZATION]
– What is [NAME OF ORGANIZATION]’s main mission? What are your organizations goals and
purposes?
– What are the main areas or divisions in [NAME OF ORGANIZATION]?
– How is your organization funded?
III. SOCIAL ENTERPRISE
Now, I would like to discuss [NAME OF SOCIAL ENTERPRISE(S)] at your organization.
– How does [NAME OF SOCIAL ENTERPRISE PROGRAM] fit into the mission of [NAME OF ORGANIZATION]?
Probes: How does it fit into the management structure of [NAME OF ORGANIZATION]? Financial structure? Administrative structure? Staffing structure?
– What prompted you to start a social enterprise? Probes: Do you feel your organization benefits from having a social enterprise? If so, how does your organization benefit from it?
– What are some of your goals or objectives for your social enterprise program? Probes: What are some ways in which you think you/your organization might be able to achieve these goals?
– What was the process you used to develop the business plan for [NAME OF SOCIAL ENTERPRISES]? Note: if organization has more than one social enterprise, probe for each.
Probes: How did you decide upon the focus of the enterprise (e.g., bed bug remediation vs. some other work)?
Mathematica Job Study: Implementation Analysis Interview Protocol
Executive Director, SE Host Organization
– What are some of the main benefits you see to integrating [NAME OF SOCIAL ENTERPRISES] into [NAME OF ORGANIZATION]?
– What challenges have you faced in integrating [NAME OF SOCIAL ENTERPRISES] into [NAME OF ORGANIZATION]?
– What is the relationship between staff in [NAME OF ORGANIZATION] and those in [NAME OF SOCIAL ENTERPRISE]?
Probes: Do staff from [NAME OF ORGANIZATION] contribute to or participate in [NAME OF SOCIAL ENTERPRISE]? If so, how many staff from [NAME OF ORGANIZATION] are involved in [NAME OF SOCIAL ENTERPRISE]? If so, how do they contribute/participate to the social enterprise? How do staff from [NAME OF ORGANIZATION] work with staff from the social enterprise? Are their roles highly differentiated/separated? Where are areas of cross over (if at all)?
– Do you see [NAME OF SOCIAL ENTERPRISES] as a profit making entity?
Probes: Is your social enterprise losing money? Breaking even? Making a profit? If losing money, how do you make up the short fall? What are plans to improve this outcome? If making a profit, how are you using this profit? What are your plans to sustain this profit? If breaking even, what are plans to help the social enterprise realize a profit?
Probes: What external sources help fund [NAME OF SOCIAL ENTERPRISES]? How does this funding compare (differences and similarities) to that you receive for [NAME OF ORGANIZATION]?
– Have you had any specific challenges related to the need to fund and support both [NAME OF ORGANIZATION] or [NAME OF SOCIAL ENTERPRISE]?
Probes: If so, what are some of the challenges? How have you sought to resolve them?
– How do you assess whether the social enterprise is achieving its social goals?
Probes: Do you track or monitor the progress of the social enterprise employees?
If so, how?
Do you track or monitor the development of the social enterprise as a business? If so, how?
Do you collect any specific information on either type of progress? If so, what kinds of information?
How do you use the information you collect?
Do you feel like you have the resources you need to collect and assess this information? To use it to support your social enterprise? If so, what resources do you have? Which do you lack?

Mathematica Job Study: Implementation Analysis Interview Protocol
Executive Director, SE Host Organization
Are there other kinds of information you would like to collect? If so, what would you like to do with this information?
– How do you assess whether the social enterprise is achieving the “right” balance in meeting the double bottom line goal (that is, meeting the needs of the business and meeting the needs of the social enterprise employees)?
IV. SERVICES
– What kinds of work do you offer social enterprise employees?
Probes: How long are participants typically employed through your social enterprise? Why did you decide on this length of employment?
Many social enterprises offer work or life stability supports. I would like to ask you about any such supports available in [NAME OF SOCIAL ENTERPRISE].
Interviewer: Refer to check list and ask about each service/support as it is available to social enterprise employees both before and during social enterprise employment as well as after it.
V. CLIENTS/PARTICIPANTS
I would like now to discuss some of the groups of people you serve with your social enterprise program.
– What populations/groups of people do you seek to serve through [NAME OF ORGANIZATION]?
– Do the social enterprise employees in [NAME OF SOCIAL ENTERPRISE] differ from other groups served by [NAME OF ORGANIZATION]?
Prompts: age, ethnicity, gender, work background, housing status, health status, income status, etc.
− What are some of the major employment barriers that your social enterprise employees face? Prompts: lack of job search skills, job readiness, work experience, problem solving skills, conflict resolution skills, stable address, reliable transportation, reliable childcare, lack of English language skills or proficiency, basic skills
− What are some of the primary life stability challenges that your social enterprise employees face? Prompts: stable housing, mental illness, physical health, stable finances, support network, literacy skills
– How would you describe a person who can do well or succeed as an employee of [NAME OF SOCIAL ENTERPRISE]?

Mathematica Job Study: Implementation Analysis Interview Protocol
Executive Director, SE Host Organization
Probe: What are some of the characteristics of a person who may not do well or succeed?
VI. PARTNER ORGANIZATIONS
I would like now to ask about the other organizations with whom you work(ed) to design, implement, and/or support your social enterprise.
– Are there organizations with whom you partner on any aspect of your social enterprise to support your social enterprise employees?
Probes: If so, which organizations?
– How did come to partner with this other organization(s)?
– What is their role in [NAME OF SOCIAL ENTERPRISE]?
Prompts: design and planning of the social enterprise; referrals of potential social enterprise employees, training services, providing work or life stability support services, administrative structure, fiduciary agent, business expertise and technical assistance, etc
VII. TRAINING AND TECHNICAL ASSISTANCE (TA)
I would like to ask about any training and technical assistance you have received in setting up and running [NAME OF SOCIAL ENTERPRISE].
– What kinds of training or technical assistance (TA) has REDF offered to you to support your social enterprise?
Probes: Have they offered any specific training or TA related to strategic planning for, realizing a profit in, operation, staffing, or supporting of a social enterprise?
− What format have the trainings and TA from REDF taken?
Prompts: orientation sessions, workshops, quarterly meetings, webinars, on-line resources, manuals, peer-to-peer training or TA, regular phone meetings, hotline number, listservs, blogs, etc
− How useful was this training and TA? What did it help you to achieve? Probes: Which aspects were most helpful? Which were least helpful? Is there any other type of assistance you would like to receive but did not?
VIII. IMPLEMENTATION OVERVIEW
Now, I would like to ask you to think about the process of getting your REDF-funded social enterprise up and running.
– What have been some of the primary challenges you have faced in planning, designing, implementing, and/or providing your social enterprise?
Probes: How have you addressed these challenges?
Have you had any challenges with the transitional verses permanent employment model?

Mathematica Job Study: Implementation Analysis Interview Protocol
Executive Director, SE Host Organization
– What have been some of the primary successes you have had in planning, designing, implementing, and/or providing your social enterprise?
– What lessons have you learned about working with a social enterprise that might be worth sharing with other organizations considering supporting a social enterprise?
IX. WRAP-UP
I have just two last questions for you.
– Are there any other thoughts or ideas about [NAME OF SOCIAL ENTERPRISE] that you would like to share?
– What are you looking forward to the most with regard to the future of [NAME OF SOCIAL ENTERPRISE]?
X. THANK YOU AND ANY LAST QUESTIONS
Thank respondents for their time and input
Ask if they have any additional questions about the interviews or the study overall

This page has been left blank for double-sided copying.

D.3B. SOCIAL ENTERPRISE DIRECTOR

This page has been left blank for double-sided copying.

1
MATHEMATICA JOB STUDY SOCIAL ENTERPRISE DIRECTOR INTERVIEW PROTOCOL
I. INDIVIDUAL BACKGROUND
I would like to begin by asking you about your responsibilities with regard to your social enterprise.
– What is your official job title?
– How long have you been in your current position? With this organization?
– What are some of your overall job responsibilities?
– What are your specific day-to-day responsibilities with regard to your social enterprise?
– How do you allocate your time between the social enterprise and any non-social enterprise work responsibilities that you may have?
II. ORGANIZATION
Now, I would like to ask you about [NAME OF ORGANIZATION] and how your social enterprise fits into or works with it.
– How did [NAME OF ORGANIZATION] become involved with supporting a social enterprise?
– How does [NAME OF SOCIAL ENTERPRISE] fit into [NAME OF ORGANIZATION]?
Probes: How does it fit into the management structure of [NAME OF ORGANIZATION]? Financial structure? Administrative structure? Staffing structure?
– How is the social enterprise structured in terms of staffing and administration?
– What are some of your goals or objectives for your social enterprise?
Probes: What are some ways in which you think you/your organization might be able to achieve these goals?
– How do you assess whether or not the social enterprise is meeting its goals?
Probes: Did you assess if your goals were met by enrolling a certain number of participants? Having a certain number complete their work experiences? Looking at measures of increases in work readiness? Increase the percent moving to permanent employment? Unsubsidized employment? Others?
III. CLIENTS/PARTICIPANTS
I would like now to discuss some of the groups of people you serve with your social enterprise.
– What populations/groups of people do you seek to serve through [NAME OF SOCIAL ENTERPRISE]?
Mathematica Job Study: Implementation Analysis Interview Protocol
Social enterprise Director
2
Prompts: age, ethnicity, gender, work background, housing status, health status, income status, etc
– Who typically is referred to [NAME OF SOCIAL ENTERPRISE] for employment?
Probe: How do you identify/determine the populations you serve?
What role does referral play in identifying social enterprise workers?
– What are some of the major employment barriers your social enterprise employees face?
Prompts: lack of job search skills, job readiness, work experience, problem solving skills, conflict resolution skills, stable address, reliable transportation, reliable childcare, lack of English language skills or proficiency, basic skills, stable housing, mental illness, physical health, stable finances, support network, literacy skills, etc
– What are some characteristics of a person who can do well or succeed at [NAME OF SOCIAL
ENTERPRISE]?
Probes: What are some of the characteristics of a person who may not do well here?
IV. SOCIAL ENTERPRISE EXPERIENCE I would like to ask you about the work that social enterprise employees do and what supports for work itself are available to them.
– Do you do any outreach to bring these groups into [NAME OF SOCIAL ENTERPRISE]?
Probes: If so, what types of outreach do you do?
What types of staff are involved in the outreach process?
– Is there any drop off between referral and employment?
Probes: If so, why do you think there is drop off?
Who tends to actually become employed in the enterprise?
– About how many participants are generally employed at [NAME OF SOCIAL ENTERPRISE] at
one time? Probes: Does this feel like too many? Not enough/you could serve more?
– What kinds of work do social enterprise employees do?
Probes: How long are participants typically employed through your social enterprise?
– Many social enterprises offer work or life stability supports. I would like to ask you about any
such supports available in [NAME OF SOCIAL ENTERPRISE].
Mathematica Job Study: Implementation Analysis Interview Protocol
Social enterprise Director
3
NOTE TO INTERVIEWER: Refer to check list and ask about each service/support as it is available to social enterprise employees both before and during social enterprise employment as well as after it.
– How do you determine which work supports your social enterprise employees need?
Prompts: How do you enroll or get employees involved in these work supports? How do you know whether participants received services as planned or participated in needed programs?
– How do you determine which life stability supports your social enterprise employees need?
Prompts: How do you enroll or get employees involved in these life stability supports? How do you know whether participants received services or participated in needed programs?
– Do you use a case management model or process?
Probes: If so, how does it work?
Prompts: intake, assessment, referrals, monitoring, social enterprise employment supports, exit, post-program follow up, post program support, etc
V. EMPLOYEE ATTITUDES TOWARD WORK AND SKILLS
Now I would like to ask you about the changes and development you have observed in your social enterprise employees during their work experiences?
– Have you seen the work skills evolve over the course of working in a social enterprise? If so, how have their skills changed?
Probes: What do you think have been some key influences on the evolution of your employees’ work skills?
– Have you seen the attitudes toward work of social enterprise employees evolve or change during their period of work in [NAME OF SOCIAL ENTERPRISE]?
Probes: If so, how?
What do you think have been some key influences on your employees’ attitudes toward work?
– Have you seen their communication skills evolve or change over the course of working in a social enterprise? If so, how?
– Have you seen their problem-solving or conflict resolution skills evolve or change over the course of working in a social enterprise? If so, how?
– What do you think are some key influences on these changes?
VI. PARTICIPANT TRACKING AND DATA
In order to better understand how employees move through the social enterprise, I would like to ask you about how you track and monitor employee progress.

Mathematica Job Study: Implementation Analysis Interview Protocol
Social enterprise Director
4
– Do you monitor or track the progress of the social enterprise employees? Probes: If so, how do you track your employees during social enterprise employment? What
kinds of information do you collect on them? How frequently do you collect this information?
– What do you do with the information you collect? How do you use it? What do you use it for?
Probes: Do you feel like you have the resources you need to collect and assess this information?
Do you feel like you have the resources you need to use the data (put the data to work) to support your social enterprise? If so, what resources do you have? Which do you lack?
Are there other kinds of information you would like to collect? If so, what kinds of information? What would you like to do with this information?
– How do you determine when a participant has completed [NAME OF SOCIAL ENTERPRISE]?
Probes: Is there a fixed period of employment for all employees?
A fixed period that life stability support services are offered to all participants?
Does it vary by the individual employee? By the challenges a group (e.g., homeless, mentally ill, substance abuse) of employees face?
Do you monitor or track employees after they have exited social enterprise employment?
VII. TRAINING AND TECHNICAL ASSISTANCE (TA)
– Has REDF offered you and training or TA to plan, design, and/or implement your social
enterprise employment program?
Probes: If so, in what areas? On what topics? In what formats?
− Have you utilized any of the training and/or TA available?
Probes: If so, what have you utilized? Have you found it helpful? What has been most helpful? Least helpful?
– Are there any additional types of training and/or TA that you need or would be helpful to you in
moving your social enterprise forward?
VIII. IMPLEMENTATION OVERVIEW
I would like to ask a few questions about setting up and running your social enterprise.
– Have you been able to implement your social enterprise as you planned? Probes: If not, what were some of the differences between what you planned and what you
actually did?

Mathematica Job Study: Implementation Analysis Interview Protocol
Social enterprise Director
5
What were some of the reasons for these changes? What were some of the benefits of making these changes?
– What have been some of the primary challenges you have faced in planning, designing, or implementing your social enterprise? Probes: How have you addressed these challenges?
Have you had any challenges with the transitional verses permanent employment model?
– What have been some of the primary successes you have had in planning, designing, or implementing your social enterprise?
– What lessons have you learned about planning, designing, and/or implementing a social enterprise that might be worth sharing with other social enterprises?
IX. LABOR MARKET CONDITIONS My next two questions are designed to gain an understanding of work opportunities available to social enterprise employees after they leave the social enterprise.
– What is the job market life for your social enterprise workers? Probe: In California and in your area
– What are some of the primary occupations, industries and potential employers available to your social enterprise employment participants once they exit [NAME OF SOCIAL ENTERPRISE]?
X. WRAP-UP
I have just two last questions for you.
– Are there any other thoughts or ideas about [NAME OF SOCIAL ENTERPRISE] that you would like to share?
– What are you looking forward to the most with regard to the future of [NAME OF SOCIAL ENTERPRISE]?
XI. THANK YOU AND ANY LAST QUESTIONS
Thank respondents for their time and input
Ask if they have any additional questions about the interviews or the study overall

This page has been left blank for double-sided copying.

D.3C. FRONTLINE MANAGERS

This page has been left blank for double-sided copying.
MATHEMATICA JOB STUDY FRONTLINE MANAGERS (CASE MANAGERS/SHIFT SUPERVISORS) PROTOCOL
I. INDIVIDUAL BACKGROUND
I would like to begin by asking about your responsibilities with regard [NAME OF SOCIAL ENTERPRISE].
– What is your official job title?
– How long have you been in your current position? With this organization?
– What are some of your overall job responsibilities?
– What are your specific, day-to-day responsibilities with regard to your social enterprise?
– How do you allocate your time between the social enterprise and any non-social enterprise work responsibilities that you may have?
II. CLIENTS/PARTICIPANTS
I would like now to discuss some of the groups of people you work with at [SOCIAL ENTERPRISE].
– What groups of people do you work with at [NAME OF SOCIAL ENTERPRISE]? Prompts: age, ethnicity, gender, work background, housing status, health status, income status, etc
– Who typically is referred to [NAME OF SOCIAL ENTERPRISE] for employment? Probe: How do you identify/determine the populations you serve?
What role does referral play in identifying social enterprise workers?
– Do you do any outreach to bring these groups into [NAME OF SOCIAL ENTERPRISE]?
Probes: If so, what types of outreach do you do?
What types of staff are involved in the outreach process?
– Who typically is referred to [NAME OF SOCIAL ENTERPRISE] for employment?
Probe: How do you identify/determine the populations you serve?
What role does referral play in identifying social enterprise workers? Who actually becomes employed at [SOCIAL ENTERPRISE]?
– What are some of the major employment barriers your social enterprise employees face?
Prompts: lack of job search skills, job readiness, work experience, problem solving skills, conflict resolution skills, stable address, reliable transportation, reliable childcare, lack of English language skills or proficiency, basic skills, stable housing, mental illness, physical health, stable finances, support network, literacy skills, etc

Mathematica Job Study: Implementation Analysis Focus Group Protocol
Case Managers/Shift Supervisors
– What are some characteristics of a person who can do well or succeed at [NAME OF SOCIAL ENTERPRISE]? Probes: What are some of the characteristics of a person who may not do well here?
III. INTAKE AND ASSESSMENT
– What is the intake process for participants when they first come to [NAME OF ORGANIZATION]? Probes: What types of staff are involved in the intake process? What types of information do you collect? Are there other factors you take into consideration during intake?
– How is eligibility determined? Probes: Do you have any challenges related to determining eligibility of potential employees? Is so, what are they? How do you overcome them?
– What kinds of assessment do you conduct when participants/potential employees first come to [SOCIAL ENTERPRISE]? Probes: Skills assessments, needs assessment, etc
How do you determine what assessments are needed?
– How do you determine what kind of work each candidate employee should do?
– How do you determine which work or life stability supports employees need?
Prompts: How do you enroll employees in work or life stability supports?
How do you know whether employees received needed services and supports?
– Are any referrals to outside organizations made? If so, under what circumstances? What types of referrals are made?
– About how many social enterprise employees are you generally responsible for at one time?
Probes: Does this feel like too many? Not enough/you could serve more?
IV. SOCIAL ENTERPRISE EXPERIENCE
I would like to ask you about the work that social enterprise employees do and what supports for work itself are available to them.
– What kinds of work/social enterprise employment do you offer to your employees?
Probes: How long are employees typically employed through your social enterprise?
– Many social enterprises offer work or life stability supports. I would like to ask you about any
such supports available in [NAME OF SOCIAL ENTERPRISE].

Mathematica Job Study: Implementation Analysis Focus Group Protocol
Case Managers/Shift Supervisors
NOTE TO INTERVIEWER: Refer to check list and ask about each service/support as it is available to social enterprise employees both before and during social enterprise employment as well as after it.
– Do you use a case management model or process?
Probes: If so, how does it work?
Prompts: intake, assessment, referrals, monitoring, social enterprise employment supports, exit, post-program follow up, post program support, etc
V. PARTICIPANT TRACKING AND DATA
In order to better understand how employees move through the social enterprise, I would like to ask you about how you track and monitor employee progress.
– Do you monitor or track the progress of the social enterprise employees? Probes: If so, how do you track your employees during social enterprise employment? What
kinds of information do you collect on them? How frequently do you collect this information?
– What do you do with the information you collect? How do you use it? What do you use it for?
Probes: Do you feel like you have the resources you need to collect and assess this information?
To use it to support your social enterprise? If so, what resources do you have? Which do you lack?
Are there other kinds of information you would like to collect? If so, what would you like to do with this information?
– How do you determine when a participant has completed [NAME OF SOCIAL ENTERPRISE]?
Probes: Is there a fixed period of employment for all employees?
A fixed period that life stability support services are offered to all participants?
Does it vary by the individual employee? By the challenges a group (e.g., homeless, mentally ill, substance abuse) of employees face?
Do you monitor or track your social enterprise after they have exited social enterprise employment?
VI. EMPLOYEE ATTITUDES TOWARD WORK AND SKILLS
Now I would like to ask you about the changes and development you have observed in your social enterprise employees during their work experiences?
– Have you seen the work skills evolve over the course of working in a social enterprise? If so, how have their skills changed?
Probes: What do you think have been some key influences on the evolution of your employees’ work skills?

Mathematica Job Study: Implementation Analysis Focus Group Protocol
Case Managers/Shift Supervisors
– Have you seen the attitudes toward work of social enterprise employees evolve or change during their period of work in [NAME OF SOCIAL ENTERPRISE]?
Probes: If so, how?
What do you think have been some key influences on your employees’ attitudes toward work?
– Have you seen their communication skills evolve or change over the course of working in a social enterprise? If so, how?
– Have you seen their problem-solving or conflict resolution skills evolve or change over the course of working in a social enterprise? If so, how?
– What do you think are some key influences on these changes?
VII. IMPLEMENTATION OVERVIEW
Now, I would like to ask you to think back over the past year and a half and about the process of working for your social enterprise.
– What have been some of the primary challenges you have faced in working with [NAME OF SOCIAL ENTERPRISE]?
Probes: How have you addressed these challenges?
Have you had any challenges with the transitional verses permanent employment model?
– What have been some of the primary successes you have had in working with [NAME OF SOCIAL ENTERPRISE]?
– What lessons have you learned about working with [NAME OF SOCIAL ENTERPRISE] that might be worth sharing with other social enterprises?
VIII. LABOR MARKET CONDITIONS
My next two questions are designed to gain an understanding of work opportunities available to social enterprise employees after they leave the social enterprise.
– What is the job market life for your social enterprise workers?
Probe: In California and in your area
– What are the primary occupations, industries and potential employers available to your social enterprise employment participants once they exit [NAME OF SOCIAL ENTERPRISE]?
IX. WRAP-UP
I have just two last questions for you.
– Are there any other thoughts or ideas about [NAME OF SOCIAL ENTERPRISE] that you would like to share?
– What are you looking forward to the most with regard to the future of [NAME OF SOCIAL ENTERPRISE]?

Mathematica Job Study: Implementation Analysis Focus Group Protocol
Case Managers/Shift Supervisors
X. THANK YOU AND ANY LAST QUESTIONS
Thank respondents for their time and input
Ask if they have any additional questions about the interviews or the study overall

This page has been left blank for double-sided copying.

D.3D. EMPLOYEE FOCUS GROUP

This page has been left blank for double-sided copying.

MATHEMATICA JOB STUDY SOCIAL ENTERPRISE WORKERS FOCUS GROUP PROTOCOL
I. BACKGROUND
- How were you spending your time before you came to [NAME OF SOCIAL ENTERPRISE]?
Probes: What were your main activities? What did you enjoy doing?
- Did you have a steady job before you came to [NAME OF SOCIAL ENTERPRISE]?
Probes: If so, what kind of job? Why did you decide to leave? What were some of the challenges you had finding and keeping a steady job before coming to [NAME OF SOCIAL ENTERPRISE]?
Prompts: lack of job search skills, job readiness, work experience, problem solving skills, conflict resolution skills, stable address, reliable transportation, reliable childcare
II. INTRODUCTION TO [NAME OF SOCIAL ENTERPRISE]
− How did you hear about [NAME OF ORGANIZATION]?
Probes: What made you go into [NAME OF ORGANIZATION] and ask for employment services?
− What led you to be interested in working at [NAME OF SOCIAL ENTERPRISE]?
Probes: Did you know about [NAME OF SOCIAL ENTERPRISE] when you came to [NAME OF ORGANIZATION] for employment services?
III. CURRENT EMPLOYMENT STATUS
- What are your responsibilities at work at [NAME OF SOCIAL ENTERPRISE]? What kinds of work do you do?
- How long have you been working at [NAME OF SOCIAL ENTERPRISE]?
- How much do you work, that is the number of days and hours per day?
IV. INTAKE AND ASSESSMENT
- When you first came to [NAME OF ORGANIZATION] did you have an initial interview, meeting, orientation or other introduction to [NAME OF SOCIAL ENTERPRISE]? If so, please describe.
- When you first came to [NAME OF ORGANIZATION], did you participate in any assessments to help you identify what kinds of work skills you have or would like to gain?
Probes: Have you participated in any assessments related to any additional supports outside of work you might want or need?

Mathematica Job Study: Implementation Analysis Focus Group Protocol
Social Enterprise Workers
V. LIFE STABILITY SUPPORTS/SERVICES
- Outside of work, have you had any specific challenges that you have tried to address during your time participating in [NAME OF SOCIAL ENTERPRISE]?
Probes: If so, do you feel comfortable sharing some of these?
- Has [NAME OF SOCIAL ENTERPRISE] helped you address any of these challenges? If so, which ones and how?
- Have you also been referred to or gotten involved in any other support programs with organizations other than [NAME OF ORGANIZATION]?
- Do you have any other challenges outside of work that you would like some help with?
Probes: If you feel comfortable discussing them, what are some of them?
- How do you think [NAME OF SOCIAL ENTERPRISE] could help you with these challenges?
IV. BENEFITS OF/SATISFACTION WITH THE SOCIAL ENTERPRISE EMPLOYMENT
- What have you liked the most about your work with [NAME OF SOCIAL ENTERPRISE]? What have you liked the least?
- Besides a pay check, what have been some of the benefits of working at [NAME OF SOCIAL ENTERPRISE]?
- What are some things that you have learned through your work at [NAME OF SOCIAL ENTERPRISE]?
- What are some characteristics of a person who can do well or succeed at [NAME OF SOCIAL ENTERPRISE]?
- What are some of the characteristics of a person who may not do well or succeed here?
V. PROGRAM EXIT AND POST-PROGRAM PLANS
- When will this job come to an end for you? If you have completed it, when did you complete it and how long did you work there? Why did you stop working there?
- Is your salary or paycheck adequate to help you meet your financial needs? Is it adequate for the work you were doing?
Probes: Too low, about right, high
- What are you plans for employment after your work at [NAME OF SOCIAL ENTERPRISE] is completed?

Mathematica Job Study: Implementation Analysis Focus Group Protocol
Social Enterprise Workers
Prompts: have a job; looking for a job; enrolled in school, skills building, job readiness, work search or other related program
- What kinds of jobs or employers do you think you might be able to find once your work at [NAME OF SOCIAL ENTERPRISE] or any training or education you are doing is over?
VI. ATTITUDES TOWARDS WORK [Note: please ask only if not already answered in context of previous questions]
- Do you like working, in general?
- Do you enjoy the work you are currently doing?
- Do you feel challenged at work?
- Do you feel like you are learning new things at work? If so, what kinds of things?
- Do you find work frustrating at times? How?
- Do you find work exciting or fun at times? How?
- Do you feel like you work too much? Not enough? About right?
- Do you like your supervisor? Do you think your supervisor is fair? Do you think your supervisor understands you? Do you think your supervisor likes you? Does your supervise help you develop skills and provide a constructive work environment. Des he or she challenge you to develop your skills?
- How important is work to your own sense of yourself/your self-image?
- How important is work for your role in your family?
- How important is work to how you organize your time?
VII. SOFT SKILLS [Note: please ask only if not already answered in context of previous questions]
- Have you experienced any challenges at work? If yes, what were they and how did you handle them?
Probes: Getting to work on time; reliable transportation; reliable childcare
- Have you experienced any conflicts at work? If so, how did you resolve them?
Probes: Disagreements with co-workers or supervisors or customers
- When you have a problem with a supervisor or co-worker, how do you address it?
- When you have a problem with a client or customer, how do you handle it?
- When you need to miss work, how do you handle this?
Probes: sick child; sick themselves; mtg with social worker or parole officer; family emergency, etc–probe for support networks and for problem-solving skills
VIII. WRAP-UP - Thinking about your entire experience with [NAME OF SOCIAL ENTERPRISE] (work,
supports, staff, etc), what was your favorite aspect of it?
- What was your least favorite aspect of your time with [NAME OF SOCIAL ENTERPRISE]?

Mathematica Job Study: Implementation Analysis Focus Group Protocol
Social Enterprise Workers
- Are there any other thoughts or ideas about your experiences with [NAME OF SOCIAL ENTERPRISE] that you would like to share?
- What are you looking forward to the most once you complete/now that you have completed [NAME OF SOCIAL ENTERPRISE]?
IX. THANK YOU AND ANY LAST QUESTIONS
Thank participants for their time and input. Ask if they have any additional questions about the focus group or the study. Pass out incentives.

D.3E. REDF STAFF

This page has been left blank for double-sided copying.
MATHEMATICA JOB STUDY REDF TRAINING AND TECHNICAL ASSISTANCE INTERVIEW PROTOCOL
ORGANIZATION and SOCIAL ENTERPRISE: _______________________________
NAME OF RESPONDENT: _________________________________________________
MATHEMATICA STAFF: ______________________________DATE: ____________
I. INTRODUCTION TO THE INTERVIEW
Thank you for agreeing to meet with me. As you know, I am from Mathematica Policy Research. I am part of an independent research team that is studying social enterprise programs supported by REDF. We are visiting 8-9 social enterprises in California to learn about their programs and innovations in providing work opportunities to populations with employment barriers around the state.
To help us better understand how REDF-supported social enterprise programs work, we would like to ask you some questions about your work providing training and/or technical assistance to the social enterprises. As suggested, we are holding similar discussions with staff from REDF and from REDF-supported social enterprise programs.
Your identity will be kept confidential and the notes from this discussion will not be shared with anyone beyond the research team. Instead, they will be combined with other discussions with other staff to help provide a general portrait of the social enterprise programs. Information based on these discussions will only be reported in aggregate to REDF to help document how the social enterprise programs are designed and implemented as well as understand the context in which key work and life stability outcomes are supported.
Please keep in mind:
– There are no right or wrong answers to these questions. Our questions are designed to collect information about and gain an understanding of REDF’s social enterprise programs.
– Your participation in this conversation is completely voluntary.
– You do not need to answer any questions you do not wish to answer during our discussion today.
Project Contact Information
The invitation you received asking you to participate in this interview included contact information for Dr. Nan Maxwell, Mathematica Job Study Project Director. Please feel free to contact her via phone or email if you have any questions or concerns about this study or your participation in it.
II. PRE-DISCUSSION QUESTIONS
I want to emphasize again that there are no right or wrong answers to these questions. By voluntarily agreeing to participate in this study, we ask you to answer these questions with responses that are true for you.
– Do you understand the purpose of our conversation today?
– Do you have any additional questions before we begin?
Mathematica Job Study: Implementation Analysis Interview Protocol
Training and Technical Assistance
III. INDIVIDUAL BACKGROUND
I would like to begin by asking you about your roles and responsibilities at REDF and with regard to the social enterprises?
– What is your official job title?
– How long have you been in your current position? With this organization overall?
– What are some of your overall job responsibilities?
– What are your specific responsibilities with regard to the REDF-supported social enterprises?
– How do you allocate your time between work with the social enterprises and your other job responsibilities?
IV. ORGANIZATION
– How did you become involved in working with the REDF social enterprises?
– How did you become involved in supporting the [SOCIAL ENTERPRISE]?
– What are some of your goals or objectives for [SOCIAL ENTERPRISE] and the social enterprise program overall?
Probes: What are some ways in which you think you/REDF might be able to achieve these goals?
– How did you determine which social enterprises to fund? I know you did not have specific criteria, but could you describe what kinds of efforts, orientations, visions for the social enterprises you were seeking in awarding grants?
– How did [SOCIAL ENTERPRISE] fit into this original vision?
– How do you assess whether or not [SOCIAL ENTERPRISE] and/or the overall program are meeting its goals?
– Do the ways you use to assess the social enterprise generate any outputs, for example, any kind of data?
– If so, how do you use these data or any other results of the assessment? What is there purpose? How do they get used?
– For [SOCIAL ENTERPRISE], what is your role in determining the viability of each line of business?
V. CLIENTS/PARTICIPANTS
I would like next to discuss some of the groups of people served by [SOCIAL ENTERPRISE].
– What populations/groups of people did [SOCIAL ENTERPRISE] target to serve through the REDF-supported social enterprises?
Prompts: age, ethnicity, gender, work background, housing status, health status, income status, etc
– What are some of the major work or life challenges that [SOCIAL ENTERPRISE] employees tend to face?
Prompts: lack of job search skills, job readiness, work experience, problem solving skills, conflict resolution skills, stable address, reliable transportation, reliable childcare, lack of English language skills or proficiency
Prompts: stable housing, mental illness, physical health, stable finances, support network, etc
Mathematica Job Study: Implementation Analysis Interview Protocol
Training and Technical Assistance
VI. TRAINING AND TECHNICAL ASSISTANCE
I would like to ask about any training and technical assistance (TA) provided to [SOCIAL ENTERPRISE].
– What kind of training and TA has REDF offered to [SOCIAL ENTERPRISE] to plan, design, and/or implement and run their social enterprises?
Probes: In what areas? On what topics? In what formats?
Did you play a role in training or TA? If so, what was your role?
– Do you think [SOCIAL ENTERPRISE] has been able to utilize the training and/or TA available?
Probes: What kinds of help have they most frequently requested?
How have they responded to training and/or TA given?
Have you seen any changes at [SOCIAL ENTERPRISE] following training and/or TA? If so, what kinds of changes?
Do they have additional needs for training or TA? If so, in what areas?
VII. IMPLEMENTATION OVERVIEW
Next, I would like to ask you to ask you some overarching questions about working with the REDF-supported social enterprises.
– What were some of the primary challenges you have faced in working with [SOCIAL ENTERPRISE]?
– Probes: How have you addressed these challenges?
Are these challenges fairly typical of your grantees? Or do they differ in some way? If so, how? Have there been any challenges related to different organizations working together to implement a social enterprise?
– What were some of the primary challenges [ORGANIZATION] face themselves in running [line of business]? Probes: Have they had any challenges with the transitional verses permanent employment model?
– What were some of the primary successes you have had in working with [SOCIAL ENTERPRISE]?
– What were some of the successes [ORGANIZATION] has had in running [SOCIAL
ENTERPRISE]?
– What lessons have you learned about working with [SOCIAL ENTERPRISE] that might be worth sharing with other organizations considering working with social enterprises? Probes: Are there specific issues you would like for me to address or to ask about during our site visit to [ORGANIZATION AND/OR SOCIAL ENTERPRISE]? If so, what are these?
Mathematica Job Study: Implementation Analysis Interview Protocol
Training and Technical Assistance
VIII. WRAP-UP
I have just two last questions for you.
– Are there any other thoughts or ideas about working with social enterprises that you would like to share?
– What are you looking forward to the most with regard to the future of working with the REDF-supported social enterprises?
IX. THANK YOU AND ANY LAST QUESTIONS
– Thank respondents for their time and input
– Ask if they have any additional questions about the interviews or the study overall

www.mathematica-mpr.com
Improving public well-being by conducting high quality, objective research and surveys
Princeton, NJ ■ Ann Arbor, MI ■ Cambridge, MA ■ Chicago, IL ■ Oakland, CA ■ Washington, DC
Mathematica® is a registered trademark of Mathematica Policy Research