The structural response of a reinforced concrete specimen ... · The structural response of a...
9
The structural response of a reinforced concrete specimen subjected to adjacent blast loading M. Foglar 1 , J. Pachman 2 , V. Pelikan 2 , R. Hájek 1 , M. Künzel 2 & M. Kovar 1 1 Faculty of Civil Engineering, Czech Technical University in Prague, Czech Republic 2 Faculty of Chemical Technology, Institute of Energetic Materials, University of Pardubice, Czech Republic Abstract The paper presents the results of the field tests of FRC and reinforced concrete specimens which were performed in cooperation with the Czech Army corps in the military training area Boletice. The tests were performed using real scale reinforced concrete precast slabs (6×1.5×0.3 m) with varying fibre content, fibre type, fibre strength and concrete strength class and 25 kg of TNT charges placed at a distance from the slab for better simulation of real in-situ conditions. The slabs were recorded using a high speed framing camera during the blast loading. The instrumentation enabled us to study the propagation of the blast shock wave through the material, propagation of the cracks on the soffit of the specimen and the final collapse of the middle part of the slab exposed to blast loading. The sequence of the structural behaviour is documented in detail and verified by numerical modelling using the LS-DYNA solver. Keywords: fibre reinforced concrete, high speed camera, blast loading. 1 Introduction This paper presents outcomes of the blast field tests of fibre reinforced concrete specimens which were performed in cooperation with the Czech Army corps and Police of the Czech Republic. The tests were performed in September 2013 at Structures Under Shock and Impact XIII 171 www.witpress.com, ISSN 1743-3509 (on-line) WIT Transactions on The Built Environment, Vol 141, © 2014 WIT Press doi:10.2495/SUSI140151
Transcript of The structural response of a reinforced concrete specimen ... · The structural response of a...

The structural response of a reinforced concrete specimen subjected to adjacent blast loading
M. Foglar1, J. Pachman2, V. Pelikan2, R. Hájek1, M. Künzel2 & M. Kovar1 1Faculty of Civil Engineering, Czech Technical University in Prague, Czech Republic 2Faculty of Chemical Technology, Institute of Energetic Materials, University of Pardubice, Czech Republic
Abstract
The paper presents the results of the field tests of FRC and reinforced concrete specimens which were performed in cooperation with the Czech Army corps in the military training area Boletice. The tests were performed using real scale reinforced concrete precast slabs (6×1.5×0.3 m) with varying fibre content, fibre type, fibre strength and concrete strength class and 25 kg of TNT charges placed at a distance from the slab for better simulation of real in-situ conditions. The slabs were recorded using a high speed framing camera during the blast loading. The instrumentation enabled us to study the propagation of the blast shock wave through the material, propagation of the cracks on the soffit of the specimen and the final collapse of the middle part of the slab exposed to blast loading. The sequence of the structural behaviour is documented in detail and verified by numerical modelling using the LS-DYNA solver. Keywords: fibre reinforced concrete, high speed camera, blast loading.
1 Introduction
This paper presents outcomes of the blast field tests of fibre reinforced concrete specimens which were performed in cooperation with the Czech Army corps and Police of the Czech Republic. The tests were performed in September 2013 at
Structures Under Shock and Impact XIII 171
www.witpress.com, ISSN 1743-3509 (on-line) WIT Transactions on The Built Environment, Vol 141, © 2014 WIT Press
doi:10.2495/SUSI140151

the military training area Boletice. The experiments followed a previous experimental program from [1]. The paper presents a method of monitoring the shock wave propagation and spall formation using a high speed framing camera. The use of a high speed camera for full scale concrete blast loading experiments is frequently mentioned in the literature [2, 3], but very few articles provide any useful results of such recordings.
2 Setup of the experiments
The setup of the experiments was adapted from experiments described in [1]. The experiments were carried out at the military training area Boletice in cooperation with the Czech Army corps and Police of the Czech Republic. The blasts were performed on a former artillery practice target area (900 m above sea level) which is now used for dismantling obsolete ammunition and ammunition from WW2 which is still found in the Czech Republic during construction works. Dimensions of the specimens were designed in real scale of a small span bridge as concrete slabs, 6 m long, 1.5 m wide and 0.3 m thick. The slabs were placed on timber posts and the soil under the slabs was removed; a channel 10 m in length and 2.3 m in depth (except 1.5 m in test 1) was excavated under the slabs in order to allow observation of the soffit. The 25 kg TNT charges were built up using standard military 200 g TNT charges. The charges were placed on steel holders in the middle of the slabs. The holders provided a 450 mm stand-off distance from the slab for better simulation of real in-situ conditions. This value was chosen as the most usual height of a car trunk. The setup of the experiment is shown in Figure 1.
Figure 1: Layout of the experiment.
172 Structures Under Shock and Impact XIII
www.witpress.com, ISSN 1743-3509 (on-line) WIT Transactions on The Built Environment, Vol 141, © 2014 WIT Press
3 Instrumentation
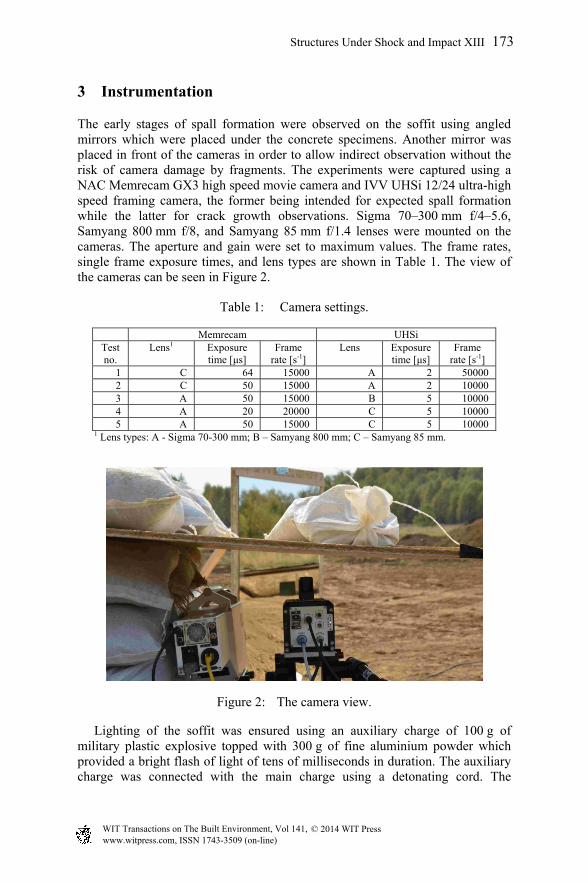
The early stages of spall formation were observed on the soffit using angled mirrors which were placed under the concrete specimens. Another mirror was placed in front of the cameras in order to allow indirect observation without the risk of camera damage by fragments. The experiments were captured using a NAC Memrecam GX3 high speed movie camera and IVV UHSi 12/24 ultra-high speed framing camera, the former being intended for expected spall formation while the latter for crack growth observations. Sigma 70–300 mm f/4–5.6, Samyang 800 mm f/8, and Samyang 85 mm f/1.4 lenses were mounted on the cameras. The aperture and gain were set to maximum values. The frame rates, single frame exposure times, and lens types are shown in Table 1. The view of the cameras can be seen in Figure 2.
Table 1: Camera settings.
Memrecam UHSi Test no.
Lens1 Exposure time [μs]
Frame rate [s-1]
Lens Exposure time [μs]
Frame rate [s-1]
1 C 64 15000 A 2 50000 2 C 50 15000 A 2 10000 3 A 50 15000 B 5 10000 4 A 20 20000 C 5 10000 5 A 50 15000 C 5 10000
1 Lens types: A - Sigma 70-300 mm; B – Samyang 800 mm; C – Samyang 85 mm.
Figure 2: The camera view.
Lighting of the soffit was ensured using an auxiliary charge of 100 g of military plastic explosive topped with 300 g of fine aluminium powder which provided a bright flash of light of tens of milliseconds in duration. The auxiliary charge was connected with the main charge using a detonating cord. The
Structures Under Shock and Impact XIII 173
www.witpress.com, ISSN 1743-3509 (on-line) WIT Transactions on The Built Environment, Vol 141, © 2014 WIT Press

Memrecam camera recording was triggered using an ionization pin inserted in the auxiliary charge, while the UHSi camera was triggered by another ionization pin inserted in the main charge.
4 Results and discussion
The process of blast loading of concrete has the following time schedule. The detonation of the main charge generates an expanding cloud of gases led by a strong shock wave which approaches the concrete specimen. The shock wave partially reflects back from the specimen surface. The compressive stress at the top surface of the specimen can cause local crushing of concrete or a shear failure of the specimen (puncture by shear-punching behaviour). The other part of the shock wave passes through to the bottom side of the specimen, where it reflects again, interfering with the release part itself. In this time, cracks develop on the soffit and the spall begins to form (as described in [2] and can be seen in Figure 3). Part of the shockwave again passes through the interface, creating an air shock wave under the specimen. This air shock wave is combined with a shock wave which overflows the test specimen from the side. The air shock wave is later followed by flying spall debris.
Figure 3: Scheme of the spall formation.
Results of monitoring the blast wave propagation, which were obtained from the Memrecam records, can be seen in Table 2 and Figures 4–7. The first cracks are visible on the soffit at about 0.3 ms after the main charge detonation according to test 4, but they probably formed earlier. The average spall debris velocity was 120 m.s-1. In test 1, the air shock wave velocity under the specimen as determined from the movie reached 1150 m.s-1 while it was only 480 m.s-1 and 600 m.s-1 in tests 2 and 5, respectively. The UHSi camera did not provide any useful results at selected exposure parameters. A more intensive light source such as an argon flash bomb would be needed to illuminate the soffit enough for the extremely short shutter speeds.
174 Structures Under Shock and Impact XIII
www.witpress.com, ISSN 1743-3509 (on-line) WIT Transactions on The Built Environment, Vol 141, © 2014 WIT Press

Table 2: Monitoring of blast wave propagation.
Test No. 1 Test No. 2 Test No. 3 Test No. 4 Test No. 5
frame time [ms]
frame time [ms]
frame time [ms]
frametime [ms]
frame time [ms]
Detonation of the auxiliary charge
0 -1.93 0 -2.13 0 -1.93 0 -1.65 0 -2.0
Detonation of the main charge
29 0 32 0 29 0 33 0 30 0
Crack development on the soffit
42 0.87 44 0.8 34 0.33 39 0.3 37 0.47
Shock wave arrive to the ground
59 2.0 86 3.6 94 4.33 122 4.45 85 3.67
Spall debris arrive to the mirror upper edge
- - 183 10.07 - - - - 173 9.53
Shock wave arrive to the second mirror
- - 1101 71.27 - - 1445 70.6 1080 70
Figure 4: Spalling just started on the soffit (test 5, t = 0.67 ms).
Structures Under Shock and Impact XIII 175
www.witpress.com, ISSN 1743-3509 (on-line) WIT Transactions on The Built Environment, Vol 141, © 2014 WIT Press

Figure 5: Air shock wave passes along the mirror (highlighted by the white line, test 5; t = 2.8 ms).
Figure 6: Extended damage of the soffit (test 4; t = 2.85 ms).
The observation of the process is heavily hampered by an expanding fireball caused by the main charge. Its elimination had been one of the most challenging tasks during the experiments. Several plastic foil layers stretched on a wooden frame proved to be completely insufficient in blocking or slowing down the fireball, while wooden boards together with digging a deeper pit to place the mirror appeared to be partially successful. However, the front side of the specimen was not attainable for imaging in all cases. For the future experiments, concrete cover panels are being designed to block the fireball both in front and behind the test specimen.
176 Structures Under Shock and Impact XIII
www.witpress.com, ISSN 1743-3509 (on-line) WIT Transactions on The Built Environment, Vol 141, © 2014 WIT Press

Figure 7: The flying spall debris reach the upper edge of the mirror (test 2; t = 10 ms).
5 Numerical modelling of the specimen response
LS-DYNA solver was used for computing the response of the specimen to the adjacent blast. The setup of the numerical model was adapted from [1]. The numerical evaluation of the experiments is described in detail in [1]. A numerical model was successfully calibrated to describe the behaviour of concrete slabs subjected to blast loading and the corresponding damage. The camera instrumentation confirmed some numerical model expectations. The overpressure wave arrived at the top surface of the specimen at t = 0.2 ms in the numerical model. After the rebound of the overpressure wave from the soffit of the specimen, the first elements started to erode (t = 0.4 ms). Figure 8 shows
Figure 8: Normal stress – t=0.3ms.
Structures Under Shock and Impact XIII 177
www.witpress.com, ISSN 1743-3509 (on-line) WIT Transactions on The Built Environment, Vol 141, © 2014 WIT Press

Figure 9: Normal stress – t=0.5ms, eroded elements on the soffit.
the contours of normal stress in time t = 0.3 ms. Figure 9 shows the contours of normal stress in time t = 0.5 ms – eroded elements on the soffit. The extend crack development is an indicator of the extent of damage of the concrete. Material model MAT159_CSCM used in LS-DYNA solver for concrete elements has another indicator for damage; the plastic strain value. If the plastic strain indicator overpasses the setting value, concrete elements erode. Differentiating between numerical simulation and real behaviour of concrete is in the eroding elements in the model and inertia of concrete in real conditions. The concrete element has its own static inertia and does not erode in the same time in real behaviour and numerical simulation. The shape and the size of a plastic strain pattern is the decisive parameter for the modelling and experiments’ agreement consideration. The extent of damage of the concrete specimen after the blast was determined from a large collection of photographs. The crack, puncture and spalling patterns were created according to detailed pictures. For detailed concrete loss of weight research, the 3D models of concrete slabs were created. The crack, puncture and spalling patterns were made in every concrete layer in accordance to a known depth. The connection of separated layer patterns brought the 3D model of the concrete slab (Figure 10).
Figure 10: A 3D model of damaged specimen.
178 Structures Under Shock and Impact XIII
www.witpress.com, ISSN 1743-3509 (on-line) WIT Transactions on The Built Environment, Vol 141, © 2014 WIT Press

6 Conclusions
The observation of real scale blast loading experiments using high speed cameras was performed. The spall formation process on the soffit and blast waves under the specimen were captured using a Memrecam movie camera, allowing the air shock wave and spall debris velocities to be estimated. The attempt to catch the foremost crack growth on the soffit using the UHSi camera was not successful due to insufficient illumination of the target. The model of spall formation was created using LS-DYNA solver. For the future experiments, concrete shielding panels for more efficient fireball elimination and also an improved triggering system are being designed.
Acknowledgement
This paper was supported by the Grant Agency of the Czech Republic Grant Project No. GAČR13-30441S
References
[1] Foglar M., Kovar M., Conclusions from experimental testing of blast resistance of FRC and RC bridgedecks, International Journal of Impact Engineering, Volume 59, September 2013, Pages 18-28, ISSN 0734-743X
[2] Wu C., Oehlers D.J., Rebentrost M., Leach J., Whittaker A.S., Blast testing of ultra-high performance fibre and FRP-retrofitted concrete slabs, Engineering Structures, Volume 31, April 2009, Pages 2060-2069, ISSN 0141-0296
[3] Coughlin A.M., Musselman E.S., Schokker A.J., Linzell D.G., Behavior of portable fiber reinforced concrete vehicle barriers subject to blasts from contact charges, International Journal of Impact Engineering, Volume 37, 2010, Pages 521-529, ISSN 0734-743X
[4] Millard S.G., Molyneaux T.C.K., Barnett S.J., Gao X., Dynamic enhancement of blast-resistant ultra-high performance fibre-reinforced concrete under flexural and shear loading, International Journal of Impact Engineering, Volume 37, Issue 4, April 2010, Pages 405-413, ISSN 0734-743X
Structures Under Shock and Impact XIII 179
www.witpress.com, ISSN 1743-3509 (on-line) WIT Transactions on The Built Environment, Vol 141, © 2014 WIT Press