the Stroop effect - link.springer.com · rive SATfs in a Stroop task. In Experiment 1, volunteers...
13
Losing control: Mostly incongruent lists postpone, but do not eliminate, the Stroop effect Jason Ivanoff 1 & Nicole E. Webb 1 & Harjot Chahal 1 & Virginia P. Palango 1 & Raymond M. Klein 2 & Steven R. Carroll 1 Published online: 8 March 2018 # The Psychonomic Society, Inc. 2018 Abstract Identifying the color (e.g., red) of a color word that is incongruent (e.g., BBLUE^) can be remarkably difficult. The Stroop effect is a measure of the interference between activity from word and color pathways. The efficacy of these pathways is thought to be highly contingent on the frequency of incongruent trials within a block. A block of trials with mostly incongruent (MI) trials typically results in a smaller Stroop effect than a block with mostly congruent (MC) trials. This reduction of the Stroop effect has been largely attributed to the strategic list-wide control of the word pathway. Here, the time course of the Stroop effect was explored using speed-accuracy tradeoff functions (SATfs) in tasks with 50 % congruent, MC, and MI trials. In the MC and 50 % congruent condition, color-word congruency affected the rate parameter of the SATf. In the MI condition, however, congruency affected the asymptote. This evidence is consistent with the idea that the strategic control of the word pathway is an effortful, temporary phenomenon, prone to buckle if responding is held in check. Keywords Attention . Stroop . Cognitive and attentional control Introduction The distinction between Bautomatic^ and Bcontrolled^ pro- cessing has long played a pivotal role in cognitive theorizing (e.g., Posner & Snyder, 1975). Although control processes are relatively slower, more effortful, and more resource demand- ing, than Bautomatic^ processes, they are vital to the perfor- mance of goal-oriented and flexible behavior. Controlled pro- cesses are also necessary for monitoring conflict between in- formation processing pathways (e.g., Botvinick et al., 2001), although there is generally little consensus on the mechanisms that accomplish this feat. Identifying the color of a word stimulus is typically slowed, and more prone to erroneous responding, if the color (e.g., blue) and the word (e.g., RED) are incongruent. Congruent stimuli (e.g., RED written in the color red) are responded to more quickly and less erroneously. The performance differ- ence between congruent and incongruent trials is known as the Stroop effect (Stroop, 1935). It is generally believed that the impairment on incongruent trials is the result of interference between word and color identification processes (e.g., see MacLeod, 1991; Posner & Snyder, 1975). The Stroop task has been serviceable in the study of strategic control mechanisms (Bugg & Crump, 2012; Levin & Tzelgoc, 2014). Lowe and Mitterer (1982) – and Logan, Zbrodoff, and Williamson (1984; see also Logan & Zbrodoff, 1979) – noted that proportion congruent manipulations had a robust impact on the Stroop effect. They observed smaller Stroop (and Stroop-like) effects when there were mostly incongruent (MI), than when there were mostly congruent (MC), trials with- in a block. This reduction of the Stroop effect with MI blocks is often referred to as the list-wide proportion congruent (LWPC) effect (Jacoby, Lindsay, & Hessels, 2003). The LWPC effect was first interpreted as a strategic modulation of word reading processes (Logan & Zbrodoff, 1979) and has typically called into question a strong Bautomaticity^ account of the Stroop effect. Logan and Zbrodoff proposed that this strategy might include weighing evidence from the irrelevant (e.g., word) di- mension a little less in MI conditions than in balanced (i.e., equal proportions of congruent and incongruent trials) or MC Electronic supplementary material The online version of this article (https://doi.org/10.3758/s13414-018-1496-9) contains supplementary material, which is available to authorized users. * Jason Ivanoff [email protected] 1 Department of Psychology, Saint Mary’ s University, Halifax B3H 3C3, Nova Scotia, Canada 2 Department of Psychology and Neuroscience, Dalhousie University, Halifax B3H 4R2, Nova Scotia, Canada Attention, Perception, & Psychophysics (2018) 80:1169–1181 https://doi.org/10.3758/s13414-018-1496-9 RETRACTED ARTICLE
-
Upload
nguyendiep -
Category
Documents
-
view
230 -
download
0
Transcript of the Stroop effect - link.springer.com · rive SATfs in a Stroop task. In Experiment 1, volunteers...
Losing control: Mostly incongruent lists postpone, but do not eliminate,the Stroop effect
Jason Ivanoff1 & Nicole E. Webb1& Harjot Chahal1 & Virginia P. Palango1
& Raymond M. Klein2& Steven R. Carroll1
Published online: 8 March 2018# The Psychonomic Society, Inc. 2018
AbstractIdentifying the color (e.g., red) of a color word that is incongruent (e.g., BBLUE^) can be remarkably difficult. The Stroop effectis a measure of the interference between activity from word and color pathways. The efficacy of these pathways is thought to behighly contingent on the frequency of incongruent trials within a block. A block of trials with mostly incongruent (MI) trialstypically results in a smaller Stroop effect than a block with mostly congruent (MC) trials. This reduction of the Stroop effect hasbeen largely attributed to the strategic list-wide control of the word pathway. Here, the time course of the Stroop effect wasexplored using speed-accuracy tradeoff functions (SATfs) in tasks with 50 % congruent, MC, and MI trials. In the MC and 50 %congruent condition, color-word congruency affected the rate parameter of the SATf. In the MI condition, however, congruencyaffected the asymptote. This evidence is consistent with the idea that the strategic control of the word pathway is an effortful,temporary phenomenon, prone to buckle if responding is held in check.
Keywords Attention . Stroop . Cognitive and attentional control
Introduction
The distinction between Bautomatic^ and Bcontrolled^ pro-cessing has long played a pivotal role in cognitive theorizing(e.g., Posner & Snyder, 1975). Although control processes arerelatively slower, more effortful, and more resource demand-ing, than Bautomatic^ processes, they are vital to the perfor-mance of goal-oriented and flexible behavior. Controlled pro-cesses are also necessary for monitoring conflict between in-formation processing pathways (e.g., Botvinick et al., 2001),although there is generally little consensus on the mechanismsthat accomplish this feat.
Identifying the color of a word stimulus is typically slowed,and more prone to erroneous responding, if the color (e.g.,
blue) and the word (e.g., RED) are incongruent. Congruentstimuli (e.g., RED written in the color red) are responded tomore quickly and less erroneously. The performance differ-ence between congruent and incongruent trials is known as theStroop effect (Stroop, 1935). It is generally believed that theimpairment on incongruent trials is the result of interferencebetween word and color identification processes (e.g., seeMacLeod, 1991; Posner & Snyder, 1975).
The Stroop task has been serviceable in the study of strategiccontrol mechanisms (Bugg & Crump, 2012; Levin & Tzelgoc,2014). Lowe and Mitterer (1982) – and Logan, Zbrodoff, andWilliamson (1984; see also Logan & Zbrodoff, 1979) – notedthat proportion congruent manipulations had a robust impacton the Stroop effect. They observed smaller Stroop (andStroop-like) effects when there were mostly incongruent(MI), than when there weremostly congruent (MC), trials with-in a block. This reduction of the Stroop effect withMI blocks isoften referred to as the list-wide proportion congruent (LWPC)effect (Jacoby, Lindsay, & Hessels, 2003). The LWPC effectwas first interpreted as a strategic modulation of word readingprocesses (Logan & Zbrodoff, 1979) and has typically calledinto question a strong Bautomaticity^ account of the Stroopeffect. Logan and Zbrodoff proposed that this strategy mightinclude weighing evidence from the irrelevant (e.g., word) di-mension a little less in MI conditions than in balanced (i.e.,equal proportions of congruent and incongruent trials) or MC
Electronic supplementary material The online version of this article(https://doi.org/10.3758/s13414-018-1496-9) contains supplementarymaterial, which is available to authorized users.
* Jason [email protected]
1 Department of Psychology, Saint Mary’s University, Halifax B3H3C3, Nova Scotia, Canada
2 Department of Psychology and Neuroscience, Dalhousie University,Halifax B3H 4R2, Nova Scotia, Canada
Attention, Perception, & Psychophysics (2018) 80:1169–1181https://doi.org/10.3758/s13414-018-1496-9
RETRACTED ARTIC
LE
conditions.Weighing the irrelevant dimension less is not unlikeinhibiting word reading: both processes reduce Stroop interfer-ence (Lindsay & Jacoby, 1994). Under the dual mechanism ofcontrol (DMC) framework (e.g., Braver, 2012), this account ofthe LWPC effect is thought to reflect proactive controlwhereina preparatory mental set (e.g., Binhibit reading^) influences theefficacy of a pathway before the onset of a stimulus whosefeatures trigger activity along said pathway.
Alternative accounts of the LWPC effect do not assume anycontribution of proactive control. Rather, these accounts pre-sume reactive processes (i.e., those that are only initiated inresponse to the stimulus; Braver, 2012; Bugg, 2014; Gonthier,Braver, & Bugg, 2016; Hutchison, 2011) are sufficient to ac-count for LWPC effects. For instance, some have proposedthat the inhibition of the task-irrelevant (i.e., word) pathwaymight take place at an early stage of the reading process,shortly after the presentation of the target (Jacoby et al.,2003). Reactive processes are less resource depleting thanproactive processes because they are used as needed. Theytend to be rather slow, however, as they need to be continuallyreactivated in the presence of the events that triggered them inthe first place (Braver, 2012).
While there have been numerous demonstrations of theLWPC effect, there is little known of its time course.Understanding the time course of stimulus processing is crit-ical to teasing apart reactive versus proactive sources of theLWPC effect. A proactive account presumes an early effect ofLWPC on target, and conflict, processing (Logan & Zbrodoff,1979). Alternatively, reactive processes should have no influ-ence on the early phase of target processing and should onlyaffect late components of target processing.
Event-related potentials (ERPs) are one approach that can beused to assess the mental chronometry of the LWPCmodulationof the Stroop effect. West and Alain (2000) observed a smallerdifference in the N450 component on MI trials than on MCtrials. They suggested the N450 reflects the activity of a neuralsystem involved in the inhibition of the (conceptual) processingof the word feature. This LWPC modulation of the N450, how-ever, was only seen with responses that were faster than themedian. Responses that were slower than the median tendedto have a larger Stroop effect and the N450 was unaffected bythe LWPC manipulation. They argued that the control mecha-nism responsible for suppressing word-reading processesBfluctuates in efficiency over time^ (West&Alain, 2000, p. 110).
Most investigations of the LWPC effect have relied heavilyon mean reaction time (RT) as the measure of performance.Although mean RT is certainly a valuable tool, the analysis ofthe mean RTs, alone, has limitations. In many tasks, error ratesare near ceiling and are analyzed either as an afterthought or asa way to reinforce the patterns observed in the more sensitivemeasure (i.e., RT). There is, however, a well-known tradingrelationship between accuracy and response time (i.e., thespeed-accuracy tradeoff; SAT). The SAT function (SATf), a
descriptive model of the SAT, has a rich history in psycho-physics (e.g., see Bogacz, Wagenmakers, Forstmann, &Nieuwenhuis, 2010; Pachella, 1974; Standage, Blohm, &Dorris, 2014). Although there are a number of methodologicalapproaches to measure the SATf (Wickelgren, 1977), the re-sponse-signal approach (Reed, 1973) has long held specialappeal because it allows for the quantitative assessment oftarget sensitivity (i.e., d′) as a function of time. The standardSATf is presented below (Wickelgren, 1977):
d0tð Þ ¼ λ 1−e−β t−δð Þ
h i; for t > δ; else 0; ð1Þ
Where the intercept (δ) is the time (t) where d′ begins to riseabove chance (d′=0) performance; β is a rate parameterindexing the change in d′ as a function of t; and λ is theasymptotic value of d′ reflecting discriminability.
Task-switching costs (Samavatyan & Leth-Steensen,2009), inhibition of return (Ivanoff & Klein, 2006; Zhaoet al., 2011), and global-local stimulus conflict (Boer &Keuss, 1982) have been shown to delay the intercept param-eter. This is generally consistent with the presence of a differ-ence in a preparatory state before the processing of the rele-vant target feature. The spatial orienting of attention appears toimprove the rate parameter and the asymptote (Carrasco &McElree, 2001; Giordano, et al., 2009; Grubb, White,Heeger, & Carrasco, 2014), consistent with an effect that iscontingent on some processing of the target. It is not currentlyknown how Stroop conflict affects the parameters of the SATf.
At first blush, the interpretation of the SATf seems trivial: itreflects the change in target evidence that occurs with process-ing time (or lag). The latent mechanisms underlying the SATf,however, appear to be quite complex (Ratcliff, 2006).Sequential sampling models (e.g., Ratcliff, Smith, Brown, &McKoon, 2016) generally assume that decision-making is theresult of a noisy accumulation of perceptual evidence from astarting point to a decision criterion. Most of these modelshold that the SATf is the result of a strategic shift in the deci-sion criterion1: emphasizing decision accuracy increases thedecision criterion and slows responding to allow more evi-dence to accrue. Others (e.g., Rae et al., 2014), however, haveclaimed that emphasizing speed not only decreases the deci-sion criterion, but also the rate in which evidence is extractedfrom the stimulus (see also Zhang & Rowe, 2014). Thesestudies, however, did not use the response-signal methodolo-gy. Not all methodological approaches to the SATf are equiv-alent (e.g., see Luce, 1986; Wickelgren, 1977). Nonetheless,most accounts of the SATf do hold some common assump-tions: (1) at short lags decisions are based on partial evidence
1 Alternatively, a shift in the starting point may be indistinguishable from acriterion-shift in some circumstances (e.g., see Ivanoff, Branning, & Marois,2008).
1170 Atten Percept Psychophys (2018) 80:1169–1181
RETRACTED ARTIC
LE

or, perhaps, guessing (Olman, 1966; see also Yellott, 1967)and (2) at long lags decisions are based on full evidence anddecisions that reach threshold early may be held in check untilthe response signal is presented (Ratcliff, 2006).
The purpose of the present investigation is twofold. Thefirst goal was to use the response-signal methodology to de-rive SATfs in a Stroop task. In Experiment 1, volunteers per-formed a manual Stroop task, with an equal proportion ofcongruent and incongruent trials under the standard Bfastand accurate^ instructions and with the SAT response-signalmethod. This first experiment will provide a baseline for thesecond goal of this study: to determine how parameters of theSATf in a manual Stroop task are affected by a LWPC manip-ulation. In Experiment 2, the frequency of congruent trials(i.e., MC) was increased. In Experiments 3 and 4 the propor-tion of incongruent trials (i.e., MI) was increased. The advan-tage of SATfs in this context is that they will allow us todetermine whether proactive control mechanisms are respon-sible for the LWPC effect in a manual Stroop task. A strictlyproactive control account of the LWPC effect predicts thatcongruency ought to affect the early portion of the SATf inMC and MI conditions (e.g., see Logan & Zbrodoff, 1979).On the other hand, if the LWPC effect is largely the result ofreactive control, then congruency ought to affect later compo-nents of the SATf in MC and MI conditions.
Experiment 1: 50 % congruent
Method
Participants
Most SAT studies collect hundreds or thousands of trials froma small sample of volunteers. Accordingly, the sample sizewas determined from pilot testing and matched what is typi-cally seen in the SAT literature. Ten Saint Mary’s Universitypsychology students, between the ages of 18 and 30 years,participated in return for course credit. Each took part in anindividual session that lasted approximately 2.5 h. All indi-viduals had English as a first language, normal hearing, andnormal (or corrected-to-normal) vision.
Apparatus and stimuli
All stimuli were presented on a 15-in iMac G3 desktop andresponses were entered on an Apple A1048 keyboard (Apple,CA, USA) modified for millisecond accuracy (Empirisoft,NY, USA). Superlab (Cedrus, CA, USA) was used to collectdata and present stimuli. The fixation point was a black dot,0.64° in diameter, presented at the center of the screen. Redand blue uppercase letters, printed in Times New Roman 72-point font, were presented on a white background at the center
of the computer screen. The response signal was a short (30ms) medium pitched tone (880 Hz).
Procedure
The experiment was conducted in a naturally lit, quiet room.Participants sat approximately 57cm from the screen. The in-structions were first read by the participants and then present-ed orally to them by a researcher. All participants practiced theStroop task in the standard task before the SAT task was in-troduced. There were four blocks of 64 trials (50 % werecongruent) in the standard task. Data from the standard taskwere used in the analysis of mean RTs, error rates, Vincentizedquintiles, and the parameters from the best fit ex-Gaussiandistribution (the latter two analyses are presented in theSupplemental Material).
Before the experiment began, participants were shown anexample of a congruent and an incongruent stimulus set andwere instructed to respond to the color of the word and not tothe word itself. The participants also practiced the task, withoutthe response tone, to become familiar with the response map-pings. At the beginning of each trial a black fixation point at thecenter of a white screen was presented for 750 ms. The fixationpoint was removed and the screen was left blank for 30ms. Theword BRED^ or BBLUE^ was then presented in either a red orblue color and remained visible for 45 ms. In the standard task,the next trial began after a response or after 1,500 ms hadlapsed. In the SAT task, the response signal was then presentedafter one of eight target-tone onset asynchronies (TTOAs: 60ms, 90 ms, 120 ms, 240 ms, 360 ms, 480 ms, 600 ms, or 1,200ms). Only one TTOA was presented within a block of trials,and the order of TTOAs was randomized between blocks andparticipants. If a response occurred within 240 ms of the onsetof the response signal, a cartoon happy face image was present-ed for 350 ms. If a response occurred after 240 ms, a cartoonsad face was presented for 1,200 ms. If a response occurredbefore the onset of the tone, a worried face (i.e., the mouth waspresented with a triangle wave pattern) was presented for 750ms. Four blocks of 64 trials were presented at each TTOA (i.e.,2,048 trials total). Half of the trials within each block werecongruent (and the other half were incongruent).
Statistical analysis
All comparisons between performance estimates on congruentand incongruent trials were performed using the nonparamet-ric Wilcoxon signed rank test because (1) the sample size wassmall and (2) the data often failed to satisfy the normalityassumption (according to Shapiro-Wilks tests) of a parametrictest (e.g., t-test). As a complement to the Wilcoxon signedrank test, the rank biserial correlation (rrb) was provided alongwith 95 % bootstrapped confidence intervals. This nonpara-metric measure of effect size is familiar to most researchers
Atten Percept Psychophys (2018) 80:1169–1181 1171
RETRACTED ARTIC
LE
and ranges from -1 to +1 (0 indicates no relationship). It isused to assess the monotonicity between a variable and acondition (Glass, 1966) in nonparametric designs. The valuesof rrb, and the 95% confidence intervals, were estimated usingthe mes.m function (Hentschke & Stüttgen, 2011) in Matlab(Mathworks Inc., Natick, MA).
Standard task The data from the standard task (i.e., thosewithout the SAT instructions) were pre-processed in twostages. First, individual RTs slower than 1,200 ms werediscarded for the ex-Gaussian and Vincentization analysis(see Supplemental Material) to avoid extreme values.2 Theremaining RTs were then trimmed before estimating the meanby excluding responses that were incorrect and greater than orless than three standard deviations from the mean.
SAT task Processing lag was calculated by averaging all RTs,relative to the onset of the target (not the tone), within a 360-ms window of the response tone. Sensitivity to the target’scolor (d′) was the primary measure of accuracy (Macmillan& Creelman, 2005). Hit or false alarm rates at floor or ceilingvalues were adjusted by subtracting or adding ½f (Kadlec,1999). Estimates of the d′ for each participant were achievedwith bootstrap resampling, using the mean of 10,000 samplesfor each condition at each TTOA to the individual cell (in the 8[TTOA] × 2 [congruence] matrix) with the fewest trials (e.g.,see Ivanoff, et al., 2014) because the total number of trials(i.e., the base) can influence d′ values as false alarm or hitrates approach floor or ceiling levels.
The SAT analysis comprised of two stages, following com-mon practice. First, the group mean data was analyzed using ahierarchical fitting approach (e.g., Carrasco & McElree, 2001;Giordano, et al., 2009; Ivanoff, et al., 2014; McElree &Carrasco, 1999) using maximum likelihood estimation (Liu &Smith, 2009) with the optimization function fmincon in Matlab(Mathworks, Natick, MA). The data were quantitativelyassessed using fits to the standard SATf (Eq. 1).
The fit was evaluated using twomeasures. First, the overall fitwas evaluated with an adjusted R2 (Dosher, Han, & Lu, 2004):
R2adj ¼ 1−
∑n
i¼1di−d̂̂i
� �2= n−kð Þ
∑n
i¼1di−d
� �2= n−1ð Þ
ð2Þ
In this equation, n is the number of data points, k is the
number of free parameters, di are the observed d′ values, d̂i arethe predicted d′ values, and di is the mean. Secondly, theSchwarz weighted Bayesian information criterion, wBIC(Wagenmakers & Farrell, 2004), was used to select the best
fit from the finite set of nested models ranging from a fullysaturated model (2δ-2β-2λ) to the simplest (null) model (1δ-1β-1λ; e.g., see Liu & Smith, 2009; Wagenmakers & Farrell,2004). The wBIC values can be used to determine the relativeweight of evidence for one model over another. The secondphase of the analysis involved the derivation and analysis ofparameter estimates (δ, β, and λ) from individual participants.Parameter estimates were derived from the fully saturatedmodel, separately for congruent and incongruent conditions.
Results
The data from one participant was removed from the analysisbecause of an extremely high error rate (48 %) in the standardtask. A technical error resulted in missing SAT data of anotherparticipant. The standard and SAT data from the remainingeight participants were analyzed. On average, the minimumproportion of responses (across TTOAs and conditions) occur-ring within time window was approximately 69 %. Thus,compliance with the response windows was good.
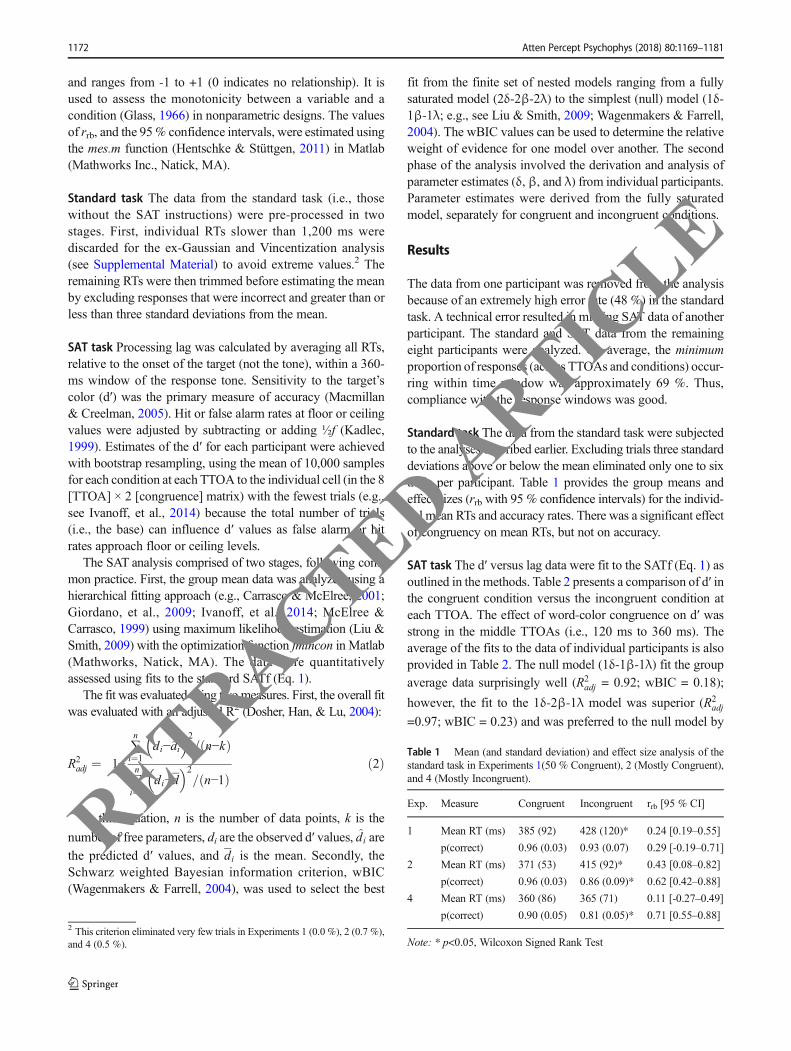
Standard task The data from the standard task were subjectedto the analyses described earlier. Excluding trials three standarddeviations above or below the mean eliminated only one to sixtrials per participant. Table 1 provides the group means andeffect sizes (rrb with 95 % confidence intervals) for the individ-ual mean RTs and accuracy rates. There was a significant effectof congruency on mean RTs, but not on accuracy.
SAT task The d′ versus lag data were fit to the SATf (Eq. 1) asoutlined in the methods. Table 2 presents a comparison of d′ inthe congruent condition versus the incongruent condition ateach TTOA. The effect of word-color congruence on d′ wasstrong in the middle TTOAs (i.e., 120 ms to 360 ms). Theaverage of the fits to the data of individual participants is alsoprovided in Table 2. The null model (1δ-1β-1λ) fit the groupaverage data surprisingly well (R2
adj = 0.92; wBIC = 0.18);
however, the fit to the 1δ-2β-1λ model was superior (R2adj
=0.97; wBIC = 0.23) and was preferred to the null model by
2 This criterion eliminated very few trials in Experiments 1 (0.0 %), 2 (0.7 %),and 4 (0.5 %).
Table 1 Mean (and standard deviation) and effect size analysis of thestandard task in Experiments 1(50 % Congruent), 2 (Mostly Congruent),and 4 (Mostly Incongruent).
Exp. Measure Congruent Incongruent rrb [95 % CI]
1 Mean RT (ms) 385 (92) 428 (120)* 0.24 [0.19–0.55]
p(correct) 0.96 (0.03) 0.93 (0.07) 0.29 [-0.19–0.71]
2 Mean RT (ms) 371 (53) 415 (92)* 0.43 [0.08–0.82]
p(correct) 0.96 (0.03) 0.86 (0.09)* 0.62 [0.42–0.88]
4 Mean RT (ms) 360 (86) 365 (71) 0.11 [-0.27–0.49]
p(correct) 0.90 (0.05) 0.81 (0.05)* 0.71 [0.55–0.88]
Note: * p<0.05, Wilcoxon Signed Rank Test
1172 Atten Percept Psychophys (2018) 80:1169–1181
RETRACTED ARTIC
LE
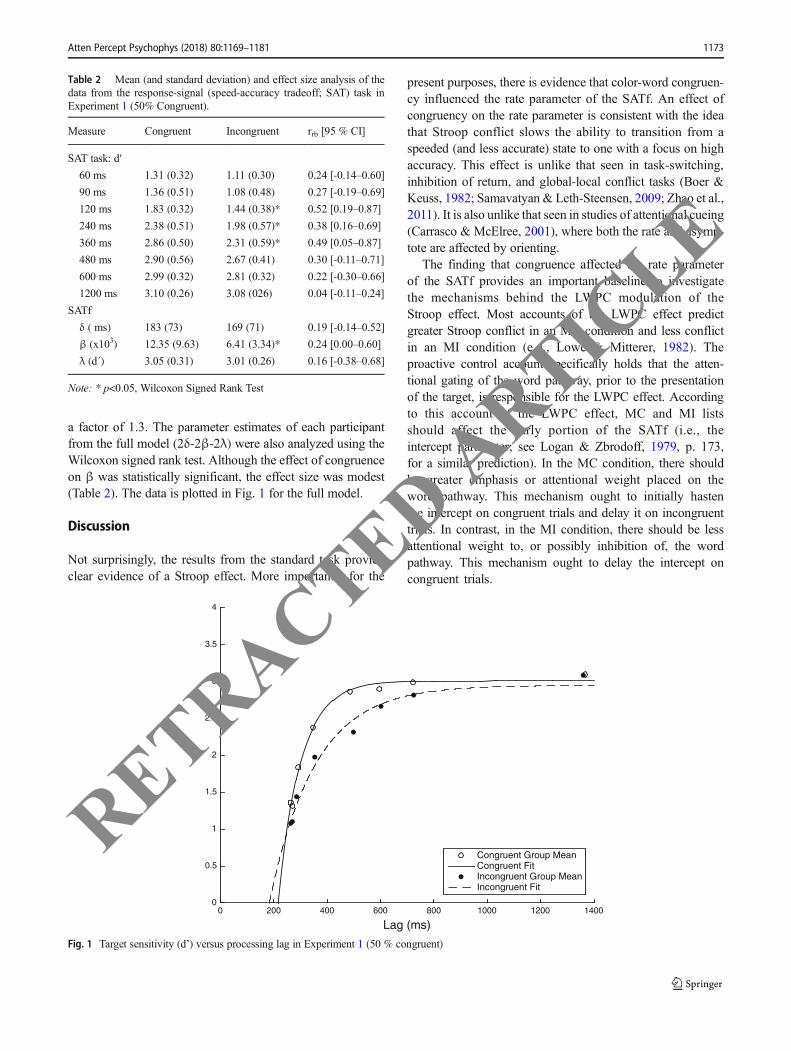
a factor of 1.3. The parameter estimates of each participantfrom the full model (2δ-2β-2λ) were also analyzed using theWilcoxon signed rank test. Although the effect of congruenceon β was statistically significant, the effect size was modest(Table 2). The data is plotted in Fig. 1 for the full model.
Discussion
Not surprisingly, the results from the standard task provideclear evidence of a Stroop effect. More importantly for the
present purposes, there is evidence that color-word congruen-cy influenced the rate parameter of the SATf. An effect ofcongruency on the rate parameter is consistent with the ideathat Stroop conflict slows the ability to transition from aspeeded (and less accurate) state to one with a focus on highaccuracy. This effect is unlike that seen in task-switching,inhibition of return, and global-local conflict tasks (Boer &Keuss, 1982; Samavatyan & Leth-Steensen, 2009; Zhao et al.,2011). It is also unlike that seen in studies of attentional cueing(Carrasco & McElree, 2001), where both the rate and asymp-tote are affected by orienting.
The finding that congruence affected the rate parameterof the SATf provides an important baseline to investigatethe mechanisms behind the LWPC modulation of theStroop effect. Most accounts of the LWPC effect predictgreater Stroop conflict in an MC condition and less conflictin an MI condition (e.g., Lowe & Mitterer, 1982). Theproactive control account specifically holds that the atten-tional gating of the word pathway, prior to the presentationof the target, is responsible for the LWPC effect. Accordingto this account of the LWPC effect, MC and MI listsshould affect the early portion of the SATf (i.e., theintercept parameter; see Logan & Zbrodoff, 1979, p. 173,for a similar prediction). In the MC condition, there shouldbe greater emphasis or attentional weight placed on theword pathway. This mechanism ought to initially hastenthe intercept on congruent trials and delay it on incongruenttrials. In contrast, in the MI condition, there should be lessattentional weight to, or possibly inhibition of, the wordpathway. This mechanism ought to delay the intercept oncongruent trials.
Lag (ms)0 200 400 600 800 1000 1200 1400
d'
0
0.5
1
1.5
2
2.5
3
3.5
4
Congruent Group MeanCongruent FitIncongruent Group MeanIncongruent Fit
Fig. 1 Target sensitivity (d’) versus processing lag in Experiment 1 (50 % congruent)
Table 2 Mean (and standard deviation) and effect size analysis of thedata from the response-signal (speed-accuracy tradeoff; SAT) task inExperiment 1 (50% Congruent).
Measure Congruent Incongruent rrb [95 % CI]
SAT task: d′
60 ms 1.31 (0.32) 1.11 (0.30) 0.24 [-0.14–0.60]
90 ms 1.36 (0.51) 1.08 (0.48) 0.27 [-0.19–0.69]
120 ms 1.83 (0.32) 1.44 (0.38)* 0.52 [0.19–0.87]
240 ms 2.38 (0.51) 1.98 (0.57)* 0.38 [0.16–0.69]
360 ms 2.86 (0.50) 2.31 (0.59)* 0.49 [0.05–0.87]
480 ms 2.90 (0.56) 2.67 (0.41) 0.30 [-0.11–0.71]
600 ms 2.99 (0.32) 2.81 (0.32) 0.22 [-0.30–0.66]
1200 ms 3.10 (0.26) 3.08 (026) 0.04 [-0.11–0.24]
SATf
δ ( ms) 183 (73) 169 (71) 0.19 [-0.14–0.52]
β (x103) 12.35 (9.63) 6.41 (3.34)* 0.24 [0.00–0.60]
λ (d´) 3.05 (0.31) 3.01 (0.26) 0.16 [-0.38–0.68]
Note: * p<0.05, Wilcoxon Signed Rank Test
Atten Percept Psychophys (2018) 80:1169–1181 1173
RETRACTED ARTIC
LE

Reactive control kicks in only after the target ap-pears, presumably after some degree of stimulus-response translation. Accordingly, this account predictsa late influence of LWPC on the SATf, presumably onthe rate parameter. In the MC condition, the greaterweight on the word pathway ought to augment the rateparameter difference between congruent and incongruentconditions. In the MI condition, the reactive control ac-count predicts that there ought to be little or no impactof congruence on the rate parameter.
Experiment 2: Mostly congruent
In the current experiment, the predictions of the proactive andreactive control accounts were investigated in the MC condi-tion (75 % congruent). According to the proactive controlaccount, congruency should hasten the intercept parameter.The reactive control account predicts a greater difference be-tween the rate parameter for congruent and incongruent trialsthan that observed in Experiment 1.
Method
Participants
Nine volunteers, from Saint Mary’s University, participated inthis study in return for course credit. None of the volunteersparticipated in Experiment 1.
Stimuli, apparatus, and procedure
The stimulus, apparatus, and procedure were identical tothat in Experiment 1 with the following exception. Inthe standard task, there were four blocks of 48 congru-ent and 16 incongruent trials. Likewise, in the SATtask, there were four blocks of 48 congruent and 16incongruent trials, for each TTOA.
Results
The data from one volunteer was unusable due to ahigh number (>80 %) of responses before the responsetone at the longest (1,200 ms) TTOA. The data fromthe remaining eight volunteers was submitted to thesame analysis steps as in Experiment 1. The averageminimal proportion of responses within the windowwas about 71 %.
Standard task Excluding RTs greater or less than three stan-dard deviations from the mean eliminated two to seven trialsper participant. The results from the remaining trials in the
standard task are provided in Table 1. There was a significantcongruency effect on mean RTs and accuracy rates.
SAT task Table 3 presents the effect of congruency on d′across TTOAs. While the null model fit the group av-
erage data well (R2adj =0.82; wBIC=0.10), the 1δ-2β-1λ
model (R2adj =0.97; wBIC=0.28) and the 1δ-1β-2λ mod-
el (R2adj =0.96; wBIC=0.24) provided better descriptions
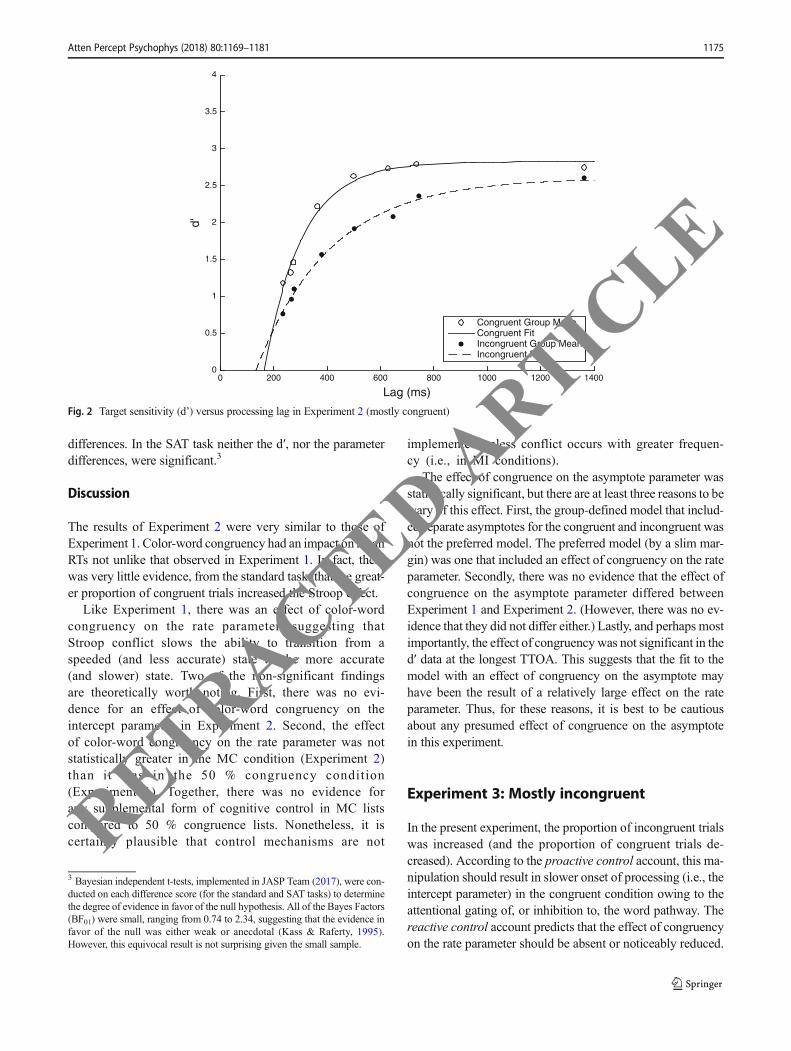
of the data. The 1δ-2β-1λ model was preferred over the1δ-1β-2λ model by a slim margin (i.e., 0.28/0.24 =1.17). There is good reason, however, to be suspiciousof the 1δ-1β-2λ model as the d′ difference betweencongruent and incongruent conditions at the longestTTOA (1,200 ms) was small and it was not statisticallysignificant. A bloated d′ difference between the congru-ent and incongruent conditions within the mid TTOAsmay be responsible for the reasonable fit of the 1δ-1β-2λ model. Figure 2 illustrates the fit of the full modelto the group data. The parameters from the individualfits of the full model were compared with Wilcoxonsign rank test. Color-word congruency significantly af-fected the β and λ parameters (Table 3).
Fifty percent congruent (Experiment 1) versus MC(Experiment 2) The nonparametric Mann-Whitney U testwas used to compare the incongruent-congruent difference(i.e., the Stroop effect) between experiments. All measuresof the incongruent-congruent difference in Experiment 1 (50% congruent) were compared to those in Experiment 2 (MC)using the Mann-Whitney U test (for independent samples). Inthe standard task there were no statistically significant
Table 3 Mean (and standard deviation) and effect size analysis of thedata from the response-signal (speed-accuracy tradeoff; SAT) task inExperiment 2 (Mostly Congruent).
Measure Congruent Incongruent rrb [95 % CI]
SAT task: d′
60 ms 1.18 (0.74) 0.76 (0.75)* 0.27 [0.03–0.60]
90 ms 1.46 (0.72) 1.10 (0.74) 0.27 [0.03–0.63]
120 ms 1.33 (0.73) 0.97 (0.70)* 0.30 [0.11–0.55]
240 ms 2.22 (0.49) 1.57 (0.70)* 0.57 [0.44–0.88]
360 ms 2.63 (0.30) 1.92 (0.26)* 0.79 [0.63–0.88]
480 ms 2.73 (0.32) 2.09 (0.58)* 0.58 [0.38–0.87]
600 ms 2.80 (0.27) 2.36 (0.40)* 0.41 [0.13–0.84]
1200 ms 2.74 (0.28) 2.61 (0.34) 0.11 [-0.05–0.38]
SATf
δ ( ms) 168 (69) 119 (90) 0.30 [-0.22–0.69]
β (x103) 14.20 (20.50) 4.02 (2.34)* 0.68 [0.30–0.88]
λ (d´) 2.84 (0.28) 2.62 (0.43)* 0.30 [-0.05–0.71]
Note: * p<0.05–Wilcoxon Signed Rank Test
1174 Atten Percept Psychophys (2018) 80:1169–1181
RETRACTED ARTIC
LE
differences. In the SAT task neither the d′, nor the parameterdifferences, were significant.3
Discussion
The results of Experiment 2 were very similar to those ofExperiment 1. Color-word congruency had an impact onmeanRTs not unlike that observed in Experiment 1. In fact, therewas very little evidence, from the standard task, that the great-er proportion of congruent trials increased the Stroop effect.
Like Experiment 1, there was an effect of color-wordcongruency on the rate parameter, suggesting thatStroop conflict slows the ability to transition from aspeeded (and less accurate) state to the more accurate(and slower) state. Two of the non-significant findingsare theoretically worth noting. First, there was no evi-dence for an effect of color-word congruency on theintercept parameter in Experiment 2. Second, the effectof color-word congruency on the rate parameter was notstatistically greater in the MC condition (Experiment 2)than it was in the 50 % congruency condition(Experiment 1). Together, there was no evidence forany supplemental form of cognitive control in MC listscompared to 50 % congruence lists. Nonetheless, it iscertainly plausible that control mechanisms are not
implemented unless conflict occurs with greater frequen-cy (i.e., in MI conditions).
The effect of congruence on the asymptote parameter wasstatistically significant, but there are at least three reasons to bewary of this effect. First, the group-defined model that includ-ed separate asymptotes for the congruent and incongruent wasnot the preferred model. The preferred model (by a slim mar-gin) was one that included an effect of congruency on the rateparameter. Secondly, there was no evidence that the effect ofcongruence on the asymptote parameter differed betweenExperiment 1 and Experiment 2. (However, there was no ev-idence that they did not differ either.) Lastly, and perhaps mostimportantly, the effect of congruencywas not significant in thed′ data at the longest TTOA. This suggests that the fit to themodel with an effect of congruency on the asymptote mayhave been the result of a relatively large effect on the rateparameter. Thus, for these reasons, it is best to be cautiousabout any presumed effect of congruence on the asymptotein this experiment.
Experiment 3: Mostly incongruent
In the present experiment, the proportion of incongruent trialswas increased (and the proportion of congruent trials de-creased). According to the proactive control account, this ma-nipulation should result in slower onset of processing (i.e., theintercept parameter) in the congruent condition owing to theattentional gating of, or inhibition to, the word pathway. Thereactive control account predicts that the effect of congruencyon the rate parameter should be absent or noticeably reduced.
3 Bayesian independent t-tests, implemented in JASP Team (2017), were con-ducted on each difference score (for the standard and SAT tasks) to determinethe degree of evidence in favor of the null hypothesis. All of the Bayes Factors(BF01) were small, ranging from 0.74 to 2.34, suggesting that the evidence infavor of the null was either weak or anecdotal (Kass & Raferty, 1995).However, this equivocal result is not surprising given the small sample.
Lag (ms)0 200 400 600 800 1000 1200 1400
d'
0
0.5
1
1.5
2
2.5
3
3.5
4
Congruent Group MeanCongruent FitIncongruent Group MeanIncongruent Fit
Fig. 2 Target sensitivity (d’) versus processing lag in Experiment 2 (mostly congruent)
Atten Percept Psychophys (2018) 80:1169–1181 1175
RETRACTED ARTIC
LE

Method
Participants
Seven new volunteers took part in the study for course credit.
Apparatus, stimuli, and procedure
The methodology was identical to that in Experiment 2 withthe exception that the ratio of congruent to incongruent trialswas now 1:3 (rather than 3:1 as it was in Experiment 2).
Results
Due to a programming error, the data from the standardtask was unusable. The error was detectable aftercollecting data from seven volunteers. The error wasnot present in the SAT task. Thus, only the data fromthe SAT task is reported. This error was corrected, andall analyses conducted, in a replication (see Experiment4).
SAT task The best model was one with only a change in theasymptote (1δ-1β-2λ; R2
adj =0.971; wBIC=0.39). It was pref-
erable to the null (1δ-1β-1λ; R2adj =0.72; wBIC=0.13) by a
factor of 3.0. The group data is plotted in Fig. 3 for the fullmodel. The parameters from the full model were comparedwith theWilcoxon signed rank test and rrb. As seen in Table 4,congruency only significantly affected λ.
Fifty percent congruent (Experiment 1) versus MI (Experiment3) The same between-experiment analyses performed withExperiments 1 and 2 was performed here with Experiments1 and 3. The congruent–incongruent difference in λ was sig-nificantly different between Experiments 1 and 3 (U=4,p<0.05). This difference was driven by a lower λ inExperiment 3 in the incongruent condition compared to theλ in Experiment 1 in the incongruent condition (U=56,p<0.05). There was no between-experiment difference in thecongruent condition.
Discussion
There was no evidence for an effect of congruency on theintercept in this experiment. This finding is not consistent withthe predictions of the proactive control account. In contrast towhat was observed in Experiments 1 and 2, there was noevidence for an effect of color-word congruency on the rateparameter4, a finding consistent with a reactive control ac-count. Unexpectedly, there was also a large effect of
congruency on the asymptote. This finding is consistent withneither the proactive nor reactive cognitive control accounts.Owing to an unfortunate coding error, the data from the stan-dard task were unusable. For this reason, this coding error wasremedied in Experiment 4. Experiment 4 was also an attemptto replicate the finding in the SAT task in Experiment 3.
Experiment 4: Mostly incongruent(Replication)
The current experiment was designed to replicate the SATresults from Experiment 3. The coding error that resulted inthe loss of data from the standard task was fixed.
Method
Participants
Ten new volunteers took part in this experiment for coursecredit.
Procedure
The task was an exact replication of Experiment 3, with theexception that the coding error for the standard task was fixed.
Results
Surprisingly, one of the volunteers performed the SAT tasknear perfectly (even at the fastest TTOAs) and there was noadequate fit to their data using Equation 1. Another volunteerappeared to struggle with the task, or failed to understand theinstructions, even at the longest TTOA in the congruent con-dition (d′ = 0.37). The analysis was performed on the datafrom the remaining eight volunteers.
Standard task Two to seven trials, per volunteer, were re-moved following the application of the three standard devia-tion exclusionary criteria. The results from the standard taskare provided in Table 1. As is commonly observed in the MIcondition, there was no effect of congruency on mean RTs.The only effect of congruency was observed on the accuracyrate.
SAT taskThe best model (1δ-1β-2λ; R2adj =0.96; wBIC = 0.52)
was one in which only λ differed between conditions. The 1δ-1β-2λ model was preferred to the null model (1δ-1β-1λ; R2
adj
=0.69; wBIC = 0.04) by a wide margin (14.3). The data isplotted in Figure 4 for the full model. The parameters from theindividual fits were compared with the Wilcoxon signed rank
4 Using a Bayesian approach, there was only anecdotal evidence for a nulleffect of congruency on β (BF01 = 2.13) and δ (BF01 = 2.66).
1176 Atten Percept Psychophys (2018) 80:1169–1181
RETRACTED ARTIC
LE

test. As seen in Table 5, color-word congruency only signifi-cantly affected λ5.
Fifty percent congruent (Experiment 1) versus MI (Experiment4) In the standard task, the effect of congruency onmean RTs and the accuracy rate did not differ signifi-cantly between Experiments 1 and 4. In the SAT task,the congruent-incongruent difference in the λ parameterwas greater in Experiment 4 than it was in Experiment1 (U=8, p<0.05), largely because of a drop in λ in theincongruent condition in Experiment 4 compared to theincongruent condition in Experiment 1(U=64, p<0.05).However, there was also a smaller between-experimentdifference in the congruent condition (U=53, p<0.05),with a lower λ in Experiment 4 than in Experiment 1.There were no other differences between the SATf pa-rameters in Experiments 1 and 4.
Discussion
Like most studies of the LWPC effect, there was no evi-dence of color-word congruency on mean RTs in the MIcondition. In fact, the only convincing effect of congruen-cy was on the error rate in the standard task. The effect ofcongruency on the error rate was similar in magnitude tothat in the MC condition (Experiment 2), and thebetween-experiment analysis revealed no interaction acrosserror rates or any of the other measures from the standard
task. Thus, the LWPC effect appears to be limited tomean RT.
Importantly, the effects of congruency on the SATf weresimilar to those from Experiment 3. There was only an effectof congruency on the asymptote. No account of the LWPCeffect readily predicts a greater effect of congruency on anyperformance metric in MI versus 50 % congruent tasks.Instead, the results suggest that in MI conditions the congru-ency effect is only seen with very late responses and mayreflect a failure of cognitive control.
5 Like Experiment 3, there was only anecdotal evidence for a null effect ofcongruency on β (BF01 = 1.91) and δ (BF01 = 2.52).
Lag (ms)0 200 400 600 800 1000 1200 1400
d'
0
0.5
1
1.5
2
2.5
3
3.5
4
Congruent Group MeanCongruent FitIncongruent Group MeanIncongruent Fit
Fig. 3 Target sensitivity (d’) versus processing lag in Experiment 3 (mostly incongruent)
Table 4 Mean (and standard deviation) and effect size analysis of thedata from the response-signal (speed-accuracy tradeoff; SAT) task inExperiment 3 (Mostly Incongruent)
Measure Congruent Incongruent rrb [95 % CI]
SAT task: d′
60 ms 1.01 (0.61) 0.89 (0.31) 0.12 [-0.38–0.49]
90 ms 1.36 (0.48) 0.94 (0.38)* 0.41 [0.13–0.73]
120 ms 1.26 (0.78) 1.05 (0.52) 0.19 [-0.13–0.56]
240 ms 2.10 (0.64) 1.51 (0.49)* 0.48 [0.34–0.84]
360 ms 2.12 (0.84) 1.65 (0.44) 0.48 [0.05–0.89]
480 ms 2.46 (0.53) 1.75 (0.39)* 0.66 [0.45–0.89]
600 ms 2.49 (0.56) 1.83 (0.32)* 0.66 [0.45–0.89]
1200 ms 2.60 (0.35) 1.94 (0.21)* 0.80 [0.66–0.89]
SATf
δ (ms) 143 (97) 154 (84) 0.02 [-0.38–0.38]
β (x103) 13.95 (17.02) 18.34 (26.32) 0.05 [-0.31–0.34]
λ (d´) 2.80 (0.32) 2.04 (0.17)* 0.87 [0.87–0.89]
Note: * p<0.05, Wilcoxon Signed Rank Test
Atten Percept Psychophys (2018) 80:1169–1181 1177
RETRACTED ARTIC
LE

General discussion
The temporal loci of the Stroop and LWPC effects were un-covered with SATfs. The key findings from this novel combi-nation of methodologies can be summarized succinctly in twoways. First, in a Stroop task with 50 % congruency(Experiment 1) or withMC (Experiment 2), the rate parameterof the SATf was greater on congruent trials than it was onincongruent trials. Tentatively, this finding might be the resultof convergent, summative response activation from two
sources (word and color pathways) on congruent trials im-proving the transition from fast and inaccurate responding toslow and accurate responding. Alternatively, the conflict fromthese two sources on incongruent trials might have made thistransition more difficult. Although future studies using a suit-able neutral condition might determine which account bestdescribes the effect of congruency on the SATf, there arewell-known challenges associated with selecting an appropri-ate neutral condition (e.g., Jonides & Mack, 1984; MacLeod,1991).
The second key result concerned the LWPC manipulation.The LWPC effect in the standard RT task was replicated:color-word congruence affected mean RT in the 50 % congru-ence (Experiment 1) and MC (Experiment 2) conditions, butnot in the MI condition (Experiment 4). Likewise, in the SATtask, there was an effect of color-word congruence on the rateparameter in the 50% congruence and MC conditions, but notin the MI conditions (Experiments 3 and 4). As previouslydiscussed, these effects on the rate parameter suggest thatthere is a reactive, strategic modulation of the word pathway.However, the larger effect of congruency on the asymptoticparameter in the MI tasks (Experiments 3 and 4), compared tothe 50 % congruent task (Experiment 1), does not readily fitwith theories of the LWPC effect and more generally withinthe DMC framework. Blanket assertions – that the Stroopeffect is reduced (or eliminated) in MI conditions – no longerappear to be accurate. Although the Stroop effect was notapparent under MI conditions within the early phase of theSATf, it was present in the later phase (i.e., the asymptoteparameter). This pattern (i.e., greater Stroop effect in an MIlist than a list with 50 % congruence or MC) has not been
Table 5 Mean (and standard deviation) and effect size analysis of thedata from the response-signal (speed-accuracy tradeoff; SAT) task inExperiment 4 (Mostly Incongruent).
Measure Congruent Incongruent rrb [95% CI]
SAT task: d′
60 ms 0.93 (0.85) 0.64 (0.61) 0.19 [-0.08–0.55]
90 ms 1.38 (0.82) 1.13 (0.56) 0.30 [0.03–0.69]
120 ms 1.13 (0.83) 0.94 (0.75) 0.14 [-0.03–0.41]
240 ms 1.94 (0.56) 1.36 (0.34)* 0.65 [0.46–0.88]
360 ms 2.22 (0.33) 1.55 (0.37)* 0.73 [0.55–0.88]
480 ms 2.56 (0.67) 1.80 (0.46)* 0.68 [0.46–0.88]
600 ms 2.44 (0.62) 1.77 (0.41)* 0.68 [0.46–0.88]
1200 ms 2.54 (0.44) 1.84 (0.24)* 0.73 [0.54–0.88]
SATf
δ ( ms) 166 (42) 185 (51) 0.24 [-0.36–0.76]
β (x103) 9.77 (6.02) 29.95 (52.25) 0.14 [-0.38–0.63]
λ (d´) 2.54 (0.53) 1.80 (0.23)* 0.65 [0.22–0.88]
Note: * p<0.05, Wilcoxon Signed Rank Test
Lag (ms)0 200 400 600 800 1000 1200 1400
d'
0
0.5
1
1.5
2
2.5
3
3.5
4
Congruent Group MeanCongruent FitIncongruent Group MeanIncongruent Fit
Fig. 4 Target sensitivity (d’) versus processing lag in Experiment 4 (mostly incongruent)
1178 Atten Percept Psychophys (2018) 80:1169–1181
RETRACTED ARTIC
LE
reported quite like this before and has important implicationsfor theories of cognitive control and the LWPC effect.
As argued earlier, the proactive control account is, perhaps,the most intuitive account of the LWPC effect. It attributes theLWPC effect to an alteration of a sustained mental set that im-pacts the accessibility of word reading pathways. Logan andZbrodoff (1979) thought that a Bshift in the initial state of evi-dence about word meaning … might be observed in the earlyportion of the [SAT] function^ (p. 173). Braver (2012) arguedthat proactive control is Ba form of ‘early selection’ in whichgoal-relevant information is actively maintained in a sustainedmanner, before the occurrence of cognitively demanding events[emphasis added], to optimally bias attention, perception andaction systems in a goal-driven manner^ (p. 106).Accordingly, the proactive account of the LWPC effect predict-ed an effect of color-word congruency on the SATf interceptparameter in the MC and MI conditions. Contrary to this pre-diction, there was no evidence of an effect of LWPC on theintercept parameter in any experiment. Instead, the present re-sults implicate reactive control as the source of the LWPC effect.
The results from other studies have also called intoquestion the role of proactive control in LWPC tasks.Bugg, Jacoby and Toth (2008; see also Jacoby et al.,2003) mixed balanced and MI stimuli within a block sothat the overall frequency of incongruent stimuli wasgreater than the frequency of congruent stimuli. Theyobserved a reduced Stroop effect for stimuli that werepart of the MI list, but not for stimuli with balancedfrequencies that were included in the list, suggestingthat proactive control is not responsible for the LWPCeffect. However, with a similar approach, Hutchison(2011; see also Bugg & Chanani, 2011) found evidenceof a general LWPC effect not readily attributable tospecific items (c.f., Jacoby et al., 2003). Moreover, thisLWPC effect was greatest for those individuals with lowworking memory capacity. Maintaining proactive controlfor an extended period of time may be too onerous forsome individuals. Thus, evidence for proactive controlmay be complicated by individual differences and, per-haps, subtle differences in experimental design.
While reactive control readily accounts for the mod-ulating effect of LWPC on the SATf rate parameter, itdoes not readily explain the large effect of color-wordcongruency on the SATf asymptote parameter in the MIconditions in Experiments 3 and 4. It is plausible that,like other forms of control (e.g., Inzlicht & Schmeichel,2012), the attenuation of cognitive conflict by reactivecontrol mechanisms in MI lists is resource- or time-lim-ited. Some have suggested that, with long TTOAs inresponse-signal tasks, the response decision is simplyheld in check until the response signal is presented(e.g., Ratcliff, 2006). While this generalization may holdfor simpler tasks, it does not seem to apply in Stroop
tasks, as it does not explain the effect of congruency onthe asymptote. It is possible that maintaining controlover the word pathway in the MI condition is too ardu-ous to maintain for a long period of time. The suppres-sion of the word pathway may be released before theresponse is finally executed. In other words, it appearsto be a lapse in cognitive control. Of course, this pro-posal – although intriguing and consistent with the cur-rent findings – requires further investigation.
Limitations and other factors
The present study reflects the first attempt to describe theeffect of Stroop color-word congruence on the SATf. Anyinterpretations are naturally bound by methodological and an-alytical choices. These choices are discussed below.
The Stroop effect may have different locus in manualtasks than it does in vocal tasks (Liotti, Woldorff, Perez,& Mayberg, 2000; Sharma & McKenna, 1998), and, ifso, this places restrictions on the generality of the pres-ent findings. A Bnontraditional^ Stroop task with manu-al responses was used for pragmatic reasons. In pilottesting, it was noted that vocal responses with theresponse-signal methodology posed a number of uniquechallenges. Vocal responses were often self-correctedmidway through pronunciation (e.g., Bre…blue^).Missed deadlines were more likely than vocal mistakesat short TTOAs. It is possible that extensive training orother methodological approaches to the SATf (e.g.,response deadlines rather than windows; e.g., seeLindsay & Jacoby, 1994) may mitigate this limitation.
In the current work LWPC was manipulated in abetween-subjects design. Within-subjects designs aremuch more common in the literature. There are at leasttwo implications of the between-subjects approach.Firstly, it may discourage the use of different strategiesacross conditions (e.g., 50 % congruent, MI, or MC)because there is no Bbaseline^ strategy to shift awayfrom. It is possible that MC lists do not strongly pro-mote the use of the word pathway unless there is expe-rience with a condition wherein congruent trials aremuch less frequent (e.g., 50 % congruent or MI).Regardless, those in the MI condition, although neverexperiencing either the MC or 50 % congruency condi-tions, clearly adopted a distinctive processing strategy.An advantage of the between-subjects approach is thatthere is no need to be concerned with order effects andstrategic spill-over from one condition (e.g., MC) toanother (e.g., MI). Secondly, the between-subjects ap-proach is less statistically powerful than the within-subjects design. The relatively small sample size (for abetween-subjects contrast) certainly does not help.
Atten Percept Psychophys (2018) 80:1169–1181 1179
RETRACTED ARTIC
LE

Nevertheless, despite this limitation, some between-subject differences were revealed.
The SAT methodological approach might have been chal-lenging for some volunteers. The task was performed in asingle session lasting approximately 2.5 h (with severalbreaks). Some volunteers described the testing session asBtiring^. It is possible that this is not the ideal preconditionfor proactive control. Consequently, a potential limitation ofthe present work is that the failure to find evidence for proac-tive control in a SAT task cannot be taken as evidence againstany contribution of proactive control in all SAT tasks.
The two-stimulus/two-response design used here may beoverly simplistic and may not necessarily muster proactivecontrol. Nonetheless, this was not an uncommon methodologicalapproach in the early literature. Interestingly, Logan, Zbrodoff, andWilliamson (1984) failed to find evidence for a LWPC effect witha larger stimulus set. It is not clear why a task with a largerstimulus set eliminates the LWPC effect, although a future SATstudy may help to identify the locus of this discrepancy.
Future investigations of proactive control in conflict tasksmaywant to consider avoiding trial frequencymanipulations asthis may confound trial-by-trial sequence effects with top-downcontrol. There seems to be potential in one particular method-ological approach. Entel, Tzelgov, and Bereby-Meyer (2014)found evidence for an LWPC-like effect with simple (althoughfalse) MC and MI instructions in a list of balanced trial types.Logan and Zbrodoff (1982) observed larger spatial Stroop ef-fects when a cue was informative with respect to the type oftrial (congruent or incongruent) than when it was uninformative(see also Bugg & Smallwood, 2016; Goldfarb & Henik, 2013;Hutchison, Bugg, Lim, & Olsen, 2016). Evidence for proactivecontrol in Stroop tasks may require procedures that encouragethe engagement of a specific mental set (before stimulus onset)by discouraging reactive control strategies.
Summary
In the first quantitative SAT investigation of a Stroop effectusing the response-signal method, an effect of congruency onthe rate parameter was observed in 50 % congruent and MCconditions. Increasing the proportion of incongruent trials(MI) eliminated the congruency effect on the rate parameter,but increased the effect of congruency on the asymptote. Thefindings suggest that the strategic, reactive control of theStroop effect in MI lists is likely effortful and is prone toeventually fail.
Author Note We would like to thank Bryan R. Burnham, ananonymous reviewer, and Todd Kahan for their reviews of ourmanuscript. We also thank Andrew Heathcote for his reviewon an earlier draft of this manuscript. This workwas supportedby a discovery grant from the National Science andEngineering Research Council of Canada to J.I.
References
Boer, L. C., & Keuss, P. J. (1982). Global precedence as a postperceptualeffect: An analysis of speed-accuracy tradeoff functions. Perception& Psychophysics, 31(4), 358–366.
Bogacz, R., Wagenmakers, E. J., Forstmann, B. U., & Nieuwenhuis, S.(2010). The neural basis of the speed-accuracy tradeoff. Trends inNeurosciences, 33(1), 10–16. https://doi.org/10.1016/j.tins.2009.09.002
Botvinick, M. M., Braver, T. S., Barch, D. M., Carter, C. S., & Cohen, J.D. (2001). Conflict monitoring and cognitive control. PsychologicalReview, 108(3), 624–652.
Braver, T.S. (2012). The variable nature of cognitive control: A dual mech-anisms framework. Trends in Cognitive Sciences, 16(2), 106-113.
Bugg, J.M. (2014). Conflict-triggered top-down control: Default mode,last resort, or no such thing? Journal of Experimental Psychology:Learning, Memory, and Cognition, 40, 567–587.
Bugg, J.M. & Chanani, S. (2011). List-wide control is not entirely elu-sive: Evidence from picture-word Stroop. Psychonomic Bulletin &Review, 18, 930–936.
Bugg, J.M. & Crump, M.J.C. (2012). In support of a distinction betweenvoluntary and stimulus-driven control: A review of the literature onproportion congruent effects. Frontiers in Psychology, 3(367), 1-16.https://doi.org/10.3389/fpsyg.2012.00367
Bugg, J.M. & Smallwood, A. (2016). The next trial will be conflicting!Effects of explictit congruency pre-cues on cognitive control.Psychological Research, 80, 16-33.
Bugg, J. M., Jacoby, L. L., & Toth, J. P. (2008). Multiple levels of controlin the Stroop task.Memory & Cognition, 36(8), 1484-1494. https://doi.org/10.3758/MC.36.8.1484
Carrasco, M., & McElree, B. (2001). Covert attention accelerates the rateof visual information processing. Proceedings of the NationalAcademy of Sciences of the United States of America, 98(9), 5363-5367. https://doi.org/10.1073/pnas.081074098
Dosher, B. A., Han, S., & Lu, Z. L. (2004). Parallel processing in visualsearch asymmetry. Journal of Experimental Psychology: HumanPerception and Performance, 30(1), 3-27. https://doi.org/10.1037/0096-1523.30.1.3
Entel, O., Tzelgov, J., & Bereby-Meyer, Y. (2014). Proportion congruen-cy effects: Instructions may be enough. Frontiers in Psychology,5:1108. https://doi.org/10.3389/fpsyg.2014.01108
Giordano, A.M., McElree, B., & Carrasco,M. (2009). On the automaticityand flexibility of covert attention: A speed-accuracy trade-off analy-sis. Journal of Vision, 9(3), 1-10. https://doi.org/10.1167/9.3.30
Glass, G.V. (1966). Note on rank biserial correlation. Educational andPsychological Measurement, 26, 623-631.
Goldfarb, L., & Henik, A. (2013). The effect of a preceding cue on theconflict solvingmechanism.Experimental Psychology, 60, 347-353.
Gonthier, C., Braver, T.S., & Bugg, J.M. (2016). Dissociating proactiveand reactive control of the Stroop task. Memory & Cognition, 44,778-788.
Grubb, M. A., White, A. L., Heeger, D. J., & Carrasco, M. (2014).Interactions between voluntary and involuntary attention modulatethe quality and temporal dynamics of visual processing.Psychonomic Bulletin & Review, 22(2), 437-444. https://doi.org/10.3758/s13423-014-0698-y
Hentschke, H. & Stüttgen M.C. (2011). Computation of measures ofeffect size for neuroscience data sets. European Journal ofNeuroscience, 34, 1887-1894. https://doi.org/10.1111/j.1460-9568.2011.07902.x
Hutchison, K.A. (2011). The interactive effects of listwide control, item-based control, and working memory capacity on Stroop perfor-mance. Journal of Experimental Psychology: Learning, Memory,and Cognition, 37(4), 851-860.
1180 Atten Percept Psychophys (2018) 80:1169–1181
RETRACTED ARTIC
LE

Hutchison, K.A., Bugg, J.M., Lim, Y.B., & Olsen, M.R. (2016).Congruency precues moderate item-specific congruency effects.Attention, Perception & Psychophysics, 78(4), 1087-1103.
Inzlicht, M., & Schmeichel, B. J. (2012). What is ego depletion? Towarda mechanistic revision of the resource model of self-control.Perspectives on Psychological Science, 7(5), 450-463.
Ivanoff, J., Blagdon, R., Feener, S., McNeil, M., &Muir, P. H. (2014). Onthe temporal dynamics of spatial stimulus-response transfer betweenspatial incompatibility and Simon tasks. Frontiers in Neuroscience,8, 243. https://doi.org/10.3389/fnins.2014.00243
Ivanoff, J., Branning, P., & Marois, R. (2008). fMRI evidence for a dualprocess account of the speed-accuracy tradeoff in decision-making.PLoS one, 3(7), e2635.
Ivanoff, J., & Klein, R. M. (2006). Inhibition of return: Sensitivity andcriterion as a function of response time. Journal of ExperimentalPsychology: Human Perception and Performance, 32(4), 908-919.
Jacoby, L.L., Lindsay, D.S., & Hessels, S. (2003). Item-specific control ofautomatic processes: Stroop process dissociations. PsychonomicBulletin & Review, 10(3), 638-644.
JASP Team (2017). JASP (Version 0.8.2)[Computer software].Jonides, J. &Mack, R. (1984). On the cost and benefit of cost and benefit.
Psychological Bulletin, 96(1), 29-44.Kadlec, H. (1999). Statistical properties of d' and ß estimates of signal
detection theory. Psychological Methods, 4, 22-43.Kass, R. E., & Raftery, A. E. (1995). Bayes factors. Journal of the
American Statistical Association, 90(430), 773-795.Levin, Y. & Tzelgov, J. (2014). Conflict components of the Stroop effect
and their Bcontrol^. Frontiers in Psychology, 5(463), 1-5. https://doi.org/10.3389/fpsyg.2014.00463
Lindsay, D. S., & Jacoby, L. L. (1994). Stroop process dissociations: Therelationship between facilitation and interference. Journal ofExperimental Psychology: Human Perception and Performance,20(2), 219-234.
Liotti, M., Woldorff, M. G., Perez III, R., & Mayberg, H. S. (2000). AnERP study of the temporal course of the Stroop color-word interfer-ence effect. Neuropsychologia, 38(5), 701-711.
Liu, C. C., & Smith, P. L. (2009). Comparing time-accuracy curves:Beyond goodness-of-fit measures. Psychonomic Bulletin &Review, 16(1), 190-203.
Logan, G. D., & Zbrodoff, N. J. (1979). When it helps to be misled:Facilitative effects of increasing the frequency of conflicting stimuliin a Stroop-like task. Memory & Cognition, 7, 166–174.
Logan, G. D., & Zbrodoff, N. J. (1982). Constraints on strategy construc-tion in a speeded discrimination task. Journal of ExperimentalPsychology: Human Perception and Performance, 8, 502–520.
Logan, G. D., Zbrodoff, N. J., & Williamson, J. (1984). Strategies in thecolor-word Stroop task. Bulletin of the Psychonomic Society, 22,135–138.
Lowe, D. G., &Mitterer, J. O. (1982). Selective and divided attention in aStroop task. Canadian Journal of Psychology, 36(4), 684-700.
Luce, R.D (1986). Response Times: Their Role in Inferring ElementaryMental Organization. New York: Oxford University Press.
MacLeod, C. M. (1991). Half a century of research on the Stroop effect:An integrative review. Psychological Bulletin, 109(2), 163-203.
Macmillan, N., & Creelman, C. D. (2005). Detection Theory: A User'sGuide (2nd ed.). New York: Lawrence Erlbaum Associates, Inc.
McElree, B., & Carrasco, M. (1999). The temporal dynamics of visualsearch: evidence for parallel processing in feature and conjunctionsearches. Journal of Experimental Psychology. Human Perceptionand Performance, 25(6), 1517-1539.
Ollman, R. T. (1966). Fast guesses in choice-reaction time. PsychonomicScience, 6(4), 155-156.
Pachella, R. G. (1974). The interpretation of reaction time in information-processing research. In B. H. Kantowitz (Ed.), Human InformationProcessing: Tutorials in Performance and Cognition (pp. 41-82).Hillsdale, NJ: Lawrence Erlbaum.
Posner, M. I., & Snyder, C. R. R. (1975). Attention and cognitive control.In R. L. Solso (Ed.), Information Processing and Cognition: TheLoyola Symposium. Hillsdale, NJ: Erlbaum.
Rae, B., Heathcote, A., Donkin, C., Averell, L., & Brown, S. (2014). TheHare and the Tortoise: Emphasizing speed can change the evidenceused to make decisions. Journal of Experimental Psychology:Learning, Memory, and Cognition, 40(5), 1226-1243.
Ratcliff, R. (2006). Modeling response signal and response time data.Cognitive Psychology, 53(3), 195-237.
Ratcliff, R., Smith, P.L., Brown, S.D., & McKoon, G. (2016). Diffusiondecision model: Current issues and history. Trends in CognitiveScience, 20(4), 260-281.
Reed, A. V. (1973). Speed-accuracy trade-off in recognition memory.Science, 181(4099), 574-576. https://doi.org/10.1126/science.181.4099.574
Samavatyan, H., & Leth-Steensen, C. (2009). The time course of taskswitching: A speed–accuracy trade-off analysis. Memory &Cognition, 37(7), 1051-1058. https://doi.org/10.3758/MC.37.7.1051
Sharma, D., &McKenna, F. P. (1998). Differential components of the man-ual and vocal Stroop tasks.Memory & Cognition, 26(5), 1033-1040.
Standage, D., Blohm, G., & Dorris, M. C. (2014). On the neural imple-mentation of the speed-accuracy trade-off. Frontiers inNeuroscience, 8, 236. https://doi.org/10.3389/fnins.2014.00236
Stroop, J. R. (1935). Studies of interference in serial verbal reactions.Journal of Experimental Psychology, 18, 643-662.
Wagenmakers, E.-J. & Farrell, S. (2004). AIC model slection usingAkaike weights. Psychonomic Bulletin & Review, 11(1), 192-196.
West, R., & Alain, C. (2000). Age-related decline in inhibitory controlcontributes to the increased Stroop effect observed in older adults.Psychophysiology, 37(2), 179-189.
Wickelgren, W. A. (1977). Speed-accuracy tradeoff and information pro-cessing dynamics. Acta Psychologica, 41(1), 67-85. https://doi.org/10.1016/0001-6918(77)90012-9 .
Yellott, J. I. (1967). Correction for guessing in choice reaction time.Psychonomic Science, 8(8), 321-322.
Zhang, J., & Rowe, J. B. (2014). Dissociable mechanisms of speed-accuracy tradeoff during visual perceptual learning are revealed bya hierarchical drift-diffusion model. Frontiers in Neuroscience, 8,69. https://doi.org/10.3389/fnins.2014.00069
Zhao, Y., Heinke, D., Ivanoff, J., Klein, R. M., & Humphreys, G. W.(2011). Two components in IOR: Evidence for response bias andperceptual processing delays using the SATmethodology. Attention,Perception & Psychophysics, 73(7), 2143-2159. https://doi.org/10.3758/s13414-011-0181-z
Atten Percept Psychophys (2018) 80:1169–1181 1181
RETRACTED ARTIC
LE