The strength of strong ties: co-authorship and ... · The strength of strong ties: co-authorship...
35
The strength of strong ties: co-authorship and productivity of Italian economists Giulio Cainelli°, Annunziata de Felice^, Mario A. Maggioni*, T. Erika Uberti* @ ° Dipartimento di Scienze Economiche "Marco Fanno", Università degli Studi di Padova e CERIS-CNR, Milano ^ Dipartimento per lo studio delle società mediterranee, Università degli Studi di Bari * DISEIS and CSCC, Università Cattolica del Sacro Cuore, Milano @: [email protected] FEEM, Milano, 18 febbraio 2010
Transcript of The strength of strong ties: co-authorship and ... · The strength of strong ties: co-authorship...

The strength of strong ties: co-authorship and productivity
of Italian economists
Giulio Cainelli°, Annunziata de Felice^,
Mario A. Maggioni*, T. Erika Uberti*@
° Dipartimento di Scienze Economiche "Marco Fanno", Università degli Studi di Padova e CERIS-CNR, Milano
^ Dipartimento per lo studio delle società mediterranee, Università degli Studi di Bari * DISEIS and CSCC, Università Cattolica del Sacro Cuore, Milano
FEEM, Milano, 18 febbraio 2010

Outline
� Related Literature • Scientific production• Collaborative behavior and scientific production • Network Analysis and Network Topology
� The datasets: • Italian economists in 2006 according to MIUR database;• Journal Articles (JA) in 2006 indexed in Econlit.• Our dataset
� The models
� The empirical results
� Conclusions and further research

Recently, an increased specialization and the diffusion of scientific collaborations are becoming more and more diffused in the community of social scientists.
In the meantime the practice of evaluating scientific research and personnel through bibliometric indicators is increasingly used by departments, universities, government bodies and funding agencies.
These two phenomena are hardly independent; on the contrary we believe – in so comforted by an extensive stream of literature (see, among others: Sauer, 1988; Barnett et al., 1988; Piette and Ross, 1992; Laband and Piette, 1994; Hudson, 1996; Laband and Tollison 2000 and 2006) that they are strongly interdependent since the increased pressure to publish on academics has caused a rinsing propensity to co-authoring papers due to a series of demand-side and supply-side factors.
In economic terms a generic “scientific production function” is affected by different aspects: - his/her attributive features (i.e. formation, gender, academic position, etc.); - his/her relational features (i.e. co-authorships, scientific connections, etc.);- his/her positional features (i.e. the structural position within the network of scientists of the same field);
Related literature (1/2)

Considering a generic “scientific production function” the role of co-authorship is
very relevant because affects (demand and/or supply side factors):
the quantity of scientific production
- Greater output and risk-spreading (Barnett et al., 1988)
the quality of scientific production
- Specialization (McDowell and Melvin, 1983)
- Technological complementarities (Hudson, 1996)
- Synergies from collaborative work (Hudson, 1996)
But, especially in social sciences, the number of co-authors is very important
because there exist
Increasing/decreasing returns to the number of co-authors in the
same paper
Increasing/decreasing returns to interactions with the same co-
author(s). (Stability of interactions)
Related literature (2/2)
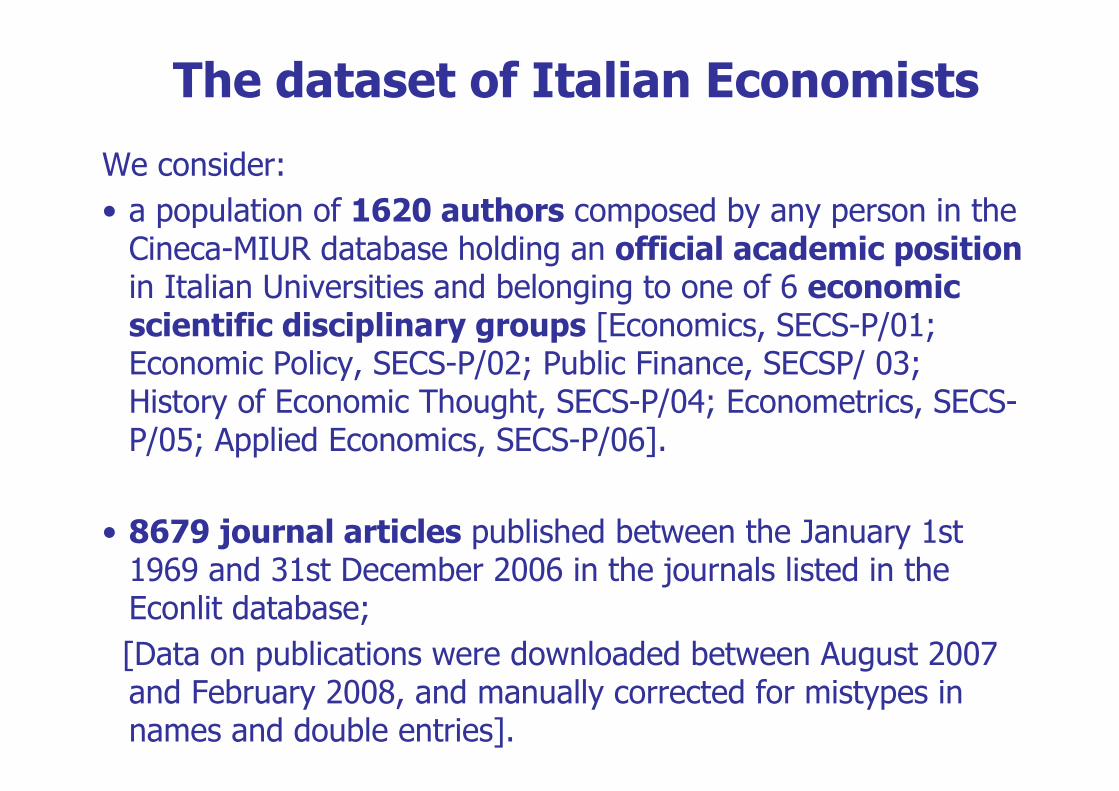
The dataset of Italian Economists
We consider:
• a population of 1620 authors composed by any person in the Cineca-MIUR database holding an official academic positionin Italian Universities and belonging to one of 6 economic scientific disciplinary groups [Economics, SECS-P/01; Economic Policy, SECS-P/02; Public Finance, SECSP/ 03; History of Economic Thought, SECS-P/04; Econometrics, SECS-P/05; Applied Economics, SECS-P/06].
• 8679 journal articles published between the January 1st 1969 and 31st December 2006 in the journals listed in the Econlit database;
[Data on publications were downloaded between August 2007 and February 2008, and manually corrected for mistypes in names and double entries].

The database: some descriptive statistics
Scientific Field L SL* AP TAP* STP FU* TOTAL
ECONOMICS 14,0 15,0 10,6 18,5 8,0 34,0 1153
ECONOMETRICS 13,1 13,1 9,8 13,1 13,1 37,7 61
PUBLIC ECONOMICS 13,5 16,0 4,5 14,0 8,0 44,0 200
OTHERS 8,7 13,6 14,6 22,8 10,2 30,1 206
TOTAL 214 241 167 296 137 565 1620
* these academic positions are considered as tenured positions
Source: our calculations on MIUR database at 31 December 2006
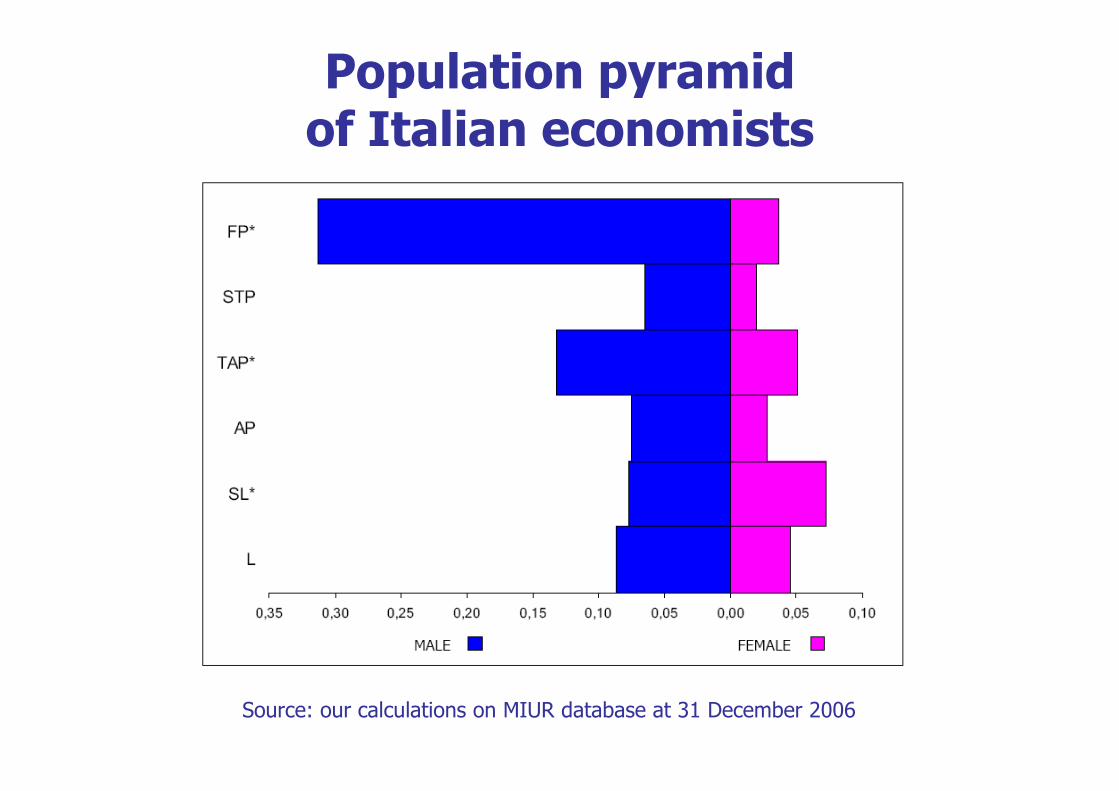
Population pyramid of Italian economists
Source: our calculations on MIUR database at 31 December 2006

The dataset of the JA 1/2
M: MIUR population, “Italian” economists holding an official academic position
E: Econlit population, “Italian” economists (as defined in M) who are authors of publications indexed in Econlit and their co-authors (if any) with any affiliation
Z: Our Dataset “Italian” economists (as defined in M) who are authors of publications indexed in
Econlit
N: Non publishing MIUR population, “Italian” economists (as defined in M) without entries in Econlit
O: publishing non MIUR population, co-authors of Z not holding a position in Italian Universities
M E
ZN O
M = 1620 people
E = 2972 people
Z = 1317 people, 8679 articles
O = 1655 people
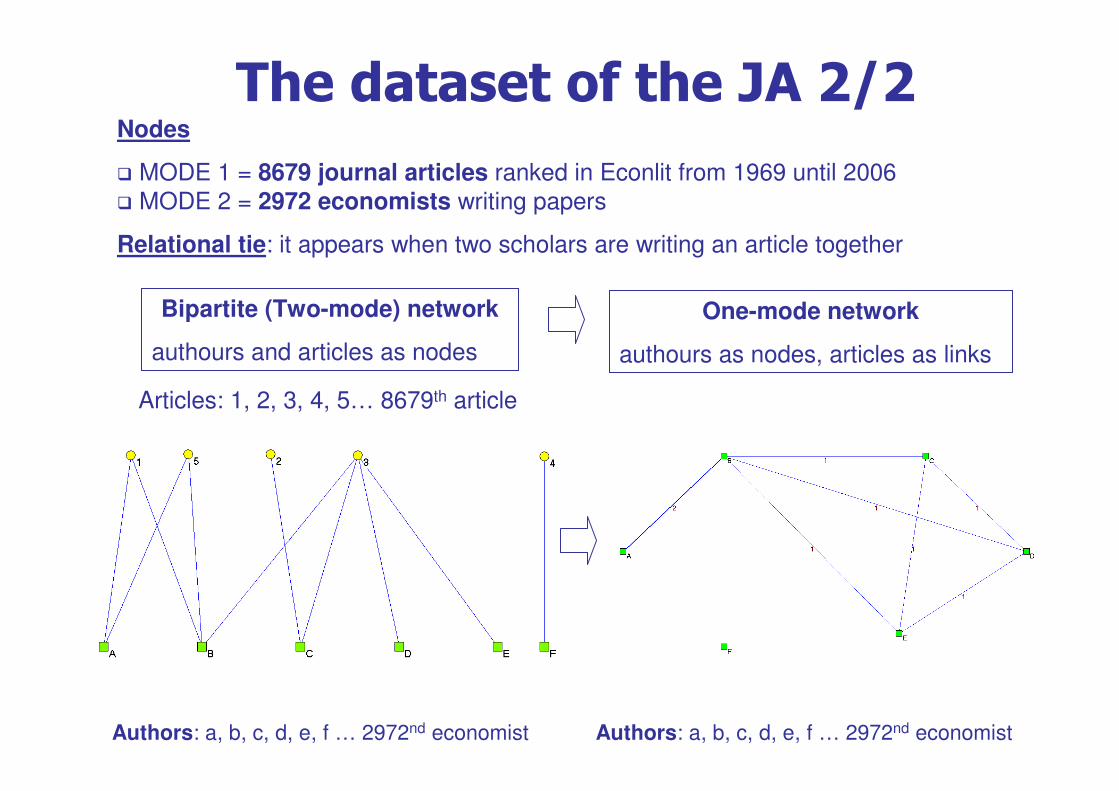
Nodes
� MODE 1 = 8679 journal articles ranked in Econlit from 1969 until 2006
� MODE 2 = 2972 economists writing papers
Relational tie: it appears when two scholars are writing an article together
Articles: 1, 2, 3, 4, 5… 8679th article
Authors: a, b, c, d, e, f … 2972nd economist
Bipartite (Two-mode) network
authours and articles as nodes
One-mode network
authours as nodes, articles as links
Authors: a, b, c, d, e, f … 2972nd economist
The dataset of the JA 2/2
The results on the SNA of the economic network
from 1969 until 2006 divided into 4 sub-periods

The evolution of the co-authorship behaviour
0
50
100
150
200
250
300
350
4001969
1971
1973
1975
1977
1979
1981
1983
1985
1987
1989
1991
1993
1995
1997
1999
2001
2003
2005
N. of articles
# of JA_MOREAUTHOR
# of JA_1AUTHOR
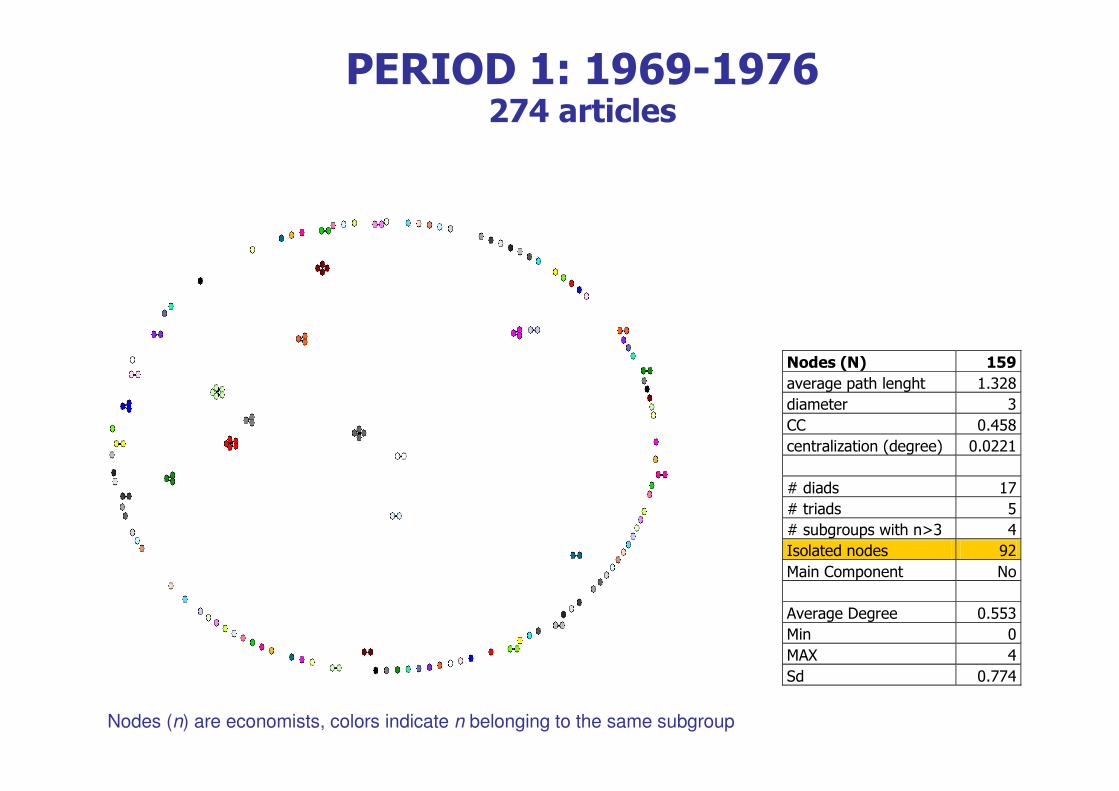
PERIOD 1: 1969-1976274 articles
Nodes (N) 159
average path lenght 1.328
diameter 3
CC 0.458
centralization (degree) 0.0221
# diads 17
# triads 5
# subgroups with n>3 4
Isolated nodes 92
Main Component No
Average Degree 0.553
Min 0
MAX 4
Sd 0.774
Nodes (n) are economists, colors indicate n belonging to the same subgroup

PERIOD 2: 1977-19861195 articles
Nodes (N) 580
average path lenght 1.751
diameter 5
CC 0.606
centralization (degree) 0.0108
# diads 55
# triads 16
# subgroups with n>3 23
Isolated nodes 293
Main Component No
Average Degree 0.786
Min 0
MAX 7
Sd 1.147
Nodes (n) are economists, colors indicate n belonging to the same subgroup

PERIOD 3: 1987-19962309 articles
Nodes (N) 1094
average path lenght 8.180
diameter 21
CC 0.535
centralization (degree) 0.097
# diads 88
# triads 43
# subgroups with n>3 42
Isolated nodes 295
Main Component Yes (214)
Average Degree 1.364
Min 0
MAX 12
Sd 1.498
Nodes (n) are economists, colors indicate n belonging to the same subgroup
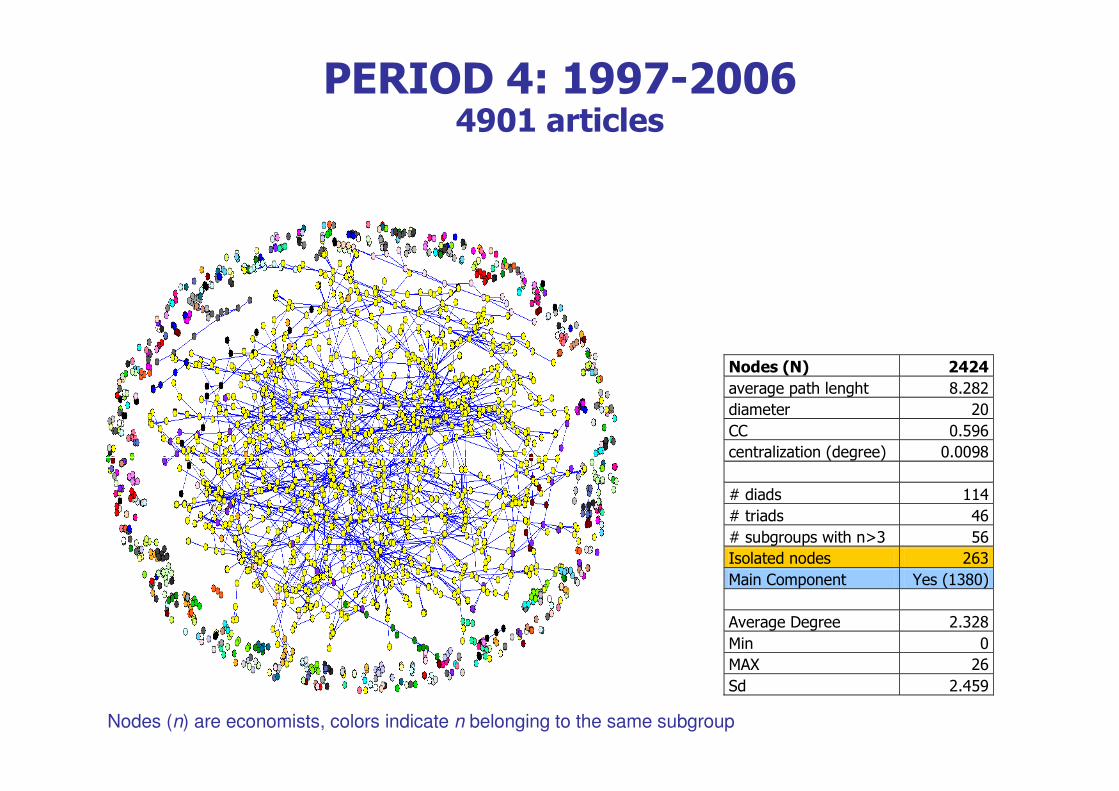
PERIOD 4: 1997-20064901 articles
Nodes (N) 2424
average path lenght 8.282
diameter 20
CC 0.596
centralization (degree) 0.0098
# diads 114
# triads 46
# subgroups with n>3 56
Isolated nodes 263
Main Component Yes (1380)
Average Degree 2.328
Min 0
MAX 26
Sd 2.459
Nodes (n) are economists, colors indicate n belonging to the same subgroup

The whole network 1969-2006 2972 nodes writing 8679 articles (E):
1317 M, 1655 O
Nodes (n) are economists, colors indicate n belonging to the same subgroup
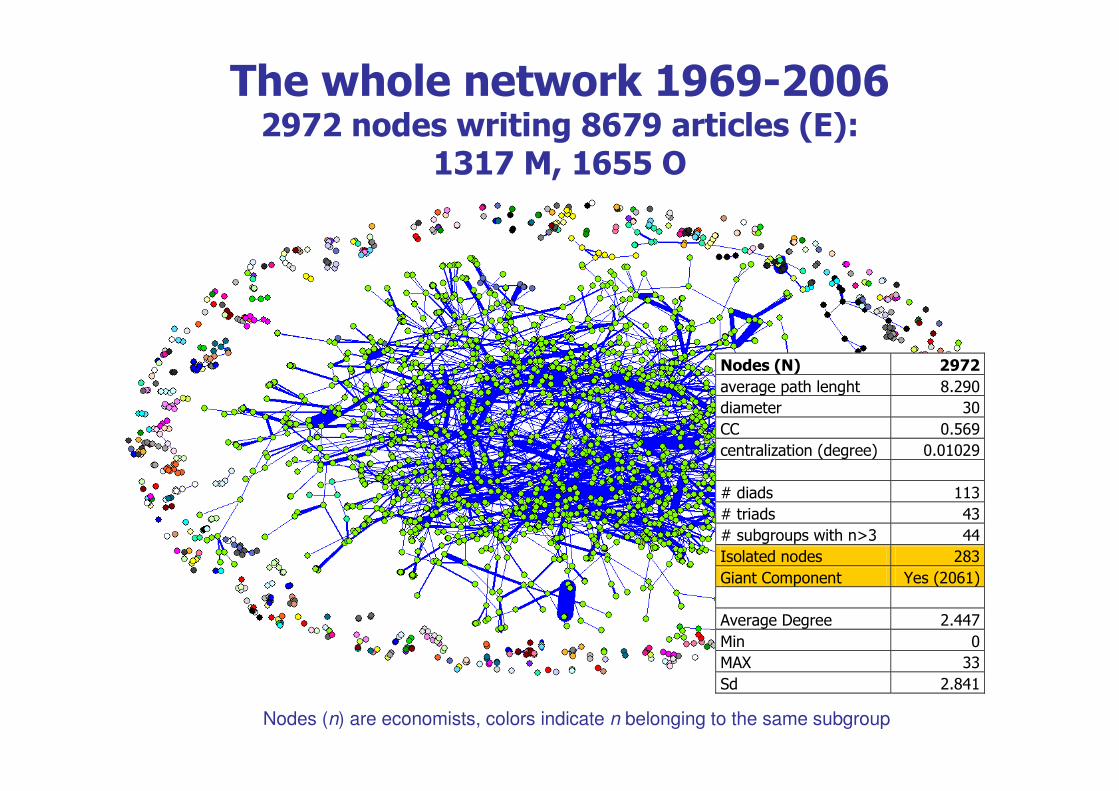
Nodes (N) 2972
average path lenght 8.290
diameter 30
CC 0.569
centralization (degree) 0.01029
# diads 113
# triads 43
# subgroups with n>3 44
Isolated nodes 283
Giant Component Yes (2061)
Average Degree 2.447
Min 0
MAX 33
Sd 2.841
Nodes (n) are economists, colors indicate n belonging to the same subgroup
The whole network 1969-2006 2972 nodes writing 8679 articles (E):
1317 M, 1655 O

The topology of the economists’ network
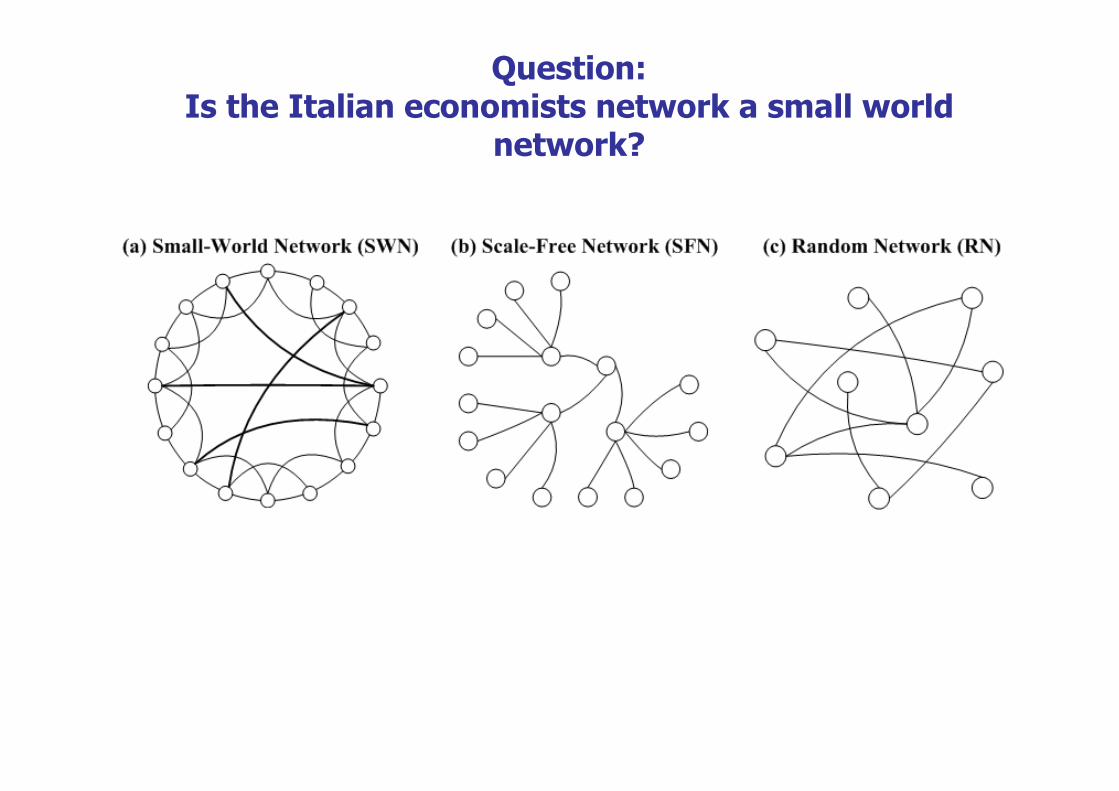
Question: Is the Italian economists network a small world
network?

real netsreal netsreal netsreal nets
Total (1969-2006) 2nd period (1987-1996) 3rd period (1997-2006)
NNNN 2061206120612061 NNNN 214214214214 NNNN 1380138013801380
density 0,0015 density 0,0120 density 0,0022
average degree 3,026 average degree 2,561 average degree 3,041
average path lenght 8,296 average path lenght 8,533 average path lenght 8,295
CC 0,552 CC 0,531 CC 0,564
random netsrandom netsrandom netsrandom nets
total 2nd period 3rd period
NNNN 2061206120612061 NNNN 214214214214 NNNN 1380138013801380
density 0,0015 density 0,012 density 0,0022
average degree 3,090 average degree 2,551 average degree 3,038
average path lenght 6,739 average path lenght 5,349 average path lenght 6,383
CC 0,001 CC 0,007 CC 0,001
Q_1Q_1Q_1Q_1 448,40448,40448,40448,40 47,5547,5547,5547,55 434,00434,00434,00434,00
Is the Italian economists’ network a SWN network?
All networks display a SWN behaviour:
1) CC real >> CC random 2) APLreal ~ APLrandom
3) calculate Q index:
random
random
real
real
APL
CCAPL
CC
0
0,5
1
1,5
2
2,5
0 2 4 6 8 10 12 14
k: degree at time t(2)
R(k
) re
lati
ve
pro
bab
ilit
y o
f n
ew
co
au
tho
rs
t(2
)-
>t(
3)
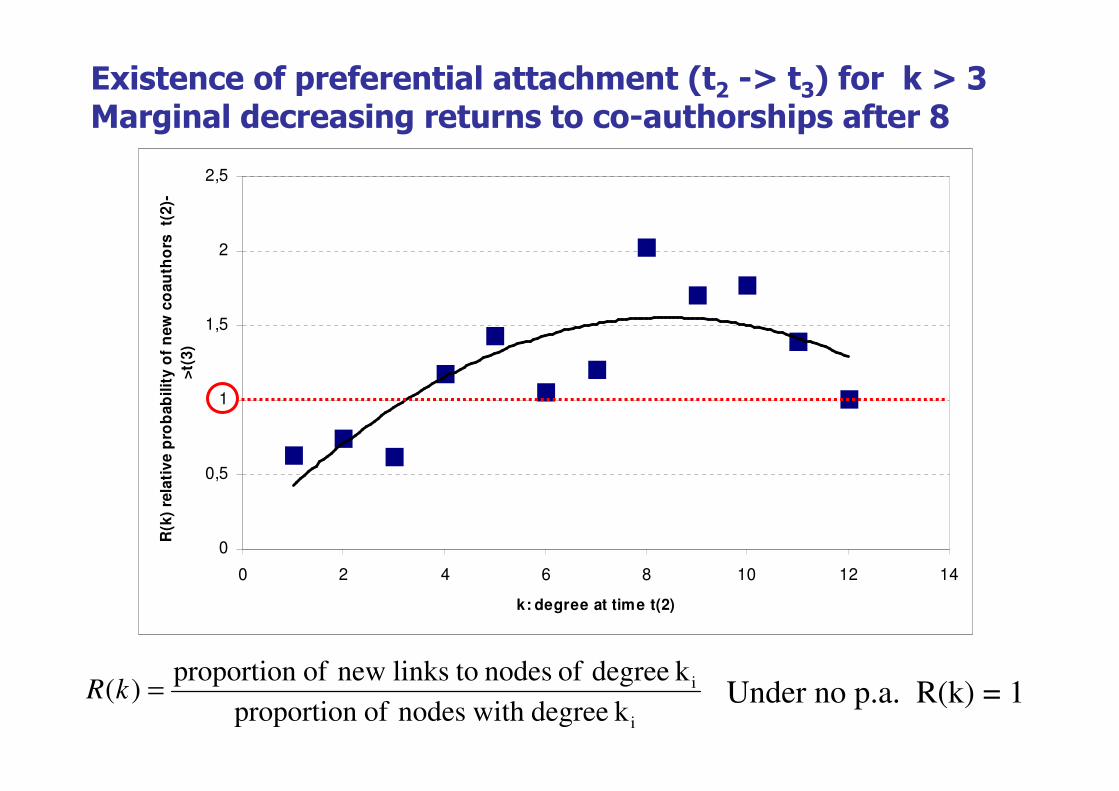
Existence of preferential attachment (t2 -> t3) for k > 3Marginal decreasing returns to co-authorships after 8
i
i
k degree with nodes of proportion
k degree of nodes tolinks new of proportion)( =kR Under no p.a. R(k) = 1
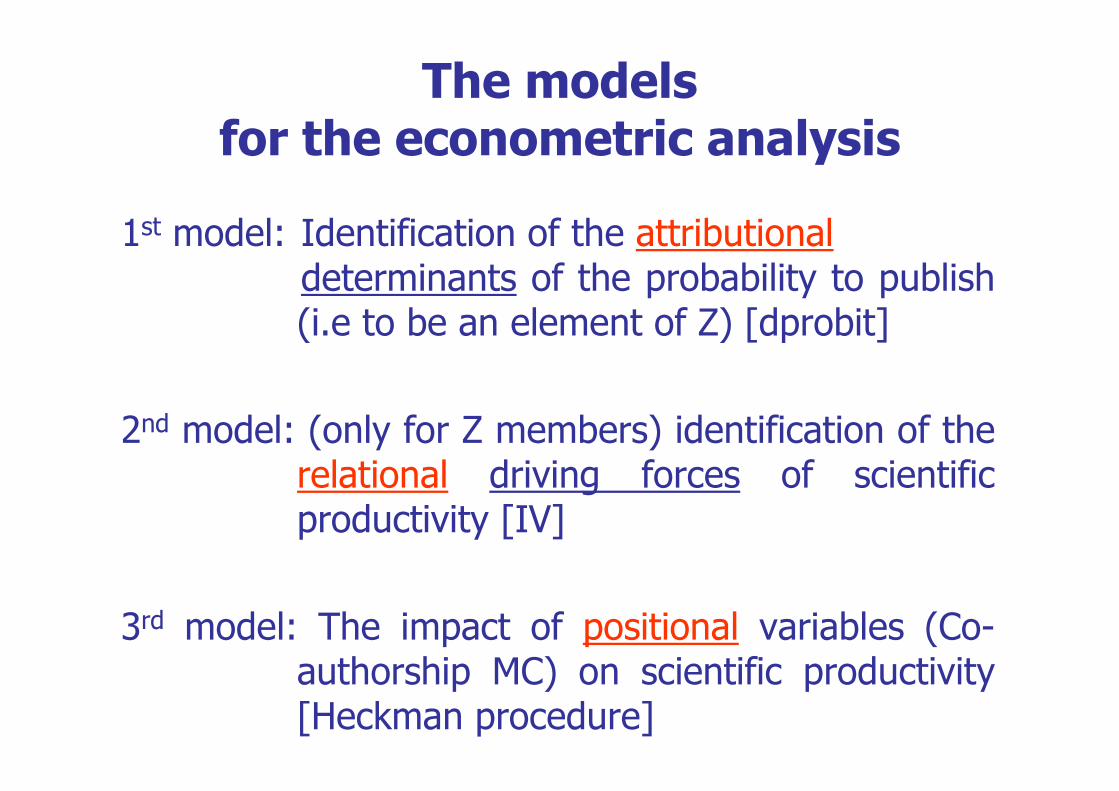
The models for the econometric analysis
1st model: Identification of the attributionaldeterminants of the probability to publish (i.e to be an element of Z) [dprobit]
2nd model: (only for Z members) identification of the relational driving forces of scientific productivity [IV]
3rd model: The impact of positional variables (Co-authorship MC) on scientific productivity [Heckman procedure]
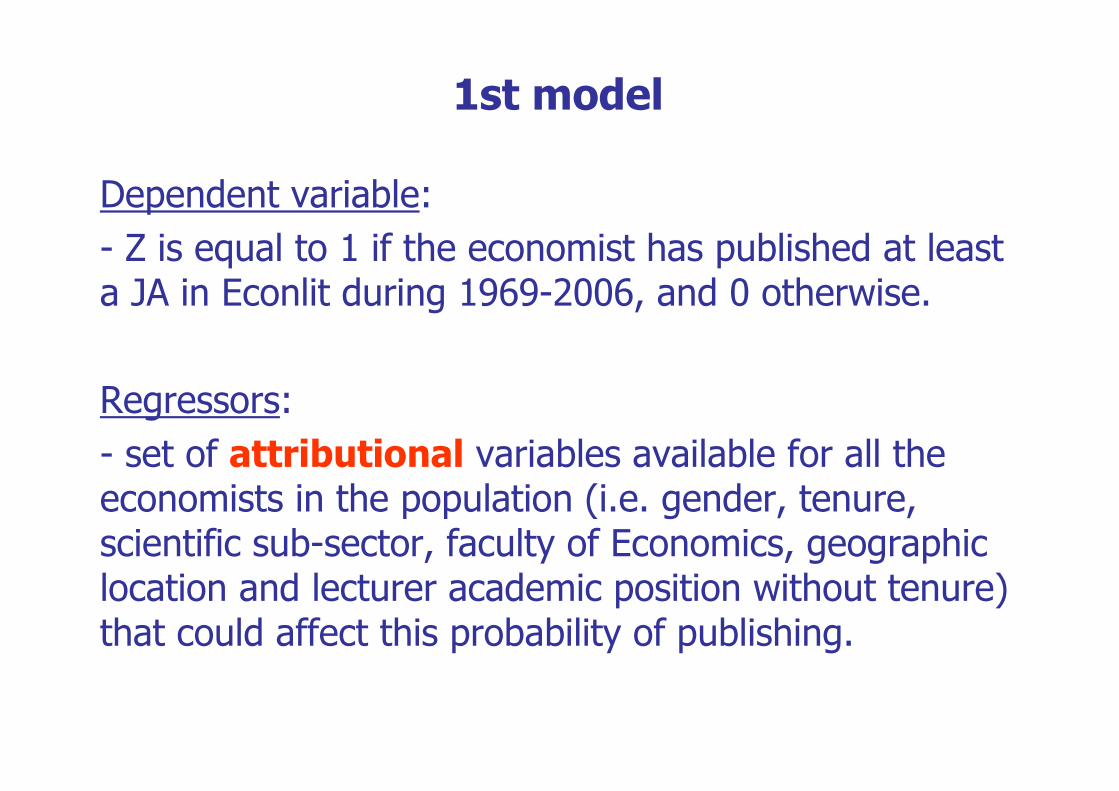
1st model
Dependent variable:
- Z is equal to 1 if the economist has published at least a JA in Econlit during 1969-2006, and 0 otherwise.
Regressors:
- set of attributional variables available for all the economists in the population (i.e. gender, tenure, scientific sub-sector, faculty of Economics, geographic location and lecturer academic position without tenure) that could affect this probability of publishing.

1st model: The resultsEstimation method: dprobit
Dep. var.: z=1; 0 [1] [2] [3] [4]
dF/dx t-value dF/dx t-value dF/dx t-value dF/dx t-value
Gender 0.086** 3.80 0.086** 3.81 0.086** 3.80 0.075** 3.41
Tenured -0.041** -2.01 -0.038* -1.88 -0.039* -1.94 -0.163** -6.10
Economics … … 0.064** 2.22 0.066** 2.27 0.080** 2.78
Econometrics … … 0.114** 2.36 0.112** 2.30 0.092* 1.81
Public Econ. … … 0.006 0.18 0.008 0.24 0.027 0.80
Others … … Ref. Ref. Ref. Ref. Ref. Ref.
Fac_Economics … … … … 0.038** 1.96 0.036* 1.90
North West … … … … … … 0.042* 1.76
North East … … … … … … 0.055** 2.13
Centre … … … … … … Ref. Ref.
South … … … … … … -0.039 -1.33
Islands … … … … … … -0.170** -4.05
Lecturer … … … … … … -0.345** -7.14
N. Obs. 1.620 1.620 1.620 1.620
Pseudo R2 0.011 0.018 0.020 0.07
Obs. P 0.812 0.812 0.812 0.812
Pred. P 0.815 0.817 0.817 0.834
Note: Standard errors are robust to heteroskasasticity.
Legend: ** significant at 5%; ** significant al 10%
+
+
-
+
+
--
We explain the individual productivity (i.e. the number of JA weighted according to the “scientific age” of each individual) of Italian economists in terms of relational driving forces (i.e. propensity to co-authorship and to have international connections) and we control for attributionalvariables (i.e. gender, tenure, geography and age classes).
2nd model (1/2)
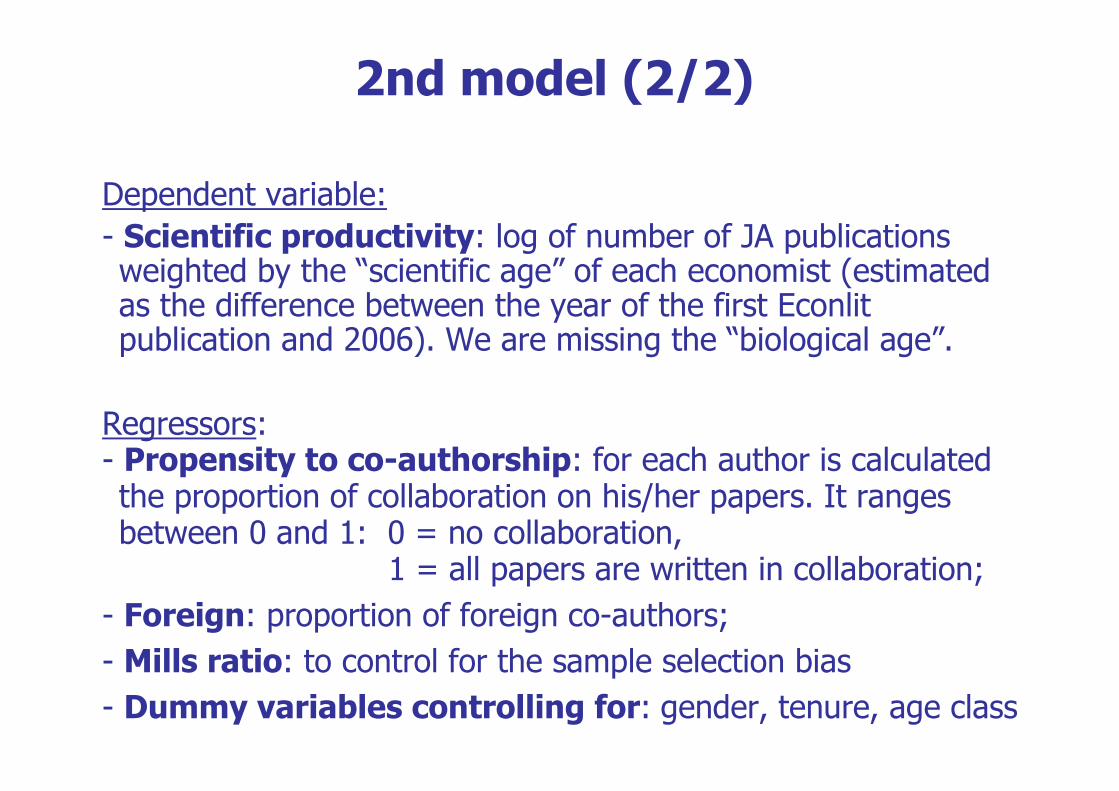
Dependent variable:
- Scientific productivity: log of number of JA publications weighted by the “scientific age” of each economist (estimated as the difference between the year of the first Econlitpublication and 2006). We are missing the “biological age”.
Regressors:- Propensity to co-authorship: for each author is calculated the proportion of collaboration on his/her papers. It ranges between 0 and 1: 0 = no collaboration,
1 = all papers are written in collaboration;
- Foreign: proportion of foreign co-authors;
- Mills ratio: to control for the sample selection bias
- Dummy variables controlling for: gender, tenure, age class
2nd model (2/2)

2nd model: Some empirical issues (1/2)
- There could be a sample selection bias, since we are analysing exclusively those economists belonging to Z.
We solve this problem calculating the inverse Mills ratio.
- Endogeneity problem: i.e. cooperation affects productivity, but productivity may affect cooperation (i.e. I may choose a co-author because he/she is very productive) generating a reverse causality problem.
We solve this problem adopting IV strategy, instrumenting the propensity to cooperate using the number of collective volume articles (CVA) written by each author.
CVA as IV (2/2)
- We use collective volume articles (CVA) written by each author as instrument of propensity to co-authorship.
- In the literature, it is assumed that CVA are the effect of connections and are not quality comparable with JA and may reflect alternative use of a scientist’s time (i.e. if a scientist writes contribute for a CVA he/she has no time to write a JA). Thus CVA may measure the propensity to socialise irrespective of the impact on scientific productivity.
Tests confirm that both instruments are OK!
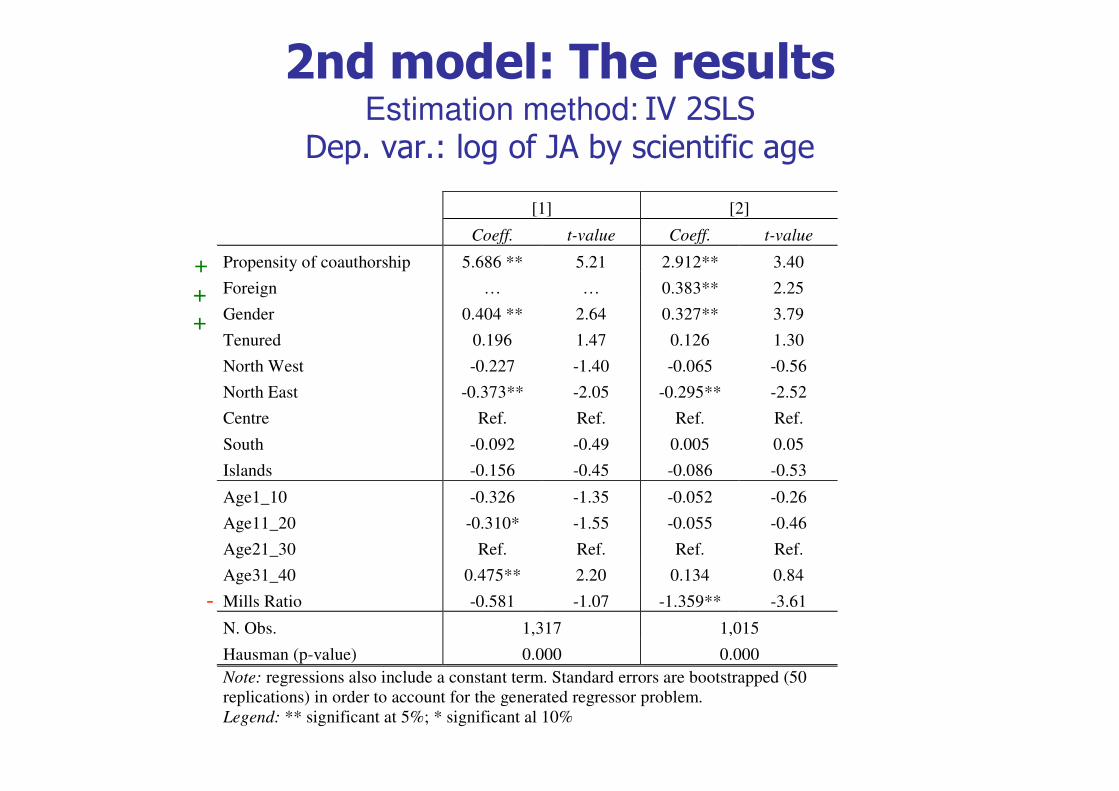
2nd model: The resultsEstimation method: IV 2SLS
Dep. var.: log of JA by scientific age
[1] [2]
Coeff. t-value Coeff. t-value
Propensity of coauthorship 5.686 ** 5.21 2.912** 3.40
Foreign … … 0.383** 2.25
Gender 0.404 ** 2.64 0.327** 3.79
Tenured 0.196 1.47 0.126 1.30
North West -0.227 -1.40 -0.065 -0.56
North East -0.373** -2.05 -0.295** -2.52
Centre Ref. Ref. Ref. Ref.
South -0.092 -0.49 0.005 0.05
Islands -0.156 -0.45 -0.086 -0.53
Age1_10 -0.326 -1.35 -0.052 -0.26
Age11_20 -0.310* -1.55 -0.055 -0.46
Age21_30 Ref. Ref. Ref. Ref.
Age31_40 0.475** 2.20 0.134 0.84
Mills Ratio -0.581 -1.07 -1.359** -3.61
N. Obs. 1,317 1,015
Hausman (p-value) 0.000 0.000
Note: regressions also include a constant term. Standard errors are bootstrapped (50
replications) in order to account for the generated regressor problem.
Legend: ** significant at 5%; * significant al 10%
+
-
++
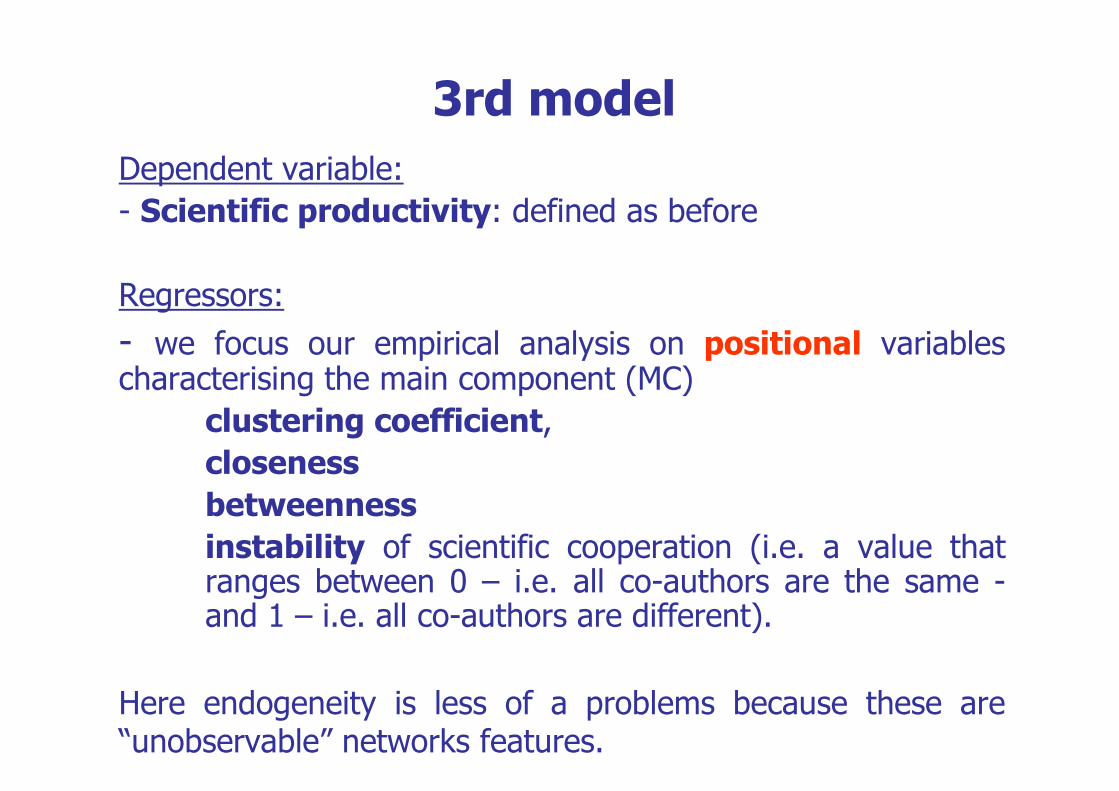
Dependent variable:
- Scientific productivity: defined as before
Regressors:
- we focus our empirical analysis on positional variables characterising the main component (MC)
clustering coefficient,
closeness
betweenness
instability of scientific cooperation (i.e. a value that ranges between 0 – i.e. all co-authors are the same -and 1 – i.e. all co-authors are different).
Here endogeneity is less of a problems because these are “unobservable” networks features.
3rd model
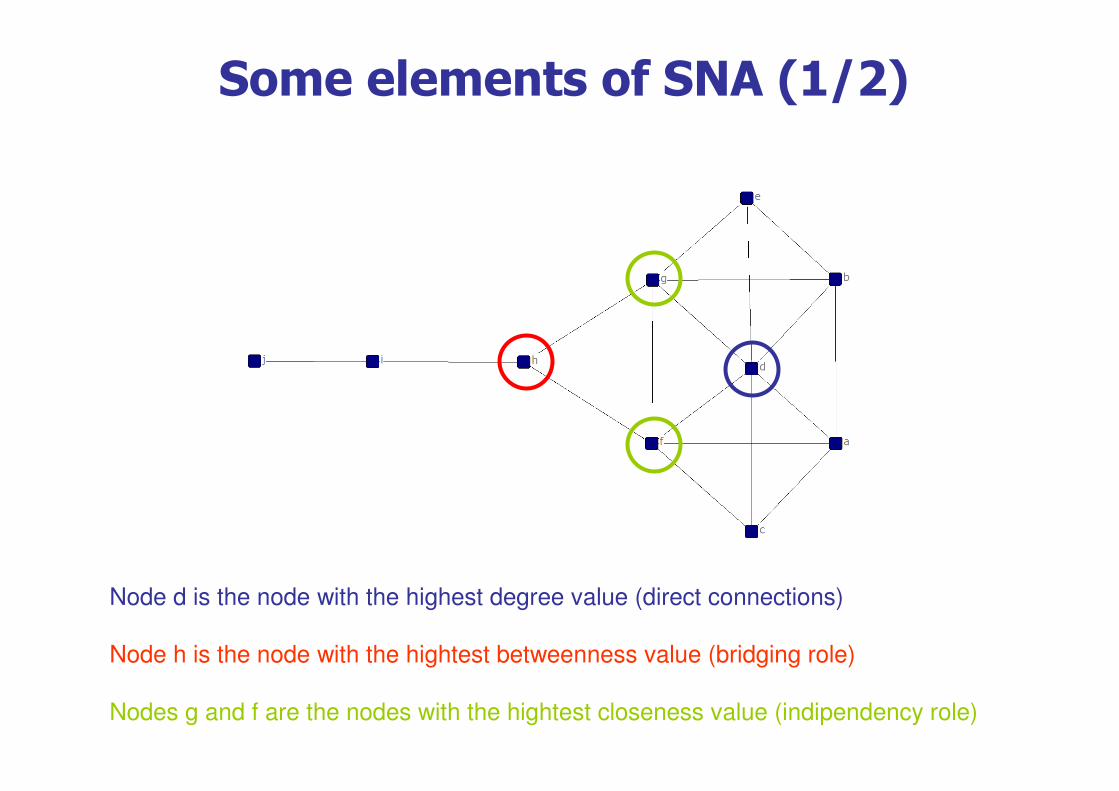
Some elements of SNA (1/2)
Node d is the node with the highest degree value (direct connections)
Node h is the node with the hightest betweenness value (bridging role)
Nodes g and f are the nodes with the hightest closeness value (indipendency role)

Some elements of SNA (2/2)
Clustering coefficient (CC): is a measure of “neighborhood”, it could be synthesized as follows: The CC is the degree to which nodes in a graph tend to cluster together. It measures the cliquishness of networks of node i’s neighbors.
where Λi indicates the number of edges in the neighborhood of node i andvi the total number of possible edges of node i.The index varies between 0 (no neighbor of any vertex is adjacent with any other neighbor of vertex i) and 1 (individually complete neighbors).
i
ii
vCC
Λ=
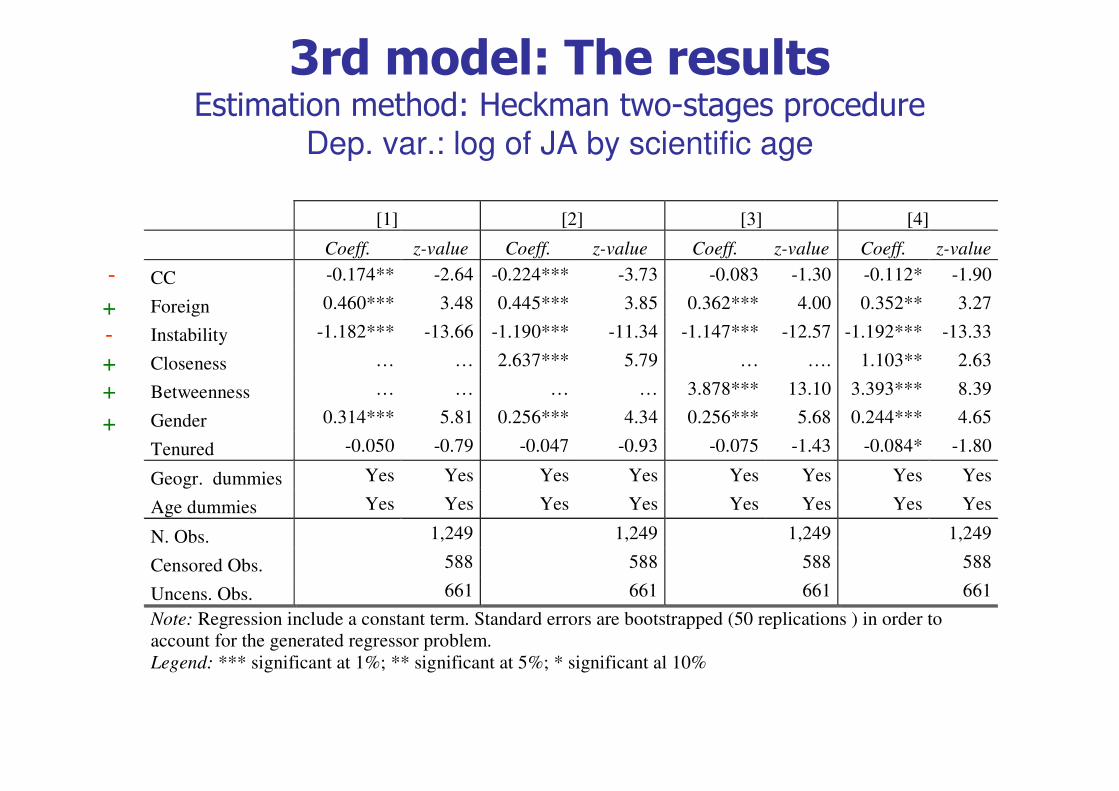
3rd model: The resultsEstimation method: Heckman two-stages procedure
Dep. var.: log of JA by scientific age
[1] [2] [3] [4]
Coeff. z-value Coeff. z-value Coeff. z-value Coeff. z-value
CC -0.174** -2.64 -0.224*** -3.73 -0.083 -1.30 -0.112* -1.90
Foreign 0.460*** 3.48 0.445*** 3.85 0.362*** 4.00 0.352** 3.27
Instability -1.182*** -13.66 -1.190*** -11.34 -1.147*** -12.57 -1.192*** -13.33
Closeness … … 2.637*** 5.79 … …. 1.103** 2.63
Betweenness … … … … 3.878*** 13.10 3.393*** 8.39
Gender 0.314*** 5.81 0.256*** 4.34 0.256*** 5.68 0.244*** 4.65
Tenured -0.050 -0.79 -0.047 -0.93 -0.075 -1.43 -0.084* -1.80
Geogr. dummies Yes Yes Yes Yes Yes Yes Yes Yes
Age dummies Yes Yes Yes Yes Yes Yes Yes Yes
N. Obs. 1,249 1,249 1,249 1,249
Censored Obs. 588 588 588 588
Uncens. Obs. 661 661 661 661
Note: Regression include a constant term. Standard errors are bootstrapped (50 replications ) in order to
account for the generated regressor problem.
Legend: *** significant at 1%; ** significant at 5%; * significant al 10%
-
+
++
+
-

Conclusions
1) The probability of publishing is influenced by gender, disciplinary groups, geographical area, faculty.
2) If one economist does publish, his/her productivity depends positively with his/her propensity to collaborate and on his/her international connections (intrinsic quality vs. editorial boards!?).
3) Position in the networks affects productivity. Being “central”is a plus and being a “bridge” is better that being globally central. cliquishness is bad for science! (hint: star structure and exploitation of co-author gives good results?) Stability (and fidelity) pays! Keeping the same authors, at least for an Italian economist, is the best strategy in order to improve his/her productivity.

Further research
a. Structural stability test
b. Longitudinal analysis
c. Geography (e.g. distance between co-authors)