“The Strategy of REpower and expectations to subcontractors” · “The Strategy of REpower and...
27
SOURCE: REpower Systems SE “The Strategy of REpower and expectations to subcontractors” Lars Rytter, COO Hamburg December 2 nd , 2013
Transcript of “The Strategy of REpower and expectations to subcontractors” · “The Strategy of REpower and...

SOURCE: REpower Systems SE 1
“The Strategy of REpower and expectations to subcontractors” Lars Rytter, COO Hamburg December 2nd, 2013

SOURCE: REpower Systems SE 2
Agenda
- Introduction
- REpower in a “Nutshell”
“ The Market
- REpower Strategy 2013-2018
- Expectations to Subcontractors
- Q & A
1
2
3
4
5
6
SOURCE: REpower Systems SE 3
Introduction
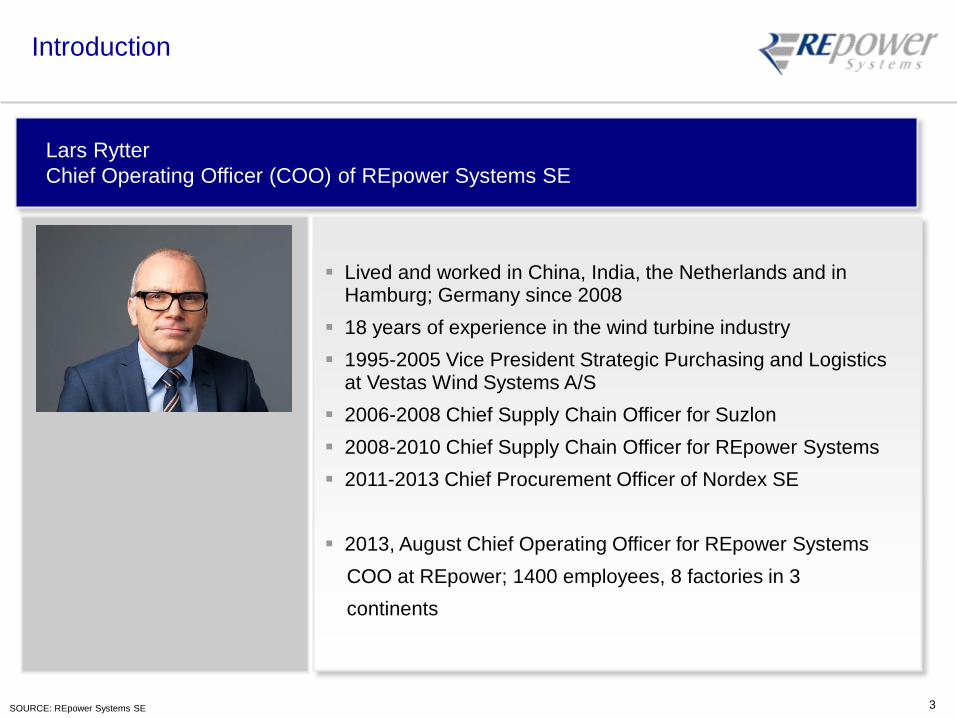
Lived and worked in China, India, the Netherlands and in
Hamburg; Germany since 2008 18 years of experience in the wind turbine industry 1995-2005 Vice President Strategic Purchasing and Logistics
at Vestas Wind Systems A/S 2006-2008 Chief Supply Chain Officer for Suzlon 2008-2010 Chief Supply Chain Officer for REpower Systems 2011-2013 Chief Procurement Officer of Nordex SE 2013, August Chief Operating Officer for REpower Systems COO at REpower; 1400 employees, 8 factories in 3 continents
Lars Rytter Chief Operating Officer (COO) of REpower Systems SE

SOURCE: REpower Systems SE 4
Agenda
- Introduction
- REpower in a “Nutshell”
“ The Market
- REpower Strategy 2013-2018
- Expectations to Subcontractors
- Q & A
1
2
3
4
5
6
SOURCE: REpower Systems SE 5
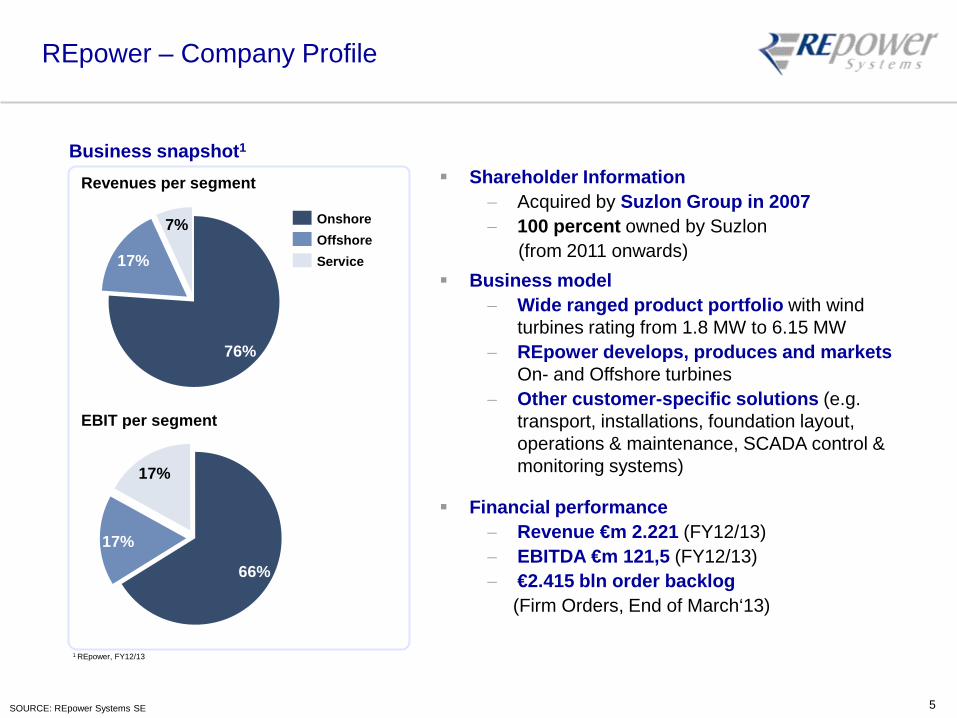
REpower – Company Profile
Shareholder Information − Acquired by Suzlon Group in 2007 − 100 percent owned by Suzlon (from 2011 onwards)
Business model − Wide ranged product portfolio with wind
turbines rating from 1.8 MW to 6.15 MW − REpower develops, produces and markets
On- and Offshore turbines − Other customer-specific solutions (e.g.
transport, installations, foundation layout, operations & maintenance, SCADA control & monitoring systems)
Financial performance − Revenue €m 2.221 (FY12/13) − EBITDA €m 121,5 (FY12/13) − €2.415 bln order backlog (Firm Orders, End of March‘13)
7%
17%
76%
Service Offshore Onshore
Revenues per segment
17%
17%
66%
EBIT per segment
Business snapshot1
1 REpower, FY12/13
SOURCE: REpower Systems SE 6
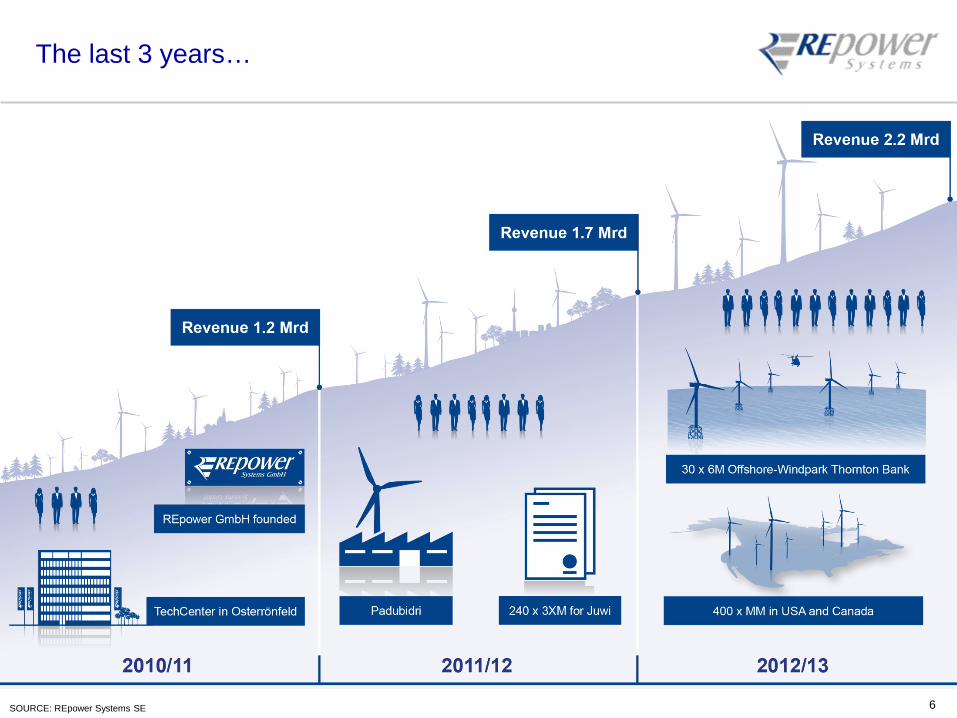
The last 3 years…

SOURCE: REpower Systems SE 7
6 Months with “POWER“
SOURCE: REpower Systems SE 8
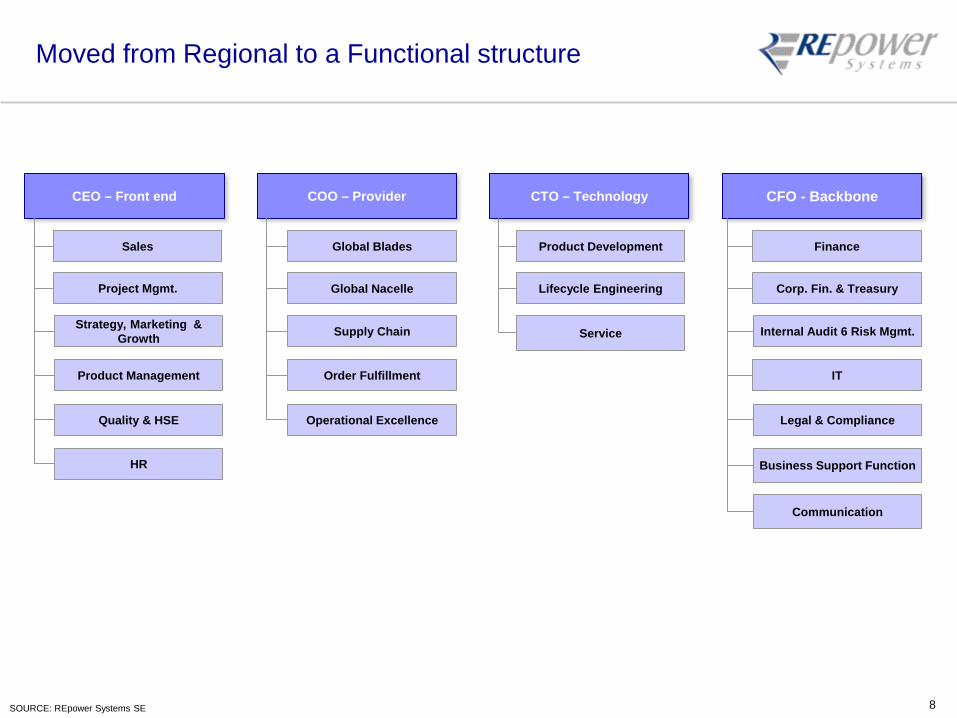
Moved from Regional to a Functional structure
CEO – Front end
Sales
Strategy, Marketing & Growth
HR
Quality & HSE
Product Management
Project Mgmt.
COO – Provider
Global Blades
Global Nacelle
Supply Chain
Order Fulfillment
Operational Excellence
CTO – Technology
Lifecycle Engineering
Service
Product Development Finance
IT
Legal & Compliance
CFO - Backbone
Corp. Fin. & Treasury
Internal Audit 6 Risk Mgmt.
Business Support Function
Communication

SOURCE: REpower Systems SE 9
REpower footprint based in Europe and in key emerging markets
REpower Systems Inc. SBU: Montreal Blade production: Ontario
Current footprint
REpower France SBU: La Défense
REpower USA Corp SBU: Denver REpower Portugal
SBU: Oliveira de Frades Nacelle assembly: Oliveira de Frades Blade production: Vagos
REpower Germany HQ: Hamburg Nacelle assembly: Trampe, Husum, Bremerhaven Blade production: Bremerhaven R&D: Osterroenfeld, Buedelsdorf, Osnabrück
REpower Italy SBU: Milano
REpower North (China) Nacelle assembly: Baotou
REpower Beijing Office Sourcing: Beijing
REpower Australia SBU: Melbourne
India Contract manufacturing
REpower UK SBU: Edinburgh

SOURCE: REpower Systems SE 10
Technology - Product Portfolio An introduction - Evolution of REpower turbines
MD 70
1998 2000
MD 77
2002
MM 70
MM 82
2003 2004
5M
MM 92
2005
MM100
2008
6.2M126
2009 2011
3.2M114
3.4M104
3.0M122
2013 2015
6.2M152
Vorführender
Präsentationsnotizen
Zweck: Produktstrategie erläutern

SOURCE: REpower Systems SE 11
Markets Around 9.4 GW installed across the world
Germany
Italy, Austria, Hungary
& Switzerland
France
UK
Belgium & Netherland
Canada
China
India
Japan
N. America Canada 564 USA 1,264 Total 1,828
Portugal & Spain
Europe
Germany 2,446
France 1,492 UK 1104 Italy 774 Others 1251 Total 7,067
Asia China 234 Japan 118 India 23 Total 375
Australia Total 159
Czech Republic
Poland
Australia
USA
REpower Global Installations in MW1
1As of Oct 2013; Includes all installed and SCADA connected systems; 2. REpower installation from 1987 onwards
Sweden

SOURCE: REpower Systems SE 12
REpower current production footprint has facilities in Europe and Asia to supply key markets
5
8
4
3 1 2
6
Location Type Current Capacity Ownership
Nacelle/hub [MW] Husum GER MM-Series 1000 100% REpower Trampe GER 3.XM 340 100% REpower Bremerhaven GER 3.XM, 5/6M 900 100% REpower
Oliveira de Frades POR MM-Series 300 Owned by Ventinveste, 100% controlled and operated by REpower
Padubidri IND MM-Series 800 “Job Order Contract” with Suzlon Baotou CHN MM-Series 0 Joint Venture / Exit done
Total hub & nacelle 3,340 Own Blade Production [Sets of 3 blades]
Bremerhaven GER RE 51/61 650 100% REpower, PowerBlades Vagos POR RE 45/51 700 100% REpower, RiaBlades Ontario CAN RE45 125 100% REpower
Total blade sets 1,475
7
1 2 3
4
5 6
7 8 9
9

SOURCE: REpower Systems SE 13
Manufacturing footprint Manufacturing & logistics center - Bremerhaven (Germany)
REpower production hall 3.XM / 5M / 6M
PowerBlades rotor blade factory

SOURCE: REpower Systems SE 14
Agenda
- Introduction
- REpower in a “Nutshell”
“ The Market
- REpower Strategy 2013-2018
- Expectations to Subcontractors
- Q & A
1
2
3
4
5
6

SOURCE: REpower Systems SE 15
There is a lot of juice in the global wind market
+4% p.a.
20181
6.8
4.1
2.2
0.5
2010
5.2
3.4
1.4 0.4
Fossil Renewables Nuclear
Renewables will grow their share ... ... with wind as 2nd largest source
1. Interpolated from 2010/2020 numbers 2. Includes solar and bio energy Note: Hydro energy is counted as renewable energy source Source: REpower market model for wind energy forecast; IEA 2012 World Energy Outlook (new policies scenario) for other generating technologies;
Global electricity generation (TW)
+6% p.a.
20181
2.2
1,2
0.6
0.4
2010
1.4
1.0
0.2 0.1
Global renewable electricity generation (TW)
Hydro Wind Other2

SOURCE: REpower Systems SE 16
Outlook wind turbine market: After the record year 2012 macro headwinds imposed strong challenges in 2013
Global market shrinking for the first time in 2013 (due to policy implications)
Policy deterioration in major parts of Europe (Germany, Spain, and Italy)
Global new order intake slowed in Q2 2012 but in 2013 a small improvement has been registered
Macro trends
21 20 21 22 2326
10 1011
1113
14
0
20
40
60 CAGR +10%
-1% +9%
Installations in GW
2016
58
6
12
2015
52
5
11
2014
48
4
11
2013
44
3
9
2012
45
2
13
2011
41
1
9
Offshore Asia/Pacific EMEA Americas
Expected global installations of wind turbines
Note: 2011 EMEA installation based on EWEA; Americas, Asia, and Offshore installation based on GWEC; 2012–2016 based on market model (mean of most recent studies: MAKE (11/12), BTM (03/12), SAT (09/12) Source: REpower 2013

SOURCE: REpower Systems SE 17
Agenda
- Introduction
- REpower in a “Nutshell”
“ The Market
- REpower Strategy 2013-2018
- Expectations to Subcontractors
- Q & A
1
2
3
4
5
6

SOURCE: REpower Systems SE 18
Offshore – REpower projects Beatrice – alpha ventus – Ormonde – Thornton Bank
Vorführender
Präsentationsnotizen
Zum Schluss einige Impressionen der bisher durch uns realisierten Offshore Parks Beatrice, Thornton Bank, Alpha Ventus und Ormonde.

SOURCE: REpower Systems SE 19
Agenda
- Introduction
- REpower in a “Nutshell”
“ The Market
- REpower Strategy 2013-2018
- Expectations to Subcontractors
- Q & A
1
2
3
4
5
6

SOURCE: REpower Systems SE 20
Current development state of wind industry impacts
Global network required with local manufacturing hubs, content & suppliers
Shorter lead times / order fulfillment cycle required
Efficient inventory management, working capital reduction required
Wider reach and availability of service and spares required
Quality, Time & Cost matters…
Scale − Move to industrialization phase
Reliability − Product quality to ensure better
value proposition to end-customer
Cost − Improving margins through efficient
operations and asset utilization
Implications for supply chain Key success factors in current industry situation

SOURCE: REpower Systems SE 21
Customer`s perspective
Customers in the past
Investment approx. 1-5 Mio.$
Turbines out of the shelf
Product functionality
Current Customers
Investment > 1 Mrd. $ Powerplant approach Product-/ Process Quality
- Manufacturing procedures - Quality procedures
Risk Management -comprehensive, professional
Documentation - proof of product Quality - proof of process Quality
Fundamental Paradigm Change in Customer Requirements
Preventive Quality Approach is essential !
to

SOURCE: REpower Systems SE 22
Cost of Quality: Rule of 10‘s
Failures to be avoided at suppliers in order to minimize total Cost of Quality.
@ Supplier
€ / 1.000
@ REpower GM
€ / 10.000 € / 100.000 € / 1.000.000
On-shore WTG Off-shore WTG
10x 10x 10x

SOURCE: REpower Systems SE 23
REpower requirements to our supply partners
Commercial requirements: Continuous effort required to support declining market prices
o Value Engineering o Globalization of Supply Chain o Improvement of productivity o Payment term extension
Performance requirements; Excellent execution: o OTD (on-time delivery) - and increased flexibility to changing market needs o High level quality / zero failure culture / preventive quality approach o Implementation of APQP-requirements (Advanced Product Quality Planning) o QAA (Quality Assurance Agreement)
Responsiveness o Fast reaction times & handling of non-conformities o Close cooperation with REpower o Improved reliability
Service support: Availability of spare parts, 24/7 hotline

SOURCE: REpower Systems SE 24
Agenda
- Introduction
- REpower in a “Nutshell”
“ The Market
- REpower Strategy 2013-2018
- Expectations to Subcontractors
- Q & A
1
2
3
4
5
6

SOURCE: REpower Systems SE 25
Time for your questions…

SOURCE: REpower Systems SE 26
New name as of January 20th, 2014…
SOURCE: REpower Systems SE 27