The Strategic Development of Museums: A System...
22
The Strategic Development of Museums: A System Dynamics Approach Chiara Bernardi CERMEC – Research Center on the Arts and Cultural Management Università Carlo Cattaneo LIUC University of Lugano Faculty of Communication Science, Department of Business Communication Chiara Beranrdi Phd, is a researcher of CERMEC (Research Center on the Arts and Cultural Management) at Carlo Cattaneo University, where she is lecture of Strategic Management. She is also Post-Doc fellow at University of Lugano, Department of Business Communication. Her research interests regard museum management, markets, network theory and system dynamics. Abstract Based on a review of existing literature in management and economics of arts and culture and on an extensive case study – the metropolitan museum district in Turin – this paper’s objective is to show that museum growth is problematic in the long term through a system dynamics model. The classical loop – investments, growth, profitability, investment – encounters difficulties when dealing with public goods, characterized by high interconnections among museums and stakeholders within the same territory. The model simulation shows the structural characteristics of this sector that determines problems in term of survival; it can thus be understood as blending management and economic perspectives. Therefore, the search for sustainability should be addressed in controlling museum growth with a long time perspective and in supporting and developing new forms of cooperation among those organizations to decrease the “cost of growth.” Keywords Museums, system dynamics, strategic development, sustainability. Introduction Whatever definition we use, there are few doubts museums have attracted growing attention over the last decade -- just count the number of various publications on the topic. In approaching the subject one cannot avoid noticing one apparent reason underlying this surging interest is museums as they are being perceived by various public authorities as a means to contribute to the development of a territory, be it city, region or country (i.e. Tobelem, 1998, Santagata, Signorello, 2000). More specifically, museums are increasingly perceived as a tool for promoting tourism flow (Browning, 1993; Lemmon, Graham, 2001; Eborle, 2002; Forte, Mantovani, 2001). Sustaining and developing museums has thus become one of the high order items on the agenda of various stakeholders. But although it is clear why museums should grow and increase their performance to face increasing expectations, it is not so clear how this can be made possible or what problems might be encountered in approaching this sector. 1
Transcript of The Strategic Development of Museums: A System...

The Strategic Development of Museums: A System Dynamics Approach
Chiara Bernardi CERMEC – Research Center on the Arts and Cultural Management
Università Carlo Cattaneo LIUC University of Lugano
Faculty of Communication Science, Department of Business Communication
Chiara Beranrdi Phd, is a researcher of CERMEC (Research Center on the Arts and Cultural Management) at Carlo Cattaneo University, where she is lecture of Strategic Management. She is also Post-Doc fellow at University of Lugano, Department of Business Communication. Her research interests regard museum management, markets, network theory and system dynamics. Abstract Based on a review of existing literature in management and economics of arts and culture and on an extensive case study – the metropolitan museum district in Turin – this paper’s objective is to show that museum growth is problematic in the long term through a system dynamics model. The classical loop – investments, growth, profitability, investment – encounters difficulties when dealing with public goods, characterized by high interconnections among museums and stakeholders within the same territory. The model simulation shows the structural characteristics of this sector that determines problems in term of survival; it can thus be understood as blending management and economic perspectives. Therefore, the search for sustainability should be addressed in controlling museum growth with a long time perspective and in supporting and developing new forms of cooperation among those organizations to decrease the “cost of growth.” Keywords Museums, system dynamics, strategic development, sustainability. Introduction Whatever definition we use, there are few doubts museums have attracted growing attention over the last decade -- just count the number of various publications on the topic. In approaching the subject one cannot avoid noticing one apparent reason underlying this surging interest is museums as they are being perceived by various public authorities as a means to contribute to the development of a territory, be it city, region or country (i.e. Tobelem, 1998, Santagata, Signorello, 2000). More specifically, museums are increasingly perceived as a tool for promoting tourism flow (Browning, 1993; Lemmon, Graham, 2001; Eborle, 2002; Forte, Mantovani, 2001). Sustaining and developing museums has thus become one of the high order items on the agenda of various stakeholders. But although it is clear why museums should grow and increase their performance to face increasing expectations, it is not so clear how this can be made possible or what problems might be encountered in approaching this sector.
1

Analyzing the management literature in this field, the concept emerges that these organizations should grow and improve their services, assuming a different approach to their audience. According to this view, museums can improve their performance by shifting their attention from the internal perspective, based on preservation, documentation and study, to an external perspective with a particular focus on their visitors and audience. This well-known framework can be traced back to the traditional contribution of marketing to the field of management: the shifting paradigm from product/production to market. But is it enough to understand these organizations and their possibilities for growth? It could be problematic develop a normative framework - suggesting solutions/strategies - when we have not understood how museum's system works. In addition, the understanding in art management seems to escape what it has been understood in the economics of arts. The goal of this study, which blends economic and management perspective in the field of arts and culture, is to show how growth can be problematic in the long term. The empirical base – the metropolitan museum district in Turin – has offered interesting insights that have supported the development of a system dynamics model. Literature Review Museums1 are complex organization for many reasons: the varieties of activities carried out, intangible nature of the outcome, multiple nature of the value produced, role museums can have in the society, etc. Considering the general assumption well-diffused in the sector that culture is (or should be) something outside the rules of economics, the way to approach this field should take into consideration multiple points of view and embrace different fields of study. In fact, museums and the art/cultural sector are studied by different branches – from museology to sociology, and from economics to management – with each capturing different facets of the phenomena. The development of the literature has assumed a disciplinary perspective, undervaluing the potential of a multidisciplinary approach. Moreover, different branches have approached the art/cultural sector in different ways. In particular, economics has studied museums and the cultural sector as an interesting area that challenges traditional theory and highlights interesting phenomena (Benhamou, 1996; Blaug, 1976; Trimarchi, 1993). In contrast, management has approached this sector extending the traditional and consolidated framework developed in its field (Zan, 1999). Considering the complexity and the multifaceted nature of the object of study, a multidisciplinary approach is needed to understand the phenomena more in depth. This paper’s blending of the economic and management perspective will contribute to advancement in this direction. The main contributors in the museum management literature have regarded the nature of museum organizations (McLean, 1994; Bagdadli, 1997; Chierieleison, 2003; Dubini, 1999), strategic management (Kovach, 1989; Moore, 1994; Chirieleison, 2003; Solima, 1998, Moretti, 1999), marketing management and approach (Kotler, Kotler, 1998; Colbert, 1995, Diggles, 1986, Melillo, 1995; McLean, 1997), consumer behavior (Robbins, Robbins, 1981; Goulding, 2000), accounting and accountability (Zan, 2000, Sibillio Parri, 2004), performance measurement (Paulus, 2003, Chirieleison, 2003), In this stream, museums can be viewed as a “nearly-organization” (Chierieleison, 2003) in which the lack in autonomy of defining objects and the lack of auto-generation of
2

financial resources implies an interdependent relationship with public institutions. This little degree of autonomy is particularly evident in Italy where museums are mainly “offices” of public authorities (Jallà, 2000) in which organizational boundaries are not clear. Taking into consideration the general decrease in public expenditure from one side, and the new role the museum should play in a changing society, from the other, the attention paid to museum performance has furthered the development of many normative suggestions and studies. The basic idea is to shift the focus of the museum from an internal to external point of view (i.e. Gilmore, Rentschler, 2002). The contribution of marketing – the importance of the market/demand in shaping what firms do or should do2 – is traceable in many contributions (i.e. Yorke, Jones, 1987). The audience seems to be an unexplored and unknown market: as museums do not know their visitors or their needs, they are not able to develop suitable offerings for them. By increasing their offerings for visitors (ranging from cultural to additional services), they can increase the visitor flow and consequently their revenues (i.e. Di Maggio, 1986; Kotler, Kotler, 1998; Goulding, 2000; Bagdadli, 1997 Solima, 1998, Chirieleison, 2003). However this intuitive cause-effect relationship overestimates the relevance of revenues from visitors in these type of institutions. Some studies in this area have shown visitors cover only 5-10% of museum costs (Rosset, 1991; Fourtes, 1999; Valentino, 1990). The larger amount of revenues comes from public institutions and private sponsorships (i.e. Settis, 1998). Public institutions and other private actors, such as bank foundations, invest in museums in order to restore buildings, develop or preserve a collection, etc. The economics of arts has investigated the reasons for state involvement in the cultural sector. First, arts organizations often do not have enough resources for current operations. Despite the high value people attribute to culture, consumers have a low degree of willingness to pay for cultural goods and services (Trimarchi, 1993). In addition, customers are also not able to evaluate the cultural good/service offered before acquiring them, due to the informative impossibility that characterizes this sector3. Therefore state involvement can be explained and justified in many ways (Frey, Pomerehne, 1987, 1989; Austern-Smith, 1980), as culture can be considered a merit good (Musgrave, 1987) or a public good (i.e. Pilotti, 2003) that creates wishing externalities (Throsby, 1982). The assumed reason should influence the ways of funding these organizations. However public authorities face difficulties in evaluating the performance of these organizations, due to the informative impossibility (Hansmann, 1986; Trimarchi, 1993) from one side, and the image return coming to administrators thanks to investments in this sector (Benhamou, 1996), from the other side. These conditions imply an unclear and opaque process of resource allocation (Maddison, 2004; Peacock, 1991, Trimarchi, 1993; Benhamou, 1996). The management literature seems to overestimate the virtuous process of services offered for visitors, well-explained in the economics literature. Moreover the economics of art does not catch the dynamic of expenditure, instead assuming a static perspective. Neither considers, in any appropriate way, the dimensions of competition in and outside the museum/cultural sector. Along this way, culture competes with the other public sectors in acquiring resources needed for its development, and it has a low capacity to attract resources with respect to other expenditure sectors. In fact, culture is not considered a primary need, therefore it is considered less necessary than labor, education or health. For this reason, culture chronically suffers from a scarcity of
3

resources. Competition is also recognizable among museums in acquiring resources for their functioning and development. Methodology The emerging limits from the literature, both in management and economics, have addressed our attention to the selection of an adequate methodology that can catch the dynamics of this sector, taking into consideration the non-line arties, delays within the system and accumulation process. For these reasons, the system dynamics method (Forrester, 1961, 1968; Sterman, 2000; Coyle, 1996) was assumed to address the problem definition and the development of the model. Moreover, the system dynamics method is also consistent with the long time perspective that characterizes the cultural sector, although it is not often confirmed by decision-makers or by the literature, especially in management studies4. An empirical field that shows interesting growth in the last few years is the metropolitan area of Turin, used here as an embedded case study (Sholtz, Tijete, 2002). Data and information were collected through primary and secondary sources with a double perspective: one was focused in studying the whole metropolitan area and its evolution during the last fifty years, while the other was focused on analyzing several museums involved in a growth strategy. The primary data was collected through semi-structured interviews of the decision-makers and museum directors. The selection of the interviewees was driven by the opinions of several experts on the cultural sector in Turin. The secondary data was addressed to collect documents and information about the strategy pursed by the municipalities, the region and the bank foundations that play a crucial role within the sector. The development of the system dynamics model has followed the modeling process suggested by Sterman (2000). The logic of the model is not to forecast the evolution of the system studied, but rather it is aimed at showing what type of problems the evolution of museums located in the same area could face if they pursue a high growth strategy. To increase the reliability of the model, it was validated through a series of validation tests suggested by Forrester & Senge (1980). Some Insights from the Field: The Metropolitan Museum District in Turin Turin, the fourth largest city in population in Italy and now one of the wealthiest, is located in the north-east. Dominated in the past by the noble Savoy family, Turin has retained its regal feel, traceable in the majestic buildings and Baroque architecture. The cultural tradition and new cultural streams are also traceable in the number and variety of museums located in the metropolitan area, which has thirty museums located in the city and another thirteen in the province covering archaeology, classic and modern arts, anthropology, history, natural science, technology. Furthermore, there are also specialized museums, historical residences, castles, and exposition spaces. The analysis of this sector can be divided into two different parts. First, a picture of the metropolitan museum district is given so as to describe the role played by each museum and the interdependences among them. Second, an analysis of the dynamic of this
4

sector in the last decades is reported to identify the strategies pursued by the museums and highlight some interesting insights to identify the dynamic problem. As to the first point, public authorities and private sponsors support the museum district. These public authorities are the municipality of Turin, the Province and the Region which all have different roles within the sector. The Municipality of Turin governs over some museums (called civic museums) and supports investment in and current operations of many museums located in the city. The Piemonte Region is also involved in supporting the cultural organizations located in the region and obviously in the metropolitan area, often in partnership with the Municipality. However the role of the Province is not well-defined due to the evolving reform of public administration that is reshaping the roles and responsibilities of the different levels of government. The main private sponsors in the city of Turin are the bank foundations, which both provide available financial resources and invest in the cultural sector5. Representatives of public authorities, among others, compose the board of directors of these foundations to provide a systematic policy which addresses investment and resources from the same direction. The resources available for the museums located in the city come from these actors, with a particular focus on the municipality and bank foundations. The increasing interconnections among these actors, both public and private, determine common intents and they act, more or less, as an unique actor. Therefore, the sustainability of the museum district depends on the availability of resources of these actors. It implies a closed system: i.e. for the main part museums can grow only if the actors located in that area support their growth. Only a few museums such as the Egyptian Museum have had the possibility of attracting resources from the central government due to the importance of this institution in Italian cultural offerings. Moreover, few museums can attract resources from other private sponsors, as the normative context does not sustain this type of investment considering the relative unattractiveness of culture as compared with sports sponsorships or humanitarian activities (O’Hagan, Harvey, 2000). As to the dynamic of the Metropolitan museum district in Turin, the development of the cultural offerings in the last decade (and in particular the last five years) is traceable to different actions public and private actors have promoted. The development of the system can be shown, in a synthetic way, by the growth of the open museums, the growth in expenditures of different actors and the investment projects of the last few years. First, we should consider the growth of museums open to the public from the beginning of the 1950s to 2002 (see graph 1). The number of museums open to the public was stable from the 1960s to the 1980s, as around 13/14 museums opened. From the beginning of the 1990s until now, there was an interesting growth resulting in more than twenty-eight museums being opened in the city. The reasons for this growth can be seen in the investments the Municipality of Turin made in the 1980s for opening new museums, thanks to private initiatives supported by public authorities and, obviously, the closure of some institutions to redefine their mission, collections and services for visitors.
5

Graph 1: Museums open in the City of Turin (1952-2002)
0
5
10
15
20
25
30
1952 1957 1962 1967 1972 1977 1982 1987 1992 1997 2002Year
Num
ber o
f ope
ned
mus
eum
s
Source: our elaboration on the Cultural Observatory of Piemonte (1999, 2000, 2001, 2002)
Second, we should consider the resources allocated to this sector by different actors during the last few years. Considering the growth rate in expenditure supported by the Municipality, Province of Turin and Piemonte Region (see graph 2), we observe a sharp increase in resources spent in cultural heritage/activities. Moreover, the graph shows the role of the Province (the authority between the Municipality and Regional government) is not well-defined in the cultural sector as there is a high variability of resources allocated to that sector. In addition, the graph demonstrates the growth rate of resources allocated to current operations was less than resources allocated for investments (data are available only for region expenditures.)
Graph 2: Growth Rates of Expenditure of Public Authorities in the Cultural Sector
Source: our elaboration on the Cultural Observatory of Piemonte (1999, 2000, 2001, 2002)
-60
-40
-20
0
20
40
60
1996 1997 1998 1999 2000 2001
Years
Gro
wth
rate
s of
exp
endi
ture
(b
ase:
1996
) Municipality
ProvinceRegion Investment
Region current operation
6

We note this growth is a countertrend with respect to the general public expenditure trends that shows a general decrease in resources, due to the turnaround in public administrations started in the last decade. In this context, although culture has assumed a different role within the agenda of various stakeholders, it is questionable if the higher public expenditure in this sector will be possible in the near future. However, if we compare the growth rate of the number of museums open and the growth rate of expenditure, we note the resources available for each museum has on average either been reduced or at best remained steady. Third, we can observe the development of the museum sector through the way the investment in the metropolitan museum district was done. The investment projects involved specific interventions in the physical structure (new location, building restoring, construction of new exposition area), the exhibition of artifacts, and development of new services for visitors.
7

Table 1: The Main Investment Projects in the Metropolitan Museum District
Museums Open Investment projects
Investment (000€) Timing Public and Private
sponsor
Armeria Reale Open Exhibition, services for visitors. 150 2003-2005 Municipality, Bank
foundations
Castello di Venaria Reale Open
Building restored, exhibition area, services for visitors, training activities.
190.700 2003-2006 State, Region, Municipality, Province, Bank foundations
A … come Ambiente Closed Location, exhibition,
services for visitors n.d. 2003-2005 Municipality, Bank foundations
Galleria Sabauda Open location, exhibition, preservation, services for visitors
23.000 2003-2005 Region, Municipality, Bank foundations
Museo Civico di Arte antica - Palazzo Madama
Next opening
Building restored, exhibition, 13.000 2003-2006 Municipality, Bank
foundations
Museo di Arte Orientale
Next opening
Building restored, exhibition area 9.600 2003-2005 Municipality, Bank
foundations Museo diffuso della Resistenza, della deportazione
Next opening
Exhibition, preservation, services for visitors
5.200 2000-2003 Region, Municipality, Bank foundations
Museo Egizio Open Exhibition restored, new legal form (foundation)
30.000 2003-2006 State, bank foundations
Museo Nazionale del Cinema Open New location,
exposition restoring n.d 1999-2000 Region, Municipality, Bank foundations
Museo Nazionale dell'Automobile Open
Building and exposition restored, services for visitors. 25.0006 2003-2006
Municipality, bank foundations
Museo Nazionale della Montagna Open
Building and exposition restored, services for visitors 3.100 2003-2006
Region, Municipality, Bank foundations
Museo Nazionale del Risorgimento Italiano Open
Exposition restored, maintenance 10.000 2003-2006
Region, Municipality, Bank foundations
Museo Regionale di Scienze Naturali Open
Exposition area,services for visitors 7.700 2001-2006
Region, Municipality, Bank foundations
Source: author elaboration on www.torino-internazinale.org, www.comune.torino.it/musei From interviews of museum directors has emerged the idea that many times the investment projects do not consider the impact of the changes on the cost structure of the museum functions: i.e. the investments follow the logic of beauty and the meaningfulness of the new exposition of artifacts rather than the logic of the economic use of resources. Intuitively, if the investments increase the quality of the museum offerings, it will imply an increase in the operating costs. An example of the impact of investment projects on the operational costs of a museum is reported in the table 2.
8

Table 2: “Galleria Sabauda”: estimation of cost and revenues after the investment project (Thousand €)
Cost Now % Expected %Expected/
now %Personnel 768,65 73% 1.058,31 46% 137,68%Structural costs 198,36 19% 451,18 20% 227,46%Maintenance 49,92 5% 64,04 3% 128,29%Scientific activity 41,38 4% 83,87 4% 202,68%Teaching activity - 36,15 2%Marketing and communication - 284,05 12%Exhibitions - 309,87 14%Total 1.058,31 100% 2287,27 100% 216,12%
Revenues Now ExpectedExpected/
now %Revenues from visitors 55,34 5% 134,28 6% 242,65%Sponsorship 330,85 31% 424,32 19% 128,25%
Total Revenues 386,19 36% 558,6 24%Financial requirements 990,49 94% 1.728,67 76%Total 1.058,31 100% 2287,27 100% 216,12%
Source: author’s elaboration on Guerzoni, Santagata (1999)
Defining the Problem: The Sustainability of the Strategic Development of Museums The literature review and the evidence of the empirical analysis shows museums are intricately interconnected with the public and private actors that support investment and the current functioning of these institutions. The myth of revenues from visitors – that many contributions will serve as a solution to a museum’s problem – should be set aside so we can to develop a realistic view of how this sector works. Moreover, this interdependence has a local focus: museums in the same area have access to the same resources. In addition, these resources are limited because the number of financing actors seems to be limited, and the cultural organizations compete with other sectors of public expenditures and other sectors that attract private sponsorships. They cannot grow forever. As investments have a great impact on operating costs, the same public authorities that financed the investment projects could have some difficulties to support operative management of this organization, due to their role to support both investments and current operations. What are the consequences of the development of this sector? Will there be a high museum growth both in terms of quantity and quality of the offerings traceable to the metropolitan museum district in Turin? If so, will it be sustainable? The intuitive loop - investment, growth, profitability and new investments - does not work in the museum sector. The increase in term of quality and quantity of the museum offerings create positive externalities, which cannot be appropriated by the institutions involved.
9

In order to answer to these questions, a system dynamics model is proposed to show the sustainability of high growth strategies is questionable, and that to design a suitable policy that guarantees long term growth, it will be necessary to overcome some myths and beliefs set forth in the museum management literature. A System Dynamic Model to Simulate the Strategic Growth of Museums Spatially Located Before describing the content of the model proposed, some clarifications about the logic assumed in the modeling process are needed. The system dynamics model proposed is conceived as an exemplification of the dynamic problem previously highlighted which emerges from a critical review of literature and from the case study. The aim of the proposed model is not to forecast the dynamic evolution of the museum district in Turin, but treat it only as an exemplification of the problem identified so as to focus on the possible problems a museum district can have if they follow a high growth strategy. The key assumptions of the model are:
• Two museums compete to acquire economic resources, given their growth objectives.
• Museums are described through an aggregate state variable “museum offering” that represents the entirety of activities carried out by the museum (including back office activities such as preservation, study and documentation of artifacts and front office activities such as services for visitors). The value range from 0 to 1: zero means that museum is closed and 1 means the maximum museum offering.
• Museums compete in acquiring resources in order to increase the museum’s offerings, given their objectives of growth.
• The objects of growth come from a negotiation process between the museum and public authorities and private sponsors. This negotiation process was left outside the model, in fact growth objectives are considered as constants into the model.
• The available resources are allocated for the purpose of investment or to cover operating costs.
• Each level of quality of the museum offerings is associated with a level of operating cost.
• The operating cost should be covered by resources available for current operation: if resources available are not as much as the resources needed, the level of museum offerings degenerates; otherwise if available resources are more than resources needed, the level of museum offerings will increase.
• The growth rate of the museum offerings depends primarily on investment projects.
• The allocation criteria for investment and operative functioning is to divide the resources available for the two museums, according to their needs.
These assumptions seem to be closed to the emerging structure of the system coming from the case study and the theoretical contribution.
10
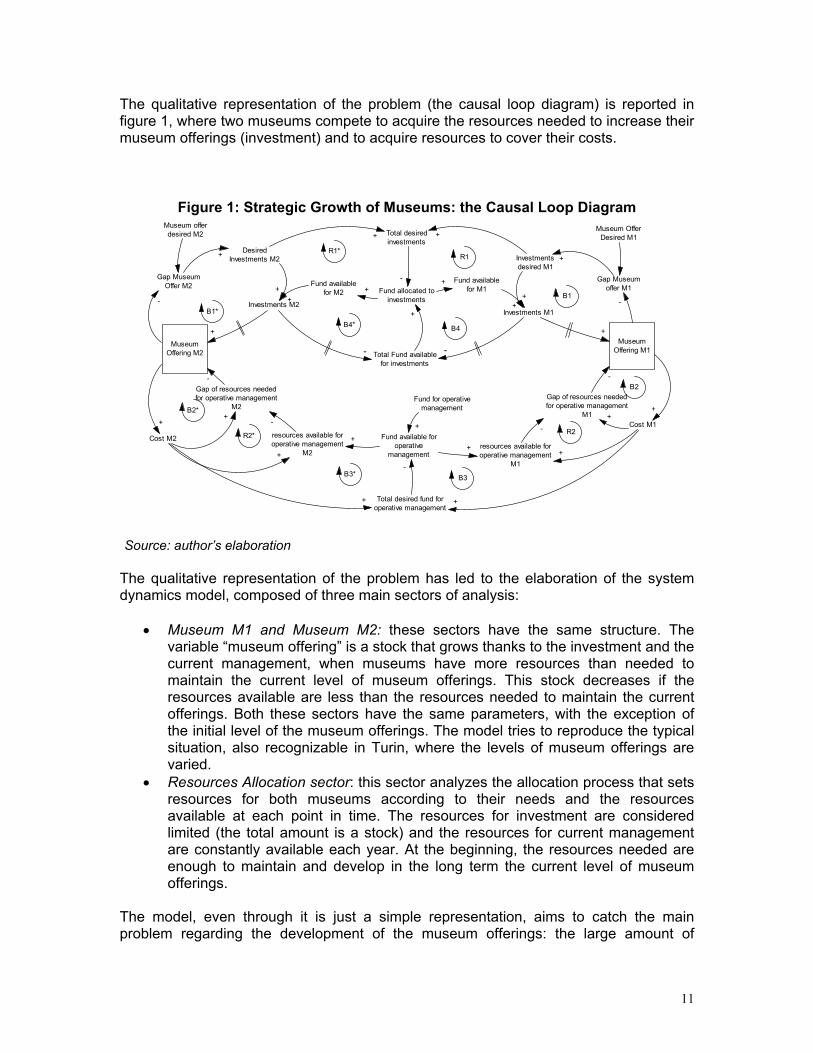
The qualitative representation of the problem (the causal loop diagram) is reported in figure 1, where two museums compete to acquire the resources needed to increase their museum offerings (investment) and to acquire resources to cover their costs.
Figure 1: Strategic Growth of Museums: the Causal Loop Diagram
MuseumOffering M1
Gap Museumoffer M1
Museum OfferDesired M1
Investmentsdesired M1
Investments M1
Cost M1
Gap of resources neededfor operative management
M1
resources available foroperative management
M1
-
-
++
-
+
+
Total desired fund foroperative management
Fund for operativemanagement
Fund available foroperative
management
+
+
-
+
Total desiredinvestments
Total Fund availablefor investments
Fund allocated toinvestments
-
+
+
+
MuseumOffering M2
Gap MuseumOffer M2
Museum offerdesired M2
DesiredInvestments M2
Investments M2
Cost M2
Gap of resources neededfor operative management
M2
resources available foroperative management
M2
-
-
++
-
+
+
+
+
+
+
++
B3B3*
R1
R2
B1*
B2*
B1
B2
Fund availablefor M2
Fund availablefor M1+
+
+
+
R2*
R1*
- -
B4* B4
Source: author’s elaboration The qualitative representation of the problem has led to the elaboration of the system dynamics model, composed of three main sectors of analysis:
• Museum M1 and Museum M2: these sectors have the same structure. The variable “museum offering” is a stock that grows thanks to the investment and the current management, when museums have more resources than needed to maintain the current level of museum offerings. This stock decreases if the resources available are less than the resources needed to maintain the current offerings. Both these sectors have the same parameters, with the exception of the initial level of the museum offerings. The model tries to reproduce the typical situation, also recognizable in Turin, where the levels of museum offerings are varied.
• Resources Allocation sector: this sector analyzes the allocation process that sets resources for both museums according to their needs and the resources available at each point in time. The resources for investment are considered limited (the total amount is a stock) and the resources for current management are constantly available each year. At the beginning, the resources needed are enough to maintain and develop in the long term the current level of museum offerings.
The model, even through it is just a simple representation, aims to catch the main problem regarding the development of the museum offerings: the large amount of
11

investment required, the impact on the operating costs, and the consequent lack of resources for the current operative management that destroy year by year the investments made. The possible model enlargement should be evaluated in terms of the marginal value added. For instance, the model could consider on a more detailed level the components of the museum offerings from the front office (services available, operating hours, etc.) to the back office (research and preservation activities, heritage security). In addition, the model enlargement can examine the allocation process to catch the possible delays present in the system and the misperceptions in evaluating the resources needed for the museum, due to the difficulty in acquiring information in the museum sector. Simulations and Policy Design The actual strategy pursed by the Museum District in Turin reflects a high growth strategy for the main part of the museum organizations located in the metropolitan area. This strategy seems to be unsustainable in the long term; in fact due to the increase in museum costs needed to maintain the higher level of museum offerings, the museum offerings progressively decrease, eradicating the improvement achieved through the investment process. A simulation of the actual strategy pursued in Turin is reported in the graph 3.
Graph 3: Simulation of the Actual Strategy Pursued in Turin7
0,30,35
0,40,45
0,50,55
0,60,65
0 2 4 6 8 10 12 14 16 18 20 22 24 26 28 30
Time
Mus
eum
Offe
ring
MuseumOfferingM1 MuseumOfferingM2
Source: author’s elaboration
If the high grow rate strategy seems not sustainable in the museum sector, we should analyze the situation and suggest possible policy designs that can increase the sustainability of museum growth in the long term. The model simulations have suggested some policy indications, addressed to increase the sustainability of the system, given its structure. The first policy indication regards the reduction of the growth objectives. This strategy tries to avoid overburdening the carrying capacity of the system (given the resources available for current operations) and maintain the museum offerings in the long term, thanks to the investments made. Along this stream, we have changed the parameters of the model, reducing the growth
12

objectives of the two organizations being considered. The results of the simulations are reported in graph 4. This strategy can be difficult to pursue, considering the image return the cultural sector has for public authorities, as well as taking into consideration that investments tend to transform these organizations in a much more spectacular way.
Graph 4: Policy Design 1: Growing Slowly8
0,3
0,35
0,4
0,45
0,5
0,55
0,6
0,65
0 2 4 6 8 10 12 14 16 18 20 22 24 26 28 30
Time
Mus
eum
Offe
ring
MuseumOfferingM1 MuseumOfferingM2
Source: author’s elaboration
The second policy indication regards the reduction of cost of growth. If the investments are projected in order to curb the increase in operative costs, the degeneration process of the museum offerings can be slowed. The effective feasibility of this strategy requires a combined design of investment projects, embracing management with aesthetic and artistic/historical experts. The combination of these different perspectives and competencies requires a new approach to the museum sector where the economy (in latu sensu) serves artistic and aesthetic values and needs. The reduction of cost of growth can be pursed by the search for economy of scale, gathering the activity and the services that can be centralized and available for all museums within the metropolitan area (i.e. Wilson, Boyle, 2004). This solution requires museums to reshape their organizational structure and develop multi-level agreements to develop inter-organizational cooperation. The cost reductions should be evaluated considering hidden-cost that the opaque distinction among museums and public administration owners do not let to make out. The third policy indication regards the increase of resources for operative management and the corresponding decrease of resources available for investments, combined with a limited growth strategy. This strategy indicates the same resources should be allocated in a different way to sustain the museum’s growth. This strategy shows that a step-by-step process increases the sustainability of the system, thereby avoiding the
13

degeneration effects. However this strategy is extremely inconsistent with the diffused and shared mental models within the sector, in which the resources for current management seem to be synonymous with inefficiency and investments are the symbol of development of the sector. The delay present in the system (the museum offerings decrease steadily) create misperceptions so the degenerative process is not recognized until it becomes very evident.
Graph 5: Policy Design 2: Reducing the Cost of Growth9
0,3
0,35
0,4
0,45
0,5
0,55
0,6
0 2 4 6 8 10 12 14 16 18 20 22 24 26 28 30
Time
Mus
eum
Offe
ring
MuseumOfferingM1 MuseumOfferingM2
Source: author’s elaboration
Graph 6: Policy Design 3: Increase the Resources Allocated
for Operative Management10
0,30,35
0,40,45
0,50,55
0,60,65
0,7
0 2 4 6 8 10 12 14 16 18 20 22 24 26 28 30
Time
Mus
eum
Offe
ring
MuseumOfferingM1 MuseumOfferingM2
Source: author’s elaboration A combination of the policy suggestions can represent a possible fourth way to develop these organizations in the long term, by blending the reduction of cost of growth and a more efficient use of existing resources. In conclusion, the policy analysis has shown the sustainability of these organizations requires a radical change in the mental models well-diffused within the sector.
14

Conclusions The main conclusion of this study is the discussion of the sustainability of museums, which is questionable in the long term, and the need for development of a more effective strategy which implies a radical change in the mental models assumed in the sector. More particularly, these models must be concerned with the rapidity of the museum’s growth, the way to design the investment projects, the reduction of costs of growth and the resources allocation among investments and current operation. The change of these mental models remains one of the most critical aspects. Moreover, this study suggests some implications for the museum management literature. In particular, they are traceable in the choice of the object and the framework of analysis that should be assumed. Due to tight interconnections among the museums located in the same area, the public and private institutions in the same area, and the relevance of this interconnection for the sustainability of the whole system, the object of the analysis should be moved from the single organization to the organizations located in that area. Another implication regards the multidisciplinary perspective, assumed in this study: it has highlighted the potential of this approach to the study of museums and their functioning. In particular, the management perspective should appropriate the theory developed in the economics of arts. Considering the methodology used, this study has highlighted the importance of the use of system dynamics to capture the possible dynamic evolution of the system. This method, identifying counterintuitive behavior, has revealed the fact that the more you invest, the more you will decay in the long term. Therefore, strategies that have good results in the short term can be problematic in the long term. The span of application of the system dynamics approach to this sector can be interesting, especially to overcome the limit of static perspective and analysis of this sector that, by nature, produce its effects in the long term. The main limits of the application of the system dynamics methods to this field are the restricted availability of data that structurally characterize the sector. The limits of this study are numerous, and they suggest some further research directions. This model does not discuss in detail the allocation process and the definition of the growth objectives. The definition of the variable “museum offerings” can be considered much too general and it does not catch the dynamic evolution among back-office and front-office activities. The model could discuss the consistency of the growth process with regard to the museum mission, stakeholders’ objectives and expectations from the institutions. The future development of the model should also take into consideration the value that each part produces to the ultimate meaningfulness.
15

16
Notes
1 ICOM (International Council of Museums) defines a museum as “a non-profit making,
permanent institution in the service of society and of its development, and open to the public, which acquires, conserves, researches, communicates and exhibits, for purposes of study, education and enjoyment, material evidence of people and their environment.” (ICOM Statutes, 2001, article#3).
2 We note that Colbert (1995) and others (Mokwa, et al 1980, Melillo 1995, Diggles 1986) advocate a shift in attention from the adaptation of the product to a given and defined set of customers to the need to identify and reach customers for a given product. In this way, marketing for arts is different from the traditional marketing theories.
3 Customer satisfaction depends on the level of novelty the marginal quantity of good can add to the cultural capital accumulated in previous cultural experiences (Trimarchi, 1993). However before purchasing, the customers do not know if what they are going to buy will actually add value to their cultural capital.
4 Some contributions have already applied the systemic perspective in analysing museum sector, such as Lorenoni & Odorici (1999) and Bernardi et alli (2004). They have represented the dynamic problems adopting qualitative perspective (Senge, 1990). In this paper we have applied a quantitative perspective based on stock and flow diagrams and model simulations.
5 The bank foundations located in Turin are two of the ten largest bank foundations in Italy, and many experts in the sector define the bank foundation as one of the most important actors in developing the cultural offer (Roversi Monaco, 2003).
6 The value was estimated by Bodo et alli (2003). 7 Simulation is based on the following input: resources available for operative management: 300;
resources available for investment: 4000; museum offering M1(time=0): 0,3; desired museum offering M1: 0,55; museum offering M2 (time=0): 0,5, desired museum offering M2: 0,7.
8 Simulation is based on the following input: resources available for operative management: 300; resources available for investment: 4000; museum offering M1(time=0): 0,3; desired museum offering M1: 0,45; museum offering M2 (time=0): 0,5, desired museum offering M2: 0,6.
9 This simulation is based on the following input: resources available for operative management: 300; resources available for investment: 4000; museum offering M1(time=0): 0,3; desired museum offering M1: 0,55; museum offering M2 (time=0): 0,5, desired museum offering M2: 0,7. In other simulations the non linear relationship between Museum Offering MX and Operative resources needed MX (where X=1,2) was “GRAPH(MuseumOfferMX,0,0.1,[0.22,0.24,0.48,0.68,1.27,2.06,2.85,3.71,4.58,4.96,5"Min:0;Max:5; Zoom"])”. Instead in this simulation, the non-linear relationship is “GRAPH(MuseumOfferMX,0,0.1,
[0.22,0.24,0.35, 0.57,0.94,1.36,1.91,2.46,2.81,3.03,3.27"Min:0;Max:5;Zoom"]) 10 This simulation is based on the following input: resources available for operative management:
400; resources available for investment: 1000; museum offering M1(time=0): 0,3; desired museum offering M1: 0,55; museum offering M2 (time=0): 0,5, desired museum offering M2: 0,7.
References Austern-Smith D. 1980. “On justifying subsides to the performing arts”. In Economics Policy for
the Arts, W.S. Hendow, J.L. Shananon and A.J. Mc Donald, eds., Cambridge MA. Abt Books, p. 24–32.
Bagdadli S. 1997. Il museo come azienda. Management e organizzazione al servizio della cultura. Milano: Egea.
Benhamou 1996 L’économie de la culture. Paris: Le Découverte.

17
Bernardi C., D. Moro and A. Sinatra, 2004. “Verso modelli innovativi di gestione museale: una
logica sistemica.” In Mission e Scelte strategiche, Sibillio Parri B. eds., Milano: Franco Angeli. Blaug M. (eds) 1976. The economics of the arts. London: Martin Robertson. Bodo S.P., Ciocca, L. Moreschini and W. Santagata 2003. Il progetto Science Center e il sistema
della divulgazione scientifica e tecnologica a Torino. Research report, Ebla Center-Department of Economics, University of Turin.
Browning E.L A. 1993. "Personality Museum as a Tourist Attraction." Economic Development Review. Vol. 11, no 4 (Fall), p. 78–80.
Chirieleison, C. 2003. La gestione strategica dei musei. Collana di studi economico-aziendali E. Giannessi. Milano: Giuffrè.
Colbert, F. 1995. Marketing Culture and the Arts. Montreal: Presses HEC. Coyle R.G. 1996. System Dynamics Modelling: A Practical Approach. London: Chapman and
Hall. Diggles, K. 1986. Guide to Arts Marketing: the principles and practice of marketing as they apply
to arts. London: Rhinegold Publishing limited. DiMaggio, P.J. 1986. “Can culture survive the marketplace?” In Nonprofit enterprise in the arts.
Studies in mission and constraint, P.J. DiMaggio, ed. Oxford University Press, Oxford. Dubini P. 1999. Economia delle aziende culturali. Milano: Etas Libri. Erbele M. 2002.“Kulturtouristen als wichtiges Besuchersegment im Marketing von
Kulturbetrieben.“ Tourism Journal. Vol. 6, p. 49–57. Forrester J.W and P. Senge 1980. “Tests for building confidence in system dynamics models.”
TIMS Stud. Management Sci. Vol.14, p. 209–228. Forrester J.W. 1961. Industrial dynamics. Cambridge MA: Productivity Press. Forrester, J.W. 1968. Principles of Systems. Cambridge MA: Productivity Press. Forte, F., and M. Mantovani. 2001. “Offerta di beni artistici e storici, distretti d’arte e flussi
turistici”. In Museo contro museo. Le strategie, gli strumenti, i risultati, P.A. Valentino and G. Mossetto, eds., Milano: Giunti.
Frey B.S., and W.W. Pommerehne. 1989. Muses and markets: explorations in the economics of the arts. Oxford: Basil Blackwell.
Frey B.S. and W.W. Pommerehne. 1987. Sussidiamento pubblico dell’arte e della cultura: perché e come? Discussion Papers in Public Sector Economics.
Fuortes, C. 1999. I servizi aggiuntivi nel sistema museale italiano. Vincoli attuali, obiettivi raggiunti e possibili sviluppi future. Economia della Cultura. Vol. 2, p. 183–199.
Gilmore, A., and R. Rentschler. 2002. Change in Museum Management: A Custodial or Marketing Emphasis? The Journal of Management Development, Vol. 21, no 9/10, p. 745–760.
Goulding, C. 2000. “The Museum Environment and the Visitors Experience”. European Journal of Marketing, Vol. 34, no 3/4, p. 261–278.
Guerzoni, G. and W. Santagata 1999. Galleria Sabauda: organizzazione, gestione, politiche muesali. Rapporto per la Compagnia di San Paolo e la Fondazione CRT. Luglio.
Hansmann, H. 1986. “Nonprofit Enterprise in the Performing Arts.” Bell Journal of Economics. Vol. 12, p. 341–361.
International Council of Museums, 2001. Code of Professional Ethics (July 6, 2001). Jallà D.L. 2000. Il museo contemporaneo. Introduzione al nuovo sistema museale italiano.
Torino: Utet. Kotler, P., and N. Kotler 1998. Museum Strategy and Marketing: Designing Missions, Building
Audiences, Generating Revenue and Resources. San Francisco CA: Jossey Bass Wiley. Kovach C. 1989. “Strategic Management for Museums”. The International Journal of Museum
Management and Curatorship. Vol. 8, p. 137–148. Lemmon J.J. and M. Graham 200. “Commercial Development and Competitive Environment: The
Museum Sector in Scotland.” The International Journal of Tourism Research, Vol. 3, p. 265–281.
Lorenzoni G. Odorici V. 1999. “Processi cognitivi e opzioni strategiche nella gestione museale.” In Conservazione e innovazione nei musei italiani. Management e processi di cambiamento, L. Zan, ed., Etas Libri, Milano.

18
Maddison D. 2004. “Causality and Museum Subsidies”. Journal of Cultural Economics. Vol. 28,
no 2, p. 89–108. McLean F. 1997. Marketing the museum, New York: Routledege. McLean, F. 1994. “Services Marketing: the case of museums.” The Service Industries Journal,
Vol. 14, no 2, p. 190–204. Melillo, J.V. 1995. Market the arts. Revisited Edition. Patricia Lavender Ed. Brooklyn, NY: Arts
Action Issue. Mokwa, M.P., W.M. Dawson and E.A. Prieve 1980. Marketing in the Arts. New York: Praeger
Publishers. Moore K. 1994 (ed.) Museum Management. London: Routledge. Moretti A. 1999. La produzione museale. Torino: Giappichelli. Musgrave R.A. 1987. Merit Goods. London: Mcmillan. O'Hagan, J and Harvey, D 2000. "Why do Companies Sponsor Arts Events? Some Evidences
and a Proposed Classification." Journal of Cultural Economics Vol.24, p. 205–224. Osservatorio Culturale del Piemonte, 1999. Relazione annuale. Ires – Istituto di ricerche
economiche – sociali del Piemonte. Osservatorio Culturale del Piemonte, 2000. Relazione annuale. Ires – Istituto di ricerche
economiche – sociali del Piemonte. Osservatorio Culturale del Piemonte, 2001. Relazione annuale. Ires – Istituto di ricerche
economiche – sociali del Piemonte. Osservatorio Culturale del Piemonte, 2002. Relazione annuale. Ires – Istituto di ricerche
economiche – sociali del Piemonte. Paulus O. 2003. “Measuring Museum Performance. A Study of Museums in France and United
States.” International Journal of Arts Management. Vol. 6, no 1. Peacock A. 1991. “Economics, cultural values and cultural policy.” Journal of Cultural Economics,
Vol. 15, no 2, p. 1–18. Pilotti, L. 2003 “L’approccio tradizionale e i metodi alternativi”. In Conoscere l’arte per conocere.
Marketing, Identità e Creatività delle risorse culturali verso ecologie del valore per la sostenibilità, L. Pilotti, ed., Padova: Cedam.
Rosset R.N. 1991. “Art Museums in the United States: A Financial Portrait.” In The Economics of Art Museums, M. Feldstein, ed., Chicago: University of Chicago Press, p. 129–177
Roversi Monaco F.A. 2003. “Il sostegno delle fondazioni bancarie all'arte: il caso dei distretti culturali e turistici.” Rivista di Politica Economica, May-July, p. 253–266.
Santagata, W., and G. Signorello 2000. “Contingent evaluation di Napoli Musei Aperti.” Economia della Cultura, Vol.2, p. 147–158.
Scholz, R.W and O. Tietje 2002. Embedded case study methods: integrating quantitative and qualitative knowledge. London: Sage.
Senge P.M. 1990. The Fifth Discipline: the Art and Practice of the Learning Organization. New York, Doubleday/Currency.
Settis S. 1998. “Gli Stati Uniti come modello per la gestione dei beni artistici e culturali in Italia?” In La gestione dei beni artistici e culturali nell’ottica del mercato, A. Mattiacci, ed., Guerini, Milano.
Sibilio Parri B. and M.L. Tomea Gavazzoli. 2004. “Measuring Museums' Social Merits: The Case of the Museo di Storia Naturale of Novara.” EIASM Workshop on Managing Cultural Organization, Bologna, December.
Solima L.1998. La gestione imprenditoriale dei musei. Percorsi strategici e competitivi nel settore dei beni culturali. Padova: Cedam.
Sterman J.D. 2000. Business Dynamics: systems thinking and modelling for a complex world. Irvin McGraw-Hill.
Throsby, C.D. 1982. “Social and Economic Benefits from Regional Investment in Arts Facilities: Theory and Application.” Journal of Cultural Economics, Vol. 6, no 1, p. 1–14.
Tobelem, J.M. 1998. “The Marketing Approach in Museum.” Museum Management and Curatorship, Vol. 16, no 4, p. 337–354.
Trimarchi, M. 1993. Economia e cultura: organizzazione e funzionamento delle istituzioni culturali. Milano: Franco Angeli.

19
Valentino P. A. 1992. L’immagine e la memoria. Indagine sulla struttura del museo in Italia e nel
mondo, Leonardo Periodici, Roma. Wilson Boyle 2004 “The Role of Partnership in the Delivery of Local Government Museum
Services: A Case Study from Northern Ireland.” The International Journal of Public Sector Management, Vol. 17, no 6/7, p.513.
Yorke, D.A., and R.R. Jones. 1984. "Marketing and Museums." European Journal of Marketing, Vol. 18, no 2, p. 90–99.
Zan, L. 1999. (eds) Conservazione e innovazione nei musei italiani. Management e processi di cambiamento. Milano: Etas Libri.
Zan L. 2000. “Accounting for Art: An Interesting Area of Research.” In Special section on the Scandinavian Journal of Management, L. Zan, A. Blackstorck, and G. Cerruti, Vol. 3, p. 335–347.

20
Appendix 1 The System Dynamics Model
Figure 2: The Stock and Flow Diagram: Museum M1
Source: author’s elaboration.

21
Figure 3: The Stock and Flow Diagram: Museum M2
Source: author’s elaboration

22
Figure 4: The Stock and Flow Diagram: Resources Allocation
Source: author’s elaboration