The Stock Selection and Performance of Buy-Side Analysts
37
The Stock Selection and Performance of Buy-Side Analysts The Harvard community has made this article openly available. Please share how this access benefits you. Your story matters Citation Groysberg, Boris, Paul M. Healy, George Serafeim, and Devin M. Shanthikumar. "The Stock Selection and Performance of Buy-Side Analysts." Management Science (forthcoming). Citable link http://nrs.harvard.edu/urn-3:HUL.InstRepos:9887634 Terms of Use This article was downloaded from Harvard University’s DASH repository, and is made available under the terms and conditions applicable to Open Access Policy Articles, as set forth at http:// nrs.harvard.edu/urn-3:HUL.InstRepos:dash.current.terms-of- use#OAP
Transcript of The Stock Selection and Performance of Buy-Side Analysts

The Stock Selection andPerformance of Buy-Side Analysts
The Harvard community has made thisarticle openly available. Please share howthis access benefits you. Your story matters
Citation Groysberg, Boris, Paul M. Healy, George Serafeim, and Devin M.Shanthikumar. "The Stock Selection and Performance of Buy-SideAnalysts." Management Science (forthcoming).
Citable link http://nrs.harvard.edu/urn-3:HUL.InstRepos:9887634
Terms of Use This article was downloaded from Harvard University’s DASHrepository, and is made available under the terms and conditionsapplicable to Open Access Policy Articles, as set forth at http://nrs.harvard.edu/urn-3:HUL.InstRepos:dash.current.terms-of-use#OAP

1
THE STOCK SELECTION AND PERFORMANCE OF BUY-SIDE ANALYSTS
Boris Groysberg, Paul Healy, George Serafeim Harvard Business School
and Devin Shanthikumar
University of California, Irvine
May 2012
Abstract:
Prior research on equity analysts focuses almost exclusively on those employed by sell-side investment banks and brokerage houses. Yet investment firms undertake their own buy-side research and their analysts face different stock selection and recommendation incentives than their sell-side peers. We examine the selection and performance of stocks recommended by analysts at a large investment firm relative to those of sell-side analysts from mid-1997 to 2004. We find that the buy-side firm’s analysts issue less optimistic recommendations for stocks with larger market capitalizations and lower return volatility than their sell-side peers, consistent with their facing fewer conflicts of interest and having a preference for liquid stocks. Tests with no controls for these effects indicate that annualized buy-side Strong Buy/Buy recommendations underperform those for sell-side peers by 5.9% using market-adjusted returns and by 3.8% using four-factor model abnormal returns. However, these findings are driven by differences in the stocks recommended and their market capitalization. After controlling for these selection effects, we find no difference in the performance of the buy- and sell-side analysts’ Strong Buy/Buy recommendations.
JEL classification: M41, G14, G29
Keywords: buy-side analysts, sell-side analysts, stock recommendations, recommendation
optimism, recommendation performance
This research was funded by the Division of Research at Harvard Business School. We are grateful for research assistance from Gui Yang, Sarah Eriksen and John Sheridan. We also wish to thank IBES, First Call and Reuters for analyst data, and especially the anonymous money management firm that provided us with its financial analysts’ reports. Finally, we are grateful to our editor, associated editor, two referees, Amy Hutton, Patricia O’Brien, Tom Lys, and to participants at seminars at Harvard Business School, Georgetown University, Bentley College, the AAA FARS 2006 conference, Morgan Stanley and Texas University for their helpful comments on the paper.

2
INTRODUCTION
During the last twenty years, there has been considerable research on the
performance of sell-side analysts who work for brokerage firms, investment banks and
independent research firms (Elgers, Lo, and Murray, 1995, Hilary and Menzly, 2006,
Kesavan, Gaur, and Raman, 2010).1 But because of data limitations, there has been very
little research on buy-side analysts—that is analysts working for institutional investors
such as mutual funds, pension funds, and hedge funds. Yet buy-side analysts are worthy
of study in their own right. In 2006, U.S. and U.K. investment firms spent $7.7 billion on
buy-side research versus $7.1 billion on sell-side research (see Tabb Group, 2006).
Further, as we discuss below, there are important differences between buy- and sell-side
analysts that are likely to affect their behavior and performance.
The limited research that is available on buy-side analysts employs a variety of
research designs to examine their value and reports mixed findings. Cheng, Liu, and Qian
(2006) find that portfolio managers rate research from the buy-side as almost three times
more important to their decision-making than that of the sell-side. Frey and Herbst (2012)
study buy-side analyst recommendations at a large global asset manager and find that
changes in buy-side stock recommendations are followed by increases in the fund’s
trading in those stocks. Groysberg, Healy and Chapman (2008) show that earnings
forecasts issued by buy-side analysts at a large investment firm are more biased and less
accurate than those for sell-side peers covering the same firms. Busse, Green and
Jegadeesh (2012) find that sell-side analysts’ stock upgrades and downgrades have larger
returns than buy and sell decisions of mutual fund portfolio managers for up to three
months.2
Resolving whether buy-side research creates value is important for scholars
interested in understanding how institutional factors and incentives affect research quality
and value, but it is also highly relevant to managers at buy-side firms who face the
1 See Schipper (1991) and Bradshaw (2011) for reviews of the findings of this research. 2 Busse, Green and Jegadeesh (2012) examine a similar question to ours. However, they study the performance of portfolio managers rather than buy-side analysts. They also limit the return holding period to three months or shorter, whereas we examine performance over the full investment cycle, from when a stock is recommended as a buy to when it is downgraded. Finally, they compare portfolio manager buy/sell decisions to sell-side analysts’ decisions to upgrade or downgrade a stock, whereas we compare buy recommendations for sell-side and buy-side analysts.

3
challenge of allocating limited research resources. In discussing this issue, the director of
equity research at a mid-sized money management firm observed:
[Given] our falling budget … one option is to allow the budget cuts to fall
primarily on sell-side research. In this course of action, we limit our access
to sell-side experts and company management. We receive fewer company
forecasts and less industry specific information. Given that we only have 6
analysts each covering about 80 stocks, we really need the sell-side to give
us granular information about companies. By cutting sell-side research, we
receive less qualitative/forward looking information. … However, so far
this is the option I have gone with.
We revisit the question of the value of buy-side research by examining returns to
recommendations issued by buy-side analysts at a large investment firm during the period
1997 to 2004. Their performance is benchmarked by recommendation returns for analysts
at 85 sell-side firms with recommendations available throughout the sample period. Our
research is well suited to test the value of buy-side research. Fifty percent of the bonus
awards for buy-side analysts at our sample firm are based on the performance of their
Strong Buy and Buy recommendations, the metric we analyze. In contrast, the buy-side
analysts receive no direct reward for issuing accurate earnings forecasts, potentially
explaining the earlier finding of their forecast inaccuracy. Recommendation performance
also appears to have had little direct relation to sell-side analysts’ bonus awards or job
mobility (see Groysberg, Healy and Maber, 2011, and Mikhail, Walther and Willis,
1999).
The importance of buy-side analyst recommendation performance for portfolio
managers is underscored by several advantages of buy-side recommendations over those
from the sell-side. The private information in buy-side recommendations is likely to
facilitate profitable trading by the firm’s portfolio managers, whereas sell-side
recommendations are publicly disclosed to many institutions, generating an immediate
stock price reaction (see Stickel, 1995 and Womack, 1996) and reducing some of the
investment value of the recommendation. In addition, buy-side analysts are not subject to
sell-side conflicts of interest from investment banking and brokerage businesses, and
from concerns about preserving access to corporate managers. Evidence from prior

4
studies suggests that these conflicts of interest reduce the performance of sell-side
analysts’ stock recommendations.3
Despite these advantages, buy-side recommendations also have potential
limitations. Interviews with managers at buy- and sell-side firms indicate that buy-side
analysts typically cover more stocks than sell-side analysts, presumably reducing the
depth and value of their analysis on any given stock. During the sample period, the buy-
side firm employs 46 analysts who on average each recommend 17 stocks. In contrast,
the average sell-side firm employs 86 analysts who each issue recommendations for 12
stocks. In addition, prior research suggests that investment firms tend to invest in stocks
with low return volatility (Sirri and Tufano, 1998) and high liquidity (see Falkenstein,
1996, Chen, Hong, Huang, and Kubik 2004). By limiting their attention to these types of
stocks, buy-side analysts may lower their recommendation returns.
Our findings indicate that the buy-side firm’s analysts issue recommendations for
companies with larger market capitalizations and lower stock return volatility than typical
sell-side firms. Consistent with sell-side analysts having incentives to issue more positive
recommendations to support their investment banking or brokerage business, or to
preserve access to information from corporate managers, 44% of the buy-side analysts’
recommendations are Strong Buy or Buy ratings, versus 56% for sell-side analysts listed
on IBES. Fourteen percent of the buy-side analyst recommendations are rated
Underperform or Sell, compared to 7% for sell-side analysts.
Returns generated by the buy- and sell-side analysts’ stock recommendations
depend critically on controls for differences in the types of firms covered. Market-
adjusted and four-factor model abnormal returns from investing in Strong Buy/Buy
recommendations are consistently lower for the buy-side firm than for sell-side firms.
The annual market-adjusted returns from investing in the buy-side firm’s buy
recommendations are 2.3% versus 8.2% for the average sell-side firm. This difference is
partially explained by risk factors such as firm size, growth, momentum, and market risk.
3 Michaely and Womack (1999) and Barber, Lehavy and Trueman (2007) find that analysts with investment banking conflicts have less profitable recommendations than those with no such conflicts. Ertimur, Sunder and Sunder (2007) show that the translation of more accurate earnings forecasts into profitable recommendation returns holds only for non-conflicted analysts. In contrast, McNichols, O’Brien and Pamukcu (2006) find no evidence of lower returns for recommendations for sell-side analysts with conflicts of interest.

5
The average sell-side firm’s recommendations are tilted towards smaller firms, whereas
stocks recommended by the buy-side firm are size neutral. However, even after
controlling for these factors, abnormal returns are 2.3% for the buy-side firm and 6.1%
for the average sell-side firm. This under-performance holds for seven of the eight sample
years.
However, the under-performance of the buy-side firm’s analysts appears to be
largely attributable to differences in the stocks they select. After controlling for
differences in the market capitalization of companies covered by analysts at the buy-side
firm and their peers, the out-performance of sell-side Strong Buy/Buy recommendations
disappears. The impact of stock selection on recommendation performance is reinforced
by market-adjusted and abnormal returns for Strong Buy/Buy recommendations issued
exclusively by sell-side analysts. The returns for these stocks are sizeable, particularly
those for small cap stocks, which are likely to demand additional capital and therefore
attract sell-side coverage. In contrast, Strong Buy/Buy recommendation returns for
companies covered by both buy- and sell-side analysts are modest and comparable.
Additional tests examine several other potential explanations for the findings.
First, by comparing the performance of 27 analysts that the buy-side firm hires from the
sell-side, we can control for differences in analyst skill. We find no evidence that buy-
side analysts have different skills than their sell-side peers. Second, to address concerns
that our study uses data for only one buy-side firm, limiting the generality of our
findings, we use a survey to collect additional recommendations from a broader sample
of sell-side and buy-side analysts. The results confirm those reported for the sample firm.
Controlling for company selection, there is no significant difference in Strong Buy/Buy
recommendation returns for buy- and sell-side analysts responding to the survey.

6
SAMPLE, DATA, AND TESTS
Sample and Data
Our buy-side recommendations are for analysts at a large money management
firm for whom fundamental research is an important part of the stock selection process.
During the sample period, July 1997 to December 2004, bonus awards for analysts at the
firm are based on two factors: market-adjusted returns generated from their Strong Buy
and Buy recommendations (with a 50% weighting) and ratings from the firm’s portfolio
managers (comprising the remaining 50% weighting). In addition, the firm’s top-rated
analysts have long-term career opportunities within the research department and typically
do not move into portfolio management.4
The buy-side firm is consistently ranked as one of the ten leading firms in
Reuters and Institutional Investor annual ratings of US fund management groups.
Morningstar ratings of the firm’s equity fund performance (without regard to fund style)
rank it above average versus the funds of other top ten firms for one-, three-, and five-
year horizons. The mean annual market-adjusted return for the firm’s large-cap equity
funds (which are the most intensive users of its analyst reports) during the sample period
exceeds 2.5%. Given these findings, the sample firm appears to be a strong performer. 5
From analyst reports provided by the sample buy-side firm, we collect stock
recommendations issued and the recommendation dates for each stock covered. As
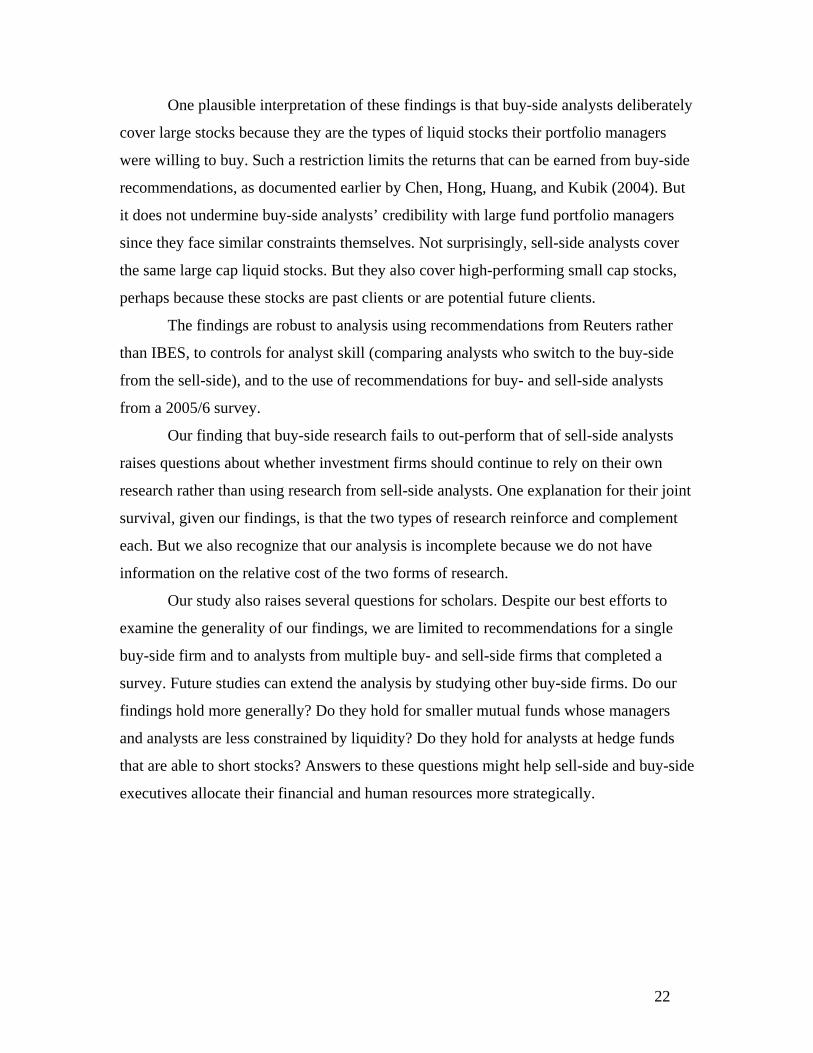
reported in table 1, our sample comprises all 2,013 recommendations (for 567 different
stocks) issued by the 46 analysts employed by the firm in the sample period (July 1997 to
December 2004), an average of 34 analysts per year.
We collect similar recommendation data for sell-side analysts from Thomson’s
IBES. Since the buy-side firm survives throughout the sample period, our tests of buy-
side performance are subject to survivorship bias. In an attempt to control for any such
bias, we require each sell-side firm to issue a minimum of five recommendations per
4 To assess whether our sample firm is comparable to other large money management firms, we also interview buy-side analysts and research directors at competitor firms. Their descriptions of their research businesses, as well as the ways they reviewed and rewarded buy-side analysts are very similar to that reported for our sample firm, increasing our confidence that it is not an outlier. 5 Malkiel (1995) reports that equity mutual funds underperform the S&P 500 on average by 1.83% from 1982 to 1991. Wermers (2000) finds that equity mutual funds outperform the S&P 500 by 1.5% from 1975 to 1994. Both estimates are lower than the average market adjusted performance of the funds of the buy side firm in our sample.

7
calendar year throughout the sample period, implying that the sell-side sample also
comprises firms with survival bias. This restriction eliminates 92,876 recommendations
and 542 firms from the final sample. As reported in table 1, the final sell-side sample
includes 85 firms that issued 173,414 recommendations. The average sell-side firm
employs a total of 86 senior analysts during the sample period (an average of 60 per year)
who issue 2,064 recommendations for 671 stocks.
Stock Selection Tests
Prior research suggests that there are likely to be important differences in the
number and type of stocks selected for coverage by buy- and sell-side analysts that could
affect recommendation performance. We examine several such factors:
1. Firm Scale and Scope of Coverage. As discussed above, given differences in research
scale, buy-side firms typically employ fewer analysts than sell-side firms and expect their
analysts to cover many more stocks. Clement (1999) argues that analysts who cover a
larger number of firms face greater task complexity and are able to devote less time to
any particular stock, affecting the quality of their recommendations. Clement also argues
that firms that employ more analysts are able to take advantage of economies of scale and
provide their analysts with more resources. To examine these factors, we compute the
average number of stocks recommended per analyst at each sample firm (NRECS) and
the number of analysts employed by the firm (NANL) over the sample period.
2. Return Volatility of Recommended Stocks. Sirri and Tufano (1998) find that fund flows
and, therefore, the asset base upon which buy-side firms charge management fees,
decrease as the volatility of fund returns increases. As a result, portfolio managers are
likely to encourage their buy-side analysts to cover and recommend stocks with relatively
low daily portfolio return volatility. Since portfolio managers’ are typically evaluated for
out-performing size and risk benchmark portfolios, they are expected to be particularly
averse to stocks with high abnormal volatility since risks for these stocks are less likely to
be reflected in benchmark performance. To examine whether there are differences in the
volatility of stocks recommended by the buy- and sell-side analysts we therefore compute
the standard deviation of four-factor model daily abnormal returns for buy
recommendations at each sample firm during the sample period (SVOL).

8
3. Liquidity of Stocks Recommended. Falkenstein (1996) reports that money managers
prefer to invest in liquid stocks, presumably to enable their relatively large positions to be
unloaded with minimal impact on price. Consistent with this finding, Chen, Hong,
Huang, and Kubik (2004) show that stock illiquidity plays an important role in explaining
the performance of large mutual funds. Liquidity is also important for the performance of
sell-side recommendations. Barber, Lehavy, McNichols and Trueman (2001), Jagadeesh
and Kim (2006), and Barber, Lehavy and Trueman (2007) find that abnormal returns to
sell-side buy recommendations are higher for stocks with low market capitalizations,
which tend to be less liquid. To compare the liquidity of stock recommendations issued
by buy- and sell-side analysts, we compute the average daily stock turnover and the
average market capitalization of the recommended stocks for each sample firm.6 Daily
turnover (STURN) is the average number of shares traded per day as a percentage of
shares outstanding throughout the sample period. Market capitalization (MCAP) is the
average market capitalization of stocks recommended by a given sample firm over the
sample period.
4. Conflicts of Interest. Prior research indicates that sell-side analysts face conflicts of
interest arising from investment banking or brokerage businesses. Analysts working for
investment banks are expected to cover stocks of banking clients and face pressure to
issue positive recommendations for such firms (see Lin and McNichols, 1998, Michaely
and Womack, 1999, Dechow, Hutton and Sloan, 2000, and Lin, McNichols and O’Brien,
2005).7 In addition, sell-side analysts issue optimistic recommendations to encourage
clients to purchase stocks and generate brokerage commissions (see Cowen, Groysberg
and Healy, 2006). Analysts at the sample buy-side firm face no such pressures. The
potential impact of these banking and brokerage incentives on analysts’ stock
recommendation performance, however, is unclear. If they resulted in sell-side analysts
issuing upwardly biased recommendations, the sell-side was likely to underperform the
buy-side. Alternatively, banking relations could have enabled sell-side analysts to have 6 Given the preference of buy-side firms for liquid stocks, sell-side analysts are also likely to prefer to cover liquid stocks. However, they may also choose to cover less liquid stocks that are past or potential future banking clients, or that are considered attractive investments for retail clients and hedge funds. 7 The Global Settlement of March 2003 attempted to eliminate this conflict by prohibiting investment bankers from playing a direct role in awarding bonuses to sell-side analysts, from having analysts assist them in investment banking activities, and by requiring that meetings between investment bankers and sell-side analysts be supervised.

9
access to superior information on clients, enabling their recommendations to show
relatively strong performance. Barber, Lehavy, McNichols and Trueman (2006) find that
buy recommendation return performance is higher for firms where analysts issue a lower
percentage of buy recommendations. To examine the effect of overall optimism due to
conflicts of interest on stock recommendations, we compute the frequencies of Strong
Buy/Buy, Hold, and Underperform/Sell stock recommendations for the buy- and sell-side
samples. We aggregate Strong Buy and Buy recommendations into a single category since
the buy-side firm does not distinguish between these recommendations for computing its
analysts’ bonus awards. We also aggregate Underperform and Sell recommendations
given the small number of such recommendations.
Return Tests
Our tests of the stock performance of the buy-side firm’s recommendations focus
primarily on its analysts’ Strong Buy and Buy recommendations.8 Given their use in buy-
side analyst compensation, these recommendations are expected to be most important for
both the firm and its analysts and therefore provide a powerful test of the value of their
research.9 To construct our returns, a stock rated as a Strong Buy or Buy is bought and
held from the trading day after its initial Strong Buy/Buy recommendation until the
trading day after it is downgraded to a Hold, Underperform or Sell (if it continues to be
covered) or, if coverage is discontinued, for 250 trading days (the typical horizon of
analysts’ recommendations). We delay purchasing or selling a stock until the trading day
after a recommendation changed to ensure that investors have access to the new
recommendation and can modify their portfolios. The results therefore exclude any
announcement day returns for recommendation changes, which likely leads us to
understate the returns to sell-side recommendations given prior evidence that changes in
their recommendations had an immediate effect on stock prices (see Stickel, 1995 and
Womack, 1996). However, we believe that this delay in executing a trade is necessary to
8 In interviews, buy-side analysts who had worked on the sell-side inform us that their recommendations are comparable to those issued by sell-side analysts. 9 One explanation for the firm’s focus on buy recommendations is that it is a long-only firm and is precluded from short positions. Of course, even long-only firms eventually liquidate their positions, so that sell recommendations have some value. In follow-up tests we also examine the value of hold and sell recommendations.

10
allow portfolio managers to have sufficient time to adopt the buy-side
recommendations.10
Returns are estimated for portfolios of Strong Buy/Buy stocks for each buy-side
and sell-side firm. Our analysis uses returns for firms rather than analysts because we are
concerned about potential dependencies in recommendation behavior and returns for
analysts at the same firm. This could arise if macro research at a given firm takes a
particular position on market prospects that affects recommendations and returns for all
analysts at the firm. Firm portfolio returns control for such dependencies.11
We compute the daily return for each sample buy- and sell-side firm (Rjt) as
follows:
∑
∑
where Rit is the daily return on a stock, xijt takes the value one if the stock is
recommended as a Strong Buy or Buy on day t-1 by an analyst at firm j, and nt is the
number of recommended stocks on day t. We update the portfolio for each firm daily to
add newly upgraded stocks and delete stocks that are downgraded or dropped. This
generates a time series of daily buy recommendation returns for each buy/sell-side firm.
To control for market and risk effects that drive stock returns, we compute daily
market-adjusted returns, the metric used by the buy-side firm to evaluate analyst
performance, and abnormal returns for each firm. Daily market-adjusted returns are the
difference between the buy recommendation return for each firm less the return on the
value-weighted S&P 500 market index. We annualize the sample period average daily
market-adjusted return for each firm, assuming a 250-trading day year.
The second return metric, abnormal returns, controls for risk and other factors
known to be associated with stock performance using the four-factor model developed by
Carhart (1997):
10 Including the announcement day returns increases the returns to sell-side Strong Buy/Buy recommendations, but it does not change the inferences in the paper. 11 Our approach is similar to Barber, Lehavy and Trueman (2007), who compare the stock recommendation performance of investment banks and independent research firms. To assess whether our results are sensitive to using firm returns rather than analyst returns, we re-estimate our tests using the Barber, Lehavy, McNichols and Trueman (2003) approach. The findings are similar to those reported in the paper.

11
Rjt – Rft = j + j(Rmt – Rft) + sjSMBt + hjHMLt + wjWMLt + jt
Rjt is the daily buy recommendation return for firm j; Rft is the daily risk-free return; Rmt is
the daily return on the value-weighted market index; SMBt is the daily difference in
return for a value-weighted portfolio of small stocks over a similar portfolio of large
stocks; HMLt is the daily difference in return for a value-weighted portfolio of high book-
to-market stocks and a similar portfolio of low book-to-market stocks; and WMLt is the
daily return on a value-weighted portfolio of stocks with high recent returns and a similar
portfolio with low recent returns. The slope coefficients from this model represent risk
factors for each firm-strategy portfolio, and the intercept is the average daily abnormal
return. Average daily abnormal returns are annualized assuming 250-trading days per
year.
To compare the performance of buy- and sell-side firms, we estimate the
following model:
Rma,j or j = + BUYSIDEj + j
Rma,j and j are the average annual market-adjusted and annualized average abnormal
buy recommendation returns for firm j, and BUYSIDEj is an indicator variable that takes
the value one for the buy-side firm and zero otherwise. The coefficient () on this
variable indicates whether the market-adjusted or abnormal return for the buy-side firm is
different from those for sell-side firms. The t-statistic on this estimate is used to infer
whether there is a statistically significant difference in returns for the buy-side firms
relative to its sell-side peers.
RESULTS
Stock Selection
Table 2 compares variables we hypothesize to be related to stock selection for
buy- and sell-side analysts. On average, analysts at the buy-side firm issue
recommendations for 17 stocks during a calendar year versus 12 for the average sell-side
analyst. The difference is statistically reliable, suggesting that the buy-side firm’s
analysts cover more stocks than their sell-side peers, potentially reducing the quality of

12
their recommendations. We find no significant difference in the total number of analysts
at the sample buy-side firm during the sample period (46) versus the average sell-side
firm (86), reflecting the large standard deviation for the number of analysts employed per
firm.
There is also evidence that buy-side analysts recommend less volatile and larger
market capitalization stocks than their sell-side peers. The average daily standard
deviation of abnormal returns for buy-rated stocks is 0.42% for the buy-side and 0.95%
for the average sell-side firm. This difference is highly statistically reliable and implies
that the stocks recommended by buy-side analysts have lower daily return volatility,
consistent with portfolio managers encouraging buy-side analysts to cover and
recommend low volatility stocks to facilitate managing funds flow and management fees
(see Sirri and Tufano, 1998). In addition, stocks recommended by the buy-side firm
analysts have an average market capitalization that is almost seven times larger than the
average sell-side recommendation ($9.1 billion versus $1.3 billion). This difference is
both economically and statistically significant. We find no significant difference in daily
turnover for buy- and sell-side recommendations.
Table 3 provides evidence on the impact of conflicts of interest on analysts’ stock
recommendations. The buy-side firm analysts issue fewer Strong Buy/Buy
recommendations and more Hold and Underperform/Sell recommendations than their
sell-side counterparts during the sample period. Forty-four percent of the
recommendations issued by the buy-side firm’s analysts are Strong Buy or Buy, compared
to 56% for sell-side analysts. In contrast, 14% of buy-side analyst recommendations are
Underperform/Sell, versus 7% for sell-side analysts. A Chi-Squared test indicates that
these frequencies are significantly different. The findings are consistent with sell-side
analysts issuing upward biased recommendations or truncating their recommendations as
a result of conflicts of interest.12
12 To explore whether the Global Research Settlement affected the relative optimism of sell-side analysts’ recommendations, we also estimate changes in sell- and buy-side analysts’ average ratings around the regulatory change. We find that both sell-side and the buy-side firms become less optimistic after the Global Settlement. We find no evidence of any incremental change for sell-side firms, but interpret these findings with caution given the turbulent market conditions at the time.

13
Strong Buy/Buy Recommendation Performance
Table 4 reports returns for all Strong Buy/Buy recommendations for the buy-side
firm and its sell-side counterparts during the sample period. Analysts at the buy-side firm
generate an annualized market-adjusted return of 2.3% that is statistically insignificant. In
contrast, the average annualized market-adjusted return for sell-side firms is 8.2%,
significantly different from zero and reliably higher than the buy-side firm return by
5.9%. These findings are not attributable to a few high performing sell-side firms. The
median sell-side annualized market-adjusted return during the sample period is 7.4%,
more than three times the buy-side firm return. The buy-side firm’s market-adjusted
Strong Buy/Buy recommendation return ranks at the 88th percentile relative to sell-side
peers.
Four-factor abnormal returns are also reported in table 4 along with estimated
factor loadings. The loading on the size factor for the buy-side firm is 0.12 compared to
an average loading of 0.64 for the sell-side firms, implying that sell-side firms’
recommendations are tilted towards small firms whereas the buy-side firm
recommendations are almost size neutral. Other loading differences are insignificant.
After controlling for these factor differences, we find that the relative out-
performance of sell-side recommendations declines but continues to be economically and
statistically significant. The annualized abnormal return for the buy-side firm is 2.3%,
and statistically insignificant. In contrast, the average sell-side firm annualized abnormal
return is 6.1%, significantly different from zero and significantly greater than that for the
buy-side firm.13 The median sell-side firm’s abnormal return is 5.3%, also significantly
higher than the buy-side firm’s return. The buy-side firm’s Strong Buy/Buy
recommendation abnormal return ranks at the 76th percentile relative to sell-side firms.
For completeness, table 4 also reports separate findings for Strong Buy and Buy
recommendations. The estimates indicate that differences in recommendation returns for
buy and sell-side analysts are large and typically statistically reliable for both categories.
13 Prior research also finds evidence of economically and statistically significant returns to sell-side analysts recommendations (see Barber, Lehavy, McNichols and Trueman (2001), Barber, Lehavy, McNichols and Trueman (2003), Jegadeesh, Kim, Krishche and Lee (2004), Li (2005), Barber, Lehavy, McNichols and Trueman (2006), Jegadeesh and Kim (2006), Barber, Lehavy and Trueman (2007)). However, the returns reported in our study should be interpreted with caution due to the survival bias for both the buy- and sell-side firms.

14
For Strong Buys, annual market-adjusted returns are 3.6% for analysts at the buy-side
firm and 8.9% for their sell-side peers. Abnormal returns that adjust for four-factor risks
are 3.4% for the buy-side firm’s analysts and 6.4% for their sell-side peers. For Buy
recommendations, mean market-adjusted returns are 1.1% and insignificant for the buy-
side and 6.6% (statistically reliable) for sell-side analysts. Abnormal returns are 1.0% for
the buy side (insignificant) and 4.9% (significant) for the sell-side.
The sample period covers a wide range of market conditions, including the bull
technology market of the late 1990s and the crash in technology stocks in 2000 and 2001.
To examine the sensitivity of our findings to differing market conditions, we replicate our
tests for each sample year. The findings, reported in table 5, show that annualized
market-adjusted Strong Buy/Buy recommendation returns are lower for the buy-side firm
than for the average sell-side firm in seven of the eight sample years (except in 1998).
Given the small sample size (eight yearly observations), we used a nonparametric
statistic, the Wilcoxon Signed Ranks Test, to assess whether this pattern is statistically
reliable.14 For market-adjusted returns the test has a p-value of 0.042. Annual results for
the buy-side firm percentile rank relative to sell-side firms tell a similar story. From 1997
to 2004 the buy-side firm underperforms the median sell-side firm in six out of eight
years and the Wilcoxon Signed Ranks Test has a p-value of 0.064.
Abnormal Strong Buy/Buy recommendation returns for the buy-side firm are also
lower than the sell-side firm mean in seven of the eight years (all but 2002). The
Wilcoxon Signed Rank Test p-value is 0.039. Percentile ranks of the buy-side firm’s
annual abnormal returns show that the buy-side firm outperforms the median sell-side
firm for only one year. The Wilcoxon Signed Rank Test of differences in percentile ranks
yields a p-value of 0.055, marginally significant.
In summary, during the sample period, Strong Buy/Buy recommendations for the
average sell-side firm generate higher returns than those for the buy-side firm. This
difference is both statistically and economically significant. Results of annual
performance differences indicate that the sell-side returns beat those of the buy-side firm
in six or seven of the eight sample years.
14 The Wilcoxon Signed Ranks Test uses information about both the magnitude and sign of differences to infer statistical significance.

15
Hold and Sell Recommendation Performance
We also report findings for Hold and Underperform/Sell ratings. The test design
is similar to that discussed for combined Strong Buy/Buy recommendations. However, the
sell-side firm sample size declines for Hold and Underperform/Sell recommendation
tests, since only 64 of the 85 firms issue five or more Hold recommendations per year,
and only 11 issue five or more Underperform/Sell recommendations.
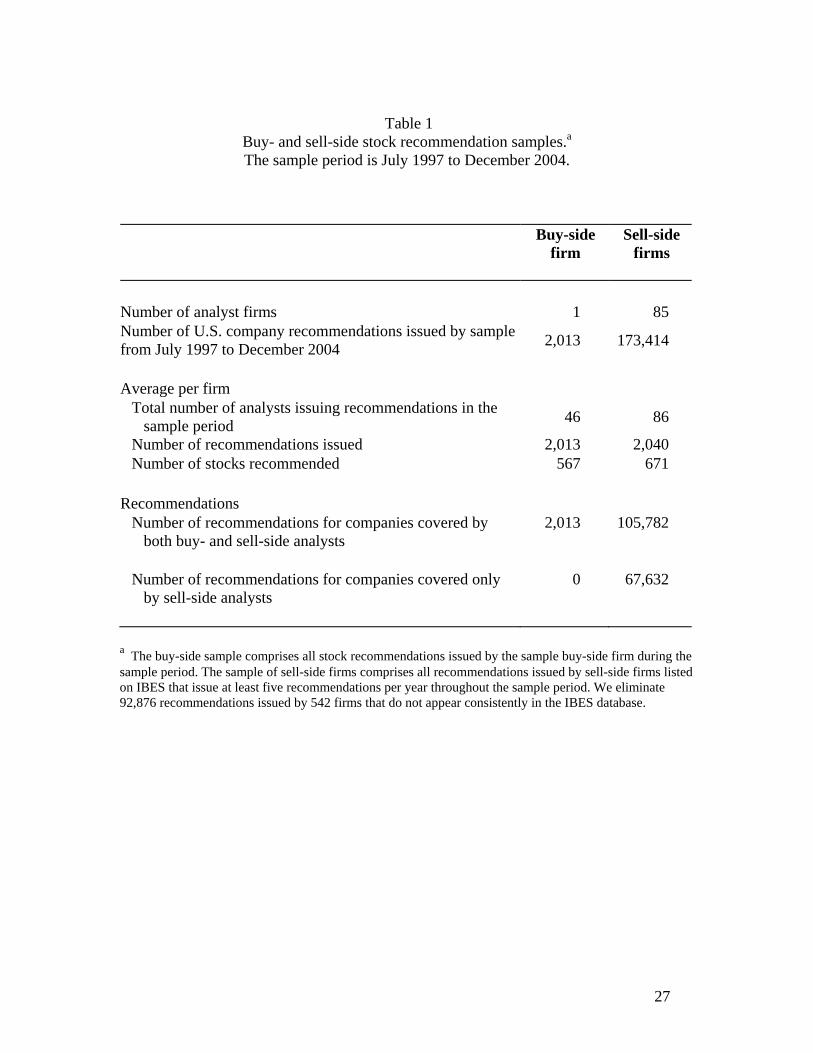
The results are reported in table 6. There is little difference in returns to Hold
recommendations for the buy- and sell-side firms. Annualized market-adjusted returns
are 5.7% for the buy-side firm and 5.8% for the average sell-side firm. Abnormal returns
are 6.0% for the buy-side firm and 4.8% for the average sell-side firm. For the mean and
median sell-side firm, the Hold recommendation returns are marginally lower than those
reported for Strong Buy/Buy recommendations in table 4. Both market-adjusted and
abnormal returns are insignificant though, highlighting the unreliable profitability of hold
recommendations. However, the buy-side firm returns for Hold recommendations are
actually higher than those reported as Strong Buy/Buy and are statistically reliable.15
For Underperform/Sell recommendations, the average market-adjusted and
abnormal returns for buy-side analysts’ Underperform/Sell recommendations are -1.3%
and -1.1% respectively, both statistically insignificant and no different from those for the
average sell-side firm.16
Stock Selection and Buy Recommendation Performance
To understand whether differences in factors predicted to affect stock selection
are related to the superior buy recommendation returns for sell-side analysts, we estimate
the following regression model:
15 The superior performance of Hold returns over those for Strong Buy/Buy recommendations for buy-side analysts is inconsistent with the pattern for sell-side analysts reported in this study and in prior research (see for example, Barber, Lehavy, McNichols and Trueman, 2001, p. 534). 16 These findings exclude two influential observations for financially distressed companies with stock prices less than $1 that showed large percentage (but modest monetary) gains in value during the recommendation period. If these observations are included, the annualized market-adjusted and abnormal returns from buy-side Underperform/Sell ratings are 13.0% and 9.5% respectively, significantly greater than the -2.5% and -1.1% for the average sell-side firm.

16
j = 0 + 1BUYSIDEj + 2NRECSj + 3NANLj + 4SVOLj + 5STURNj + 6MCAPj +
7RECj + j
is the average four-factor model abnormal return to Strong Buy/Buy recommendations
issued by analysts at a given firm. BUYSIDE is an indicator variable that takes the value
one for the buy-side firm and zero otherwise. REC is an indicator variable that takes the
value 1 for strong buy recommendations, 2 for buys, 3 for holds, etc., and is constructed
to control for differences in recommendation optimism. The remaining variables are
defined above. The model is estimated using time-series averages of the dependent and
independent variables for each firm to allow for dependencies in the variables within
firms. Since is an estimate from a first-stage regression, we adjust the standard errors in
the second stage model by taking account of measurement error and the loss of degrees of
freedom using the approach proposed by Murphy and Topel (1985).
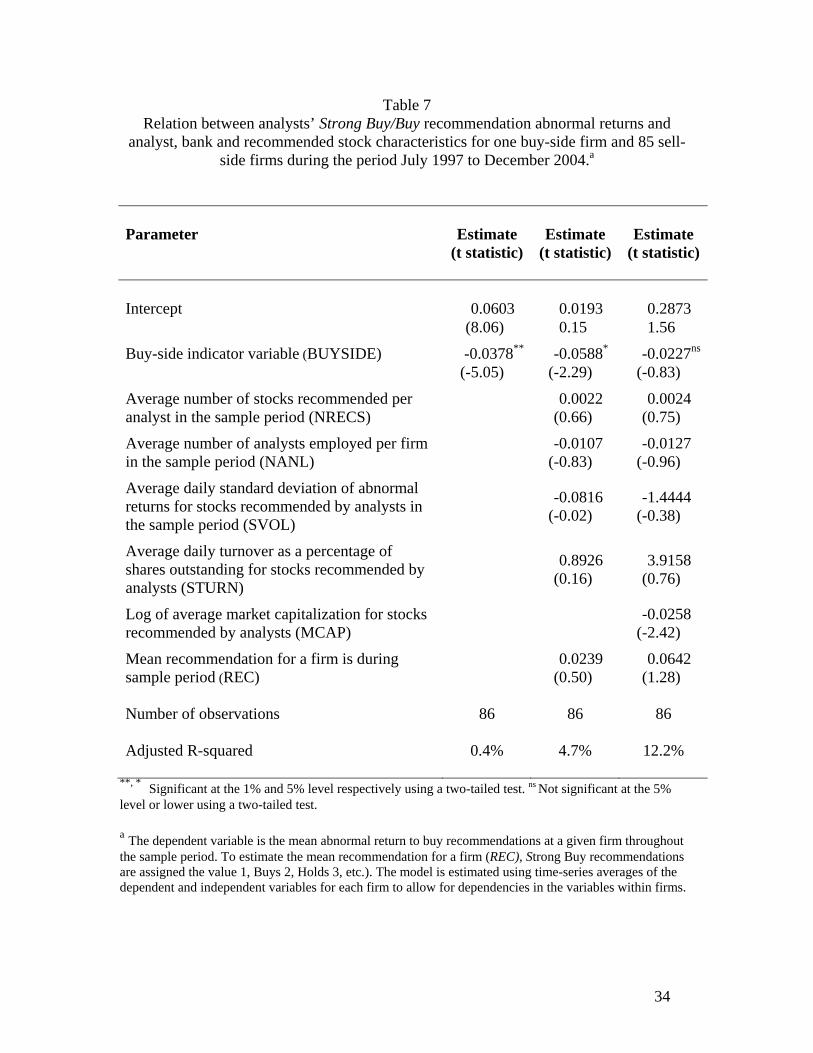
The regression results are reported in table 7. The first model includes a single
independent variable, the buy-side indicator variable. The estimated coefficient of 3.8%
is statistically significant, as reported in table 4. The second model includes all the
remaining variables except for average market capitalization of stocks recommended.
None of the added variables is statistically significant. The estimate for the buy-side
variable continues to be positive and statistically reliable, indicating that scope of
coverage, stock volatility, and stock turnover do not explain the strong performance of
sell-side analysts.
However, in the third model, where we add the portfolio market capitalization
variable, the estimated capitalization coefficient is -0.026 and significant, implying that
firms’ buy recommendation returns decline when the recommended stocks have large
market caps. In addition, the estimated indicator for the buy-side firm declines by 40%,
from 3.8% in the first model to 2.3% and becomes statistically insignificant.
To further evaluate the impact of stock selection on recommendation
performance, we estimate market-adjusted and abnormal returns for Strong Buy/Buy
recommendations for four subsets of companies: (i) those with recommendations issued
by both buy- and sell-side analysts; (ii) those where the only recommendations are issued
by sell-side analysts; (iii) those with large market capitalizations where the only
recommendations are issued by sell-side analysts; and (iv) those with small market

17
capitalizations where the only recommendations are issued by sell-side analysts. Firms
are classified as having small (large) market caps if their average capitalization is lower
than or equal to (higher than) the median firm recommended by sell-side firms.
The findings are reported in table 8. For companies with recommendations issued
by both buy- and sell-side analysts, the mean market-adjusted returns for Strong Buy/Buy
recommendations are 2.3% for buy-side analysts and 3.2% for their sell-side peers. Four-
factor abnormal returns for the same portfolios are 2.3% and 3.05% respectively. For
both metrics, tests of differences in means are insignificant. In contrast, mean market-
adjusted (10.2%) and abnormal (8.1%) returns for Strong Buy/Buy recommendations
issued for companies covered only by the sell-side are economically and statistically
significant. These findings suggest that much of the outperformance of sell-side analysts
comes from their selecting stocks not recommended by buy-side peers.
Classifying recommendations for companies covered only by sell-side analysts
into those for small and large companies reinforces the above findings and indicates that
the superior performance of sell-side analysts Strong Buy/Buy recommendations
emanates largely from their exclusive coverage of small companies. The mean market-
adjusted return to sell-side analysts’ Strong Buy/Buy recommendations for small stocks
not covered by the buy-side is 12.3% versus 5.5% for large stock recommendations.
Mean abnormal returns for these two portfolios are 11.7% and 4.7% respectively. A
difference in means test indicates that the small versus large company differences are
statistically as well as economically significant for both metrics.
In summary, much of the under-performance of buy-side analysts’ Strong
Buy/Buy recommendations comes from differences in stock selection. Both buy- and sell-
side analysts cover large stocks that presumably offer the liquidity demanded by the
firm’s portfolio managers. But sell-side analysts also recommend smaller stocks, perhaps
because these companies are active in raising new capital and are therefore actual or
potential investment banking clients. The high returns from these recommendations boost
sell-side analysts’ recommendation returns and fully explain their superior performance.

18
Additional Tests
(1) Returns Using Reuters’ Recommendations. Recent evidence by Ljungqvist, Malloy
and Marston (2008) raises questions about the integrity of sell-side recommendation data
reported on IBES. Ljungqvist et. al. (2008) report evidence of changes in
recommendations on the historical IBES database between 2002 and 2004. These include
additions of new recommendations, deletions of prior recommendations, removal of the
analyst identifier codes for some recommendations, and changes in some actual
recommendations. As a result, they report that abnormal returns to 2002 sell-side buy
recommendations increase from 5.9% using the 2002 database to 8.1% using the
modified 2004 version. Some of the changes are corrections of data errors but others
appear to be changes by analysts (who self-reported their recommendations) to conceal
poor performing recommendations, a potential cause for concern in interpreting our
findings.17
To examine whether this potential bias explains the strong performance of sell-
side analysts in our tests, we re-estimate sell-side Buy recommendation returns using data
from Reuters. To the best of our knowledge, Reuters database is not updated by analysts
and is therefore less likely to be subject to bias introduced by analyst “corrections.” The
Reuters sample is 56 sell-side firms that satisfy the data requirements discussed in section
2. These firms are somewhat larger than the IBES sample firm. On average each firm in
the Reuters sample employs 94 analysts, and issues 3,837 recommendations per year for
833 different stocks. In contrast, the average IBES sample firm employs 86 analysts and
issues 2,064 recommendations per year for 671 different stocks. Nonetheless, results
using the Reuters database are very similar in magnitude and statistical reliability to those
reported above for the IBES sample. The average (median) market-adjusted return for
sell-side firms is 8.1% (7.4%) and the average (median) abnormal return is 6.2% (6.1%).
(2) Differences in Buy- and Sell-Side Analyst Skill. Another competing explanation for
our findings is that sell-side firms draw their analysts from a more talented labor pool
than did buy-side firms. Although this hypothesis does not explain why we find the
outperformance of sell side analysts to have been driven by their recommendations for
17 Since the Ljungqvist et. al. study, IBES has investigated its recommendation data and updated its database to correct for any observed errors. We use the updated IBES data for our primary tests.

19
small stocks. To make sure that our results are robust when we hold analyst skill
constant, we compare the performance of buy-side analysts who switch to or from the
sell-side during the sample period. Twenty-seven of the sample firm’s analysts work at
sell-side firms at some point during the sample period. We compare the average
performance of the stock recommendations for these analysts during their buy- and sell-
side employment. Since the analyst is held constant in the test, we effectively control for
any differences in analyst ability. Results are reported in Table 9.
The Strong Buy/Buy recommendations for these switching analysts generate mean
market-adjusted returns of 4.7% during their sell-side employment, and -2.0% during
their buy-side years. Comparable four-factor abnormal returns are 1.7% and -0.3%
respectively. Neither of the differences in market-adjusted or abnormal returns across the
two employment periods is statistically significant. When we impose the additional
restriction that each portfolio includes only stocks that the analyst recommends both
before and after the switch to the buy- or sell-side, we find that the market-adjusted and
abnormal return differences are even smaller. Specifically, the Strong Buy/Buy
recommendations for these switching analysts generate market-adjusted returns of 1.9%
during their sell-side employment, and -1.8% during their buy-side years. Four-factor
abnormal returns are 0.7% and -0.3% during the sell-side and buy-side years respectively.
(3) Generalizability. One limitation of our study is that our sample of buy-side analysts is
from a single firm, raising questions about whether the findings can be generalized to
other investment firms. Ideally, our tests would have used recommendation data from
analysts at multiple investment firms. But we do not have access to such data. However,
we are able to obtain recommendations for buy- and sell-side analysts from two surveys
we conducted in 2005 and 2006. The surveys request more than 5,000 analysts to provide
us anonymously with recommendations for three stocks that they cover from a list of S&P
500 companies in the industries they indicated they covered. We receive responses from
967 analysts, representing a 19% response rate. The sample includes 637 sell-side
analysts who issued 2,334 recommendations (1,202 Strong Buy/Buy), and 329 buy-side
analysts who provide 480 recommendations (282 Strong Buy/Buy) during the period
12/1/2005 to 3/7/2007.

20
There are several important differences between the survey recommendations and
those analyzed in the earlier tests. First, we observe the date that we receive a given
analyst’s survey recommendations, but not the date that those recommendations are
originally issued. Second, we do not have information on whether or when the survey
analysts subsequently revise their recommendations. As a result, we are obliged to modify
the trading strategy to estimate recommendation performance. For the Strong Buy/Buy
strategy we purchase stocks recommended as Strong Buys/Buys on the date we receive
the survey response and hold them for the next 250 trading days, the investment horizon
of analyst recommendations.
Given our limit on the companies covered by the survey, recommendations made
by both the buy- and sell-side samples are for large companies. The mean market cap of
stocks recommended by buy-side analysts is $30.7 billion versus $27.6 billion for those
recommended by the sell-side. The difference is insignificant, increasing our confidence
that the recommended stocks for the two subsamples have similar size/liquidity and that
the selection differences documented above are unlikely to be important for the survey
findings.
The average market-adjusted Strong Buy/Buy recommendation return for the
survey buy-side analysts is 1.4% versus 2.3% for the sell-side analysts. Mean four factor
abnormal returns are 3.2% for buy-side analysts and 3.0% for sell-side peers. None of
these means is individually significant, and the differences between the buy- and sell-side
samples are also insignificant.
In summary, the survey findings are consistent with those reported for the buy-
side firm and the size-adjusted sell-side sample, and indicate that after controlling for
stock selection, there is no significant difference in the performance of buy- and sell-side
analysts Strong Buy/Buy recommendations. However, we interpret these findings with
caution, as the surveys are subject to potential response bias and other limitations.
CONCLUSIONS
We examine buy recommendation performance for analysts at a large, buy-side
firm relative to analysts at sell-side firms covered by IBES throughout the sample period
(mid-1997 to 2004). We find that buy-side firm analysts recommend stocks with stock

21
return volatility roughly half that of average sell-side analysts’ recommended stocks
(0.42% versus 0.95%), and market capitalizations almost seven times larger ($9.1 billion
versus $1.3 billion). We interpret these findings as indicating that portfolio managers
(buy-side analysts’ clients) prefer that buy-side analysts cover less volatile and more
liquid stocks. Sell-side analysts cover these same firms, but also cover smaller less liquid
firms, perhaps because they are actual or potential investment banking clients.
In addition, we find that the buy-side firm analysts’ stock recommendations are
less optimistic than their sell-side counterparts’, consistent with buy-side analysts facing
fewer conflicts of interest. Forty-four percent of the recommendations issued by the buy-
side firm are Strong Buy or Buy ratings, versus 56% for analysts at sell-side firms. The
higher frequency of sell-side Strong Buy/Buy recommendations is offset by a lower
frequency of Underperform and Sell ratings (14% for the buy-side firm analysts versus
7% for analysts at sell-side firms).
Univariate tests of market-adjusted and abnormal returns from investing in Strong
Buy/Buy recommendations indicate that analysts at the buy-side firm consistently under-
perform their peers at the average sell-side firm. Annualized market-adjusted returns
from investing in the buy-side firm’s buy recommendations are 2.3%, compared to 8.2%
for sell-side firms. Abnormal buy recommendation returns for the buy-side firm are also
2.3%, versus a mean of 6.1% for sell-side firms. Relative to its sell-side peers, the buy-
side firm Buy recommendation returns rank in the lowest quartile. Finally, this pattern of
underperformance for the buy-side firm holds for six or seven of the eight sample years.
However, these results change once we control for the market capitalizations of
the firms recommended. Multivariate tests show a significant negative relation between
Strong Buy/Buy recommendation abnormal returns, even those that incorporate the size
factor, and the market capitalization of stocks recommended. After controlling for this
effect, we find no difference in the performance of Strong Buy/Buy recommendations for
the buy-side firm and its sell-side peers. Additional tests also show no difference in the
Strong Buy/Buy recommendation returns of stocks covered by both buy- and sell-side
analysts. In contrast, there are sizable abnormal returns for recommended stocks covered
only by sell-side analysts, particularly those with small market capitalizations.
22
One plausible interpretation of these findings is that buy-side analysts deliberately
cover large stocks because they are the types of liquid stocks their portfolio managers
were willing to buy. Such a restriction limits the returns that can be earned from buy-side
recommendations, as documented earlier by Chen, Hong, Huang, and Kubik (2004). But
it does not undermine buy-side analysts’ credibility with large fund portfolio managers
since they face similar constraints themselves. Not surprisingly, sell-side analysts cover
the same large cap liquid stocks. But they also cover high-performing small cap stocks,
perhaps because these stocks are past clients or are potential future clients.
The findings are robust to analysis using recommendations from Reuters rather
than IBES, to controls for analyst skill (comparing analysts who switch to the buy-side
from the sell-side), and to the use of recommendations for buy- and sell-side analysts
from a 2005/6 survey.
Our finding that buy-side research fails to out-perform that of sell-side analysts
raises questions about whether investment firms should continue to rely on their own
research rather than using research from sell-side analysts. One explanation for their joint
survival, given our findings, is that the two types of research reinforce and complement
each. But we also recognize that our analysis is incomplete because we do not have
information on the relative cost of the two forms of research.
Our study also raises several questions for scholars. Despite our best efforts to
examine the generality of our findings, we are limited to recommendations for a single
buy-side firm and to analysts from multiple buy- and sell-side firms that completed a
survey. Future studies can extend the analysis by studying other buy-side firms. Do our
findings hold more generally? Do they hold for smaller mutual funds whose managers
and analysts are less constrained by liquidity? Do they hold for analysts at hedge funds
that are able to short stocks? Answers to these questions might help sell-side and buy-side
executives allocate their financial and human resources more strategically.

23
References
Barber, B., R. Lehavy, M. McNichols, and B. Trueman, 2001, Can investors profit from the prophets? Consensus analyst recommendations and stock returns, Journal of Finance, 56: 2, 773-806.
Barber, B., R. Lehavy, M. McNichols, and B. Trueman, 2003, Prophets and losses:
Reassessing the returns to analysts’ recommendations, Financial Analyst Journal, 59: 2, 88-96.
Barber, B., R. Lehavy, M. McNichols, and B. Trueman, 2006, Buys, holds, and sells: The
distribution of investment banks' stock ratings and the implications for the profitability of analysts' recommendations,” Journal of Accounting and Economics, 41: 1-2, 87-117.
Barber, B., R. Lehavy and B. Trueman, 2007, Comparing the stock recommendation
performance of investment banks and independent research firms, Journal of Financial Economics 85, 490-517.
Bradshaw, M., 2004, How do analysts use their earnings forecasts in generating stock
recommendations? The Accounting Review 79, 25-50. Bradshaw, M., 2011, Analysts’ forecasts: What do we know after decades of work?
Working paper, Boston College. Busse, J., C. Green and N. Jegadeesh, 2012, Buy- side trades and sellside
recommendations: Interactions and information content, Journal of Financial Markets, 15, 207-232..
Carhart, M., 1997, On persistence in mutual fund performance. Journal of Finance, 52
(1), 57-82. Chen, J., H. Hong, M. Huang, and J. Kubik, 2004, Does fund size erode mutual fund
performance? The role of liquidity and organization. The American Economic Review 94: 5, 1276-1302
Chen, S. and D. Matsumoto, 2006, Favorable versus unfavorable recommendations: the impact on analyst access to management-provided information, Journal of Accounting Research, 44, 657-689.
Cheng, Y, M. H. Liu, and J. Qian. 2006, Buy-side analysts, sell-side analysts, and
investment decisions of money managers, Journal of Financial and Quantitative Analysis, 41, 51-83.
Clement, M., 1999, Analyst forecast accuracy: Do ability, resources, and portfolio
complexity matter? Journal of Accounting and Economics 27, 285-304.

24
Cowen, A., B. Groysberg, and P. Healy, 2006, Which types of analyst firms make more
optimistic forecasts? Journal of Accounting and Economics 41, 119-146. Dechow, P., A. Hutton, and R. Sloan, 2000, The relation between analysts' forecasts of
long-term earnings growth and stock price performance following equity offerings, Contemporary Accounting Research 17, 1-32.
Dugar, A. and S. Nathan, 1995, The effect of investment banking relationships on
financial analysts’ earnings forecasts and investment recommendations, Contemporary Accounting Research, 12:1, 131-160.
Elgers, P., May H. Lo, and Dennis Murray, 1995. Note on adjustments to analysts’
earnings forecasts based on systematic cross-sectional components of prior-period errors, Management Science, 41: 8, 1392-1396.
Ertimur, Y., J. Sunder and S.V. Sunder, 2007, Measure for measure: the relation between
forecast accuracy and recommendation profitability of analysts, Journal of Accounting Research, 45, 567-606.
Falkenstein, E.G., 1996, Preferences for stock characteristics as revealed by mutual fund
portfolio holdings, Journal of Finance 51, 111-135. Frey, S. and P. Herbst, 2012, The influence of buy-side analysts on mutual fund trading,
Working paper, Leibniz University Hannover and CFR Cologne and University of Stirling.
Groysberg, B., P. M. Healy, and C. J. Chapman, 2008, Buy-side vs. Sell-side Analysts’
Earnings Forecasts, Financial Analysts Journal 64, 25-39. Groysberg, B., P. M. Healy, and D. Maber, 2011, What Drives Sell-Side Analyst
Compensation at High-Status Banks? Journal of Accounting Research 49, no. 4 (2011): 969–1000.
Hilary G., and Lior Menzly, 2006. Does past success lead analysts to become
overconfident?, Management Science, 52: 4, 489-500. Jegadeesh, N., J. Kim, 2006, Value of analyst recommendations: International evidence,
Journal of Financial Markets, 9: 3, 274-309. Jegadeesh, N., J. Kim, S. D. Krische and C. M. C. Lee, 2004, Analyzing the analysts:
When do recommendations add value? Journal of Finance 59, 1083-1124. Kesavan, S., Vishal Gaur, and Ananth Raman, 2010. Do inventory and gross margin data
improve sales forecasts for U.S. public retailers?, Management Science, 56: 9, 1519–1533.

25
Li , X. 2005, The persistence of relative performance in stock recommendations of sell-
side analysts, Journal of Accounting and Economics, 40:1-3, 129-152. Lin, H. and M. McNichols, 1998, Underwriting relationships, analysts’ earnings forecasts
and investment recommendations, Journal of Accounting and Economics, 25:1, 101-127.
Lin, H. M. McNichols and P. O’Brien, 2005, Analyst impartiality and investment
banking relationships, Journal of Accounting Research, 43: 4, 623-650. Loh, R.K. and G.M. Mian, 2006, Do accurate earnings forecasts facilitate superior
investment recommendations? Journal of Financial Economics, 80, 455-483. Ljungqvist, A., C. Malloy and F. Marston, 2008, Rewriting History, Journal of Finance,
64, 1935-60. Malkiel, B. 1995, Returns from investing in equity mutual funds 1971 to 1991, Journal of
Finance, 50, 549-572. McNichols, M., P. O’Brien and O. Pamkcu, 2006, That ship has sailed: Unaffiliated
analysts’ recommendation performance for IPO firms, Working paper, University of Waterloo.
Michaely, R. and K. Womack, 1999 Conflicts of interest and the credibility of
underwriter analyst recommendations, The Review of Financial Studies 12, 653-686.
Mikhail, M. B., B. R. Walther, and R. H. Willis, 1999, Does forecast accuracy matter to
security analysts? The Accounting Review 74, 185-200. Murphy, K. and R. Topel, 1985, Estimation and inference in two-step econometric
models, Journal of Business and Economic Statistics, 3:4, 370-79. Schipper, K. 1991, Commentary on analysts’ forecasts, Accounting Horizons, 4, 105-121. Sirri, E. and P. Tufano, 1998. Costly search and mutual fund flows. Journal of Finance
53, 1589-1622. Stickel, S. E., 1995, The anatomy of the performance of buy and sell recommendations,
Financial Analysts Journal 51, 25-39. Tabb Group, 2006, The future of equity research: A 360 degree perspective. Wallace, J. S., 1997, Adopting residual income-based performance measures: Do you get
what you pay for? Journal of Accounting & Economics, 24: 3, 275-300.

26
Wermers, R. 2000, Mutual fund performance: an empirical decomposition into stock
picking talent, style, transaction costs, and expenses. Journal of Finance, 55, 1655-1695.
Womack, K., 1996, Do brokerage analysts’ recommendations have investment value?
Journal of Finance 51, 137-167.
27
Table 1
Buy- and sell-side stock recommendation samples.a The sample period is July 1997 to December 2004.
Buy-side firm
Sell-side firms
Number of analyst firms 1 85 Number of U.S. company recommendations issued by sample ffrom July 1997 to December 2004
2,013 173,414
Average per firm
Total number of analysts issuing recommendations in the sample period
46 86
Number of recommendations issued 2,013 2,040 Number of stocks recommended 567 671
Recommendations
Number of recommendations for companies covered by both buy- and sell-side analysts
2,013 105,782
Number of recommendations for companies covered only
by sell-side analysts 0 67,632
a The buy-side sample comprises all stock recommendations issued by the sample buy-side firm during the sample period. The sample of sell-side firms comprises all recommendations issued by sell-side firms listed on IBES that issue at least five recommendations per year throughout the sample period. We eliminate 92,876 recommendations issued by 542 firms that do not appear consistently in the IBES database.

28
Table 2
Firm and buy-recommendation stock characteristics for analysts at the sample buy- and sell-side firms. The sample comprises one buy-side firm and 85 sell-side firms for the
period July 1997 to December 2004.
Mean for
Variable Sell-side
firms Buy side
firm Average number of stocks recommended per analyst in the sample period (NRECS) 12 17** Average number of analysts employed per firm in the sample period (NANL) 86 46 Average daily standard deviation of abnormal returns for stocks recommended by analysts in the sample period (SVOL) 0.95% 0.42%** Average daily turnover as a percentage of shares outstanding for stocks recommended by analysts (STURN) 0.51% 0.50% Average market capitalization (in $ billions) of stocks recommended by analysts (MCAP) 1,350 9,147**
** Significantly different from the sell-side mean at the 1% level using a two-tailed test. Statistical significance is estimated using a t test that compares the sell-side firm mean to the value for the buy-side firm.

29
Table 3 Recommendation frequency for buy- and sell-side analysts. The sample comprises one
buy-side firm and 85 sell-side firms for the period July 1997 to December 2004.
Buy-side firm Sell-side firms
Number Percent Number Percent
Panel A: Full Sample Strong Buy/Buy 888 44.1% 97,355 56.1% Hold 851 42.3% 64,379 37.1% Underperform/ Sell 274 13.6% 11,680 6.8% Total 2,013 100.0% 173,414 100.0% Chi-Square Statistica 203.7**
a The Chi-Square Statistic indicates whether there is a significant difference between the recommendation frequencies for the buy-side firm and the two sell-side samples.
** Significant at the 1% level using a two-tailed test.

30
Table 4
Market-adjusted and abnormal returns from investing in analysts’ buy recommendations for buy-and sell-side firms. The sample comprises one buy-side firm and 85 sell-side
firms for the period July 1997 to December 2004.a
Buy-side
firm
Sell-side firms
Difference
Panel A: Combined Strong Buy/Buy Recommendations
Market-adjusted returns
Mean 2.3%ns 8.2%** (5.9%)**
Median 2.3% ns 7.4%** (5.1%)**
Buy-side firm percentile rank 88%
Abnormal returns
Mean 2.3% ns 6.1%** (3.8%)**
Median 2.3% ns 5.3%** (3.0%)**
Buy-side firm percentile rank 76%
Regression factor weights
Market factor 1.11** 1.06** 0.05 ns
Size factor 0.12** 0.64** (0.52)**
Book to market factor 0.37** 0.25** 0.12 ns
Momentum factor -0.25** -0.19** (0.06) ns
Panel B: Strong Buy Recommendations
Market-adjusted returns Mean 3.6%* 8.9%** (5.3%)* Median 3.6%* 8.1%** (4.5%)*
Abnormal returns Mean 3.4%* 6.4%** (3.0%) * Median 3.4%* 6.1%** (2.7%) *
Number of firms 1 85

31
Panel C: Buy Recommendations
Market-adjusted returns Mean 1.1% ns 6.8%** (5.7%)* Median 1.1% ns 6.5%** (5.4%)*
Abnormal returns Mean 1.0% ns 4.9%* (3.9%)ns Median 1.0% ns 4.6%* (3.5%)ns
Number of firms 1 85
**, * Significant at the 1% and 5% level respectively using a two-tailed test. ns Not significant at the 5% level or lower using a two-tailed test. a We construct buy recommendation portfolios for each sample firm by buying and holding stocks rated by the firm’s analysts as a Strong Buy or Buy from the day after the initial recommendation is announced until the day after they were downgraded to a Hold or lower rating (if they continued to be covered), or for 250 days (if they ceased to be covered). Market-adjusted returns are returns to a firm’s buy recommendation portfolio less the return on the value-weighted S&P 500 market index. Abnormal returns are computed for each firm’s buy recommendation portfolio by regressing daily portfolio returns on the market excess return, a zero-investment size portfolio return, a zero investment book-to-market portfolio return and a zero investment price momentum portfolio return. The abnormal return is the annualized regression intercept based on a 250 trading day year.

32
Table 5 Annual market-adjusted and abnormal returns from investing in analysts’ buy
recommendations for buy- and sell-side firms. The sample comprises one buy-side firm and 85 sell-side firms for the period July 1997 to December 2004.a
1997 1998 1999 2000 2001 2002 2003 2004
Market-adjusted returns Buy-side firm (0.8%) (9.1%) (10.8%) 18.6% 5.5% (0.5%) 5.7% 3.8% Sell-side firm mean 3.7% (11.2%) 7.3% 22.4% 27.5% 6.6% 19.8% 8.5%
Difference 4.5% (2.1%) 18.1% 3.8% 22.0% 6.1% 14.1% 4.7%
p levelb 0.042
Buy-side firm % rank 62% 31% 71% 38% 81% 53% 91% 71%
p levelb 0.064
Abnormal returns Buy-side firm (2.1%) 5.6% 3.6% 14.9% (1.8%) 10.7% 2.0% 3.5% Sell-side firm mean (1.0%) 11.1% 12.9% 20% 10.7% 6.5% 6.5% 5.3%
Difference 1.1% 5.5% 9.3% 5.1% 12.5% (4.2%) 4.5% 1.8%
p levelb 0.039
Buy-side firm % rank 53% 56% 60% 59% 81% 35% 59% 64%
p levelb 0.055
a We construct buy recommendation portfolios for each sample firm by buying and holding stocks rated by the firm’s analysts as a Strong Buy or Buy from the day after the initial recommendation is announced until the day after they were downgraded to a Hold or lower rating (if they continued to be covered), or for 250 days (if they ceased to be covered). Market-adjusted returns are returns to a firm’s buy recommendation portfolio less the return on the value-weighted S&P 500 market index. Abnormal returns are computed for each firm’s buy recommendation portfolio by regressing daily portfolio returns on the market excess return, a zero-investment size portfolio return, a zero investment book-to-market portfolio return and a zero investment price momentum portfolio return. The abnormal return is the annualized regression intercept based on a 250 trading day year. b The p level is for a two-tailed Wilcoxon Signed Ranks Test
33
Table 6
Market-adjusted and abnormal returns from investing in analysts Hold and Underperform/Sell recommendations for buy- and sell-side analysts’ for the period July
1997 to December 2004.a
Buy-side
firm
Sell-side firms
Difference
Panel A: Hold Recommendations
Market-adjusted returns Mean 5.7%* 5.8% ns (0.1%) ns
Median 5.7% ns 5.3% ns 0.4% ns
Abnormal returns Mean 6.0%* 4.8% ns 1.2% ns
Median 6.0%* 5.3% ns 0.7% ns
Number of firms 1 64
Panel B: Underperform/Sell Recommendations
Market-adjusted returns
Mean (1.3%) ns (1.1%) ns (0.2%) ns
Median (1.3%) ns 2.2% ns (3.5%) ns
Abnormal returns
Mean (1.1%) ns (2.5%) ns (1.4%) ns
Median (1.1%) ns 0.5% ns (1.6%) ns
Number of firms 1 11
* Significant at the 5% level using a two-tailed test. ns Not significant at the 5% level or lower using a two-tailed test. a We construct buy recommendation portfolios for each sample firm by buying and holding stocks rated by the firm’s analysts as a Hold or Underperform/Sell from the day after the initial recommendation is announced until the day after they were changed to another rating (if they continued to be covered), or for 250 days (if they ceased to be covered). Market-adjusted returns are returns to a firm’s buy recommendation portfolio less the return on the value-weighted S&P 500 market index. Abnormal returns are computed for each firm’s buy recommendation portfolio by regressing daily portfolio returns on the market excess return, a zero-investment size portfolio return, a zero investment book-to-market portfolio return and a zero investment price momentum portfolio return. The abnormal return is the annualized regression intercept based on a 250 trading day year.
34
Table 7 Relation between analysts’ Strong Buy/Buy recommendation abnormal returns and
analyst, bank and recommended stock characteristics for one buy-side firm and 85 sell-side firms during the period July 1997 to December 2004.a
Parameter
Estimate
(t statistic)
Estimate
(t statistic)
Estimate
(t statistic)
Intercept 0.0603 0.0193 0.2873 (8.06) 0.15 1.56
Buy-side indicator variable (BUYSIDE) -0.0378** -0.0588* -0.0227ns
(-5.05) (-2.29) (-0.83)
Average number of stocks recommended per analyst in the sample period (NRECS)
0.0022
(0.66) 0.0024
(0.75)
Average number of analysts employed per firm in the sample period (NANL)
-0.0107
(-0.83) -0.0127
(-0.96)
Average daily standard deviation of abnormal returns for stocks recommended by analysts in the sample period (SVOL)
-0.0816
(-0.02) -1.4444
(-0.38)
Average daily turnover as a percentage of shares outstanding for stocks recommended by analysts (STURN)
0.8926
(0.16) 3.9158
(0.76)
Log of average market capitalization for stocks recommended by analysts (MCAP)
-0.0258
(-2.42)
Mean recommendation for a firm is during sample period (REC)
0.0239
(0.50) 0.0642
(1.28) Number of observations 86 86 86 Adjusted R-squared 0.4% 4.7% 12.2%
**, * Significant at the 1% and 5% level respectively using a two-tailed test. ns Not significant at the 5% level or lower using a two-tailed test. a The dependent variable is the mean abnormal return to buy recommendations at a given firm throughout the sample period. To estimate the mean recommendation for a firm (REC), Strong Buy recommendations are assigned the value 1, Buys 2, Holds 3, etc.). The model is estimated using time-series averages of the dependent and independent variables for each firm to allow for dependencies in the variables within firms.

35
Table 8 Market-adjusted and abnormal returns for subsamples of sell-side analysts’ Strong
Buy/Buy recommendations during the period July 1997 to December 2004.a
Subsample
Market-adjusted Return
Abnormal Return
Mean Median Mean Median Sell-side returns for: Firms covered by both the buy- and sell-side 3.20% ns 2.80% ns 3.05% ns 3.10% ns
Firms covered only by the sell-side 10.20%** 9.90%** 8.10%** 7.60%**
Difference (7.00%)* (7.10%)* (5.05%)* (4.50%)*
Large firms covered only by the sell-side 5.00%* 4.80%* 4.70%* 4.60%*
Small firms covered only by the sell-side 12.30%** 10.90%** 11.40%** 9.10%**
Difference (7.30%)** (6.10%)* (6.70%)* (4.50)%*
Buy-side returns for: Firms covered by both the buy- and sell-side 2.30% ns 2.30% ns
**, * Significant at the 1% and 5% level respectively using a two-tailed test. ns Not significant at the 5% level or lower using a two-tailed test. a We construct buy recommendation portfolios for each sample firm by buying and holding stocks rated by the firm’s analysts as a Strong Buy or Buy from the day after the initial recommendation is announced until the day after they were downgraded to a Hold or lower rating (if they continued to be covered), or for 250 days (if they ceased to be covered). Market-adjusted returns are returns to a firm’s buy recommendation portfolio less the return on the value-weighted S&P 500 market index. Abnormal returns are computed for each firm’s buy recommendation portfolio by regressing daily portfolio returns on the market excess return, a zero-investment size portfolio return, a zero investment book-to-market portfolio return and a zero investment price momentum portfolio return. The abnormal return is the annualized regression intercept based on a 250 trading day year.

36
Table 9 Results of robustness tests for analysts switching form sell-side firms to the buy side
firm, and for recommendations from survey of buy- and sell-side analysts. Panel A: Performance of Strong Buy/Buy recommendations for 27 buy-side analysts who switched from the sell-side
Buy-side analysts
employed by buy-side firm
Same buy-side analysts
employed by sell-side firm
Difference
Mean returns for all Strong Buy/Buy recommendations Market-adjusted (2.0)% ns 4.7% ns (6.7)% ns Abnormal (0.3)% ns 1.7% ns (2.0)% ns Average number of stocks in portfolio
67 52
Mean returns for Strong Buy/Buy recommendations for same stocks Market-adjusted (1.8)% ns 1.9% ns (3.7)% ns Abnormal (0.3)% ns 0.9% ns (1.2)% ns Average number of stocks in portfolio
48 48
Panel B: Performance of buy and sell-side analyst Strong Buy/Buy recommendations collected from analyst survey
Buy-side analysts
Sell-side analysts
Difference
Mean returns Market-adjusted 1.4% ns 2.3% ns (0.9)% ns Abnormal 3.2%* 3.0%* 0.2% ns Number of recommendations 282 1,202 Number of analysts Average market capitalization $30.7 billion $27.6 billion
* Significant at the 5% level using a two-tailed test. ns Not significant at the 5% level or lower using a two-tailed test.