Status report: Key decisions on horizon for Las Vegas soccer stadium
2012 National Survey of Science and Mathematics Education
Eric R. Banilower January 7, 2013
The Status of High School Physics Teaching

2012 National Survey of Science and Mathematics Education

2012 National Survey of Science and Mathematics Education
Pop Quiz • Take a minute and jot down your answers.
• Turn to a neighbor and discuss your predictions.

2012 National Survey of Science and Mathematics Education

2012 National Survey of Science and Mathematics Education
About the Study • Two-stage sample that targeted:
– 2,000 schools (public and private) – Over 10,000 K-12 teachers – Purposefully oversampled teachers of advanced
mathematics, chemistry, and physics
• We got a really good response rate: – 1,504 schools agreed to participate – Over 80 percent of program representatives – Over 75 percent of sampled teachers
2012 National Survey of Science and Mathematics Education
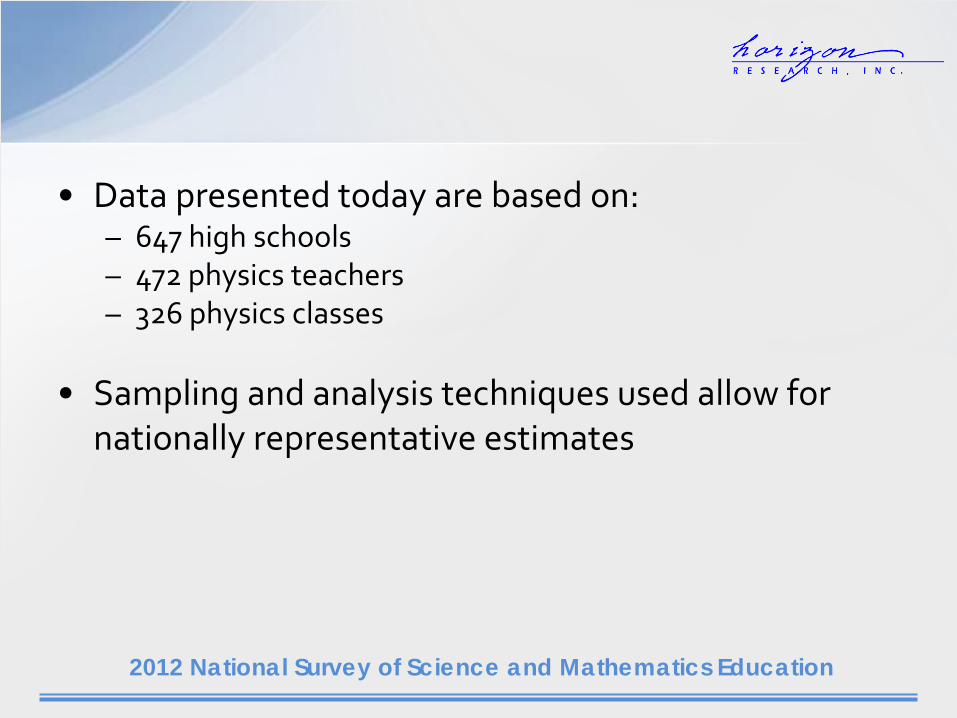
• Data presented today are based on: – 647 high schools – 472 physics teachers – 326 physics classes
• Sampling and analysis techniques used allow for
nationally representative estimates
2012 National Survey of Science and Mathematics Education
Who Teaches High School Physics?
2012 National Survey of Science and Mathematics Education
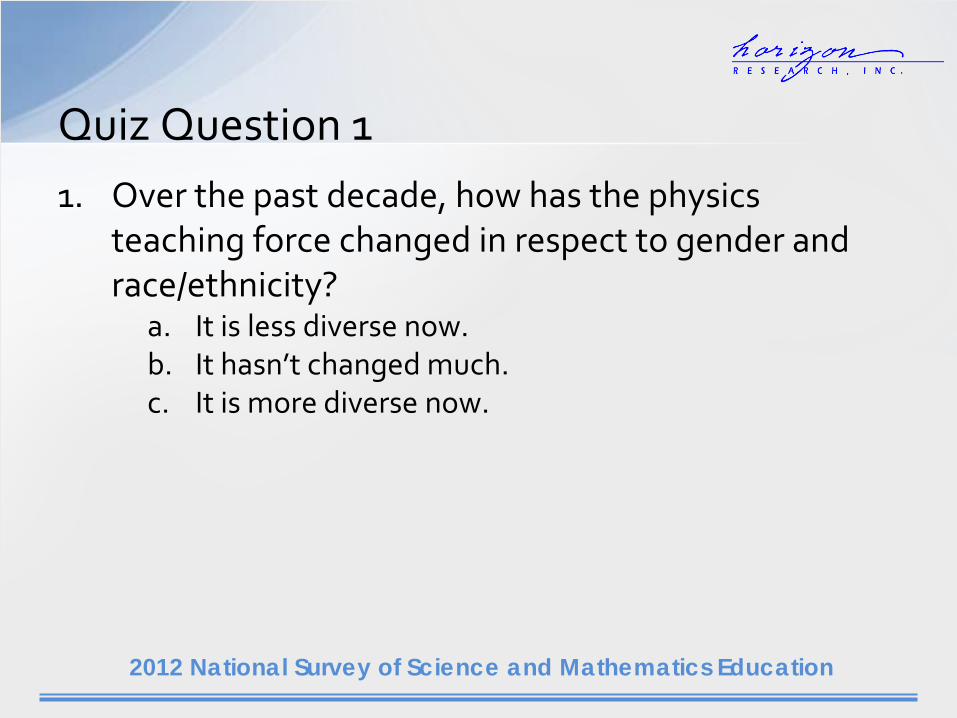
Quiz Question 1 1. Over the past decade, how has the physics
teaching force changed in respect to gender and race/ethnicity?
a. It is less diverse now. b. It hasn’t changed much. c. It is more diverse now.

2012 National Survey of Science and Mathematics Education
Demographics of Physics Teachers
2000 Sex
% Female % Male
40 60
(6.6) (6.6)
Race/Ethnicity % White % Non-White
89 11
(1.3) (1.3)
Average Age 43 (1.3)
Average Years Teaching Experience
13 (1.3)

2012 National Survey of Science and Mathematics Education
Demographics of Physics Teachers
2000 2012 Sex
% Female % Male
40 60
(6.6) (6.6)
34 66
(3.6) (3.6)
Race/Ethnicity % White % Other
89 11
(1.3) (1.3)
96 4
(0.9) (0.9)
Average Age 43 (1.3) 44 (0.9)
Average Years Teaching Experience
13 (1.3) 14 (0.9)

2012 National Survey of Science and Mathematics Education
Quiz Question 2 2. About what percentage of physics teachers has a
degree in physics? a. 10 b. 20 c. 30 d. 40
2012 National Survey of Science and Mathematics Education
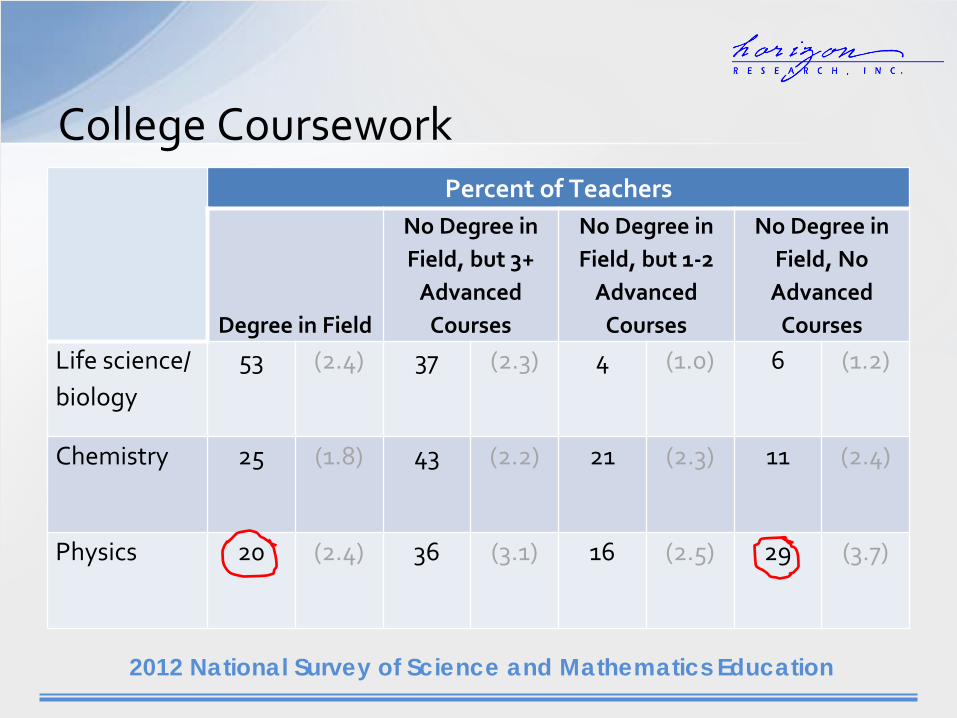
College Coursework Percent of Teachers
Degree in Field
No Degree in Field, but 3+
Advanced Courses
No Degree in Field, but 1-2
Advanced Courses
No Degree in Field, No Advanced
Courses Life science/ biology
53 (2.4) 37 (2.3) 4 (1.0) 6 (1.2)
Chemistry 25 (1.8) 43 (2.2) 21 (2.3) 11 (2.4)
Physics 20 (2.4) 36 (3.1) 16 (2.5) 29 (3.7)

2012 National Survey of Science and Mathematics Education
Perceptions of Preparedness Percent of Physics Teachers
Forces and motion 80 (3.5)
Energy transfers, transformations, and conservation 74 (4.2)
Properties and behaviors of waves 63 (4.0)
Electricity and magnetism 54 (3.7)
Modern physics (e.g., special relativity) 24 (2.9)
Engineering 17 (2.3)

2012 National Survey of Science and Mathematics Education
Quiz Question 3 3. About what percentage of physics teachers think
instruction on an idea should begin with providing definitions for new vocabulary?
a. 35 b. 50 c. 65 d. 80
2012 National Survey of Science and Mathematics Education
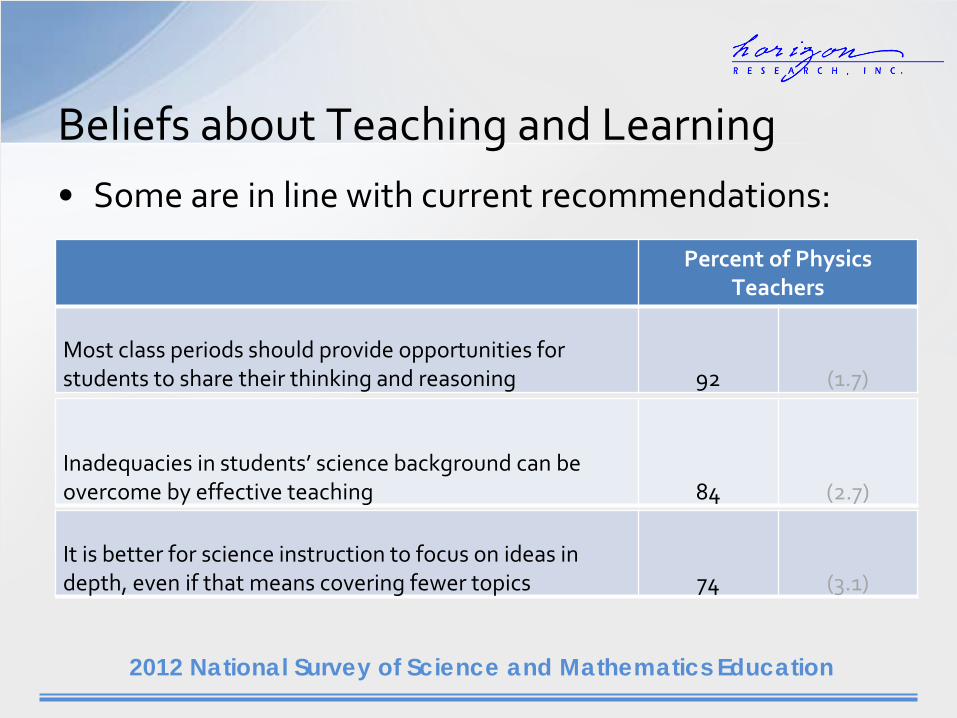
Beliefs about Teaching and Learning • Some are in line with current recommendations:
Percent of Physics Teachers
Most class periods should provide opportunities for students to share their thinking and reasoning 92 (1.7)
Inadequacies in students’ science background can be overcome by effective teaching 84 (2.7) It is better for science instruction to focus on ideas in depth, even if that means covering fewer topics 74 (3.1)

2012 National Survey of Science and Mathematics Education
Beliefs about Teaching and Learning • Some are not:
Percent of Physics Teachers
Students learn science best in classes with students of similar abilities 68 (3.3) At the beginning of instruction on a science idea, students should be provided with definitions for new scientific vocabulary that will be used 64 (3.8) Hands-on/laboratory activities should be used primarily to reinforce a science idea that the students have already learned 45 (3.9)
2012 National Survey of Science and Mathematics Education
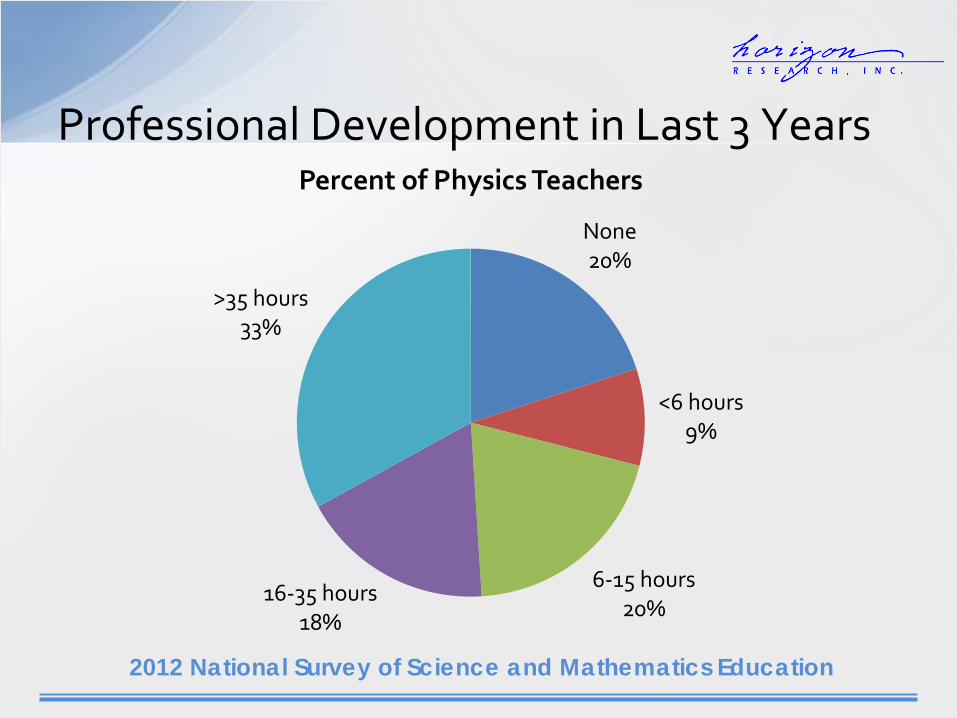
Professional Development in Last 3 Years
None 20%
<6 hours 9%
6-15 hours 20%
16-35 hours 18%
>35 hours 33%
Percent of Physics Teachers

2012 National Survey of Science and Mathematics Education
Emphasis of Professional Development Percent • Monitoring student understanding 54 • Assessing students after instruction 51 • Planning differentiated instruction 49 • Deepening own content knowledge 47 • Learning about student difficulties 46 • Eliciting student ideas pre-instruction 39

2012 National Survey of Science and Mathematics Education
Quiz Question 4 4. About what percentage of high schools offer one or
more physics courses?
2012 National Survey of Science and Mathematics Education
Physics Course Offerings • 85 percent of high schools offer physics
– 37 percent offer a non-college prep course – 77 percent offer a 1st year college prep course
• 34 percent offer a 2nd year/advanced course – 22 percent offer AP Physics B – 12 percent offer AP Physics C

2012 National Survey of Science and Mathematics Education
Quiz Questions 5 & 6 5. Compared to 1st year high school biology, students
in 1st year high school physics are: a. Less likely to be female. b. Just as likely to be female. c. More likely to be female.
6. In terms of race/ethnicity, compared to 1st year
high school biology, students in 1st year high school physics are:
a. Less diverse. b. Just as diverse. c. More diverse.

2012 National Survey of Science and Mathematics Education
Who Takes 1st Year Physics? Percent of Students
Female Non-Asian
2000 1st Year Biology 52 (1.0) 25 (2.1)
1st Year Chemistry 56 (1.3) 21 (2.4)
1st Year Physics 46 (1.9) 19 (3.5)

2012 National Survey of Science and Mathematics Education
Who Takes 1st Year Physics? Percent of Students
Female Non-Asian
2000 1st Year Biology 52 (1.0) 25 (2.1)
1st Year Chemistry 56 (1.3) 21 (2.4)
1st Year Physics 46 (1.9) 19 (3.5)
2012 1st Year Biology 49 (1.6) 33 (2.7)
1st Year Chemistry 51 (1.4) 30 (1.8)
1st Year Physics 49 (1.8) 23 (2.7)
2012 National Survey of Science and Mathematics Education
What Does Instruction Look Like in Physics Classes?

2012 National Survey of Science and Mathematics Education
Instructional Objectives 89
51 45
7
79
45 50
15
0
20
40
60
80
100
UnderstandingConcepts*
LearningProcess Skills
IncreasingInterest
Memorization*
Physics Other Sciences
* Significant difference between physics and other sciences, p < 0.05

2012 National Survey of Science and Mathematics Education
Quiz Question 7 7. What percentage of physics classes include:
I. Lecture at least once per week?
II. Hands-on activities at least once per week?

2012 National Survey of Science and Mathematics Education
Instructional Practices: At Least Once per Week
Percent of Classes
Other Sciences Physics
Explain science ideas to the whole class 95 (0.8) 95 (2.1)
Have students work in small groups* 83 (1.4) 89 (2.2)
Engage the whole class in discussions 82 (1.3) 85 (2.1)
Do hands-on/laboratory activities 70 (1.7) 74 (3.2)
Require students to supply evidence for claims * 58 (1.8) 74 (3.4)
Have students write their reflections* 21 (1.5) 15 (2.5)
* Significant difference between physics and other sciences, p < 0.05

2012 National Survey of Science and Mathematics Education
Most Recent Unit • The survey asked about how student understanding
was assessed
• For physics classes – 97 percent: the teacher used informal questioning – 92 percent: the teacher administered quizzes/tests to
assign grades – 49 percent: the teacher administered an assessment, task,
or probe at the beginning of the unit to find out what students thought or already knew
2012 National Survey of Science and Mathematics Education
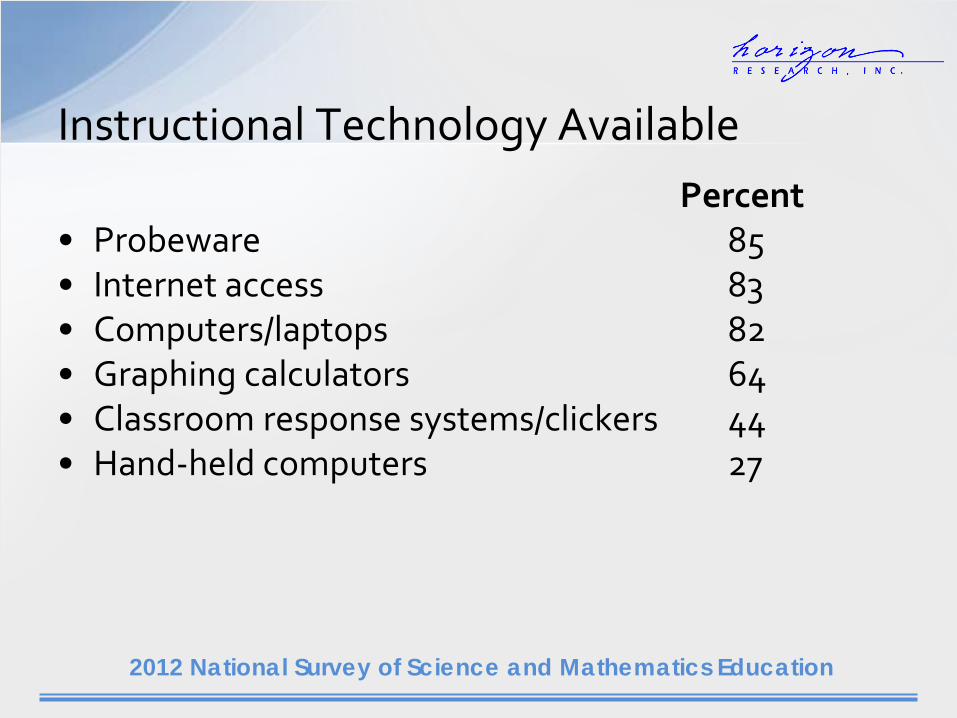
Instructional Technology Available Percent • Probeware 85 • Internet access 83 • Computers/laptops 82 • Graphing calculators 64 • Classroom response systems/clickers 44 • Hand-held computers 27

2012 National Survey of Science and Mathematics Education
Instructional Technology Use • Probeware:
– 20 percent use it at least once a week – 44 percent use it monthly – 21 percent use it only a few times a year
• Although 44 percent o f physics classes have access
to clickers, only 7 percent use it at least once a week

2012 National Survey of Science and Mathematics Education
For More Information
http://www.horizon-research.com/2012nssme/
http://www.facebook.com/2012NSSME
https://twitter.com/2012NSSME

2012 National Survey of Science and Mathematics Education
This presentation is based upon work supported by the
National Science Foundation under Grant No. DRL-1008228. Any opinions, findings, and conclusions or recommendations expressed are those of the author
and do not necessarily reflect the views of the National Science Foundation.