The State of Tourism in New Mexico: A Review of the Data · The State of Tourism in New Mexico: ......
33
The State of Tourism in New Mexico: A Review of the Data New Mexico Tourism Department James Orr, Research Coordinator TANM Research Conference November 3, 2011
Transcript of The State of Tourism in New Mexico: A Review of the Data · The State of Tourism in New Mexico: ......
The State of Tourism in New Mexico:
A Review of the Data
New Mexico Tourism Department
James Orr, Research Coordinator
TANM Research Conference
November 3, 2011
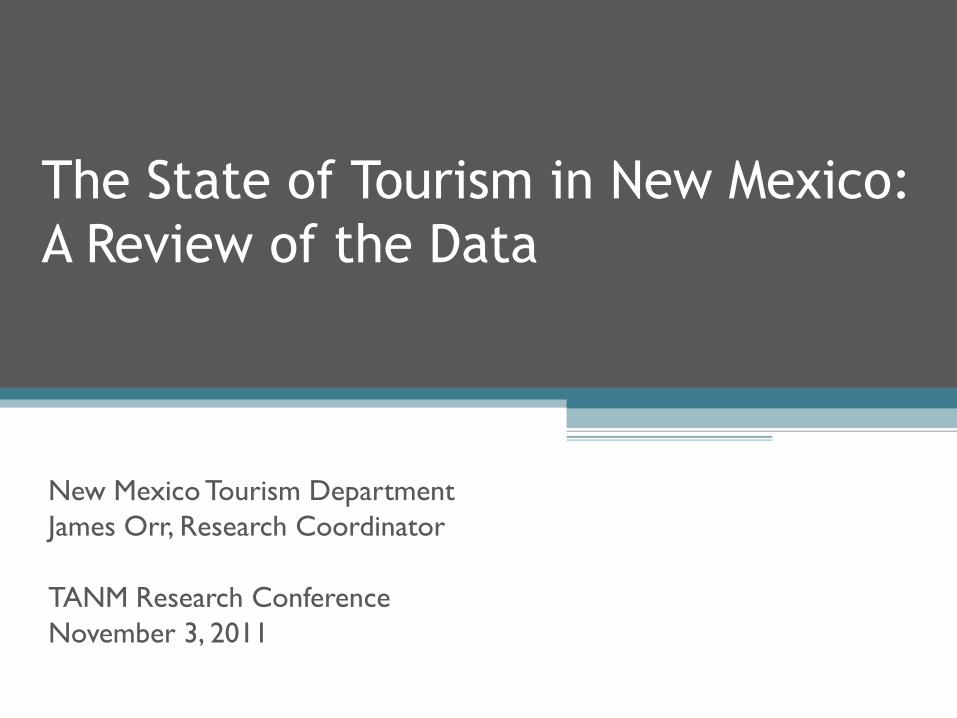
14.8
15.0
13.9
13.7
2007 2008 2009 2010
Total Overnight Person Trips (MM)
Source: Longwoods International, 2007-2010
2
New Mexico Tourism has suffered declines since 2008,
although market share has held flat at 1.0% (36th in U.S.)

USTA data: New Mexico Travel Spending ($ Millions)
Source: United States Travel Association
$4,028 $4,039 $4,082 $4,169 $4,446
$4,888
$5,385 $5,699
$6,017
$5,437
2000 2001 2002 2003 2004 2005 2006 2007 2008 2009
3

Sources: Longwoods, 2010. International share based on previous TNS estimates of international visitor share
NM Travel Market Mix:
Domestic vs. International
NM Travel Market Mix:
Leisure vs. Business
Domestic,
95%
International
> 5%
Leisure,
87%
Business,
13%
4

Top 5 states of Origin for NM overnight visitors
5
27.1%
20.9%
8.5% 7.3% 7.2%
NM TX AZ CA CO
Source: Longwoods International 2010

11.9%
31.1% 32.8%
24.2%
11.6%
36.7% 35.9%
15.7%
18-24 25-44 45-64 65+
NM total
U.S.
New Mexico IS Different: There have long been significant differences from neighboring states and U.S. averages
AGE: NM Overnight Visitors vs. U.S. average by Age (Average age NM visitors 48.1, U.S. 45.7)
The average
%65+ for the
Mtn States* is
17.1%
6
Source: Longwoods International 2010 *Mountain states: Arizona, Colorado and Utah

$214
$236
$205 $203
2007 2008 2009 2010
In Line with the economy, average spending has declined
since 2008…
Average $ per
Person/overnight trip
Source: Longwoods International, 2007-2010
7
…and in 2010
the average
spent per
person per day
for overnight
trips was about
75% of the
national
average

New Mexico is a “Weak Magnet” It has a Regional, not National market
8
Source: Longwoods International 2010
71% of overnight
visitors from 5
states

Source: Longwoods International 2010
Top 15 DMAs for New Mexico

Potential NM National market – top 15 DMAs
11
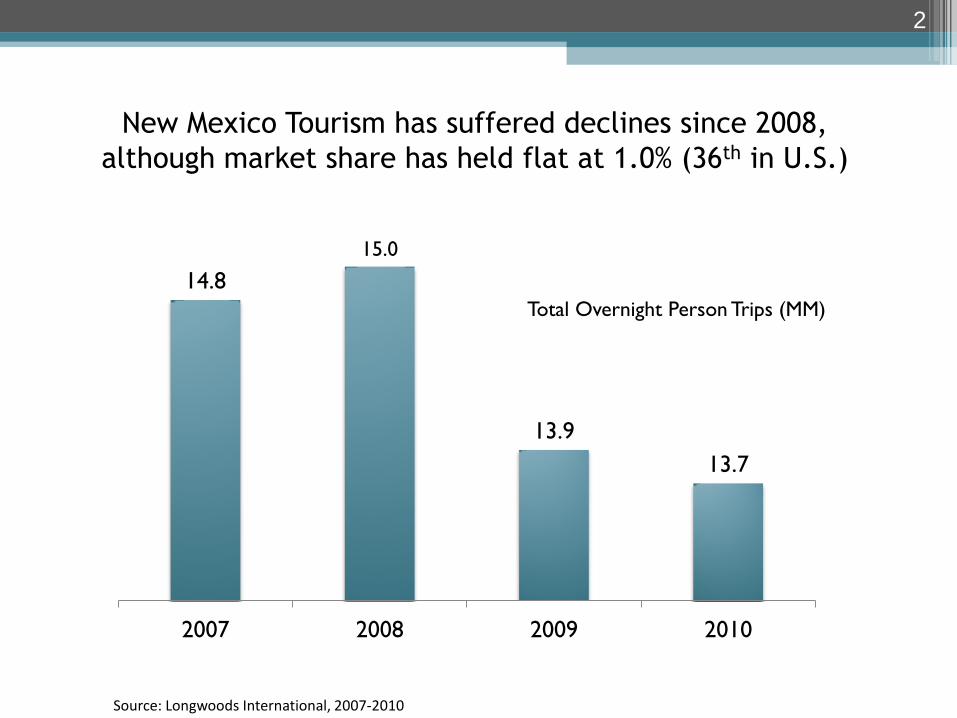
Asked of residents of each state:
Intent to take an overnight vacation within your own state
*Mountain states: Arizona, Colorado and Utah
56%
44%
Mtn state ave NM
Source: Longwoods International 2010

“GATEWAY TO ELSEWHERE”
Source: Longwoods, 2010
NM is the
Primary
Destination
68%
Passing
through NM
32%
12
*Mountain states: Arizona, Colorado and Utah
New Mexico’s Pass Through Rate* of 32% for Overnight
Visitors is TWICE the Mountain state average of 16%
*Pass through = stayed overnight in a given state, but did not spend most of their time in that state

13
Source: Longwoods International 2010
PRIMARY Overnight Visitors are even more concentrated
(% from top 5 states):
76.0%
65.8%
NM Mtn state average
% from top
5 states
*Mountain states: Arizona, Colorado and Utah

14
54%
38%
15%
5%
19%
44%
12% 13%
% ANNUAL DOMESTIC
VISITORS = 29.8MM
% TOTAL ECONOMIC
IMPACT = $5.5B est.*
In- State Overnight
(Primary Destination)
Out of State Overnight
(Primary Destination)
Overnight Pass-
throughs
Day Trips
Sources: Longwoods, CY 2010; USTA Travel Spending CY2009; Katie Connolly & Associates Custom Analysis, 2011 *Economic values estimate based on USTA 2009 NM Travel Spending data and weighted share of traveler expenditures by trip type
Attracting out-of-state overnight visitors will be key to
driving economic impact:

15
Source: Longwoods International 2010
Differences between NM Primary and Pass through visitors:
Primary visitors:
• Are younger (ave age 46.4 vs. 51.5)
• Much more likely to be employed and not retired
• More active, more likely to participate in outdoor activities, fine dining
and special events, and attending museums, parks and historic sites
• Less likely to be in NM to visit friends and relatives (36.5% vs. 44.4%)
and to participate in touring (12.8% vs. 24.7%), to have an RV or camper
(3.7% vs. 7.3%) and to travel by bus (1.8% vs. 5.2%)
• Spend more per day (+58%) on shorter trips (3.6 days vs. 10.5)
For all these characteristics, NM Primary visitors look much more like the
average visitor in the U.S. and in neighboring mountain states.
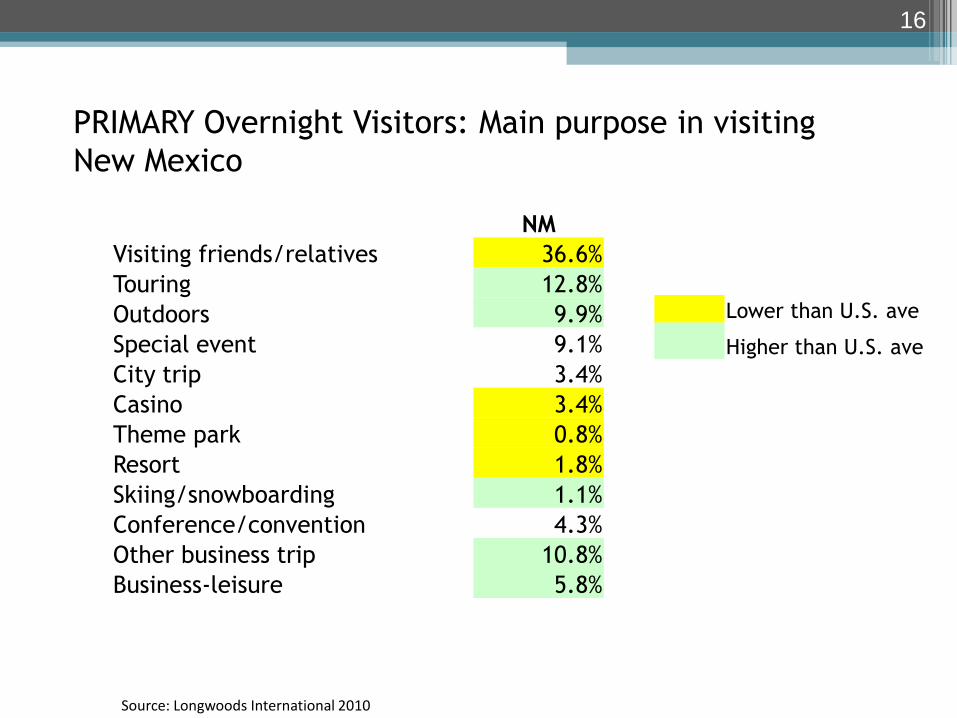
16
NM
Visiting friends/relatives 36.6%
Touring 12.8%
Outdoors 9.9%
Special event 9.1%
City trip 3.4%
Casino 3.4%
Theme park 0.8%
Resort 1.8%
Skiing/snowboarding 1.1%
Conference/convention 4.3%
Other business trip 10.8%
Business-leisure 5.8%
Lower than U.S. ave
Higher than U.S. ave
PRIMARY Overnight Visitors: Main purpose in visiting
New Mexico
Source: Longwoods International 2010

New Mexico has an image problem compared with its neighbors: Impressions of New Mexico compared to Colorado & Arizona*
17
9.2
7.5
6.8
8.6
6.1
8.7
6.4
5.5
4.9
8.4
7.9
5.6
7.7
6.4
5
5.2
6.7
7.8
4.9
7.5
5.9
Excellent Skiing
Excellent Fishing
Great for Golfers
Great for exploring nature
Wide Variety of Packages Available
Beautiful Scenery
Easy to get there NM
AZ
CO
Source: CRC & Associates, Southwest Planning & Marketing 2010 Online Branding Survey - NFO national consumer panel *Source: 2010 New Mexico Branding On-Line Survey – CRC & Associates, Southwest Planning & Marketing TNS national and regional samples n=883

Additionally, a social media audit showed New Mexico has
lower visibility & more negative consumer perceptions
1,348
2,985
523 669
0
500
1000
1500
2000
2500
3000
3500
Arizona Colorado New Mexico Utah
Average Mentions per Keyword
62
40 41
37
14 13
24
17
0
10
20
30
40
50
60
70
Arizona Colorado New Mexico Utah
Positive
Negative
Positive
Average
44%
Negative
Average
17%
% Content Positive vs. Negative
Colorado 6x NM
PRESENCE SENTIMENT
4:1
3:1 1.7:1 2:1
Source: MutualMind Social Media Audit, May 2011
18

19
Google Search Insights also shows few searches for New Mexico (less
interest in?) compared to the competition:
Searches for all
categories
Searches within
Google’s Recreation
category

The Percent of overnight Primary visitors who intend to
return to New Mexico within one year is low*
20
*Mtn States = CO, AZ, UT
*Intent to Repeat a
Visit within 1 Year –
for Primary overnight
visitors who traveled
to each respective
state in the last year
40.5%
51.1%
New Mexico Mtn state ave*
Source: Longwoods International 2010

REPORTING: We have aligned our performance
measurement against our two key problems to solve:
“Help us fill our beds, tables and attractions so we can
thrive.”
Slow Growth
& Under-utilized Assets
Economic Objective:
Accelerate tourism, driving unprecedented revenue
growth and occupancy rates
21
Consumer Problem to Solve Industry Problem to Solve
“New Mexico? I’ve never really
thought about it as a place to vacation. With all the
places to choose from,
I just don’t know why I’d go there.
What is there to do?”
Low/No Awareness
& Misperceptions
Marketing Objective:
Make New Mexico a primary travel destination
by giving “Venturesome” travelers compelling
reasons to choose NM as their next great travel
experience
*US Travel Association, 2009

We have identified 4 key measures of our performance
with the traveling consumer…
OBJECTIVES INDICATORS
• Make NM the fastest growing leisure travel destination in the US
• Visitation growth
• Improve brand recognition/awareness and regard
• Recognition/Awareness • Regard
• Improve conversion • Conversion rates of advertising (incl. web)
• Improve repeat visit • repeat visits
• grow active consumer relationships • Social media presence & sentiment
• Website interaction
• E-newsletter performance
• NM Magazine subscribership
• grow consumer touchpoints • VICs visitation
• Visitor Guide distribution
• PR/Media outreach
• reduce % of visitors from 5 bordering states • Visitor & website demographics
• reduce average age • Visitor & website demographics
• Increase % visitors who choose NM as primary destination (not stopover) • Visitation data
• Grow fly market as % of total visits • Visitation data & airport passenger data
• Grow visitation to NM’s unique natural and cultural attractions • Visitation rates of State Parks, Museums, Monuments
• Visitation rates National Parks & Monuments
22
BRAND PERFORMANCE
CONSUMER RELATIONSHIPS/
TOUCHPOINTS
CONSUMER
PROFILE
VISIT
CHARACTERISTICS
MEASURES

From the economic perspective, we will measure our
impact relative to 5 critical performance objectives…
OBJECTIVES INDICATORS
• Make tourism the economic
growth engine for NM
• ROI
• share growth of total US tourism $
• Increase visitor spending • self-reported spend
• total tourism spending
• Grow tourism tax revenue • NM Gross Receipts
• Lodgers Tax
• Total Tax Receipts
• Maximize tourism assets • Hotel/Motel Occupancy Rates
• Grow tourism jobs • Leisure & Hospitality Employment
• Travel Payroll
23
ECONOMIC
IMPACT
MEASURE
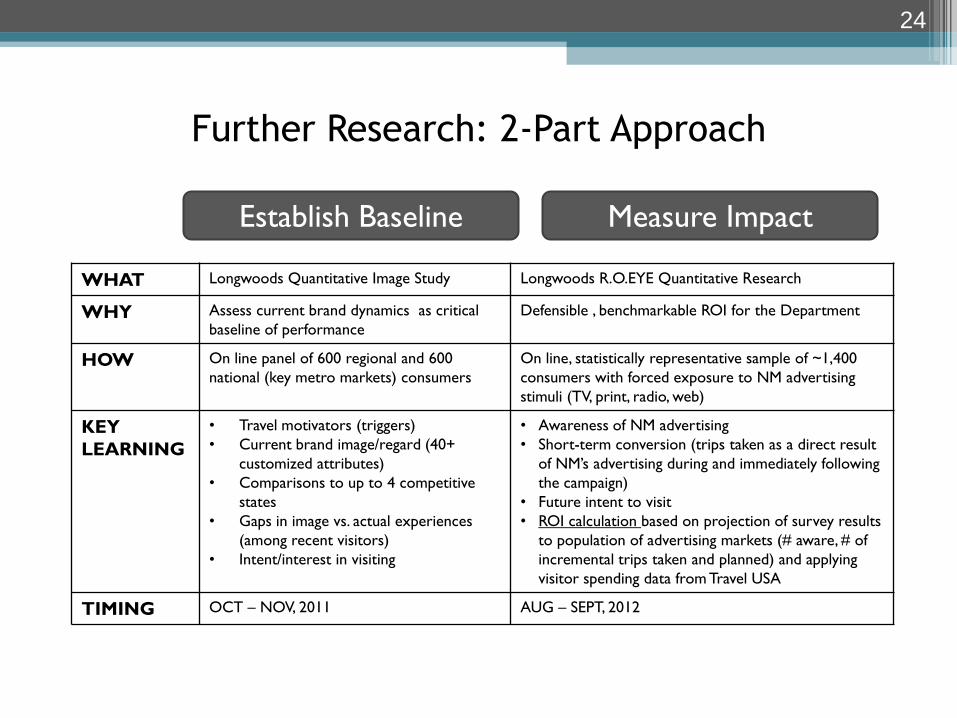
Further Research: 2-Part Approach
24
Establish Baseline Measure Impact
WHAT Longwoods Quantitative Image Study Longwoods R.O.EYE Quantitative Research
WHY Assess current brand dynamics as critical
baseline of performance
Defensible , benchmarkable ROI for the Department
HOW On line panel of 600 regional and 600
national (key metro markets) consumers
On line, statistically representative sample of ~1,400
consumers with forced exposure to NM advertising
stimuli (TV, print, radio, web)
KEY
LEARNING
• Travel motivators (triggers)
• Current brand image/regard (40+
customized attributes)
• Comparisons to up to 4 competitive
states
• Gaps in image vs. actual experiences
(among recent visitors)
• Intent/interest in visiting
• Awareness of NM advertising
• Short-term conversion (trips taken as a direct result
of NM’s advertising during and immediately following
the campaign)
• Future intent to visit
• ROI calculation based on projection of survey results
to population of advertising markets (# aware, # of
incremental trips taken and planned) and applying
visitor spending data from Travel USA
TIMING OCT – NOV, 2011 AUG – SEPT, 2012

Appendix: Additional Information
25
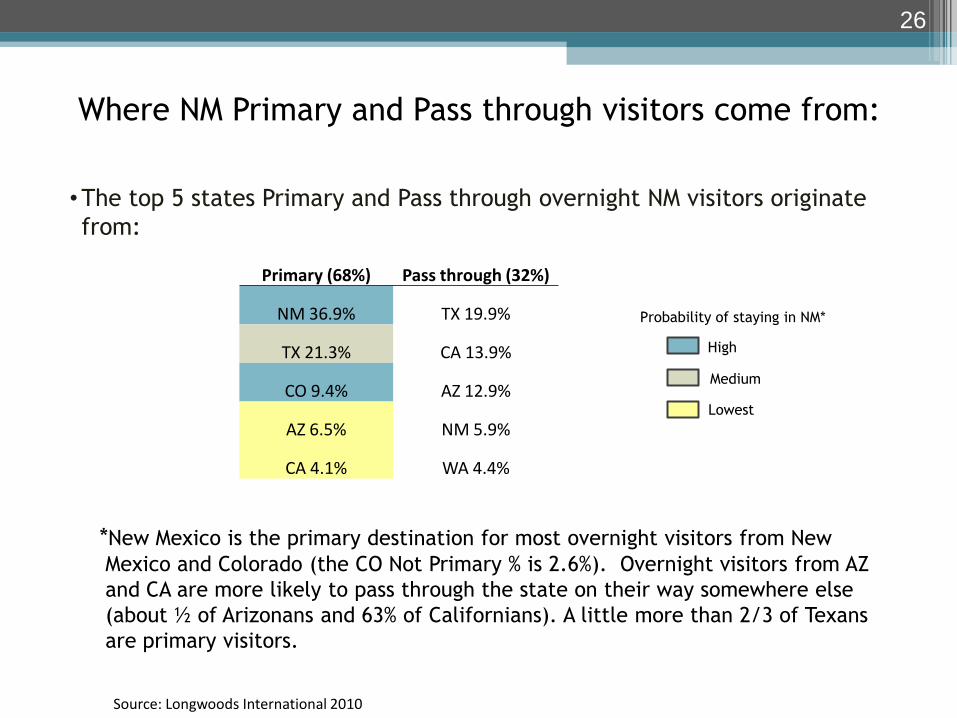
•The top 5 states Primary and Pass through overnight NM visitors originate
from:
*New Mexico is the primary destination for most overnight visitors from New
Mexico and Colorado (the CO Not Primary % is 2.6%). Overnight visitors from AZ
and CA are more likely to pass through the state on their way somewhere else
(about ½ of Arizonans and 63% of Californians). A little more than 2/3 of Texans
are primary visitors.
Where NM Primary and Pass through visitors come from:
26
Primary (68%) Pass through (32%)
NM 36.9% TX 19.9%
TX 21.3% CA 13.9%
CO 9.4% AZ 12.9%
AZ 6.5% NM 5.9%
CA 4.1% WA 4.4%
High
Medium
Lowest
Probability of staying in NM*
Source: Longwoods International 2010

Negatives:
considered to be harder to get to, and a less exciting destination with fewer vacation packages
considered much less scenic and lush than Colorado
considered to have fewer recreational opportunities, especially compared with Colorado
receives a lower rating as a place for couples, singles, or families to visit
ranks lower when it comes to amusement, entertainment and spas
considered to be a less popular and less well known destination with less advertising
thought to have more affordable food and accommodations, but less quality and variety
Positives:
better known for its native culture, historic sites, architecture, unique local cuisine and museums
recognized for its different culture and interesting customs and traditions
recognized for having interesting local people and not too crowded with tourists
ranks higher than Colorado for retirees
New Mexico’s image problem (continued): Impressions of New Mexico compared to Colorado & Arizona*
27
*Source: 2010 New Mexico Branding On-Line Survey – CRC & Associates, Southwest Planning & Marketing TNS national and regional samples n=883

New Mexico has several key strategic issues in terms of
our performance vs. competition:
OUT-SPENT 2010-11 Ad Spending (in millions)*
AZ, 3,470
CO, 8,666
NM, 2,849
TX, 18,402
UT, 4,865
*Source: U.S. Travel Association
28

OUT-CONVERTED
54.9 52.7
51.1
33.7
27.4
11.5 11.5 13.6
4.8 4.1
AZ CO TX NM UT
Ever visited
Past 2 years
National Trial % Visited
Source: TNS, 2010 Branding Survey
29

More specific reporting info:
30

…with specific metrics, sources and measurement intervals for each
(continued on next pg)
METRICS SOURCE INTERVAL
• % growth in total leisure person trips to NM vs. all other
states Longwoods data set annual
• % aware Longwoods custom annual
• % positive, specific attributes Longwoods custom annual
• % advertising viewers who planned trip (broadcast
conversion rate)
Longwoods custom
study annual
• website conversion rate Future web booking
engine? TBD
• intent to return within 12 months, vs. competitive set Longwoods data set annual
• monthly active users, % change Facebook insights Monthly
• post views Monthly
• number of fans, % change Monthly
• positive/negative ratio vs. competitive states Mutual Mind? Quarterly
• visitors/unique visitors/mo., % change Google analytics monthly
• total number of unique visitors to all department websites annual
• pages per visit, % change monthly
• bounce rate monthly
• average time on site, % change monthly
• number of e-newsletters sent & open rate Internet Honey monthly
• total number of subscribers, % change NM Magazine annual
• total number of online subscribers, % change quarterly
• # of visits to VICs, % change VICs monthly
• # of visits to online Visitor Guide, % change Zmags monthly
• # of online downloads monthly
• # of requested mailed visitor guides, % change monthly
• number of stories placed in the media, % change DCI/New PR Agency quarterly
31
BRAND PERFORMANCE
CONSUMER
RELATIONSHIPS/
TOUCHPOINTS
MEASURES
LFC Required

…with specific metrics, sources and measurement intervals for each
(continued from previous pg.)
METRICS SOURCE INTERVAL
• % visitors from 5 bordering states, % change and vs.
competitors
Longwoods annual
data set annual
• % website visitors from 5 bordering states, % change Google analytics monthly
• average age of primary overnight visitor indexed to
competitive set
Longwoods annual
data set annual
• average age of website visitor, % change Quantcast quarterly
• % of overnight visitors who choose NM as primary
destination, change vs. YA, vs. competitive set
Longwoods annual
data set annual
• % fly of total overnight visits, % change, vs. competitive set Longwoods annual
data set annual
• total passengers, % change ABQ Sunport monthly
• total passengers, % change Santa Fe Municipal
Airport monthly
• # of Visitors, % change
NM Energy, Minerals,
Natl Resources Dept,
Park & Rec Division
monthly
• # of Visitors, % change US Dept of the
Interior, NPS monthly
• # of Visitors, % change NM DCA monthly
• # of Visitors, % change NM DCA monthly
32
CONSUMER
PROFILE
VISIT
CHARACTERISTICS
LFC Required NOTES:
Competitive Set = Bordering
mountain states (CO, AZ, UT)

…also with specific metrics, sources and measurement intervals for
each
OBJECTIVES METRICS SOURCE INTERVAL
• Make tourism
the economic
growth engine
for NM
• New Mexico's domestic tourism
market share, % change USTA annual
• ROI (incremental tourism spend per
$ of marketing investment) Longwoods annual
• Increase visitor
spending
• avg $ spend per person per day, %
change, vs. national and competitive
set
Longwoods annual
• total tourism $ spend USTA annual
• Grow tourism
tax revenue
• Eating/Drinking Establishments and
Lodging establishments, % change NM Tax & Rev annual
• Percent increase in lodgers tax
revenue NM DFA annual
• Tax Receipt $, % change USTA annual
• Maximize
tourism assets
• % occupancy, % change
Rocky Mtn
Lodging Assoc.
Report
monthly
• avg room rate, % change monthly
• Grow tourism
jobs
• total # of people employed, %
change
NM Dept of
Workforce
Solutions
quarterly
• total # of people employed, %
change USTA annual
• total payroll $, % change USTA annual
33
ECONOMIC IMPACT
MEASURE
LFC Required NOTES:
Competitive Set = Bordering
mountain states (CO, AZ, UT)