The State of the Region 2007 PresentationThe Good News 2000 2006 SCAG Region Performance 1980 1990...
42
Transcript of The State of the Region 2007 PresentationThe Good News 2000 2006 SCAG Region Performance 1980 1990...


REPORT CARDStateof theRegion 1998 - 2005
EmploymentIncomeHousingMobilityAir QualityEducationPublic Safety
B-C+C-DCDB
A-C+C-DB-DB+
B+CC-DBDB+
BCD+DB-DB
B-C-D+D-CDB
BC-DD-C-DB
BCDFCDB
BCDFCDB
A – ExcellentB – Moderately Well
C – AverageD – Potential Failure
F – Failing
98 99 00 01 02 03 04 05

The Good News
20062000
SCAG Region PerformanceSCAG Region Performance
19901980
The Bad
News
Relative to other large metropolitan regions

Per Capita Income RankPer Capita Income Rank
1
34
25
7
10
9
8
11
12
1315
16
Was in 4th placein 1970,
7th in 1990
2005: US Bureau of Economic Analysis
12
Among Top 17 Metros
SCAG Region
San FranciscoWashingtonDC
New York
Philadelphia
Boston
Houston
Seattle
Denver
Minneapolis
Chicago
AtlantaDallas17
St. Louis 14
6 Detroit
Pittsburgh
Cleveland
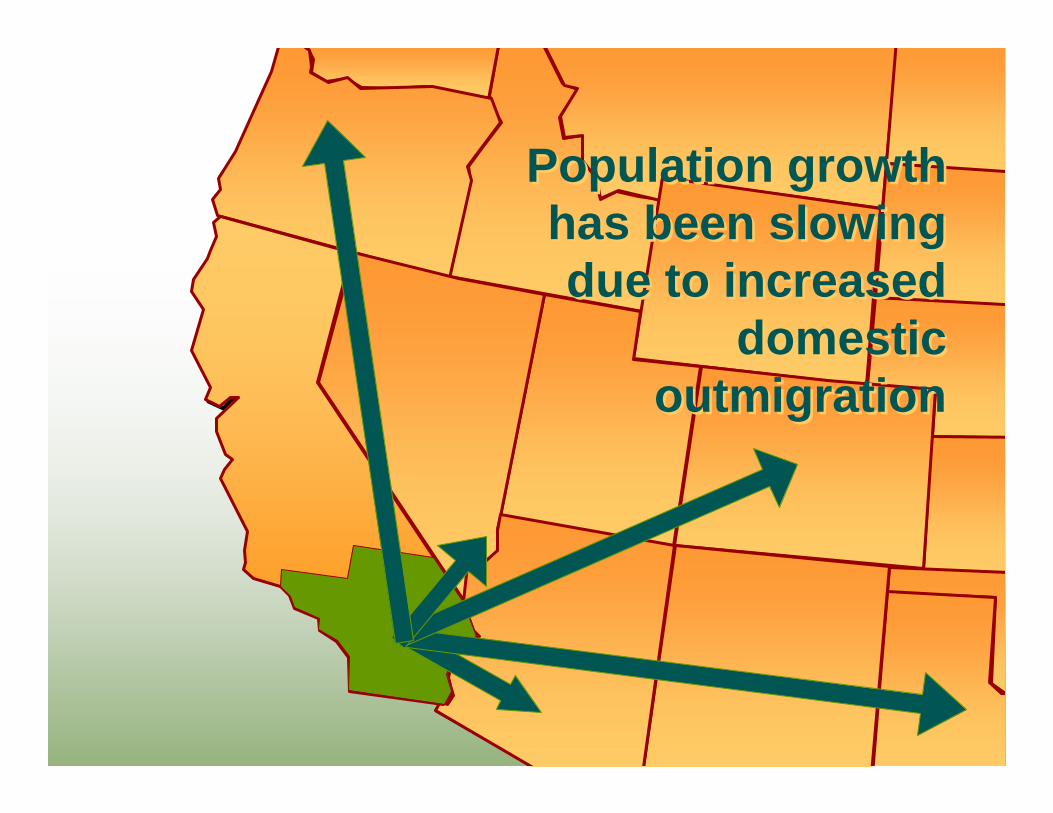
Population growth has been slowing due to increased
domestic outmigration
Population growth has been slowing due to increased
domestic outmigration

Ventura Los Angeles
Orange
Imperial
Riverside
San Bernardino
However, the region has added
2 million people since 2000. Now
18.5 million.
31%
21%
18%
9%10%
9%

Sources of GrowthSources of Growth2000-2006
Natural Increase
55%
Foreign Immigration
44%
DomesticMigration
1%

Shift in Ethnic CompositionShift in Ethnic Composition
0%10%20%30%40%50%60%70%80%90%
100%
1960 1980 2000
Source: U.S. Census Bureau. Data in 1960 was estimated by James Allen and Eugene Turner. 2002. Changing Faces, Changing Places.
Notes: (1) "Asian Alone" also includes Pacific Islander. (2) "Other Race Alone" is too small to be shown (at 0.2 percent in 2000).(3) Only the 2000 Census included the "Two or More Races" category to which people may choose to belong.
Non-Hispanic White
2006
Hispanic
Asian Alone(1)
American Indian Alone
Other Race Alone(2)Two or More Races(3)African American Alone
10%
44%
82%
34%

Shift in Age CompositionShift in Age Composition
Growth 15-34 Growth in 55+

Between 2000 and 2006, the high school dropout rate rose
from 12% to 15%
Only 36% of graduates
qualify for entry to UC or Cal
State
Only 36% of graduates
qualify for entry to UC or Cal
State

D+2002
EDUCATIONEDUCATIONDD DD DD DD DD DD DD DD

However, a violent crime rate that
was 40% higher than the national average in 2000, is now only 10%
higher. The juvenile crime
rate increased slightly in recent
years.

D+2002
PUBLIC SAFETYPUBLIC SAFETYBB B+B+ B+B+ BB BB BB BB BB

Progress Made in 2006Progress Made in 2006
UnemploymentRate
4.6%The lowest since 1980156,000 new jobs
Real PerCapita Income
1.3% increase to $36,614(Only 1.5% since 2000)
Median HHIncome
2.6% increase to $55,678(Still 4% below 1999 level)

D+2002
EMPLOYMENTEMPLOYMENTB-B- A-A- B+B+ BB B-B- BB BB BB

D+2002
INCOMEINCOMEC+C+ C+C+ CC CC C-C- C-C- CC CC

Average Payroll Per JobAverage Payroll Per Job
Detroit
6
Chicago
5
Boston
4
New York
San Francisco
Washington DC
3
2
1
Dallas
8
Philadelphia
7
SCAGSCAG9

Persons in PovertyPersons in Poverty2006
Philadelphia
6
Chicago
5
New York
4
Dallas
3
Detroit
2
SCAGSCAG1
Boston
8
San Francisco
7
Washington DC
9

HomeownershipHomeownership2006
Dallas
6
Boston
5
Washington DC
4
Chicago
3
Philadelphia
2
Detroit
1
SCAGSCAG8
San Francisco
7
New York
9

Housing Cost BurdenHousing Cost Burden
Detroit
6
Boston
5
Chicago
4
New York
3
San Francisco
2
SCAGSCAG1
Washington DC
8
Philadelphia
7
Dallas
9

Median Home Price Median Home Price (Existing Single- Family Homes in Current Dollars)
0
100
200
300
400
500
600
700
800
'90 '91 '92 '93 '94 '95 '96 '97 '98 '99 '00 '01 '02 '03 '04 '05 '06
(Tho
usan
d D
olla
rs)
OrangeVentura
LosAngeles
Riverside/San Bernardino
Source: California Association of Realtors and DataQuick Information Systems
Imperial

Housing AffordabilityHousing Affordability
0
10
20
30
40
50
60
70
80
2003 2004 2005 2006
(Per
cent
)
Source: California Association of Realtors
U.S.
San BernardinoRiverside
Ventura
Los AngelesOrange
Percent of for First-time BuyersWho Can Afford to Purchase a
Home at 85% of the Median Price
Imperial

0200400600800
1,0001,2001,4001,6001,800
Los Angeles Orange Riverside San Bernardino Ventura
(2001 – 2006 Current Dollars)
Source: Real Estate Research Council of Southern CaliforniaImperial County data not available
Average Monthly Rent Average Monthly Rent

HOUSINGHOUSINGC-C- C-C- C-C- D+D+ D+D+ DD DD DD

Average gasoline
price rose to $2.80
The highest since 1970

Decline in Vehicle Miles Traveled per Household

Highest Transit
BoardingsSince 2000

D+2002
MOBILITYMOBILITYDD DD DD DD D-D- D-D- FF FF

14% VMT Growth
14% VMT Growth
2000-2006

We Have An Air Quality
Crisis
We Have A Health Crisis

Ventura
Los Angeles
Orange
Imperial
Riverside
San BernardinoSouth
Coast Air Basin
FederalNon-AttainmentArea for PM 2.5
Residents of the South Coast Air Basin
are exposed to 52% of the national exposure of PM2.5
above the federal health based standards

5,400 Premature Deaths Annually140,000 Children Have Asthma
980,000 Lost Work Days

Burning of fossil fuels for mobile sources is responsible for 85% of total NOx emissions

D+2002
AIR QUALITYAIR QUALITYCC B-B- BB B-B- CC C-C- CC CC

Continued Reliance on Fossil FuelsContinued Reliance on Fossil Fuels
86% of total energy consumption
M:\Chang\SOR 2007 Charts\Charts\Environment\Sourc
es of Energy xls;Chart1
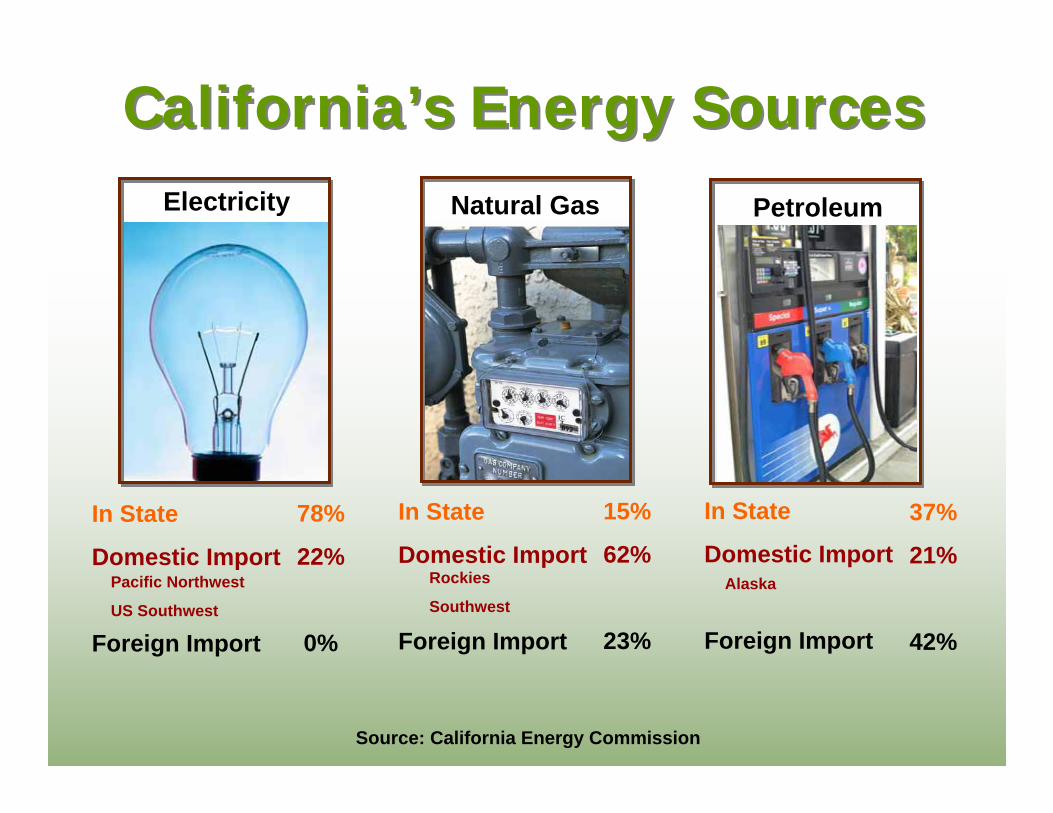
In State
Domestic Import
Foreign Import
In State
Domestic Import
Foreign Import
In State
Domestic Import
Foreign Import
California’s Energy SourcesCalifornia’s Energy Sources
78%
22%
0%
Source: California Energy Commission
Pacific Northwest
US Southwest
Rockies
SouthwestAlaska
Electricity Natural Gas Petroleum
15%
62%
23%
37%
21%
42%

Electricity Generation by SourceElectricity Generation by Source
40%
Natural Gas
21%
Coal
15%
Nuclear
14%
Renewable
10%
Hydro

California is 16th largest source of climate change emissions in the world

The Path ForwardThe Path Forward

Maximize mobility and accessibility for all people and goods in the region
Ensure travel safety and reliability
Preserve and ensure a sustainable regional transportation system
Maximize productivity of the system
Protect the environment, improve air quality and promote energy efficiency
Encourage land use and growth patterns that complement our transportation investments

Increase housing units relative to population and jobs
Increase transit oriented development
Reduce vehicle miles traveled per household by 10%
Reduce fossil fuel consumption by 25% from 1990 levels by 2020
Increase the share of renewable energy generation to 20% by 2010 and 30% by 2020
Increase green/sustainable building practices

The State of the Region
2007
The State of the Region
2007
www.scag.ca.gov
Full Report and PlansFull Report and Plans