The state of the cities in Brazil - Cities Alliance Home Page · Raquel Rolnik, with the support of...
62
Transcript of The state of the cities in Brazil - Cities Alliance Home Page · Raquel Rolnik, with the support of...


The state of the cities in Brazil THE 2000-2009 REPORT
Executive Coordination
General Coordination

FACT SHEET REPORT THE STATE OF THE CITIES IN BRAZIL GENERAL COORDINATION
Cities Alliance: Ana Claudia Rossbach and Mariana Kara José Ministry of the Cities, National Housing Department: Inês da Silva Magalhães Ministry of the Cities, National Department for Urban Programs: Celso Carvalho Caixa Econômica Federal: Maria Teresa Peres de Souza National Front of Mayors (FNP): João Coser and Marcelo Cândido Brazilian Municipalities Association (ABM): José Carlos Rassier World Bank: Ming Zhang and Sameh Naguib Wahba UN Human Settlements Program (UN-Habitat), Regional Office for Latin America and the Caribbean: Alberto Paranhos and Frédéric Saliez Inter-American Development Bank (IDB): Eduardo Figueroa and Fernanda Magalhães
TECHNICAL REPRESENTATIVES
Ana Claudia Rossbach and Mariana Kara José (Cities Alliance); Júnia Santarosa and Julia Lins Bittencourt (Ministry of the Cities – National Housing Department); Daniel Todtmann Montandon (Ministry of the Cities – National Department for Urban Programs); Carlos de Faria Coelho de Sousa (Caixa Econômica Federal); Rafael Guimarães, Gilberto Perre and Miguel Reis Afonso (National Front of Mayors – FNP); Jennifer J. Sara, Juliana Garrido, Sameh Naguib Wahba, Catherine Lynch and Ming Zhang (World Bank); José Carlos Rassier (Brazilian Municipalities Association– ABM), Alberto Paranhos and Frédéric Saliez (UN-Habitat); Fernanda Magalhães (BID).
EXECUTIVE COORDINATION PÓLIS INSTITUTE
General Executive Coordination: Nelson Saule Júnior Assistant Executive Coordinators: Renata Milanesi and Fernando Bruno Executive Secretary: Beatriz Rufino General Technical Coordination: Raquel Rolnik Assistant technical coordinators: Danielle Klintowitz, Frederico Ramos, Paula Freire Santoro and Vanessa Marx Data bank conception and production coordination: Frederico Ramos
Theme axes
Household Conditions in Brazilian Municipalities: Raquel Rolnik (consultant); Danielle Klintowitz and Paula Freire Santoro (technical team).Local economic dynamics: Jeroen Klink (consultant); Renata C. Boulose, Frederico Ramos (technical team). Financing of Urban development: François Bremaeker (consultant); Paulo Sandroni (contributor); Beatriz Rufino, Danielle Klintowitz, Kazuo Nakano and José Augusto Ribeiro (technical team). Public administration: Vanessa Marx (consultant); Ana Cláudia Teixeira and Osmany Porto (technical team). Urban network, General Context, Classification into categories and Conclusions: Raquel Rolnik (coordination); Danielle Klintowitz, Frederico Ramos, Kazuo Nakano and Paula Santoro (technical team). Interns: João Avelino and Bruno Corrêa. Exploratory research: Venturi Associados Consultoria em Pesquisa. Coordinators: Gustavo Venturi (consultant) and Wagner Rosas.
CONTRIBUTING INSTITUTIONS Associação Nacional dos Transportes Públ icos (ANTP); Banco Nacional de Desenvolvimento Econômico e Social (BNDES); Centro Brasileiro de Análise e Planejamento (Cebrap); Centro de Estudo das Metrópoles (CEM -Cebrap); Centro de Desenvolvimento e Planejamento Regional de Minas Gerais (Cedeplar); Fundação Getúlio Vargas - São Paulo (FGV/SP); Fundação Prefeito Faria Lima(Cepam); Fundação S is tema Estadual de Anál ise de Dados (Seade); Ins t i tuto de
Pesquisa e Planejamento Urbano e Regional (Ippur/UFRJ); Instituto Brasileiro de Administração Municipal (Ibam); Instituto Brasileiro de Geografia e Estatística (IBGE); Instituto de Pesquisa Econômica e Aplicada (Ipea); Instituto Florestan Fernandes (IFF); Instituto Latino-Americano das Nações Unidas para Prevenção do Delito e Tratamento do Delinquente (Ilanud); Instituto Paranaense de Pesquisa e Desenvolvimento Socio-Economico (Ippardes); Laboratório de Habitação e Assentamentos Humanos - Universidade de São Paulo (Labhab/FAUUSP); Laboratório de Análise da Violência - Universidade Estadual do Rio de Janeiro (UERJ); Instituto Paranaense de Desenvolvimento Econômico e Social (Ipardes); Núcleo de Estudos da População (Nepo/Unicamp); Rede de Olho nos Mananciais; Universidade Federal de Minas Gerais (UFMG); Observatório das Metrópoles - Universidade Federal de Pernambuco (UFPE); Oficina Municipal.
SPECIALISTS PARTICIPATING IN WORKSHOPS Ailton Brasiliense Pires (ANTP); Alberto Jakob (Nepo/Unicamp); Ciro Biderman (FGV); Cleandro Krause (Ipea); Eduardo Marques (CEM/Cebrap); Haroldo Torres (Cebrap); Eduardo Vasconcelos (ANTP); Érika Araújo; Evangelina de Oliveira (IBGE); Giorgio Romano (Aliança das Cidades); Graça das Neves (Ibam); Henrique Barandier (Ibam); Ignacio Cano (UERJ); Jan Bitoun (Observatório das Metrópoles - UFPE); José Mario Brasiliense (Oficina Municipal); Ligia Duarte (Seade); Liana Carleial (Ipea); Marcelo Pitta (Seade); Marcelo Ribeiro (Observatório das Metrópoles - Ippur); Marco Aurélio Costa (Ipea); Marcos Bicalho (ANTP); Maria Lucia Rafinetti Martins (Labhab/FAUUSP); Maria Teresa Augusti (IFF); Mariana Moreira (Cepam-SP); Marta Arretche (CEM/Cebrap); Marussia Whately (Rede de Olho nos Mananciais); Miguel Matteo (Ipea); Mitti Koyama (Seade); Nabil Bonduki (FAUUSP); Paula Miraglia (Ilanud); Paulo Januzzi (Seade); Peter Spink (FGV-EAESP); Ricardo Henriques (BNDES); Roberto Pires (Ipea); Rodrigo Simões (Cedeplar - UFMG); Rosa Moura (Ippardes/ Sedurb-Paraná); Sol Garson (Observatório das Metrópoles - UFRJ); Vânia Pacheco (IBGE).
PRODUCTION OF PAPERS SUPPORTING THE PREPARATION OF THE REPORT Household adequacy conditions by Alberto Jakob (Nepo/Unicamp). Building and using synthetic indicators in social urban policies by Haroldo Torres (Cebrap) and Maria Paula Ferreira (Seade). Security and cities: notes on the theoretical and institutional framework and possible indicators by Ignácio Cano (Laboratório de Análise da Violência – LAV/UERJ), Paula Miraglia (Illanud) and Eduardo Ribeiro (Laboratório de Análise da Violên-cia – LAV/UERJ). The meaning of a sample for the report State of the World’s Cities by Jan Bitoun (UFPE – Observatório das Metrópoles). The municipalities’ GDP as indicator of the productive profile of Brazilian munici-palities by Ligia Duarte and Andréia Ferreira (Seade). Estimation of the Number of Inadequate Households by Marcelo Pitta e Mitti Koya-ma (Seade). Brazilian Urban Mobility by Eduardo Vasconcellos, Adolfo Mendonça and Marcos Bicalho (ANTP). Public administration variables by Roberto Pires (UFMG). The population’s pendular movements: information necessary for classifying cities into categories by Rosa Moura (Observatório das Metrópoles –Ippardes/Secretaria de Estado de Desenvolvimento Urbano, Paraná). Management capacity as strategic competence for governmental action and its indicators and its relation with the contents of the report State of the World’s Cities in Brazil by Maria Teresa Augusti (IFF). Contributions on the analytical model, methodology and strategy for consolidat-ing cross-analyzing data by Marta Arretche and Eduardo Marques (CEM-Cebrap).

CHAPTER 1 URBAN NETWORK IN BRAZIL CHAPTER 2 HOUSEHOLD CONDITIONS IN BRAZILIAN MUNICIPALITIES
CHAPTER 3 LOCAL ECONOMIC DYNAMICS CHAPTER 4 FINANCING THE URBAN DEVELOPMENT IN MUNICIPALITIES CHAPTER 5 MUNICIPAL MANAGEMENT OF THE URBAN DEVELOPMENT
FINAL NOTES
10
16
29
38
46
55
Summary

T
6 STATE OF THE CITIES REPORT
* Initially, also the National Confedera-tion of Municipalities (CNM) took part as proponent, but then in July 2009 they decided to keep away from the Project. ** The full list of the technical team, consultants, participating institutions, specialists involved in workshops and the production of papers, date of the encounters and participants can be found in the project’s fact sheet.

STATE OF THE CITIES REPORT 7

8 STATE OF THE CITIES REPORT

STATE OF THE CITIES REPORT 9

1 The studies that have preceded this Re-port and inspired its methodology were: “Trends and perspectives of Brazil’s urban network” (Ipea-Nesur/Unicamp/IBGE1999); “New Brazil’s economic geography: a re-gionalization proposal based on economic hubs and their areas of influ-ence” (Cedeplar/UFMG, 2000); and “Typology of Brazilian cities” (Ministry of the Cities/Fase/UFPE, 2005).
2 The study Areas of Influence of Cities (Regic) updates a series of studies on the Brazilian urban network and hierarchy that have been prepared by the Institute since the 1970s.
3 The study Territorial Dimension for Plan-ning contains a series of diagnoses on the present territorial situation and assesses opportunities and risks related to develop-ment. In this study, the identification of the country’s big social and economic contrasts is the first step towards formulating strategic policies aiming at reducing these inequali-ties and promoting an even economic development.
10 STATE OF THE CITIES REPORT
CHAPTER 1 URBAN NETWORK IN BRAZIL

MAP 1 Urbanization rates and urban networks (2000)
Source: IBGE, 2000 Census, and Regic, 2007.
STATE OF THE CITIES REPORT 11

MAP 2 Brazil urban network – Regic (2007)
Source: Regic-IBGE 2007.
12 STATE OF THE CITIES REPORT

BIG URBAN POLES (G1) –
PERIPHERY OF BIG POLES (G1p) –
REGIONAL URBAN POLES (G3) –
PERIPHERY OF REGIONAL POLES (G3p) –
BIG ISOLATED CITIES (G5) –
SUB-REGIONAL CENTERS (G6) –
LOCALITIES (G7) –
STATE OF THE CITIES REPORT 13

MAP 3 Territories of the National Development Strategy
Source: MPOG-CGEE, 2008.
14 STATE OF THE CITIES REPORT

Groups of cities Amazon Center-West Center-North NE Semiarid South Southeast N/NE Coastline Grand Total Big Urban Poles (G1) 4 12 18 62 23 119
Periphery of Big Poles (G1p) 1 5 8 33 11 58
Regional Urban Poles (G3) 2 2 8 19 42 17 90
Periphery of Regional Poles (G3p) 3 20 23 12 58
Big Isolated Cities l (G5) 4 5 5 6 8 12 2 42
Sub-regional Centers (G6) 18 96 62 142 168 177 62 725
Localities (G7) 148 459 350 991 947 1081 495 4471
Grand Total 177 579 417 1150 1188 1430 622 5563
MAP 4 Territories proposed by the Report
TABLE 1 Distribution of Brazilian municipalities by groups and territories
STATE OF THE CITIES REPORT 15
Source: MPOG-CGEE, 2008.
Source: MPOG-CGEE, 2008.

4 The methodology for building the household adequacy indicator was originally developed in 1996 from data obtained by the Regional Household Sample Survey, which was coordinated by Neide Patarra and enhanced for the 1991 and 2000 Census by Aurílio Caiado, with the support of Nepo-Unicamp. See: Aurílio S.C. Caiado, “Metropolis, medium-sized cities and small munic-ipalities of São Paulo: a comparative study on the quality of life and socio-spatial dynamics”. In: Neide Patarra et al. (Orgs.). Migrations, life condi-tions, and urban dynamics: São Paulo 1980-1993. Campinas: Insti-tute of Economics/Unicamp, 1997, v. 1, p. 115-152. The methodology was adjusted for the study Urban Land and Regulation for Popular Housing, prepared by the School of Architec-ture and Urbanism of the University of São Paulo and coordinated by Raquel Rolnik, with the support of Fapesp and the Lincoln Institute of Land Policy in 2009. For this Report, the data methodology and treatment were discussed and adapted in the workshops held with the group of specialists; these variables were discussed and adapted, and the data then processed by Nepo technical team.
16 STATE OF THE CITIES REPORT
CHAPTER 2 HOUSEHOLD CONDITIONS IN BRAZILIAN MUNICIPALITIES

TABLE 2 Adequacy criteria for each variable
Source: Own-prepared and based on IBGE 1991 and 2000 Census. Between parenthesis are the terms employed in this text.
STATE OF THE CITIES REPORT 17
VARIABLE CHARACTERISTIC
URBAN
RURAL
water supply (water) public u lity reaching at least one room
electric ligh ng (light) yes sanita on (sewer) public u lity waste (waste) directly collected by public service number of toilets (toilet) higher than 0 type of household (type) private permanent household loca on (loca on) outside the subnormal agglomerate dwellers per room (density) lower than or equal to 2
water supply
electric ligh ng
sanita on (sewer)
public u lity reaching at least one room well or spring with internal piping yes public u lity sep c tank directly or indirectly collected by public servisse burnt higher than 0 private permanent outside the subnormal agglomerate lower than or equal to 2
waste
number of toilets type of household household loca on dwellers per room

1991 2000
Brazil total households 35,43,416 45,506,983 Total adequate households 8,058,718 15,015,826 Percentage of adequate households 22.74% 33.00% Total municipalities with 0% adequate households 2,362 913 % of municipalities with 0% adequate households 52.61% 16.58% Maximum % of adequate households in one municipality 72.00% 87.20%
TABLE 3 Household adequacy conditions in Brazil (1991 and 2000)
Source: Own-prepared and based on IBGE 1991 and 2000 Census.
Source: Own-prepared and based on IBGE 1991 and 2000 Census.
PERIOD Big Poles in urban areas
(G1)
Periphery of Big Poles (G1p)
Urban Regional Poles (G3)
Periphery of Regional Poles
(G3p)
Big Isolated Cities (G5)
Sub-regional Centers
(G6)
Localities (G7)
1991 34.0% 21.6% 30.5% 21.0% 25.0% 17.8% 9.0%
2000 43.2% 24.3% 41.3% 30.7% 35.7% 32.1% 17.0%
TABLE 4 Average household adequacy percentage per groups of cities (1991 and 2000)
18 STATE OF THE CITIES REPORT

MAPS 5 AND 6 Percentage of adequate households
1991 2000
STATE OF THE CITIES REPORT 19
Source: Own-prepared and based on special tabulation of
data from IBGE 1991 and 2000 Census.

PERIODS Amazon Northeastern Semiarid
North/Northeast
South-Southeast South South-
Southeast Center-North
1991
2000
1.2%
7.0%
3.3%
12.9%
8.5%
18.2%
40.4%
51.6%
12.6%
26.2%
19.9%
27.3%
0.7%
2.0%
TABLE 5 Municipal household adequacy per Territory (1991 and 2000)
Source: Own-prepared and based on special tabulation of data from IBGE 1991 and 2000 Census.
MAP 7 Percentage variation of adequate households in Brazil (1991-2000)
Source: Own-prepared and based on special tabulation of data from IBGE 1991 and 2000 Census.
20 STATE OF THE CITIES REPORT

5 We consider as North the territories of Amazonas, the Northeastern Semiarid, the Center-North, and the North/Northeast Coastline.
.
STATE OF THE CITIES REPORT 21

MAPS 8 AND 9 Municipalities with adequate households higher than 30%
MAPS 10 AND 11 Municipalities with over 45% of households with only one inadequacy
1991 2000
1991 2000
Source: Own-prepared and based on IBGE 1991 and 2000 Census.
Source: Own-prepared and based on IBGE 1991 and 2000 Census.
. 22 STATE OF THE CITIES REPORT
MAPS 12 AND 13 Percentage of households with one and three inadequacies per municipality (2000)
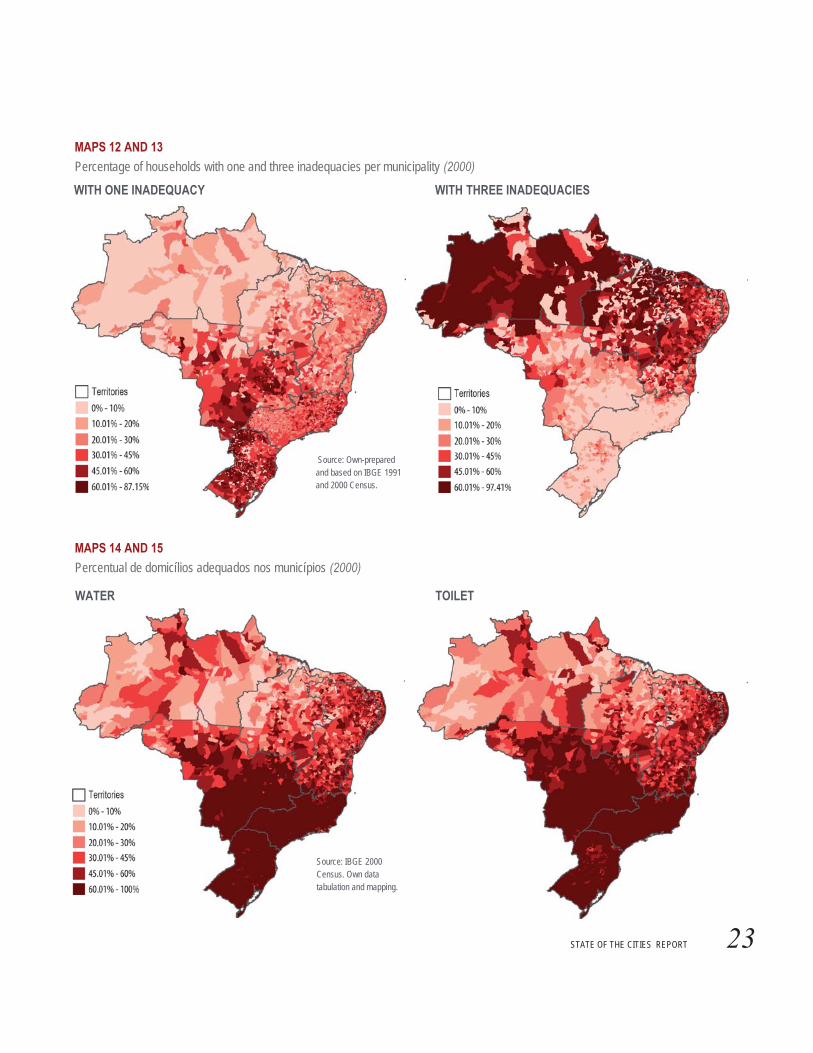
MAPS 14 AND 15 Percentual de domicílios adequados nos municípios (2000)
WITH ONE INADEQUACY WITH THREE INADEQUACIES
WATER TOILET
Source: Own-prepared and based on IBGE 1991 and 2000 Census.
Source: IBGE 2000 Census. Own data tabulation and mapping.
STATE OF THE CITIES REPORT 23

TABLE 6 Average household adequacy percentage in the Territories (2000 and 2008 estimation)
Source: Own-prepared and based on special estimation on the IBGE 2000 Census and IBGE PNAD 2008.
TABLE 7 Summary of urban and rural household adequacy conditions (1991 and 2000)
Source: Own-prepared and based on IBGE 1991 and 2000 Census.
24 STATE OF THE CITIES REPORT

MAPS 16 AND 17 Percentage of adequate households per municipality (2000)
MAPS 18 AND 19 Variation of the percentage of adequate households (1991-2000)
URBAN RURAL
URBAN RURAL
STATE OF THE CITIES REPORT 25
Source: Own-prepared and based on special tabulation of IBGE 2000 Census.
Source: Own-prepared and based on special tabulation of IBGE 1991 and 2000 Census. .

MAPS 20 AND 21 Percentage of adequate households in the municipalities with regard to electric lighting (2000)
MAP 22 Percentage of adequate households in the municipalities with regard to sewer network (2000)
URBAN RURAL
26 STATE OF THE CITIES REPORT
Source: Own-prepared and based on special tabulation of IBGE 1991 and 2000 Census.
Source: IBGE 2000 Census. Own tabulation.

TABLE 8 Variation of adequate households per variable (1991-2000)
Source: Own-prepared and based on special tabulation of data from IBGE 1991 and 2000 Census.
STATE OF THE CITIES REPORT 27

28 STATE OF THE CITIES REPORT

CHAPTER 3 LOCAL ECONOMIC DYNAMICS
CHART 1 Per capita GDP by city categories
CHART 2 Per capita GDP by Territories
Source: IBGE. 2002 Local GDP. Own preparation.
Source: IBGE. 2002 Local GDP. Own preparation.
STATE OF THE CITIES REPORT 29

6 When in this Report we mention municipalities with “(very) high” per capita GDP or economic dynamism we refer to the aggregation of munici-palities in the “high” and “very high” levels. Accordingly, when we employ the term “(very) low” we refer to the aggregation of levels “low” and “very low”.
30 STATE OF THE CITIES REPORT

MAP 23 Cities with (very) low per capita GDP and very high dynamism
MAP 24 Cities with very high per capita GDP and very high dynamism
MAP 25 Cities with (very) low per capita GDP and medium or (very) low dynamism
MAP 26 Cities with very high per capita GDP and average or very low dynamism
Source: IBGE, 2000 Census and Municipal GDP. Own preparation.
Source: IBGE, 2000 Census and Municipal GDP 2002-2006. Own preparation.
Source: IBGE, 2000 Census and Municipal GDP. Own preparation.
STATE OF THE CITIES REPORT 31
Source: IBGE, 2000 Census and Municipal GDP. Own preparation.

7 Regarding the specialization pattern, we used indicators consecrated in the relevant literature, such as the location quotient. The location quotient of sector “x” in city “y” ex-presses the participation of sector “x” in the economy of city “y”, on one side, against the participation of the same sector “x” in an economy of reference, such as Brazil’s. According to this criterion, a location quotient above 1 means specialization, and a quotient below 1 indicates low representation in the local economy. As main source of data for this analysis we used the RAIS-CAGED survey.
8 Being an indicator that expresses the weight of a given sector with regard to a local economy, the location quotient has some fragility both in very small and very complex local economies, as it exaggerates the degree of specialization in smaller local economies and tends to underestimate the specialization local metropolitan economies. For this rea-son, we have supplemented the location quotient of specialization with an indicator measuring concentration against a given variable (i.e., number of enterprises), as the participation of sector “x” of city “y” in sector “x” totals in the bigger economy of reference (i.e., Brazil’s). This variable may also be considered as proxy for the bargaining power of a given supply chain in the local territory (that is, highly concentrated sectors in certain cities would tend to have stronger bargaining power over local stakeholders).
9 Clélio C. Diniz, “Polygonal development in Brazil: nor decentralization nor continuous polarization”. Nova Economia magazine, v. 3, n.1 (Sep. 1993), p. 35-64.
32 STATE OF THE CITIES REPORT

MAP 27 Cities with concentration and specialization in the durable goods sector
Source: Own preparation. RAIS-CAGED.
MAP 28 Cities with concentration and specialization in the intermediate goods sector
MAP 29 Cities with concentration and specialization in the non-durable goods sector
MAP 30 Cities with concentration and specialization in the productive service sector
Source: Own preparation. RAIS-CAGED.
Source: Own preparation. RAIS-CAGED.
Source: Own preparation. RAIS-CAGED.
STATE OF THE CITIES REPORT 33

34 STATE OF THE CITIES REPORT

CHART 3
Variation of salaries per employee X Variation of per capita GDP in (very) low per capita GDP and much more dynamic cities (2002–2006)
Source: RAIS-CAGED (Salaries per employee) and IBGE (GDP).
CHART 4 Variation of salaries per employee X Variation of per capita GDP in (very) high per capita GDP and very dynamic cities (2002-2006)
Source: RAIS-CAGED (Salaries per employee) and IBGE (GDP). Own preparation.
CHART 5
Variation of salaries per employee X Variation of Per capita GDP in very low per capita GDP and medium and (very) low dynamic cities (2002-2006)
Source: RAIS-CAGED (Salaries per employee) and IBGE (GDP). Own preparation.
STATE OF THE CITIES REPORT 35

CHART 6
Variation of salaries per employee X Variation of per capita GDP in very high per capita GDP and medium and (very) low dynamism cities (2002-2006)
Source: RAIS-CAGED (Salaries per employee) and IBGE (GDP). Own preparation.
CHART 8
Percentage of household adequacy in (very) high per capita GDP and very dynamic cities
Source: IBGE 2000 Census. Own preparation.
CHART 10
Percentage of household adequacy in (very) low per capita GDP and very dynamic cities
Source: IBGE 2000 Census. Own preparation.
CHART 7
Cities specialized and concentrated in the durable goods sector Variation (Sal./emp.)/(GDP/cap.) – 2002-2006
Source: RAIS-CAGED (Salaries per employee) and IBGE (GDP). Own preparation.
CHART 9
Cities specialized and concentrated in intermediate goods
Source: IBGE 2000 Census. Own preparation.
36 STATE OF THE CITIES REPORT

STATE OF THE CITIES REPORT 37

CHAPTER 4 FINANCING THE URBAN DEVELOPMENT IN MUNICIPALITIES
10 The population data used herein are the IBGE estimations for the relevant periods.
11 Data referring to years 2002 through to 2008 were used taking into account the 4,298 municipalities that had submitted data in all the years of the period, a condi-tion required for comparison.
12 Tax revenues correspond to local gov-ernments’ own revenues that are directly related to eminently urban economic dy-namics, particularly to taxes such as IPTU and ITBI, which are taxes on the value of urban real estate, plus the ISS. These are the most significant tax sources for munici-pal governments.
13 The transfer revenues – revenues transferred from other governmental spheres – consist of statutory transfers (revenues transferred by the Federal Gov-ernment to states and municipalities in compliance with constitutional provisions), legal transfers (those included in specific laws), and discretionary transfers (non statutory ones).
14 Included in “other revenues” are contri-butions of equity, agricultural, industrial, and service nature; transfers from private institutions; active debt revenues, fines and delinquent interests; indemnifications and refunds, as well as current revenues and capital revenues (credit operations, aliena-tion of property, amortization of loans, capital transfers from private institutions, and other capital revenues).
38 STATE OF THE CITIES REPORT

CHARTS 11 AND 12
Distribution of municipalities according to per capita budg-etary revenues by category, by groups (2002-2004 and 2005-2008)
2002-2004
2005-2008
MAP 31 Municipalities according to per capita budgetary revenues (2002-2004)
Source: STN – Finbra, 2002-2004. Source: STN – Finbra,
2002-2008.
STATE OF THE CITIES REPORT 39

MAP 32
Distribution of municipalities according to percentage of tax revenues over budgetary revenues (2002-2004)
Source: STN – Finbra, 2002-2004.
CHARTS 13 AND 14 Distribution of municipalities ac-cording to percentage of tax reve-nues over budgetary revenues by categories, by groups (2002-2004 and 2005-2008)
2002-2004
2005-2008
Source: STN – Finbra, 2002-2008.
40 STATE OF THE CITIES REPORT

15 The preparation of the sample tried to ensure the representation of cities through-out Brazil’s regions regardless of size and location. All the cities in the highest levels of Regic and with more than 50,000 inhabit-ants were included, as well as at least one city of each metropolitan region with less than 20,000 inhabitants. The cities in the second level of Regic followed the same selection logic. For the intermediate and lower levels of the network, we based our criteria on the numerical proportionality regarding the entirety of Brazil’s municipali-ties. This way we determined that 10% of cities in the intermediate levels, and 5% of localities were selected for the sample to ensure a territorial representation propor-tional to the distribution of municipalities throughout the Territories. Initially, the report would base on this sample also taking into consideration the possibility of a survey. Later on, a decision to use perma-nent databases that are repeatable and universal was adopted.
STATE OF THE CITIES REPORT 41

CHART 15 OGU transfers to the sample municipalities per area of investment (2001-2008)
Source: Caixa Econômica Federal – 2001 to 2008.
CHART 16 Average per capita OGU transfers per groups of cities for sample municipalities
CHART 17
Source: Caixa Econômica Federal – 2001 to 2008.
Percent distribution of OGU per territories for sample municipalities
Source: Caixa Econômica Federal – 2001 to 2008.
42 STATE OF THE CITIES REPORT

STATE OF THE CITIES REPORT 43

CHART 18
Dispersion between the total per capita transfers and household adequacy percentages for sample municipalities
Source: Caixa Econômica Federal – 2001 to 2008; IBGE 2000 Census.
CHART 19
Participation of private, municipal, and state borrowers in total funding from Pró-moradia and Pró-saneamento (2001-2004 and 2005 -2008)
Source: Caixa Econômica Federal − 2001 to 2008.
44 STATE OF THE CITIES REPORT

CHART 20
Loan amounts released from the Pró-moradia and Pró-saneamento as taken by BNDES, state sanitation companies and state governments in operations with a single municipality, per groups of cities
CHART 21
Loan amounts released from the Pró-moradia and Pró-saneamento as taken by state governments and companies in operations with a single municipality, per Territory
Source: Caixa Econômica Federal, 2001 to 2008.
Source: Caixa Econômica Federal, 2001 to 2008.
STATE OF THE CITIES REPORT 45

Brazil’s municipalities – presence of urban management instruments (2001, 2006* and 2008)
CHAPTER 5 MUNICIPAL MANAGEMENT OF THE URBAN DEVELOPMENT
CHART 22
Source: Munic IBGE 2001, 2006 and 2008. * Data from the computerized real-estate records refers to 2006.
46 STATE OF THE CITIES REPORT

TABLE 9 Presence of urban policy management instruments (2001, 2006 and 2008)
Source: MUNIC-IBGE 2001, 2006 and 2008.
16 The Statute of the Cities approved in 2001 provided that any municipalities with more than 20,000 inhabitants and located in metropolitan regions and urban ag-glomerates should have a Master Plan approved until October 2006. The Minis-try of the Cities took the initiative so that municipalities could prepare their plans in partnership with the entities present at the Cities National Council. 17 The majority of the municipalities mandated by law that did not prepare their Master Plans are located in the Amazon or Northeastern Semiarid, and most of them are small municipalities.
STATE OF THE CITIES REPORT 47

48 STATE OF THE CITIES REPORT

MAPS 33 AND 34 Percentage of municipal employees with a college degree (2001 and 2008)
MAPS 35 AND 36 Existence of housing department in the municipality (2001 and 2008)
Source: Munic IBGE, 2001 and 2008.
2001 2008
2001 2008
Source: Munic IBGE, 2001 and 2008.
STATE OF THE CITIES REPORT 49

CHART 23 Variation of the participation channels, absolute number of municipalities (2001-2008)
Source: Munic IBGE 2001, 2006 and 2008.
18 The existence of participation chan-nels does not determine the quality of participation within the municipalities. The Munic has specific questions able to qualify the participation, such as the nature of the councils (whether supervis-ing, deliberative, regulatory), so we chose not to use this data as many municipalities did not answer to these questions.
50 STATE OF THE CITIES REPORT

CHARTS 24 AND 25 Presence of Housing Fund in the municipalities, per groups of cities (2001 and 2008)
2001 2008 2001
2008
Source: Munic IBGE, 2001 and 2008.
MAPS 37 AND 38 Municipalities with housing councils (2001 and 2008)
2001 2008
Source: Munic IBGE, 2001 and 2008.
STATE OF THE CITIES REPORT 51

MAPS 39 AND 40 Municipalities with environmental fund (2001 and 2008)
2001 2008
Source: Munic IBGE, 2001 and 2008.
52 STATE OF THE CITIES REPORT

TABLE 10
Federal Government investments and presence of urban policy councils (2001 and 2008)
Source: Munic IBGE 2001 and 2008.
STATE OF THE CITIES REPORT 53

TABLE 11 CAIXA transfers and presence of housing departments in sample municipali-ties that received housing transfers (2001 to 2004)
Source: Munic IBGE 2001 and 2004, and Caixa Econômica Federal.
TABLE 12
CAIXA transfers and presence of housing departments in sample municipali-ties that received housing transfers (2005 to 2008)
Source: Munic IBGE 2005 and 2008, and Caixa Econômica Federal.
54 STATE OF THE CITIES REPORT

FINAL NOTES
STATE OF THE CITIES REPORT 55

56 STATE OF THE CITIES REPORT

19 Ministry of the Cities, National Housing Department. Brazil Housing Deficit 2007. Brasília, 2009.
STATE OF THE CITIES REPORT 57

58 STATE OF THE CITIES REPORT

STATE OF THE CITIES REPORT 59

60 STATE OF THE CITIES REPORT

THE STATE OF THE CITIES IN BRAZIL THE 2000-2009 REPORT
Editorial Coordination: Paula Freire Santoro Text Review and Edition: Renato Cymbalista, Danielle Klintowitz Copydesking and Proofreading: Véra Maselli Graphic Project and Editing: Ana Cristina Silveira / AnaCê Design, Rosana Datri Cover: Ana Cristina Silveira / AnaCê Design Maps: Frederico Ramos and Paula Freire Santoro Report of the Cities Logo: Silvia Amstalden Translation: Mario Escaleira