The State of the California Walnut Industry
45
The State of the California Walnut Industry 2012 Extension Service Meetings
Transcript of The State of the California Walnut Industry

The State of the California Walnut Industry
2012 Extension Service Meetings

What does the CWB/CWC do?Board
• Production Research (5)
• Food Safety
• Grades & Standards
• Domestic Market Development
• Volume Control
• School Lunch Program Buys
Commission
• Health Research (74)
• Domestic & Export Market Development
• Educate government officials
• Trade Policy (KFTA)
• Regulatory Issues
• Intra Industry Communication
• Enter into multi‐year contracts

FOOD SAFETY

Food Safety Modernization Act(FSMA)
• FDA will issue Fresh Produce Rule in early 2012.
• FDA must have Public Comment Period
• Will Tree Nuts be Treated like Produce?
• What will be FDA’s Expectations?
• Quote: “will not require a business to hire a consultant or
3rd party to implement programs to comply with new law”.

Know Your GAP’s & GMP’s
Pre‐harvest: water, manure, animalsSalmonella and E. coli sources from Livestock/Wildlife feces
Keep Orchard clean and know your neighbors
Harvest: train your employeesHand washing and sanitation practicesEquipment cleaning steps
Watch for news about new regulations

Current Activities• Salmonella Survey #2
– Added E. coli O157:H7
– Increased sample size
– Will help with FDA’s Risk Based Science demands
• PPO Validation to FDA
• Antimicrobial wash tests
• Handlers Food Safety and Preventive Control Training in February Antimicrobial Wash Study

Direct Sales by Growers
• By pass the network– Against Federal Marketing Order
– Must have Walnuts inspected before leaving CA
• Fines of $1,100 per day/incident
– A Risk for Food Safety
• No Inspection
• No traceability
• In‐transit risk

If You Sell to Anyone Except a Handler . . . You Are Now a Handler!
• You have new reporting requirements!
– Receipts (including your own production)
– Assessments
– DFA Inspection/grading
– Risk as Seller

Production Research

Production Research
20Projects Funded
$1,036,515Spent on Projects in 2011/12

Production Research Studies• Genetic Improvement
• Rootstocks
• Water Management
• Orchard Management
• Flower & Fruit Development
• Tree Growth & Development
• Harvesting & Drying
• Walnut Husk Fly
• Codling Moth
• Walnut Aphid
• Post Harvest Pests
• Walnut Blight
• Phytophthora
• Crown Gall
• Nematodes
• Chemical Efficacy Tests
• Varietal Development
Last Year’s Published Research Available on CD

Trends

CA Walnut Production History
0
100
200
300
400
500
600
'02 '03 '04 '05 '06 '07 '08 '09 '10 '11*
Short
Tons (in
thousands)
Crop Year
*Estimate

Ending Inventory
0
10,000
20,000
30,000
40,000
50,000
60,000
70,000
80,000
'03 '04 '05 '06 '07 '08 '09 '10 '11*
ISE
Short
Tons
Crop Year
*Estimate

Domestic vs. Export Shipments
0
10
20
30
40
50
60
70
80
90
100
2002 2003 2004 2005 2006 2007 2008 2009 2010
Domestic Export
Percentage

Market Risk AssessmentUSA Germany China Turkey
High Disposable Income
Already Produce/Consume
Walnuts
High Population Density
High Nut Usage
Few Political Hurdles
Government Climate
Potential to Utilize Shelled Product
Large Food Processing Industry

Top 10 Markets By Shipments
‐
50
100
150
200
250
300
350
400
450
ISE
(million
pounds)
2006 2010
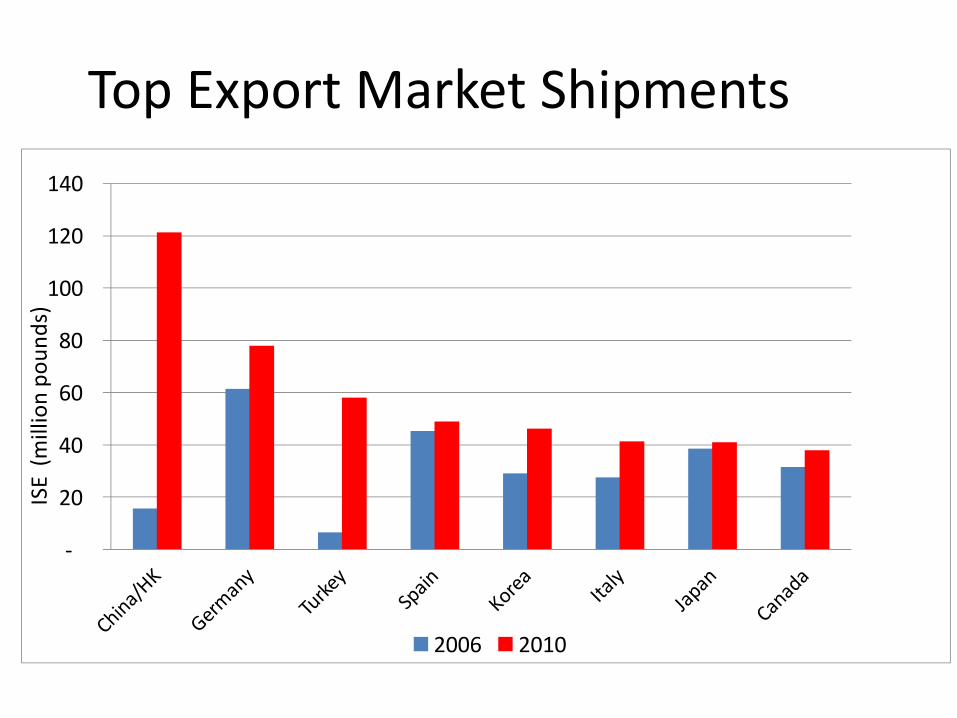
Top Export Market Shipments
‐
20
40
60
80
100
120
140
ISE
(million
pounds)
2006 2010

Walnuts Around The World

U.S. Market
2011 Attitude & Usage Data86% of consumers believe walnuts are healthy51% know walnuts contain omega‐3s (a 20% increase from 2009)85% of consumers would buy walnuts if they were shopping and walnuts were offered at a reasonable price
61% said they were buying walnuts more often than five years ago
Why? Nutrition and taste.
Primary Use – Baking (77%) and Snacking (74%)

We’ve got heart!
73% of primary grocery shoppers say the Heart‐Check mark improves the likelihood that they'll buy the product
68% of walnut consumers said it was important to them that walnuts carry the mark
CWB/CWC advertising and promotions
Available for handler use

New Print Advertising Campaign• Break‐through creative• Strong health message
• 57+ million circulation• January ‐ August• Key women’s publications
• Better Homes & Gardens• Martha Stewart Living• Real Simple
• Cooking Light• Health • Sunset • Food & Wine
• Eating Well
• Saveur

What MAP has done for Exports
• Established export markets
• Export growth 52,000 tons 1985 to 306,000 tons in 2010
• Catalyst
• Product Development

Germany
• Health Drives Media
• Walnuts were the only nut granted a specific claim in the European Union:“Walnuts contribute to the improvement of endothelium‐dependent vasodilation” (artery health), based on daily consumption of 30g of walnuts.
• Additional three generic claims

Spain
Super Twiggy

South Korea• Consumer Health Perceptions:
– Good for Brain/Cognitive Function – 73%
– Omega‐3’s – 71%
– Good for your Heart – 69%
– Reduce Cholesterol – 66%
• Scientific Advisory Council Meeting

Health Research

74 Published Studies
• Recently Published– UC Davis (Davis) – Prostate Cancer– Scranton (Vinson) ‐ Antioxidants– Harvard (Mantzoros) – Metabolic Syndrome
• In Progress (26)– Cardiovascular – Cancer – Cognitive Function – Diabetes – Male Reproductive Health – Weight Management

A Message from Dr. Michael Roizen
[VIDEO CLIP]

Grower Referendum
March 2012

The Economy’s Impact
• Budget Concerns– Federal Cut Backs
– States Lose
• Extension Service
• Production Research
• What else is at Risk for the Walnut Industry?

MAP, TASC, QSP & Block Grants
• Exports Have Grown
• 60% of 2010/11 Shipments
• 306,000 Tons
• MAP, etc.
• Right at $5 million
• Catalyst for Growth
• Opening New Markets

Maintain Health Research
• Key Program
• Expand Data Base
• Chronic Illness
• Cutting Edge
• Longer
• Larger
• Consumer Attitudes

CWC Assessment History
0
0.002
0.004
0.006
0.008
0.011987
1988
1989
1990
1991
1992
1993
1994
1995
1996
1997
1998
1999
2000
2001
2002
2003
2004
2005
2006
2007
2008
2009
2010
2011
Assessment R
ate
(Dollars)
Crop Year

Referendum VoteRaise CWC assessment cap from 1¢ to 1.75¢ (per inshell pound)
It is your Program
VOTE!
Ballots will be mailed to all growers at the beginning of March. Contact the CWC if you do not receive yours.

www.walnuts.org
• Reports
• Important Documents
• Industry Materials
• Important Links
• Meeting Information
• Handler List
• Industry Newsletters
• Logo Wear

Thank you!
California Walnut Commission
101 Parkshore Drive, Suite 250
Folsom, CA 95630
(916) 932‐7070
www.walnuts.org

APPENDIX

192 193
198 197200
204
210213 214 215 216
218
223227 227 227
45
50
55
60
65
70
170
180
190
200
210
220
230
240
96 97 98 99 00 01 02 03 04 05 06 07 08 09 10 11
Trees per Acre
Thousand
Acres
CALIFORNIA WALNUTS
Bearing Acreage vs. Bearing Trees per Acre, 1996‐2011
Bearing Acreage Bearing Trees Per Acre

Total Availability
0
100
200
300
400
500
600
06 07 08 09 10 11*
Tons (in
thousands)
Production Inventory
*Estimate

Shelled Shipments
‐
20
40
60
80
100
120
140
160
180
200
Pounds (in
Millions)
2006 2010

Shelled Shipments‐Export
‐
5
10
15
20
25
30
Pounds (in
millions)
2006 2010

Inshell Shipments
0
10
20
30
40
50
60
70
80
90
100
Pounds (in
millions )
2006 2010

Foreign Crop Production
0
100
200
300
400
500
600
700
800
China USA
Tons (In
thousands)
2005 2006 2007 2008 2009 2010 2011*
*Estimate

Foreign Crop Production
0
10
20
30
40
50
60
70
80
90
100
Chile France India Turkey
Tons
(in
thousands)
2005 2006 2007 2008 2009 2010 2011*
*Estimate