THE STATE OF RESTAURANT SUSTAINABILITY2018 · Restaurant Association, National Restaurant...
28
THE STATE OF RESTAURANT EDITION SUSTAINABILITY 2018
Transcript of THE STATE OF RESTAURANT SUSTAINABILITY2018 · Restaurant Association, National Restaurant...
THE STATE OF RESTAURANT
ED
ITIO
N
SUSTAINABILITY2018

TABLE OF CONTENTS
1
Overview
3
Energy & Water
9
Managing Waste
17
Consumer Insights
& Food Trends
22
Resources
23
Methodology
Print edition: 978-0-9978029-1-7
Digital edition: 978-0-9978029-2-4
Shared Vision of the National
Restaurant Association, National
Restaurant Association Educational
Foundation and Council of State
Restaurant Associations: We lead
America’s restaurant and foodservice
industry by elevating its prosperity,
prominence and participation, enhanc-
ing the quality of life for all we serve.
About the National Restaurant Association: Founded in 1919, the National Restaurant Association is the leading business association for the restaurant industry, which comprises more than 1 million restaurant and foodservice outlets and a workforce of 14.7 million employees. We represent the industry in Washington, D.C., and advocate on its behalf. We operate the industry’s largest trade show (NRA Show May 19-22, 2018, in Chicago); leading food safety training and certification program (ServSafe); and unique career-building high school program (the National Restaurant Association Educational Foundation’s ProStart). For more information, visit Restaurant.org.
About the National Restaurant Association Educational Foundation: As the philanthropic foundation of the National Restaurant Association, the NRAEF is dedicated to enhancing the industry’s training and education, career development and community engagement efforts. The NRAEF and its programs work to Attract, Empower and Advance today’s and tomorrow’s restaurant and foodservice workforce. NRAEF programs include: ProStart® — a high-school career and technical education program; Restaurant Ready — partnering with community-based organizations to provide “opportunity youth” with skills training and job opportunities; Military — helping military servicemen
and women transition their skills to restaurant and foodservice careers; Scholarships — financial assistance for students pursuing restaurant, foodservice and hospitality degrees; and the Hospitality Sector Registered Apprenticeship Project — providing a hospitality apprenticeship program for the industry. For more information, visit ChooseRestaurants.org
Facebook: WeRRestaurants
Twitter: @WeRRestaurants
ED
ITIO
N
THE STATE OF RESTAURANT
SUSTAINABILITY2018
Here’s what we found:
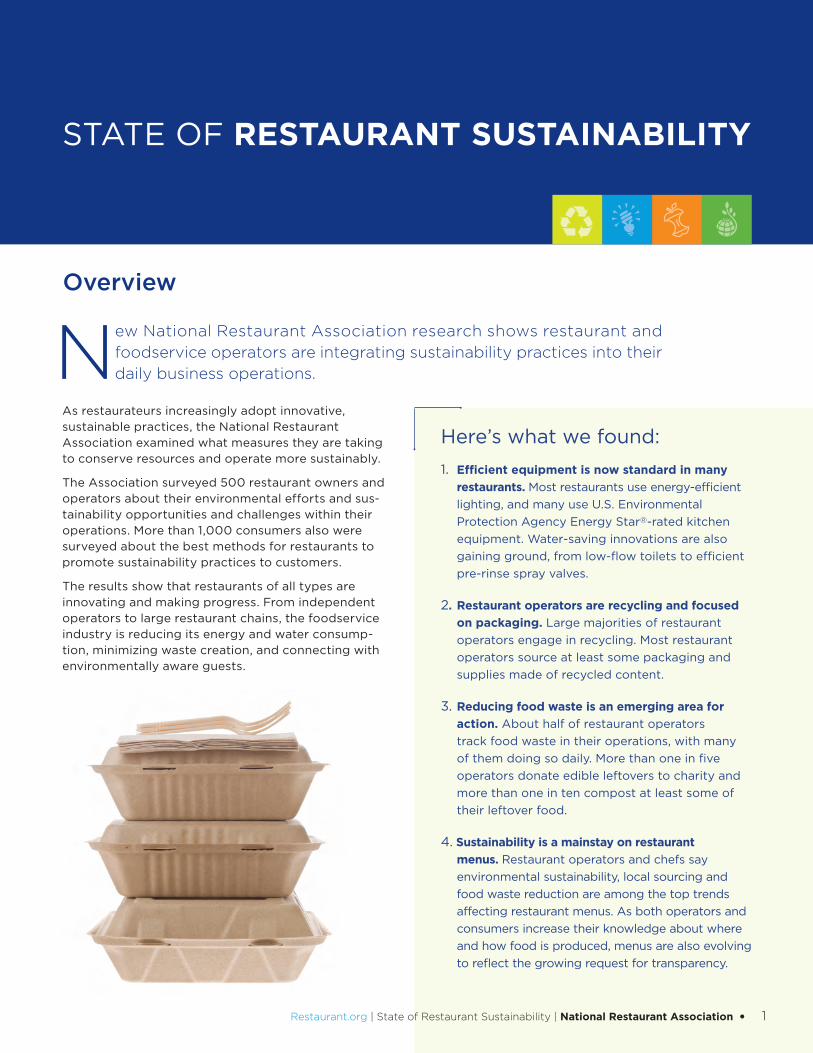
1. Efficient equipment is now standard in many
restaurants. Most restaurants use energy-efficient
lighting, and many use U.S. Environmental
Protection Agency Energy Star®-rated kitchen
equipment. Water-saving innovations are also
gaining ground, from low-flow toilets to efficient
pre-rinse spray valves.
2. Restaurant operators are recycling and focused
on packaging. Large majorities of restaurant
operators engage in recycling. Most restaurant
operators source at least some packaging and
supplies made of recycled content.
3. Reducing food waste is an emerging area for
action. About half of restaurant operators
track food waste in their operations, with many
of them doing so daily. More than one in five
operators donate edible leftovers to charity and
more than one in ten compost at least some of
their leftover food.
4. Sustainability is a mainstay on restaurant
menus. Restaurant operators and chefs say
environmental sustainability, local sourcing and
food waste reduction are among the top trends
affecting restaurant menus. As both operators and
consumers increase their knowledge about where
and how food is produced, menus are also evolving
to reflect the growing request for transparency.
New National Restaurant Association research shows restaurant and
foodservice operators are integrating sustainability practices into their
daily business operations.
As restaurateurs increasingly adopt innovative, sustainable practices, the National Restaurant Association examined what measures they are taking to conserve resources and operate more sustainably.
The Association surveyed 500 restaurant owners and operators about their environmental efforts and sus-tainability opportunities and challenges within their operations. More than 1,000 consumers also were surveyed about the best methods for restaurants to promote sustainability practices to customers.
The results show that restaurants of all types are innovating and making progress. From independent operators to large restaurant chains, the foodservice industry is reducing its energy and water consump-tion, minimizing waste creation, and connecting with environmentally aware guests.
STATE OF RESTAURANT SUSTAINABILITY
Overview
Restaurant.org | State of Restaurant Sustainability | National Restaurant Association • 1
Overview |
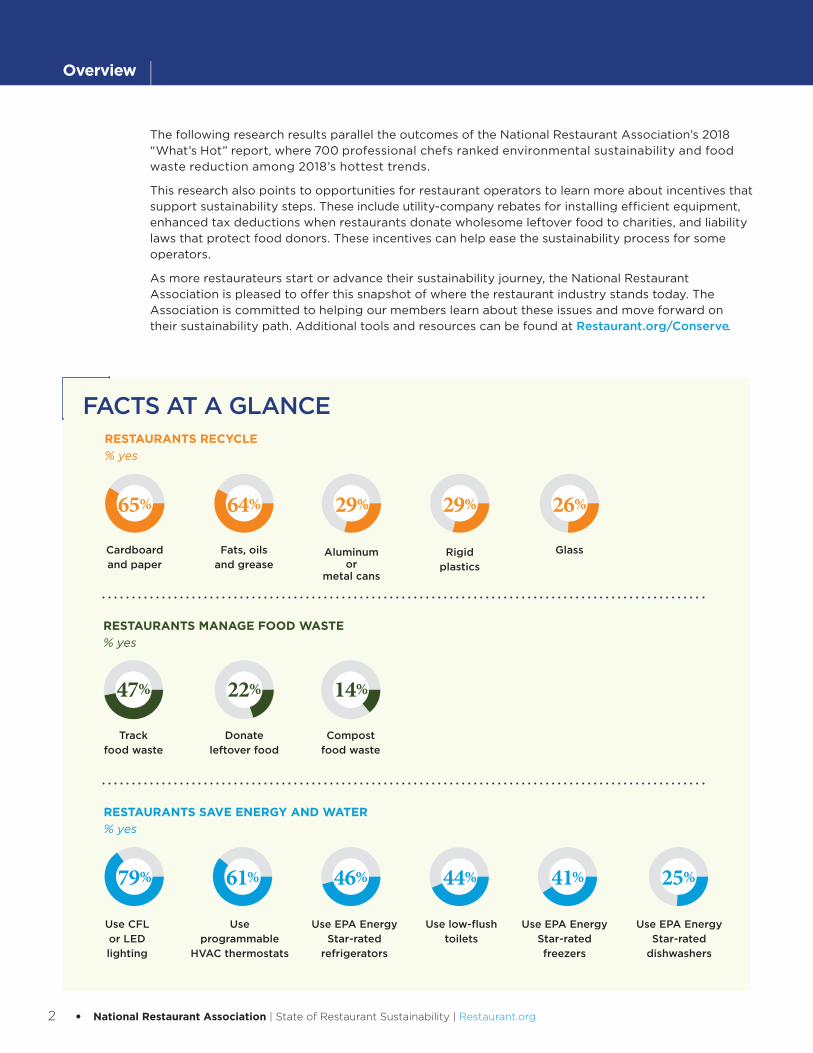
The following research results parallel the outcomes of the National Restaurant Association’s 2018 “What’s Hot” report, where 700 professional chefs ranked environmental sustainability and food waste reduction among 2018’s hottest trends.
This research also points to opportunities for restaurant operators to learn more about incentives that support sustainability steps. These include utility-company rebates for installing efficient equipment, enhanced tax deductions when restaurants donate wholesome leftover food to charities, and liability laws that protect food donors. These incentives can help ease the sustainability process for some operators.
As more restaurateurs start or advance their sustainability journey, the National Restaurant Association is pleased to offer this snapshot of where the restaurant industry stands today. The Association is committed to helping our members learn about these issues and move forward on their sustainability path. Additional tools and resources can be found at Restaurant.org/Conserve.
or
FACTS AT A GLANCERESTAURANTS RECYCLE
% yes
RESTAURANTS MANAGE FOOD WASTE
% yes
RESTAURANTS SAVE ENERGY AND WATER
% yes
Use CFL
or LED
lighting
Track
food waste
Cardboard
and paper
Use
programmable
HVAC thermostats
Fats, oils
and grease
Use EPA Energy
Star-rated
refrigerators
Aluminum or
metal cans
Use low-flush
toilets
Rigid
plastics
Use EPA Energy
Star-rated
freezers
Use EPA Energy
Star-rated
dishwashers
Glass
65% 64%
Compost
food waste
14%
61% 41%
29%
Donate
leftover food
22%
46% 25%
29% 26%
47%
79% 44%
2 • National Restaurant Association | State of Restaurant Sustainability | Restaurant.org
Restaurant.org | The State of Restaurant Sustainability | National Restaurant Association • 3
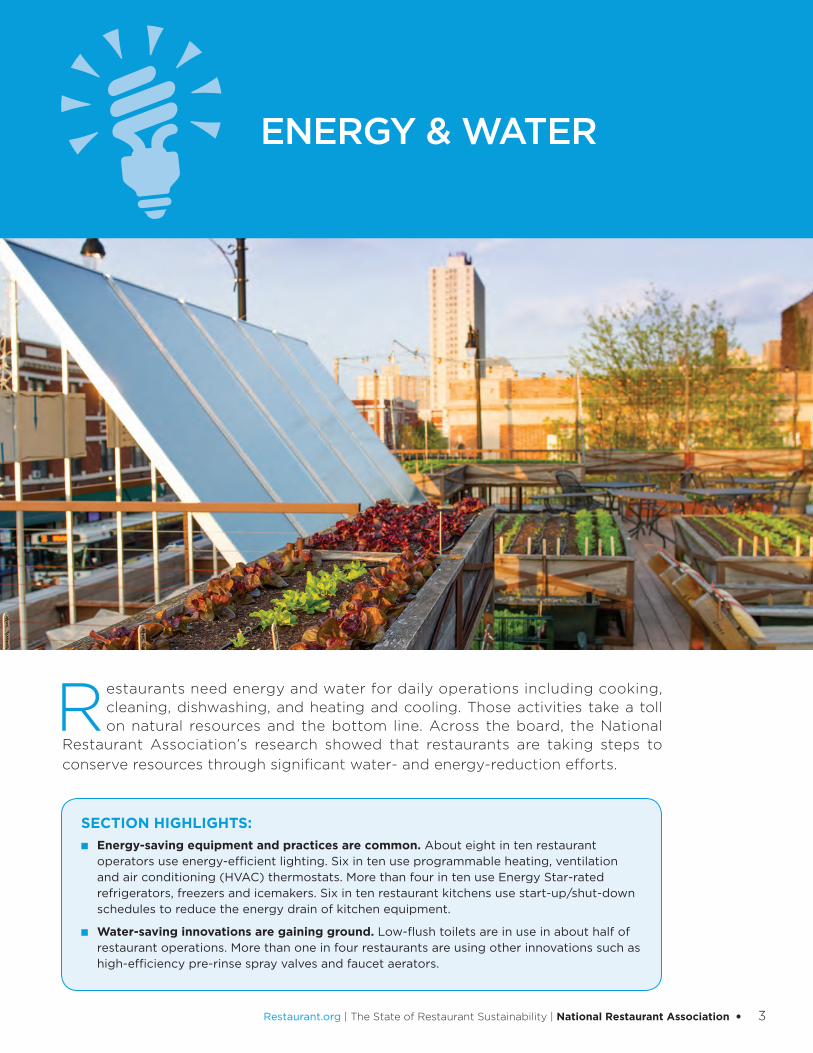
Restaurants need energy and water for daily operations including cooking, cleaning, dishwashing, and heating and cooling. Those activities take a toll on natural resources and the bottom line. Across the board, the National
Restaurant Association’s research showed that restaurants are taking steps to
conserve resources through signifi cant water- and energy-reduction efforts.
ENERGY & WATER
SECTION HIGHLIGHTS:
■ Energy-saving equipment and practices are common. About eight in ten restaurant operators use energy-effi cient lighting. Six in ten use programmable heating, ventilation and air conditioning (HVAC) thermostats. More than four in ten use Energy Star-rated refrigerators, freezers and icemakers. Six in ten restaurant kitchens use start-up/shut-down schedules to reduce the energy drain of kitchen equipment.
■ Water-saving innovations are gaining ground. Low-fl ush toilets are in use in about half of restaurant operations. More than one in four restaurants are using other innovations such as high-effi ciency pre-rinse spray valves and faucet aerators.
4 • National Restaurant Association | The State of Restaurant Sustainability | Restaurant.org
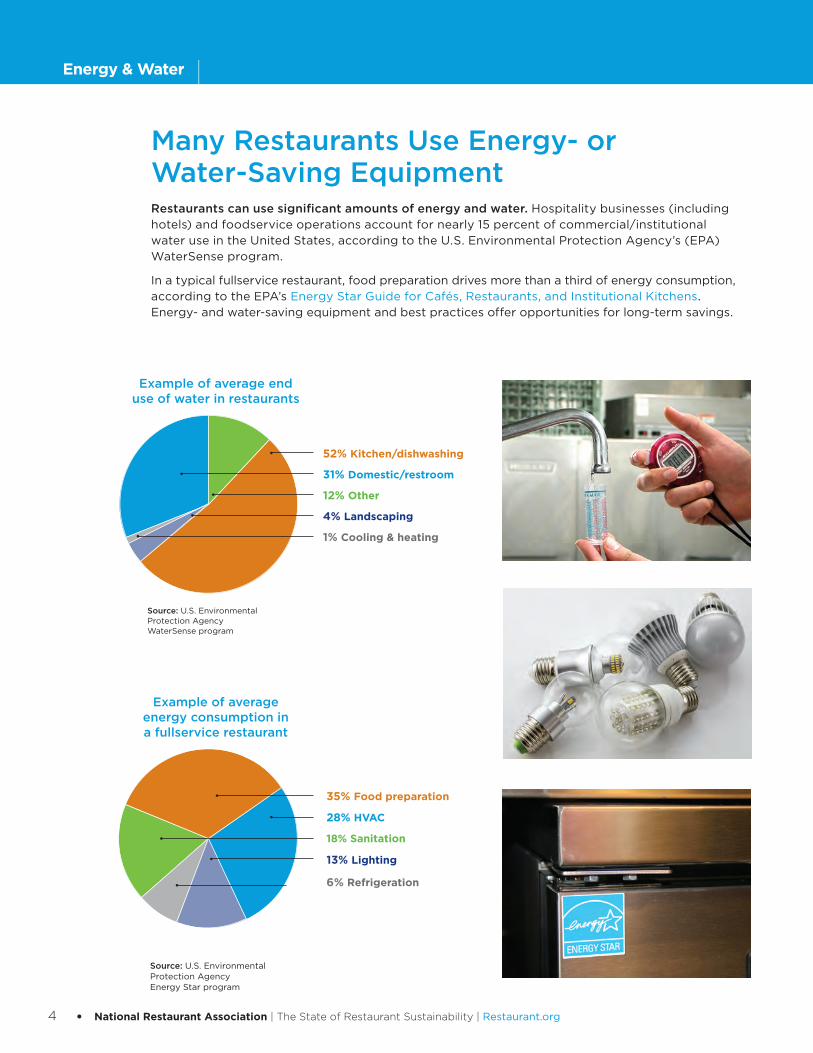
Many Restaurants Use Energy- or Water-Saving EquipmentRestaurants can use significant amounts of energy and water. Hospitality businesses (including hotels) and foodservice operations account for nearly 15 percent of commercial/institutional water use in the United States, according to the U.S. Environmental Protection Agency’s (EPA) WaterSense program.
In a typical fullservice restaurant, food preparation drives more than a third of energy consumption, according to the EPA’s Energy Star Guide for Cafés, Restaurants, and Institutional Kitchens. Energy- and water-saving equipment and best practices offer opportunities for long-term savings.
Example of average end use of water in restaurants
Example of average energy consumption in a fullservice restaurant
52% Kitchen/dishwashing
35% Food preparation
31% Domestic/restroom
28% HVAC
4% Landscaping
13% Lighting
12% Other
18% Sanitation
1% Cooling & heating
6% Refrigeration
Source: U.S. Environmental Protection Agency WaterSense program
Source: U.S. Environmental Protection Agency Energy Star program
Energy & Water |
Restaurant.org | The State of Restaurant Sustainability | National Restaurant Association • 5
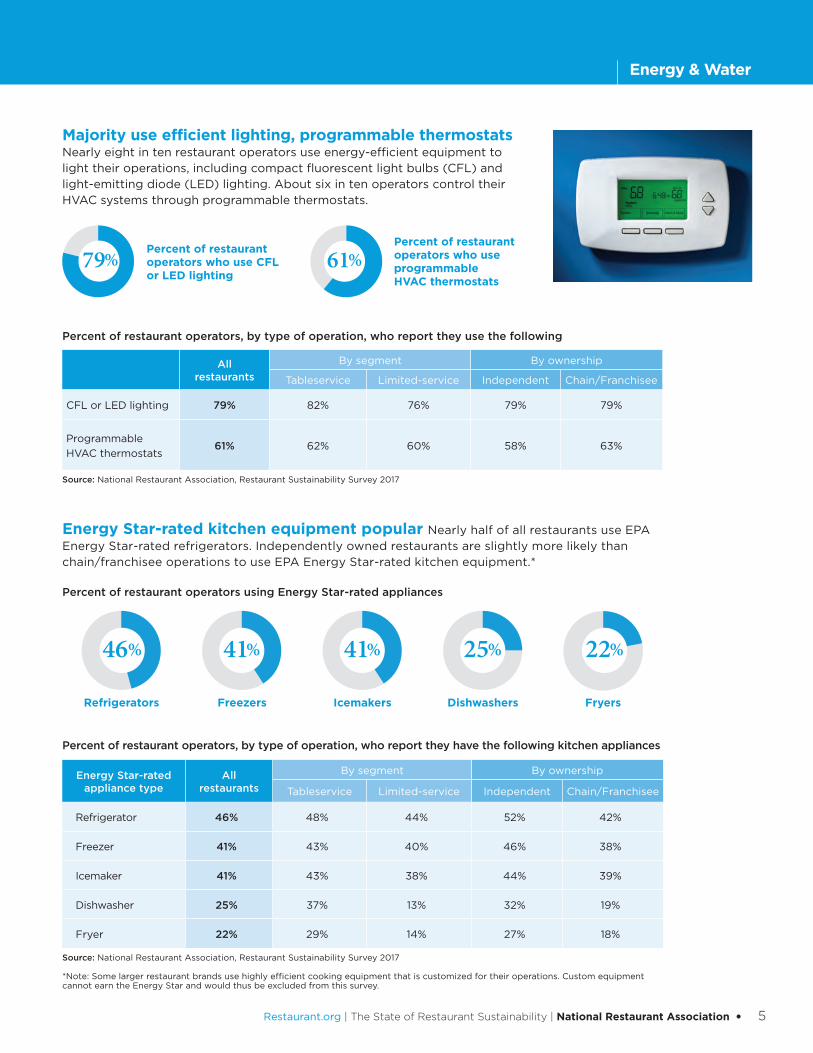
Majority use efficient lighting, programmable thermostats Nearly eight in ten restaurant operators use energy-efficient equipment to light their operations, including compact fluorescent light bulbs (CFL) and light-emitting diode (LED) lighting. About six in ten operators control their HVAC systems through programmable thermostats.
Percent of restaurant operators who use CFL or LED lighting
79%Percent of restaurant operators who use programmable HVAC thermostats
61%
Energy Star-rated kitchen equipment popular Nearly half of all restaurants use EPA Energy Star-rated refrigerators. Independently owned restaurants are slightly more likely than chain/franchisee operations to use EPA Energy Star-rated kitchen equipment.*
Percent of restaurant operators using Energy Star-rated appliances
Refrigerators Freezers Icemakers Dishwashers Fryers
41% 41% 25% 22%46%
Percent of restaurant operators, by type of operation, who report they have the following kitchen appliances
Energy Star-rated appliance type
All restaurants
By segment By ownership
Tableservice Limited-service Independent Chain/Franchisee
Refrigerator 46% 48% 44% 52% 42%
Freezer 41% 43% 40% 46% 38%
Icemaker 41% 43% 38% 44% 39%
Dishwasher 25% 37% 13% 32% 19%
Fryer 22% 29% 14% 27% 18%
Source: National Restaurant Association, Restaurant Sustainability Survey 2017
*Note: Some larger restaurant brands use highly efficient cooking equipment that is customized for their operations. Custom equipment cannot earn the Energy Star and would thus be excluded from this survey.
Percent of restaurant operators, by type of operation, who report they use the following
All restaurants
By segment By ownership
Tableservice Limited-service Independent Chain/Franchisee
CFL or LED lighting 79% 82% 76% 79% 79%
Programmable
HVAC thermostats61% 62% 60% 58% 63%
Source: National Restaurant Association, Restaurant Sustainability Survey 2017
| Energy & Water

6 • National Restaurant Association | The State of Restaurant Sustainability | Restaurant.org
Energy & Water |
Energy Star
■ Energy Star is the federal government symbol for energy efficiency since 1992 and offers tools for saving energy. EnergyStar.gov
■ The EPA rates more than 75 categories of home and commercial equipment, including commercial foodservice equipment and lighting. EnergyStar.gov/CFS EnergyStar.gov/Lighting
WaterSense
■ The WaterSense program launched in 2006. WaterSense is both a label for water-efficient products and a resource to manage water use.
■ WaterSense-labeled products and services are certified to use at least 20 percent less water than regular models. EPA.gov/WaterSense
EPA Energy Star and WaterSense Programs
Energy Star and WaterSense help businesses buy products that are independently certified as cost-saving solutions that help protect the environment.
Restaurant.org | The State of Restaurant Sustainability | National Restaurant Association • 7
| Energy & Water
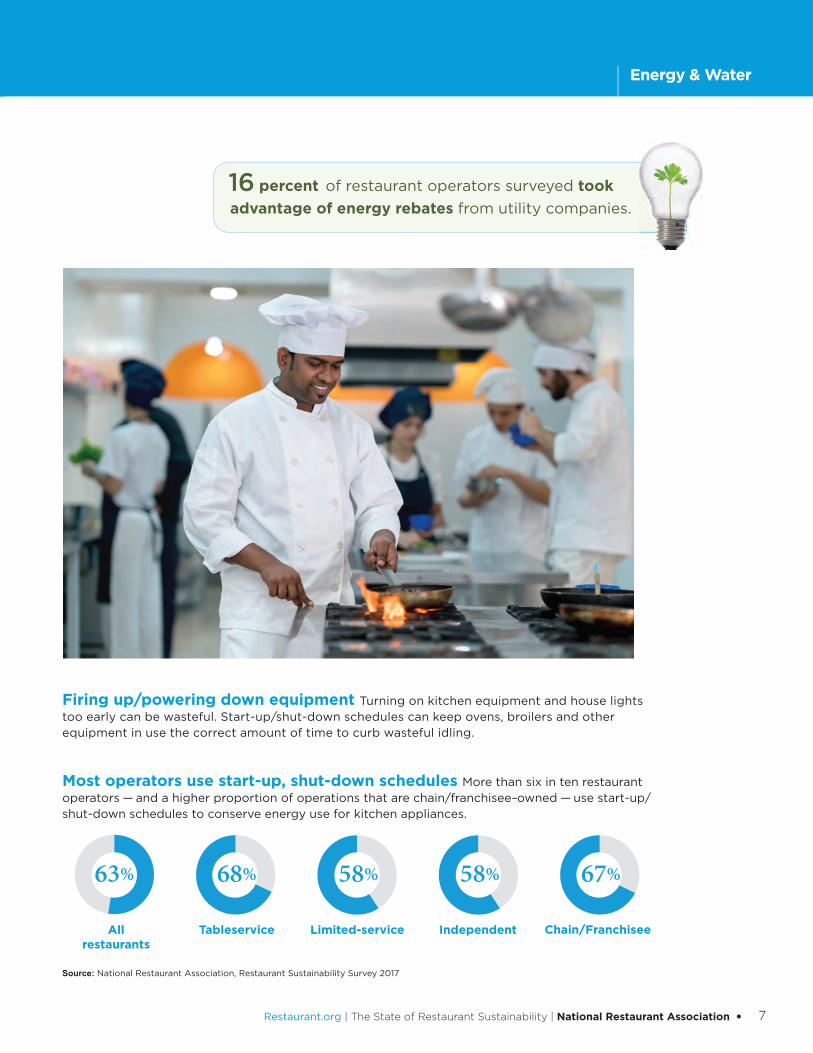
Firing up/powering down equipment Turning on kitchen equipment and house lights too early can be wasteful. Start-up/shut-down schedules can keep ovens, broilers and other equipment in use the correct amount of time to curb wasteful idling.
Most operators use start-up, shut-down schedules More than six in ten restaurant operators — and a higher proportion of operations that are chain/franchisee–owned — use start-up/shut-down schedules to conserve energy use for kitchen appliances.
58% 58%63% 68% 67%
TableserviceAll restaurants
Limited-service Independent Chain/Franchisee
Source: National Restaurant Association, Restaurant Sustainability Survey 2017
16 percent of restaurant operators surveyed took
advantage of energy rebates from utility companies.
8 • National Restaurant Association | The State of Restaurant Sustainability | Restaurant.org
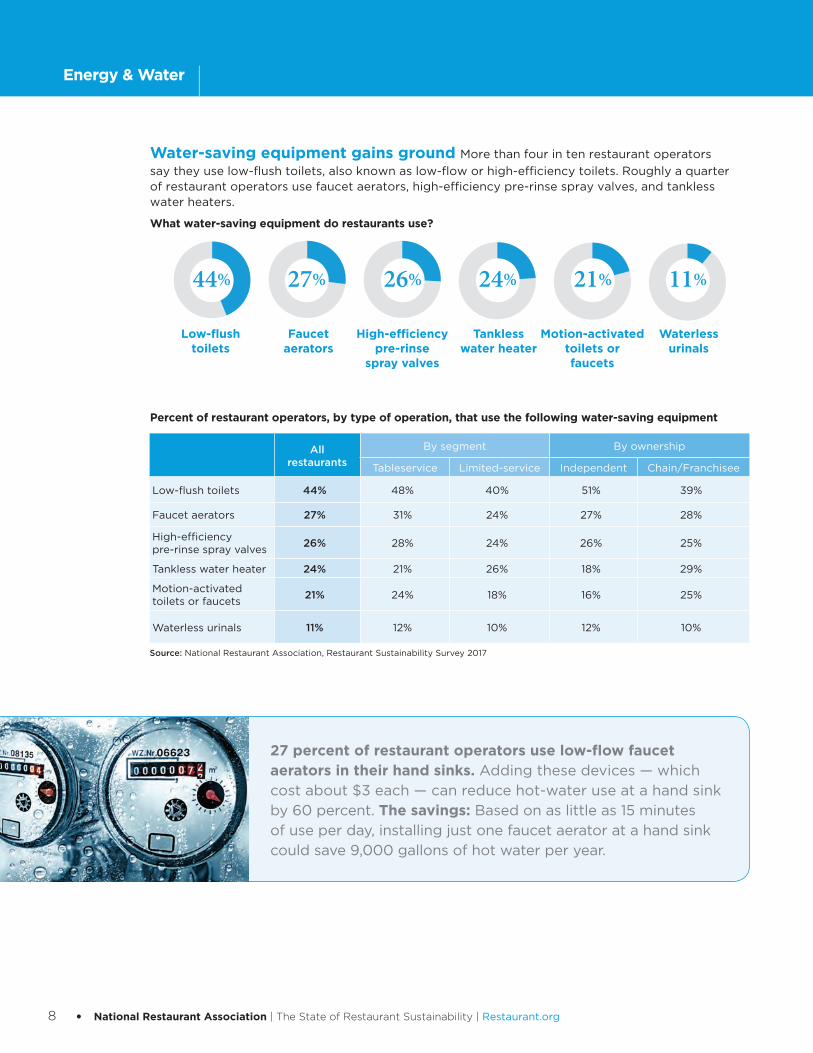
27 percent of restaurant operators use low-flow faucet aerators in their hand sinks. Adding these devices — which
cost about $3 each — can reduce hot-water use at a hand sink
by 60 percent. The savings: Based on as little as 15 minutes
of use per day, installing just one faucet aerator at a hand sink
could save 9,000 gallons of hot water per year.
Energy & Water |
Water-saving equipment gains ground More than four in ten restaurant operators
say they use low-flush toilets, also known as low-flow or high-efficiency toilets. Roughly a quarter of restaurant operators use faucet aerators, high-efficiency pre-rinse spray valves, and tankless water heaters.
What water-saving equipment do restaurants use?
44% 27% 26% 24% 21% 11%
Low-flush toilets
Faucet aerators
High-efficiency pre-rinse
spray valves
Tankless water heater
Motion-activated toilets or faucets
Waterless urinals
Percent of restaurant operators, by type of operation, that use the following water-saving equipment
All restaurants
By segment By ownership
Tableservice Limited-service Independent Chain/Franchisee
Low-flush toilets 44% 48% 40% 51% 39%
Faucet aerators 27% 31% 24% 27% 28%
High-efficiency pre-rinse spray valves
26% 28% 24% 26% 25%
Tankless water heater 24% 21% 26% 18% 29%
Motion-activated toilets or faucets
21% 24% 18% 16% 25%
Waterless urinals 11% 12% 10% 12% 10%
Source: National Restaurant Association, Restaurant Sustainability Survey 2017
Restaurant.org | The State of Restaurant Sustainability | National Restaurant Association • 9
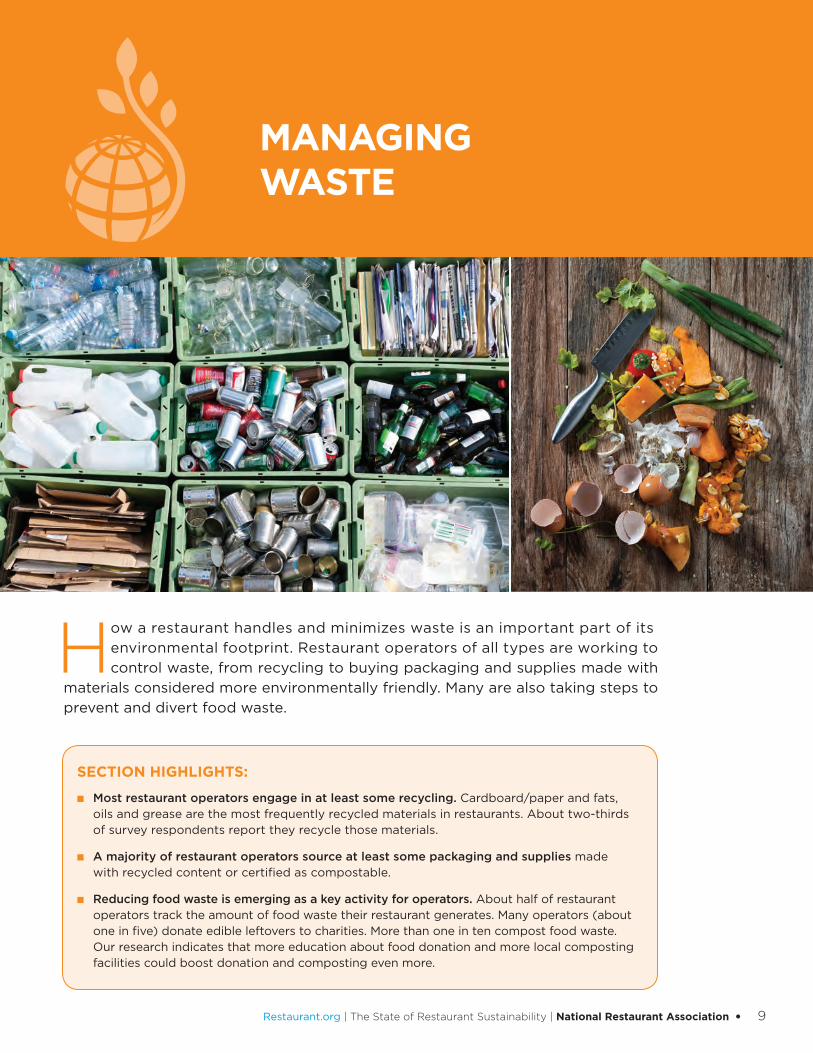
How a restaurant handles and minimizes waste is an important part of its
environmental footprint. Restaurant operators of all types are working to
control waste, from recycling to buying packaging and supplies made with
materials considered more environmentally friendly. Many are also taking steps to
prevent and divert food waste.
MANAGING WASTE
SECTION HIGHLIGHTS:
■ Most restaurant operators engage in at least some recycling. Cardboard/paper and fats, oils and grease are the most frequently recycled materials in restaurants. About two-thirds of survey respondents report they recycle those materials.
■ A majority of restaurant operators source at least some packaging and supplies made with recycled content or certified as compostable.
■ Reducing food waste is emerging as a key activity for operators. About half of restaurant operators track the amount of food waste their restaurant generates. Many operators (about one in five) donate edible leftovers to charities. More than one in ten compost food waste. Our research indicates that more education about food donation and more local composting facilities could boost donation and composting even more.

10 • National Restaurant Association | The State of Restaurant Sustainability | Restaurant.org
RecyclingRecycling is a smart way to minimize waste. It transforms waste into a renewable resource, diverts material from landfill, and can bring down a restaurant’s waste-hauling fees. It also requires a supportive local infrastructure — which, unfortunately, isn’t always available.
Despite the challenges, a high percentage of restaurant operators report that they recycle. Nearly two-thirds currently recycle cardboard/paper, or fats, oils and grease. Tableservice-restaurant operators report somewhat higher rates of recycling than operators of limited-service restaurants, and inde-pendently owned restaurants report higher recycling rates than chain/franchisee-owned restaurants.
Percent of restaurants that recycle the following items
65%
Cardboard or paper
64%
Fats, oils and grease
29%
Aluminum or metal cans
29%
Rigid plastics, such as containers
and cups
26%
Glass
22%
Flexible plastics, such as cling wrap or bags
Source: National Restaurant Association, Restaurant Sustainability Survey 2017
Percent of restaurant operators, by type of operation, who report that they recycle the following items
All restaurants
By segment By ownership
Tableservice Limited-service Independent Chain/Franchisee
Cardboard or paper 65% 70% 60% 70% 63%
Fats, oils and grease 64% 79% 50% 71% 59%
Aluminum or metal cans
29% 36% 22% 45% 15%
Rigid plastics, such as containers and cups
29% 33% 25% 42% 19%
Glass 26% 36% 17% 38% 16%
Flexible plastics, such as cling wrap or bags
22% 25% 19% 29% 16%
Source: National Restaurant Association, Restaurant Sustainability Survey 2017
Managing Waste |
Restaurant.org | The State of Restaurant Sustainability | National Restaurant Association • 11
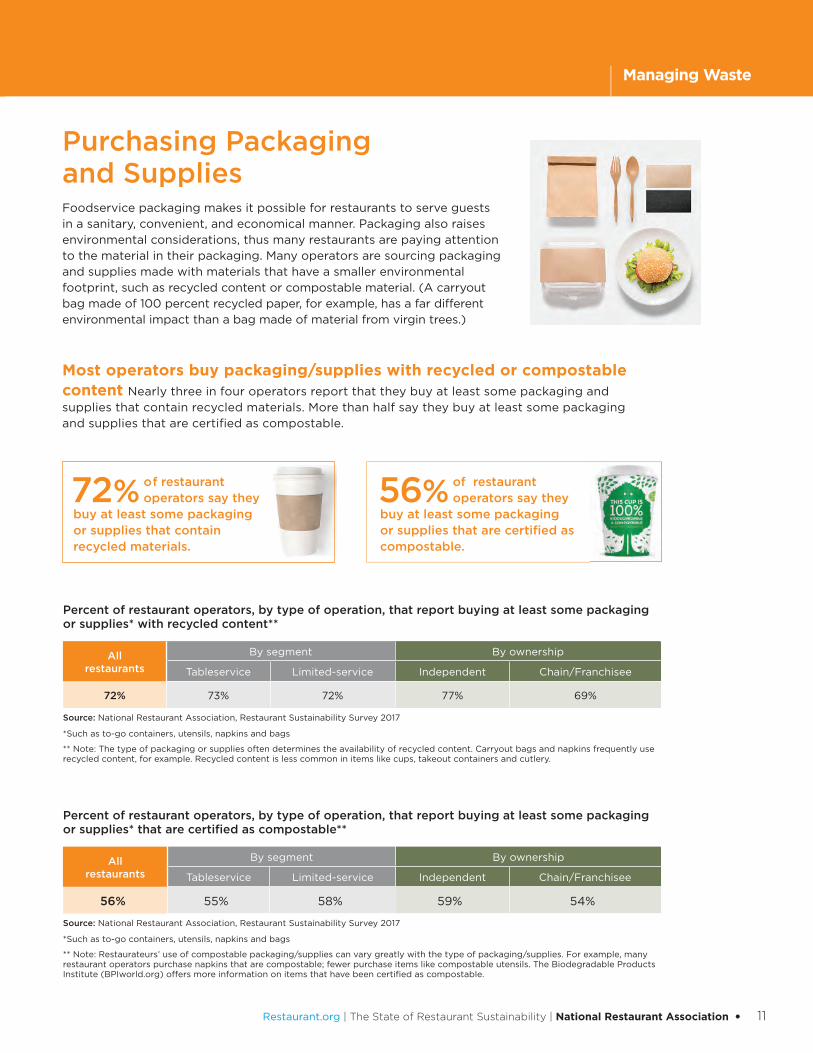
Purchasing Packaging and SuppliesFoodservice packaging makes it possible for restaurants to serve guests in a sanitary, convenient, and economical manner. Packaging also raises environmental considerations, thus many restaurants are paying attention to the material in their packaging. Many operators are sourcing packaging and supplies made with materials that have a smaller environmental footprint, such as recycled content or compostable material. (A carryout bag made of 100 percent recycled paper, for example, has a far different environmental impact than a bag made of material from virgin trees.)
Most operators buy packaging/supplies with recycled or compostable content Nearly three in four operators report that they buy at least some packaging and supplies that contain recycled materials. More than half say they buy at least some packaging and supplies that are certifi ed as compostable.
56% of restaurant operators say they
buy at least some packaging or supplies that are certifi ed as compostable.
72% of restaurant operators say they
buy at least some packaging or supplies that contain recycled materials.
Percent of restaurant operators, by type of operation, that report buying at least some packaging or supplies* with recycled content**
All restaurants
By segment By ownership
Tableservice Limited-service Independent Chain/Franchisee
72% 73% 72% 77% 69%
Source: National Restaurant Association, Restaurant Sustainability Survey 2017
*Such as to-go containers, utensils, napkins and bags
** Note: The type of packaging or supplies often determines the availability of recycled content. Carryout bags and napkins frequently use recycled content, for example. Recycled content is less common in items like cups, takeout containers and cutlery.
Percent of restaurant operators, by type of operation, that report buying at least some packaging or supplies* that are certifi ed as compostable**
All restaurants
By segment By ownership
Tableservice Limited-service Independent Chain/Franchisee
56% 55% 58% 59% 54%
Source: National Restaurant Association, Restaurant Sustainability Survey 2017
*Such as to-go containers, utensils, napkins and bags
** Note: Restaurateurs’ use of compostable packaging/supplies can vary greatly with the type of packaging/supplies. For example, many restaurant operators purchase napkins that are compostable; fewer purchase items like compostable utensils. The Biodegradable Products Institute (BPIworld.org) offers more information on items that have been certifi ed as compostable.
| Managing Waste
12 • National Restaurant Association | The State of Restaurant Sustainability | Restaurant.org
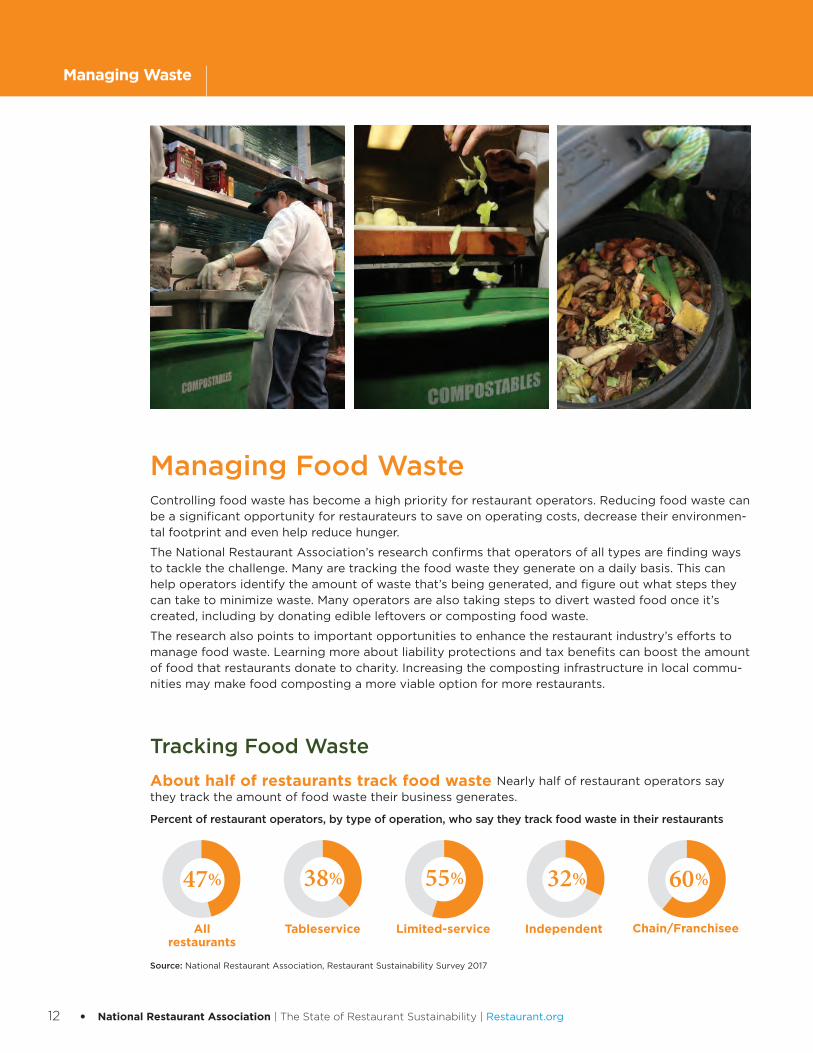
Managing Food WasteControlling food waste has become a high priority for restaurant operators. Reducing food waste can be a significant opportunity for restaurateurs to save on operating costs, decrease their environmen-tal footprint and even help reduce hunger.
The National Restaurant Association’s research confirms that operators of all types are finding ways to tackle the challenge. Many are tracking the food waste they generate on a daily basis. This can help operators identify the amount of waste that’s being generated, and figure out what steps they can take to minimize waste. Many operators are also taking steps to divert wasted food once it’s created, including by donating edible leftovers or composting food waste.
The research also points to important opportunities to enhance the restaurant industry’s efforts to manage food waste. Learning more about liability protections and tax benefits can boost the amount of food that restaurants donate to charity. Increasing the composting infrastructure in local commu-nities may make food composting a more viable option for more restaurants.
Tracking Food Waste
About half of restaurants track food waste Nearly half of restaurant operators say they track the amount of food waste their business generates.
Percent of restaurant operators, by type of operation, who say they track food waste in their restaurants
60%32%47% 55%38%
TableserviceAll restaurants
Limited-service Independent Chain/Franchisee
Source: National Restaurant Association, Restaurant Sustainability Survey 2017
Managing Waste |
Restaurant.org | The State of Restaurant Sustainability | National Restaurant Association • 13
| Managing Waste
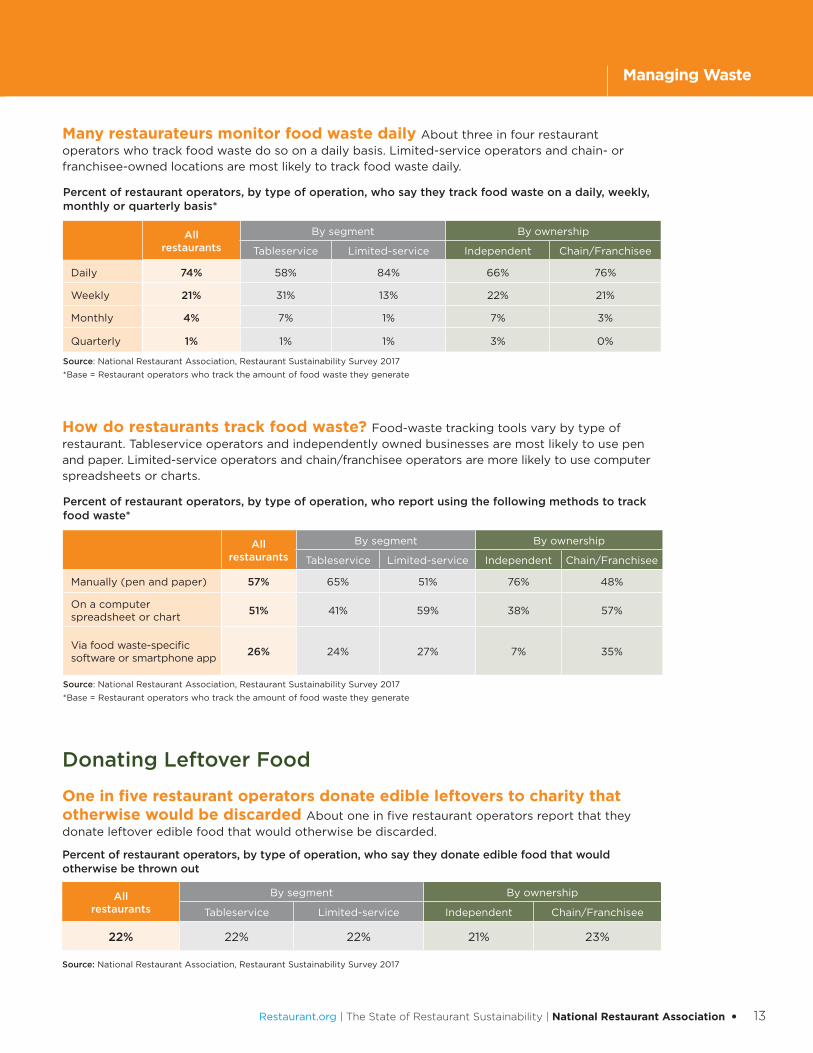
Many restaurateurs monitor food waste daily About three in four restaurant operators who track food waste do so on a daily basis. Limited-service operators and chain- or franchisee-owned locations are most likely to track food waste daily.
Percent of restaurant operators, by type of operation, who say they track food waste on a daily, weekly, monthly or quarterly basis*
All restaurants
By segment By ownership
Tableservice Limited-service Independent Chain/Franchisee
Daily 74% 58% 84% 66% 76%
Weekly 21% 31% 13% 22% 21%
Monthly 4% 7% 1% 7% 3%
Quarterly 1% 1% 1% 3% 0%
Source: National Restaurant Association, Restaurant Sustainability Survey 2017
*Base = Restaurant operators who track the amount of food waste they generate
How do restaurants track food waste? Food-waste tracking tools vary by type of restaurant. Tableservice operators and independently owned businesses are most likely to use pen and paper. Limited-service operators and chain/franchisee operators are more likely to use computer spreadsheets or charts.
Percent of restaurant operators, by type of operation, who report using the following methods to track food waste*
All restaurants
By segment By ownership
Tableservice Limited-service Independent Chain/Franchisee
Manually (pen and paper) 57% 65% 51% 76% 48%
On a computer spreadsheet or chart
51% 41% 59% 38% 57%
Via food waste-specific software or smartphone app
26% 24% 27% 7% 35%
Source: National Restaurant Association, Restaurant Sustainability Survey 2017
*Base = Restaurant operators who track the amount of food waste they generate
Donating Leftover Food
One in five restaurant operators donate edible leftovers to charity that otherwise would be discarded About one in five restaurant operators report that they donate leftover edible food that would otherwise be discarded.
Percent of restaurant operators, by type of operation, who say they donate edible food that would otherwise be thrown out
All restaurants
By segment By ownership
Tableservice Limited-service Independent Chain/Franchisee
22% 22% 22% 21% 23%
Source: National Restaurant Association, Restaurant Sustainability Survey 2017
14 • National Restaurant Association | The State of Restaurant Sustainability | Restaurant.org
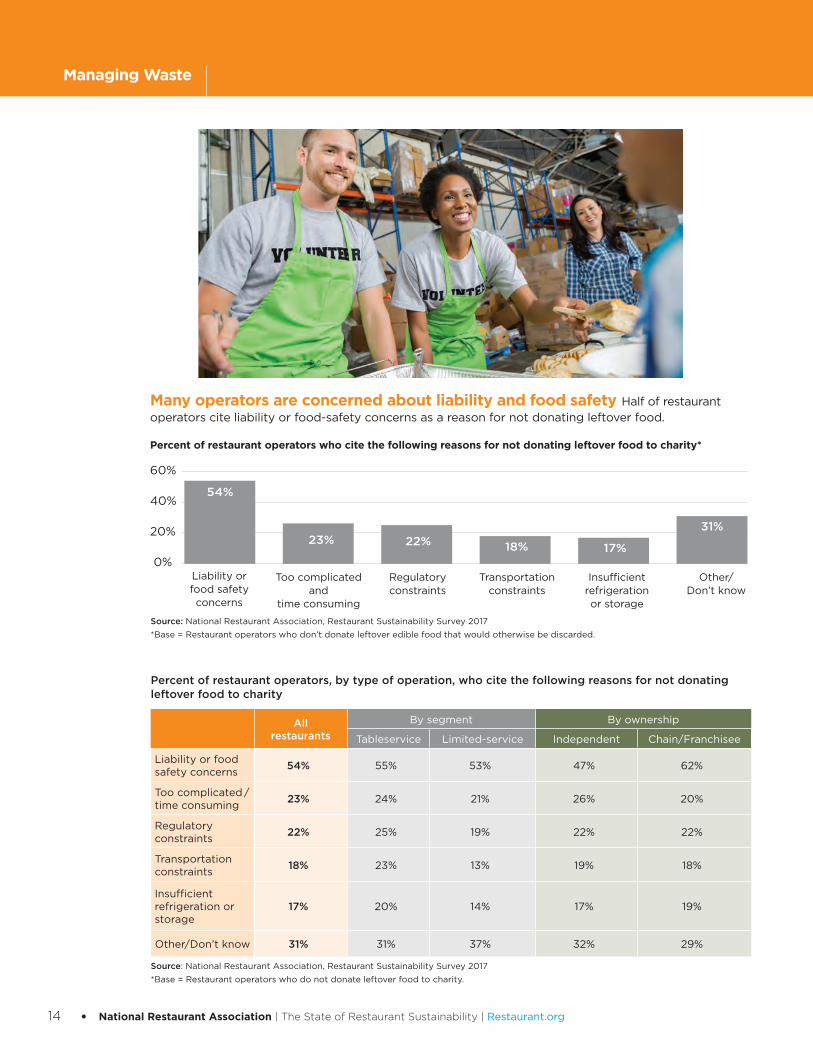
Many operators are concerned about liability and food safety Half of restaurant operators cite liability or food-safety concerns as a reason for not donating leftover food.
Percent of restaurant operators who cite the following reasons for not donating leftover food to charity*
39%54%
23% 22% 18% 17%
31%
Liability or food safety concerns
Regulatory constraints
Insufficient refrigeration or storage
Too complicated and
time consuming
Transportation constraints
Other/ Don’t know
60%
40%
20%
0%
Source: National Restaurant Association, Restaurant Sustainability Survey 2017
*Base = Restaurant operators who don’t donate leftover edible food that would otherwise be discarded.
Percent of restaurant operators, by type of operation, who cite the following reasons for not donating leftover food to charity
All restaurants
By segment By ownership
Tableservice Limited-service Independent Chain/Franchisee
Liability or food safety concerns
54% 55% 53% 47% 62%
Too complicated / time consuming
23% 24% 21% 26% 20%
Regulatory constraints
22% 25% 19% 22% 22%
Transportation constraints
18% 23% 13% 19% 18%
Insufficient refrigeration or storage
17% 20% 14% 17% 19%
Other/Don’t know 31% 31% 37% 32% 29%
Source: National Restaurant Association, Restaurant Sustainability Survey 2017
*Base = Restaurant operators who do not donate leftover food to charity.
Managing Waste |

Restaurant.org | The State of Restaurant Sustainability | National Restaurant Association • 15
| Managing Waste
Awareness of Liability Protections for Food Donation
A third of restaurant operators are aware of liability protections Three in ten restaurant operators know about the federal Good Samaritan Act that relieves restaurants and other food donors of legal liability in cases of foodborne illness resulting from the consumption of donated food.
Percent of restaurant operators, by type of operation, who are aware that federal law provides liability protection to restaurant owners who donate food
29%31% 32% 28% 34%
TableserviceAll restaurants
Limited-service Independent Chain/Franchisee
Source: National Restaurant Association, Restaurant Sustainability Survey 2017
More than three in ten operators are aware of the tax benefi ts for food donation or have already
taken advantage of a tax benefi t.Source: National Restaurant Association, Restaurant Sustainability Survey 2017
Did you know?Food donation helps reduce your tax burden. Restaurants can receive an
enhanced federal tax deduction to help offset the costs involved in donating
leftover food to a qualifi ed nonprofi t organization. This tax benefi t provides
a fi nancial incentive to restaurants by making food donations more cost-
effective. Consult an adviser or organizations like Food Donation Connection
and Feeding America for more details on how to take advantage of the
enhanced tax deduction. In addition to the deduction at the federal level,
some states offer additional tax incentives for food donations.
The law protects restaurants that donate food. The federal Bill Emerson
Good Samaritan Food Donation Act of 1996 protects restaurants from
legal liability when they donate “apparently wholesome food” in good faith
to nonprofi t organizations. Under the law, a restaurant that has properly
handled the food and donates it in good faith to a nonprofi t for distribution
to persons in need cannot be held criminally or civilly liable if a person
becomes ill as a result of consuming the donated food. Restaurants face
liability only in cases of gross negligence or intentional misconduct. In
addition, millions of pounds of food are donated daily and not a single case
involving food donation-related liability has been reported.
BUILDS
COMMUNITY
RELATIONSHIPS
AND
GOODWILL.
CREATES
EMPLOYEE
PRIDE AND
ENGAGEMENT.
KEEPS FOOD
OUT OF
LANDFILLS AND
HELPS THE
ENVIRONMENT.
THE BENEFITS OF FOOD DONATION
31%
16 • National Restaurant Association | The State of Restaurant Sustainability | Restaurant.org
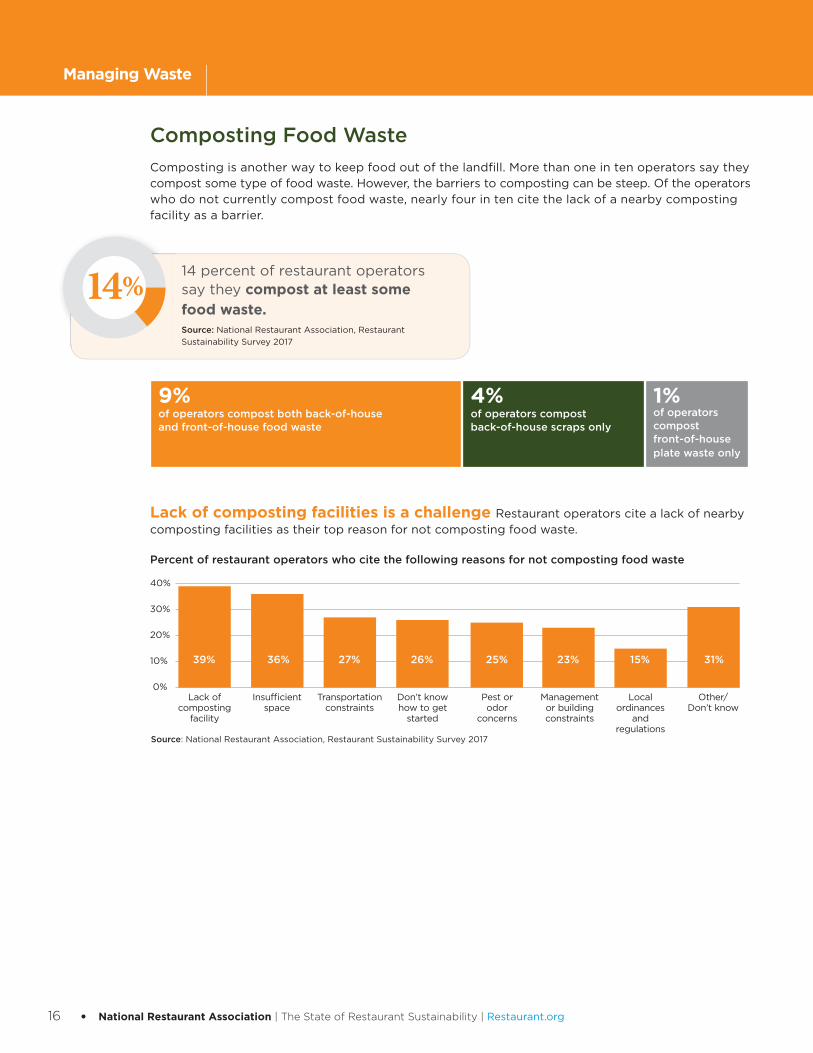
Composting Food Waste
Composting is another way to keep food out of the landfi ll. More than one in ten operators say they compost some type of food waste. However, the barriers to composting can be steep. Of the operators who do not currently compost food waste, nearly four in ten cite the lack of a nearby composting facility as a barrier.
4%of operators compost back-of-house scraps only
9%of operators compost both back-of-house and front-of-house food waste
1%of operators compost front-of-house plate waste only
Lack of composting facilities is a challenge Restaurant operators cite a lack of nearby composting facilities as their top reason for not composting food waste.
Percent of restaurant operators who cite the following reasons for not composting food waste
Lack of composting
facility
Don’t know how to get
started
Insuffi cient space
Pest or odor
concerns
Local ordinances
and regulations
Transportationconstraints
Management or building constraints
Other/Don’t know
Source: National Restaurant Association, Restaurant Sustainability Survey 2017
40%
30%
20%
10%
0%
39% 36% 27% 26% 25% 23% 15% 31%
Managing Waste |
14 percent of restaurant operators say they compost at least some
food waste.Source: National Restaurant Association, Restaurant
Sustainability Survey 2017
14%
Restaurant.org | The State of Restaurant Sustainability | National Restaurant Association • 17
Today’s restaurant guests are more knowledgeable and sophisticated about
dining out than any previous generation. Many guests are also increasingly
interested in learning about restaurants’ environmental efforts.
CONSUMER INSIGHTS & FOOD TRENDS
SECTION HIGHLIGHTS:
■ Environmental sustainability is among the top menu trends in 2018. The National Restaurant Association’s “What’s Hot” report, based on a survey of 700 professional chefs, shows that chefs are paying close attention to sustainability, food waste reduction and local sourcing.
■ A restaurant’s sustainability efforts can have an impact on a guest’s choice of restaurants. About half of consumers report that a restaurant’s efforts to reduce food waste, recycle or donate food can be factors in choosing where to dine.
■ The most effective way for a restaurant to promote its sustainability efforts is on its menu, according to consumers.
18 • National Restaurant Association | The State of Restaurant Sustainability | Restaurant.org
Consumer Insights & Food Trends |
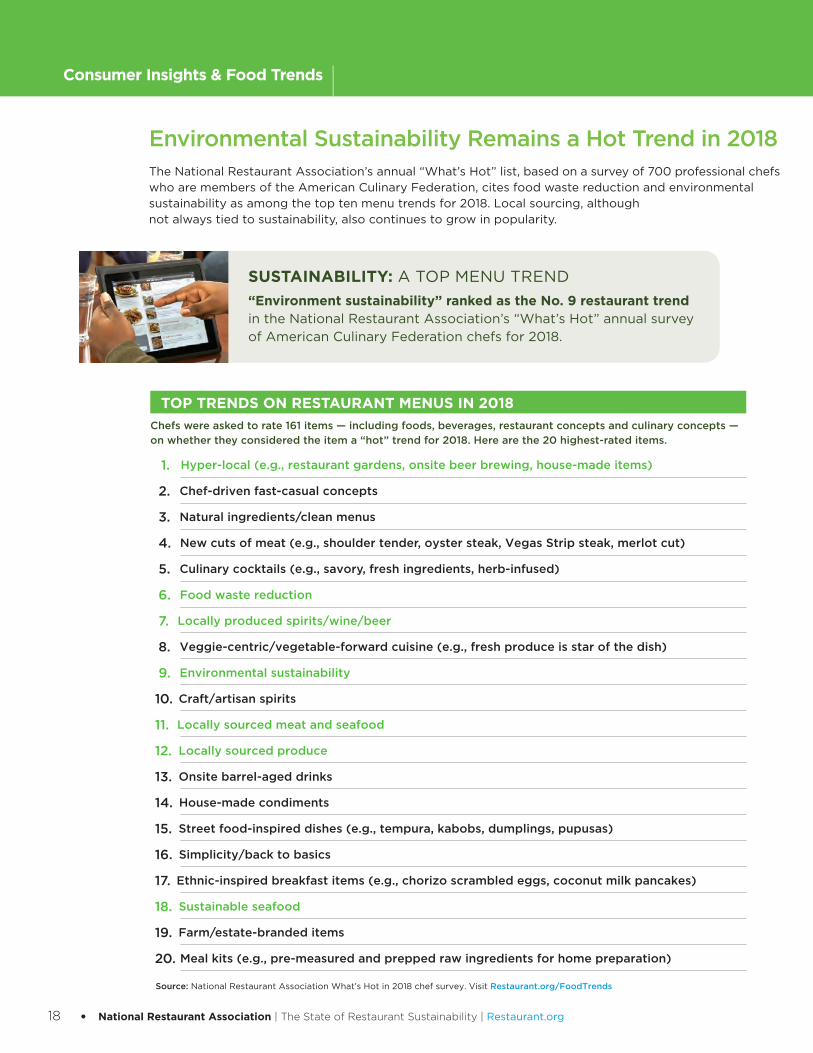
Environmental Sustainability Remains a Hot Trend in 2018The National Restaurant Association’s annual “What’s Hot” list, based on a survey of 700 professional chefs who are members of the American Culinary Federation, cites food waste reduction and environmental sustainability as among the top ten menu trends for 2018. Local sourcing, although not always tied to sustainability, also continues to grow in popularity.
TOP TRENDS ON RESTAURANT MENUS IN 2018
Chefs were asked to rate 161 items — including foods, beverages, restaurant concepts and culinary concepts —
on whether they considered the item a “hot” trend for 2018. Here are the 20 highest-rated items.
1. Hyper-local (e.g., restaurant gardens, onsite beer brewing, house-made items)
2. Chef-driven fast-casual concepts
3. Natural ingredients/clean menus
4. New cuts of meat (e.g., shoulder tender, oyster steak, Vegas Strip steak, merlot cut)
5. Culinary cocktails (e.g., savory, fresh ingredients, herb-infused)
6. Food waste reduction
7. Locally produced spirits/wine/beer
8. Veggie-centric/vegetable-forward cuisine (e.g., fresh produce is star of the dish)
9. Environmental sustainability
10. Craft/artisan spirits
11. Locally sourced meat and seafood
12. Locally sourced produce
13. Onsite barrel-aged drinks
14. House-made condiments
15. Street food-inspired dishes (e.g., tempura, kabobs, dumplings, pupusas)
16. Simplicity/back to basics
17. Ethnic-inspired breakfast items (e.g., chorizo scrambled eggs, coconut milk pancakes)
18. Sustainable seafood
19. Farm/estate-branded items
20. Meal kits (e.g., pre-measured and prepped raw ingredients for home preparation)
Source: National Restaurant Association What’s Hot in 2018 chef survey. Visit Restaurant.org/FoodTrends
SUSTAINABILITY: A TOP MENU TREND
“Environment sustainability” ranked as the No. 9 restaurant trend in the National Restaurant Association’s “What’s Hot” annual survey
of American Culinary Federation chefs for 2018.
Restaurant.org | The State of Restaurant Sustainability | National Restaurant Association • 19
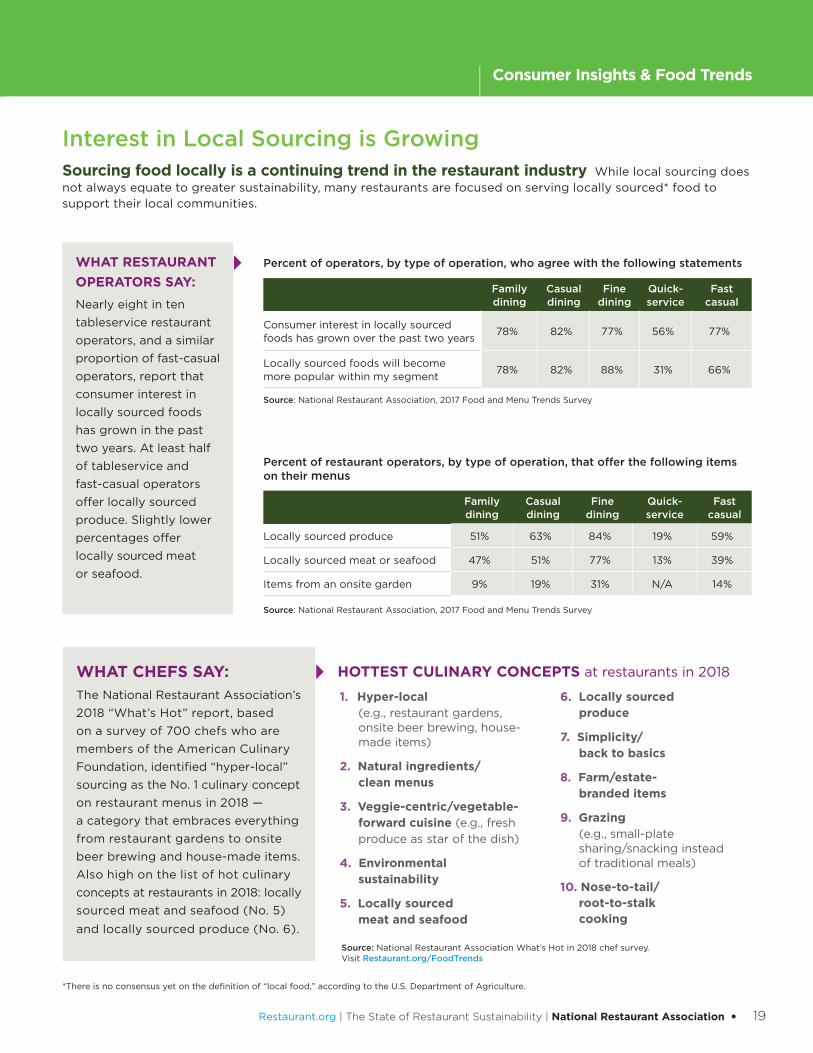
Percent of operators, by type of operation, who agree with the following statements
Family dining
Casual dining
Fine dining
Quick-service
Fast casual
Consumer interest in locally sourced foods has grown over the past two years
78% 82% 77% 56% 77%
Locally sourced foods will become more popular within my segment
78% 82% 88% 31% 66%
Source: National Restaurant Association, 2017 Food and Menu Trends Survey
Percent of restaurant operators, by type of operation, that offer the following items on their menus
Family dining
Casual dining
Fine dining
Quick- service
Fast casual
Locally sourced produce 51% 63% 84% 19% 59%
Locally sourced meat or seafood 47% 51% 77% 13% 39%
Items from an onsite garden 9% 19% 31% N/A 14%
Source: National Restaurant Association, 2017 Food and Menu Trends Survey
WHAT RESTAURANT
OPERATORS SAY: Nearly eight in ten
tableservice restaurant
operators, and a similar
proportion of fast-casual
operators, report that
consumer interest in
locally sourced foods
has grown in the past
two years. At least half
of tableservice and
fast-casual operators
offer locally sourced
produce. Slightly lower
percentages offer
locally sourced meat
or seafood.
WHAT CHEFS SAY: The National Restaurant Association’s
2018 “What’s Hot” report, based
on a survey of 700 chefs who are
members of the American Culinary
Foundation, identified “hyper-local”
sourcing as the No. 1 culinary concept
on restaurant menus in 2018 —
a category that embraces everything
from restaurant gardens to onsite
beer brewing and house-made items.
Also high on the list of hot culinary
concepts at restaurants in 2018: locally
sourced meat and seafood (No. 5)
and locally sourced produce (No. 6).
Sourcing food locally is a continuing trend in the restaurant industry While local sourcing does not always equate to greater sustainability, many restaurants are focused on serving locally sourced* food to support their local communities.
HOTTEST CULINARY CONCEPTS at restaurants in 2018
1. Hyper-local (e.g., restaurant gardens, onsite beer brewing, house-made items)
2. Natural ingredients/ clean menus
3. Veggie-centric/vegetable-forward cuisine (e.g., fresh
produce as star of the dish)
4. Environmental sustainability
5. Locally sourced meat and seafood
6. Locally sourced produce
7. Simplicity/ back to basics
8. Farm/estate- branded items
9. Grazing (e.g., small-plate sharing/snacking instead of traditional meals)
10. Nose-to-tail/ root-to-stalk cooking
Source: National Restaurant Association What’s Hot in 2018 chef survey. Visit Restaurant.org/FoodTrends
Interest in Local Sourcing is Growing
| Consumer Insights & Food Trends
*There is no consensus yet on the definition of “local food,” according to the U.S. Department of Agriculture.

20 • National Restaurant Association | The State of Restaurant Sustainability | Restaurant.org
Consumer Insights & Food Trends |
Marketing Restaurant Sustainability EffortsMenu notices are a good way to promote restaurant sustainability steps The most effective way restaurant operators can convey their environmental efforts is to print the information on the menu, according to consumers.
Average consumer rating for the effectiveness of each method to promote a restaurant’s environmental efforts (Consumers rated effectiveness of each method on a 1-10 scale; 1 = not at all effective, 10 = the most effective.)
■ Printing it on the menu
■ Including it on the website
■ Sharing it on social media
■ Printing it on packaging and supplies
■ Having staff tell them about it
■ Showing it on wall plaques or posters
■ Putting a sticker on the door
Source: National Restaurant Association, Sustainability Consumer Survey, 2017
6.87.2 6.2 6.3 6.1
Mean effectiveness rating
6.2 5.8
8
6
4
2
0
The generational difference Nearly half of millennials rate social media as a highly effective way for a restaurant to promote its sustainability efforts, compared to a third of baby boomers.
Percent of consumers that gave the following methods a rating of 8-10, in terms of their effectiveness in promoting a restaurant’s environmental efforts (Consumers rated effectiveness of each method on a 1-10 scale; 1 = not at all effective, 10 = the most effective.)
Baby boomers
■ Printing it on the menu
■ Including it on the website
■ Sharing it on social media
■ Printing it on packaging and supplies
■ Having staff tell them about it
■ Showing it on wall plaques or posters
■ Putting a sticker on the door
Source: National Restaurant Association, Sustainability Consumer Survey, 2017
Millennials = age 18-37; Generation X = age 38-53; Baby boomer = age 54-72
0
20
40
60
All consumers Millennials Generation X
60%
40%
20%
0
54 45 39 38 37 36 30 55 44 47 40 44 35 30 46 47 43 41 35 39 31 62 47 32 38 36 37 29
Restaurant.org | The State of Restaurant Sustainability | National Restaurant Association • 21
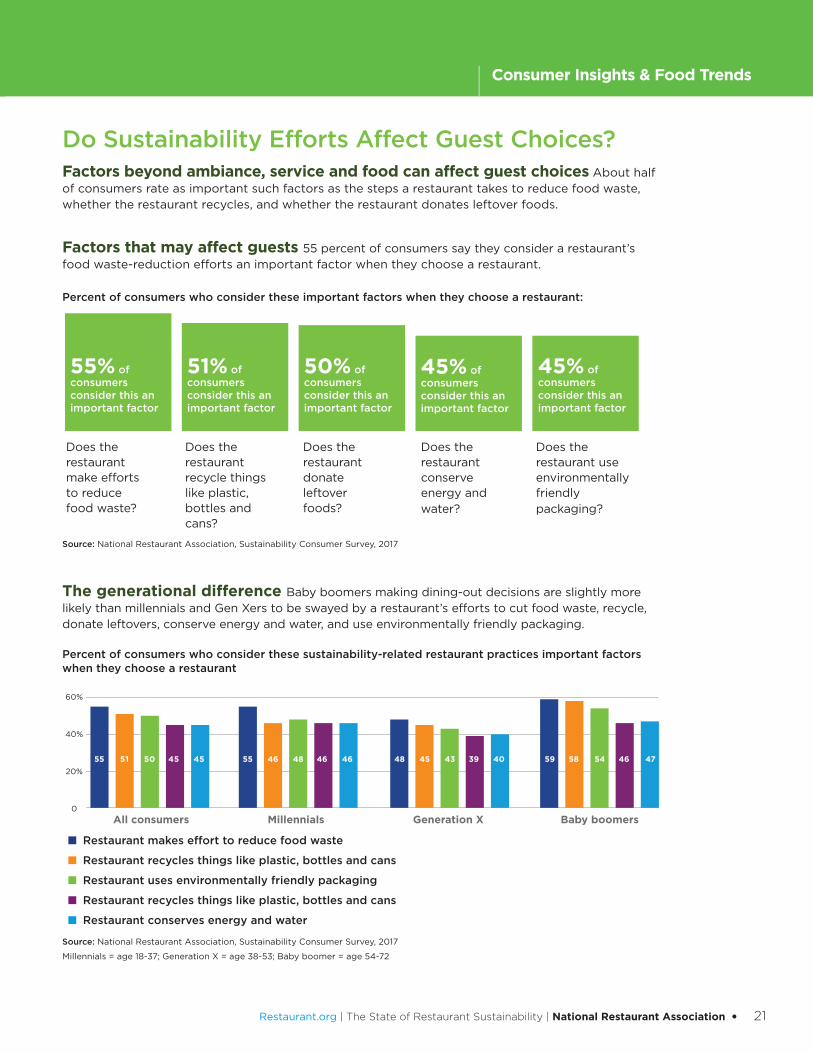
Do Sustainability Efforts Affect Guest Choices?Factors beyond ambiance, service and food can affect guest choices About half of consumers rate as important such factors as the steps a restaurant takes to reduce food waste, whether the restaurant recycles, and whether the restaurant donates leftover foods.
Factors that may affect guests 55 percent of consumers say they consider a restaurant’s food waste-reduction efforts an important factor when they choose a restaurant.
Percent of consumers who consider these important factors when they choose a restaurant:
55% of consumers consider this an important factor
50% of consumers consider this an important factor
51% of consumers consider this an important factor
45% of consumers consider this an important factor
45% of consumers consider this an important factor
Does the restaurant make efforts to reduce food waste?
Does the restaurant recycle things like plastic, bottles and cans?
Does the restaurant donate leftover foods?
Does the restaurant conserve energy and water?
Does the restaurant use environmentally friendly packaging?
Source: National Restaurant Association, Sustainability Consumer Survey, 2017
The generational difference Baby boomers making dining-out decisions are slightly more likely than millennials and Gen Xers to be swayed by a restaurant’s efforts to cut food waste, recycle, donate leftovers, conserve energy and water, and use environmentally friendly packaging.
Percent of consumers who consider these sustainability-related restaurant practices important factors when they choose a restaurant
■ Restaurant makes effort to reduce food waste
■ Restaurant recycles things like plastic, bottles and cans
■ Restaurant uses environmentally friendly packaging
■ Restaurant recycles things like plastic, bottles and cans
■ Restaurant conserves energy and water
0
10
20
30
40
50
60
All consumers Millennials Generation X Baby boomers
60%
40%
20%
0
55 51 50 45 45 55 46 48 46 46 48 45 43 39 40 59 58 54 46 47
Source: National Restaurant Association, Sustainability Consumer Survey, 2017
Millennials = age 18-37; Generation X = age 38-53; Baby boomer = age 54-72
| Consumer Insights & Food Trends
22 • National Restaurant Association | The State of Restaurant Sustainability | Restaurant.org
Resources for Operators
The National Restaurant Association’s State of Restaurant Sustainability report, 2018 edition, outlines sustainability initiatives restaurant operators of all sizes and types have put in place.
Whether it’s tackling food waste, becoming more energy- and water-effi cient, or offering more sustainable choices to guests, the nation’s one million restaurant locations continue to innovate and look for ways to reduce their impact on the environment. Guests increasingly are interested in and receptive to these efforts as well.
The journey is not always easy. Restaurateurs can face challenges when implementing environmental efforts, including the lack of infrastructure for recycling, composting and food donation. Still, the industry continues to embrace and drive change. In a sign of the growing trend, about one in ten restaurant operators report that they currently hold a “green certifi cation,” a business certifi cation for their eco-friendly practices from a local or national third-party organization.
The National Restaurant Association is committed to helping our members thrive as they advance in their sustainability journey. Check out what we offer:
■ The go-to source: The National Restaurant Association created a sustainability education program in 2009 as a resource to show restaurateurs how to reduce their environmental footprint and save money and resources at the same time. This free educational resource helps operators navigate their sustainability path. It is available at Restaurant.org/Conserve.
■ Networking with sustainability leaders: The National Restaurant Association Sustainability Executive Study Group offers restaurant members of the National Restaurant Association opportunities to network, share best practices and learn from experts. Visit Restaurant.org/Groups.
■ The latest advances: The National Restaurant Association Show in Chicago, May 19-22, 2018, brings together industry leaders from across the world to see, test and ask questions about the latest sustainability innovations. See Restaurant.org/Show.
■ Partnerships: Partnerships can help restaurateurs succeed. The National Restaurant Association is proud to be a founding member of the Food Waste Reduction Alliance with the Food Marketing Institute and Grocery Manufacturers Association. We have partnered with Feeding America and Food Donation Connection, to strengthen the connections between restaurants, and those who need food. We also have strong relationships with the U.S. Environmental Protection Agency’s Energy Star and WaterSense programs, the Foodservice Packaging Institute and the U.S. Composting Council, among others.
The National Restaurant Association encourages restaurant owners and operators to take advantage of our resources. Contact Laura Abshire, the National Restaurant Association’s Director of Sustainability Policy, at [email protected], or Jeff Clark, our Sustainability Program Manager, at [email protected].

Restaurant.org | The State of Restaurant Sustainability | National Restaurant Association • 23
Methodology
This report presents the findings of a National Restaurant Association research initiative to study the environmental sustainability practices and trends in the restaurant industry.
The Association commissioned SSI to survey (via telephone) a national sample of 500 restaurant owners and operators from March 14–22, 2017. Among those interviews, 250 were tableservice restaurant respondents and 250 were limited-service restaurant respondents.
The following definitions are used to help categorize the restaurant industry:
■ Tableservice: Establishment providing waiter/waitress service. The order is taken while the patron is seated. Patrons pay after they eat.
■ Limited-service: Establishments primarily engaged in providing foodservice in which patrons generally order or select items and pay before eating. Food and drink may be consumed on premises, taken out, or delivered.
Respondents were also asked for their ownership structure*:
■ 46 percent of respondents were independent operators. Of these, 37 percent owned a single restaurant and 9 percent owned multiple locations.
■ 52 percent of respondents characterized their ownership as either corporate-owned chains or franchisee.
32 percent of respondents were franchisees; of these, 22 percent owned multiple stores and 10 percent of respondents owned a single store.
20 percent of respondents were corporate-owned chains.
* Numbers do not add to 100 percent due to rounding.
Additional Research in Consumer Insights & Food Trends Section
The data in the Consumer Insights & Food Trends section of this report was compiled from three surveys performed by or for the National Restaurant Association in 2016 and 2017.
■ 2017 Food and Menu Trends Survey: The National Restaurant Association conducted an online survey of 309 restaurant owners and operators in November 2016, asking about food and consumer trends that impact restaurant menus.
■ What’s Hot in 2018: The National Restaurant Association conducted an online survey of 700 members of the American Culinary Federation in October 2017. The chefs rated 161 items as hot trends, yesterday’s news or perennial favorites.
■ Sustainability Consumer Survey: The National Restaurant Association commissioned ORC International to conduct an online survey of 1,009 adults from May 4–7, 2017, asking respondents about their sentiments around restaurants’ environmental sustainability activities.

24 • National Restaurant Association | The State of Restaurant Sustainability | Restaurant.org
NATIONAL RESTAURANT ASSOCIATION
SustainabilityExecutive Study Group
Meet every year. Connect anytime.Network with restaurant sustainability professionals who face the same challenges, and share
on-target, specialized experiences. What better way to discover best practices, solutions to
stubborn problems, or opportunities for advancement than from restaurant leaders in your field?
Our Sustainability Executive Study Group delivers information essential to your day-to-day
work and long-term career. Whether you need guidance on sourcing seafood, animal welfare
issues, food waste reduction or insight into consumer trends and preferences, this group is your
window into what fellow restaurant industry leaders are doing and which strategies work best.
Grow along with the best
Develop key professional relationships
Our conference brings together experienced restaurant professionals, including:
• Sustainability directors and vice presidents
• Supply chain strategy managers
• Corporate social responsibility experts
• Foodservice marketing directors
• Sustainability director
• • Supply chain strategy managers Supply chain strategy managers
• • Corporate social responsibility experts
• •
Learn More at
Restaurant.org/Groups
Restaurant.org | The State of Restaurant Sustainability | National Restaurant Association • iii