

The State of Rental Housing in Ontario - FRPOfrpo.lws1.com/wp-content/uploads/2015/04/Major... ·...
47
1 The State of Rental Housing in Ontario Mike Chopowick Federation of Rental-housing Providers of Ontario (FRPO) SpringFest Trade Show Toronto April 10, 2014
Transcript of The State of Rental Housing in Ontario - FRPOfrpo.lws1.com/wp-content/uploads/2015/04/Major... ·...
1
The State of Rental
Housing in Ontario
Mike Chopowick
Federation of Rental-housing Providers of Ontario (FRPO)
SpringFest Trade Show
Toronto
April 10, 2014

2
Overview
1. The Big Picture: Rental Housing’s
Economic Impact
2. Housing construction and supply/vacancy
3. Where should you invest? Ontario’s
Strongest Markets
4. Forget the Baby-Boomers
5. The Future: Low unemployment & low
inflation
3
Overview
6. Hydro and Gas Prices
7. Municipal Act Pitfalls
8. Poverty and Affordability
9. Immigration: The Great Exodus
10 .Renting is the New Normal

Fundamentals
Rental Housing: A Big Industry
4

Rental Housing by
Comparison (GDP 2012)
Manufacturing $76.1 billion
Finance and Insurance $51.8 billion
Construction (Total) $32.8 billion
Food and Beverage Industry $26.2 billion
Tourism Industry (Total) $19.5 billion
Rental Housing Industry $18.3 billion
Defence Industry $13.9 billion
Aeropace Industry $11.2 billion
Mining and oil and gas $6.5 billion
Agriculture, forestry, fishing & hunting $4.7 billion
Arts and Culture Industries $3.7 billion Source: Statistics Canada GDP CANSIM table 379-0030, 2013; KPMG 2013, Economic Impact Assessment Study – Federation of Rental Housing Providers of
Ontario; Ontario Ministry of Tourism, Culture and Sport, 2013; Ontario Arts Council, 2012.
5
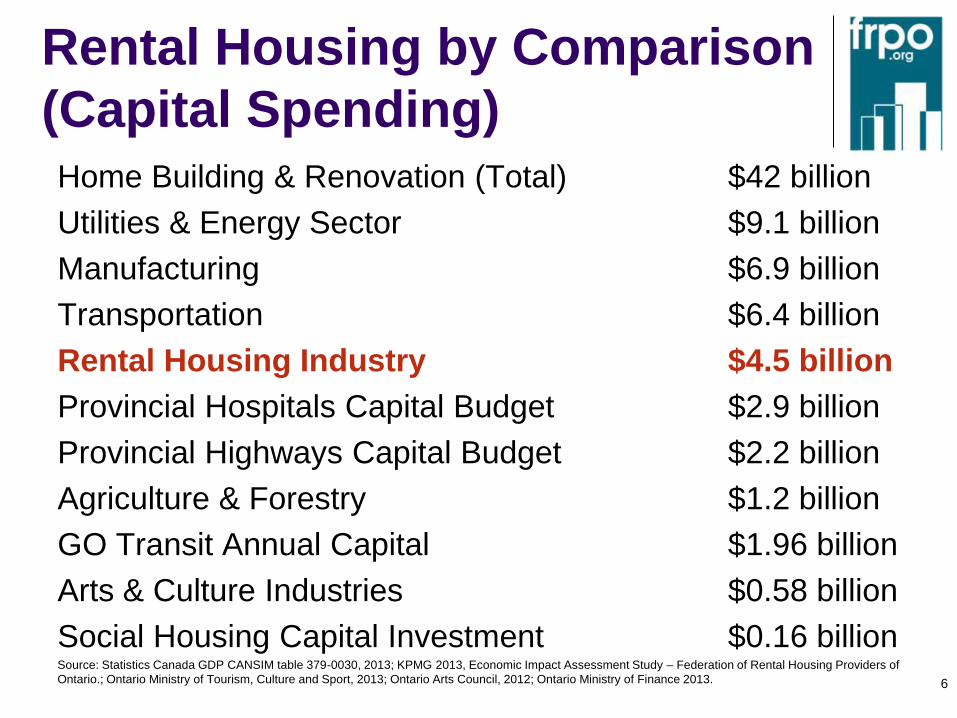
Rental Housing by Comparison
(Capital Spending) Home Building & Renovation (Total) $42 billion
Utilities & Energy Sector $9.1 billion
Manufacturing $6.9 billion
Transportation $6.4 billion
Rental Housing Industry $4.5 billion
Provincial Hospitals Capital Budget $2.9 billion
Provincial Highways Capital Budget $2.2 billion
Agriculture & Forestry $1.2 billion
GO Transit Annual Capital $1.96 billion
Arts & Culture Industries $0.58 billion
Social Housing Capital Investment $0.16 billion Source: Statistics Canada GDP CANSIM table 379-0030, 2013; KPMG 2013, Economic Impact Assessment Study – Federation of Rental Housing Providers of
Ontario.; Ontario Ministry of Tourism, Culture and Sport, 2013; Ontario Arts Council, 2012; Ontario Ministry of Finance 2013.
6
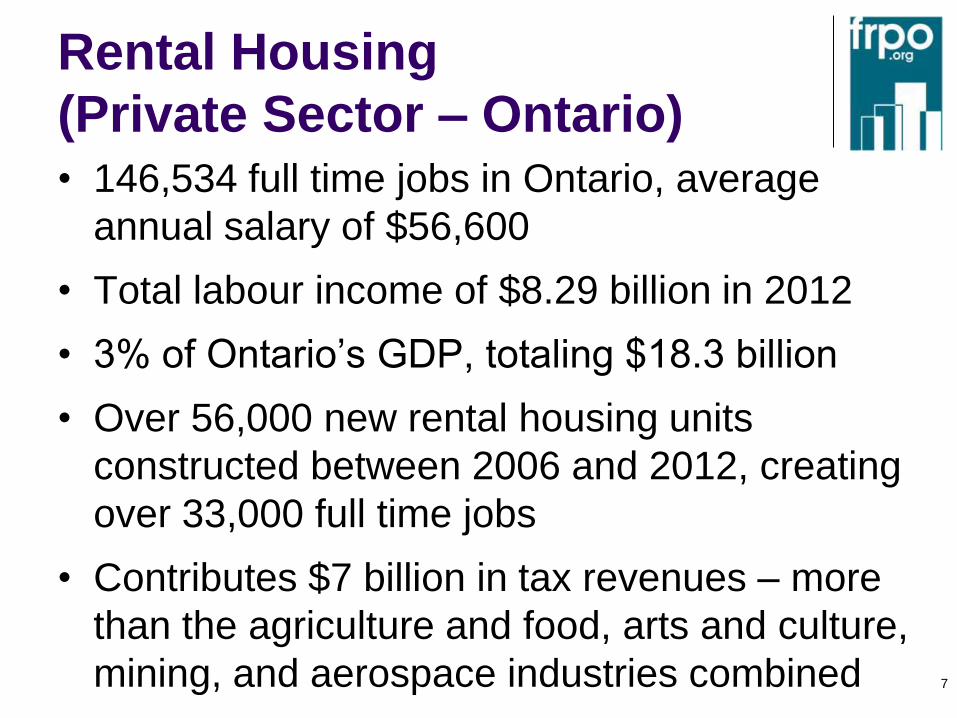
Rental Housing
(Private Sector – Ontario)
7
• 146,534 full time jobs in Ontario, average
annual salary of $56,600
• Total labour income of $8.29 billion in 2012
• 3% of Ontario’s GDP, totaling $18.3 billion
• Over 56,000 new rental housing units
constructed between 2006 and 2012, creating
over 33,000 full time jobs
• Contributes $7 billion in tax revenues – more
than the agriculture and food, arts and culture,
mining, and aerospace industries combined

Housing Construction
& Vacancy
8
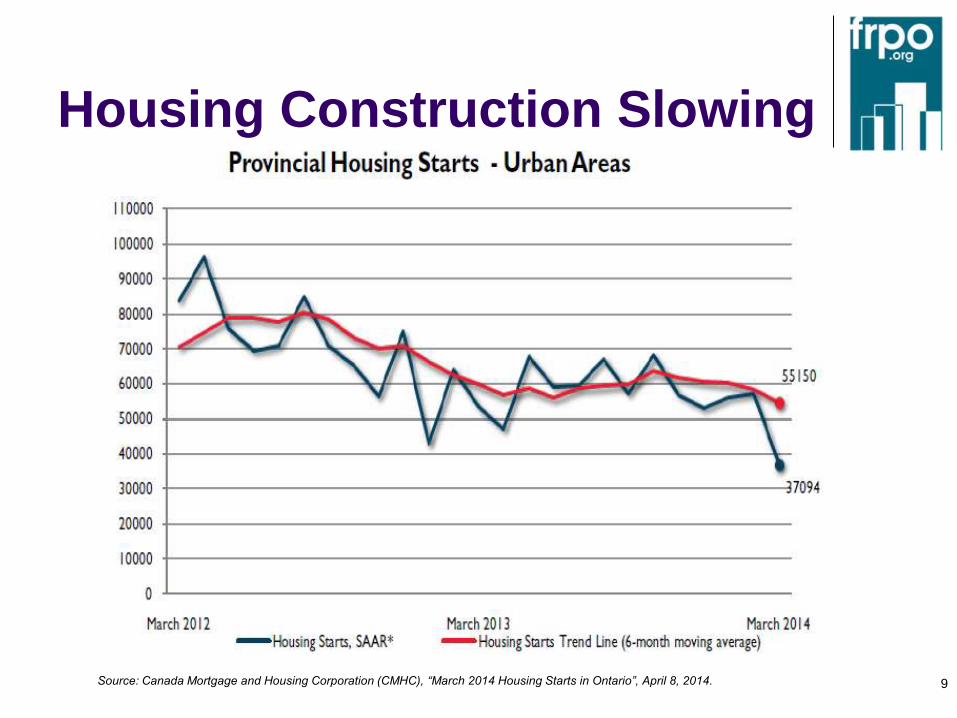
Housing Construction Slowing
9 Source: Canada Mortgage and Housing Corporation (CMHC), “March 2014 Housing Starts in Ontario”, April 8, 2014.

Vacancy Rates in Long-Term
Decline
10
2.0%
2.5%
3.0%
3.5%
4.0%
4.5%
2005 2006 2007 2008 2009 2010 2011 2012 2013
Source: CMHC Housing Observer 2013, Housing Market Indicator Data Tables
Average Vacancy Rates (Ontario)

Ontario’s strongest
markets
11
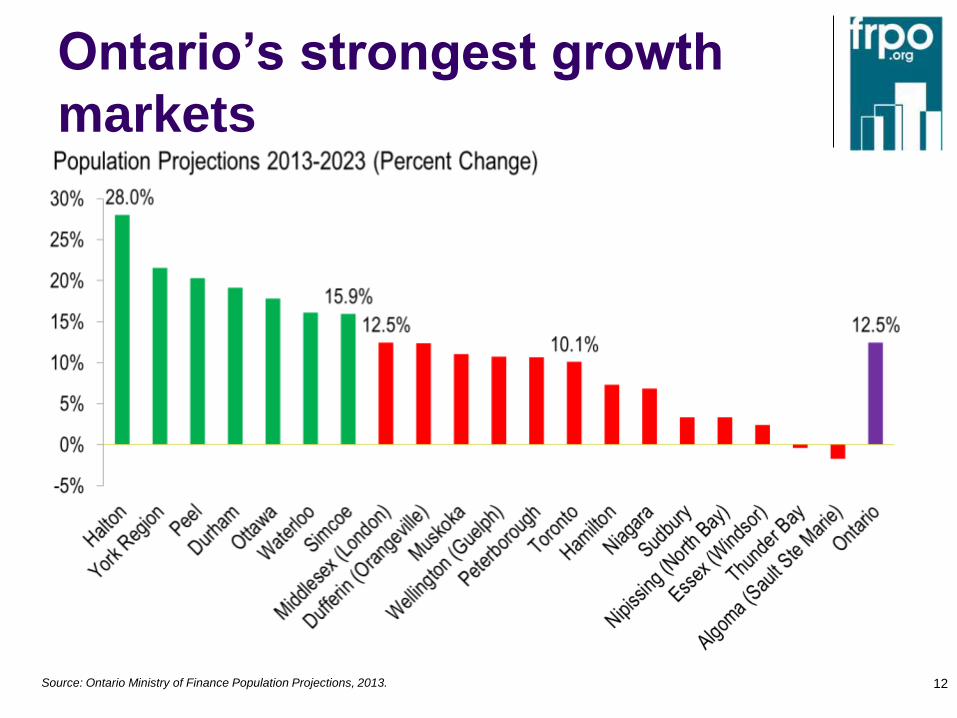
Ontario’s strongest growth
markets
12 Source: Ontario Ministry of Finance Population Projections, 2013.
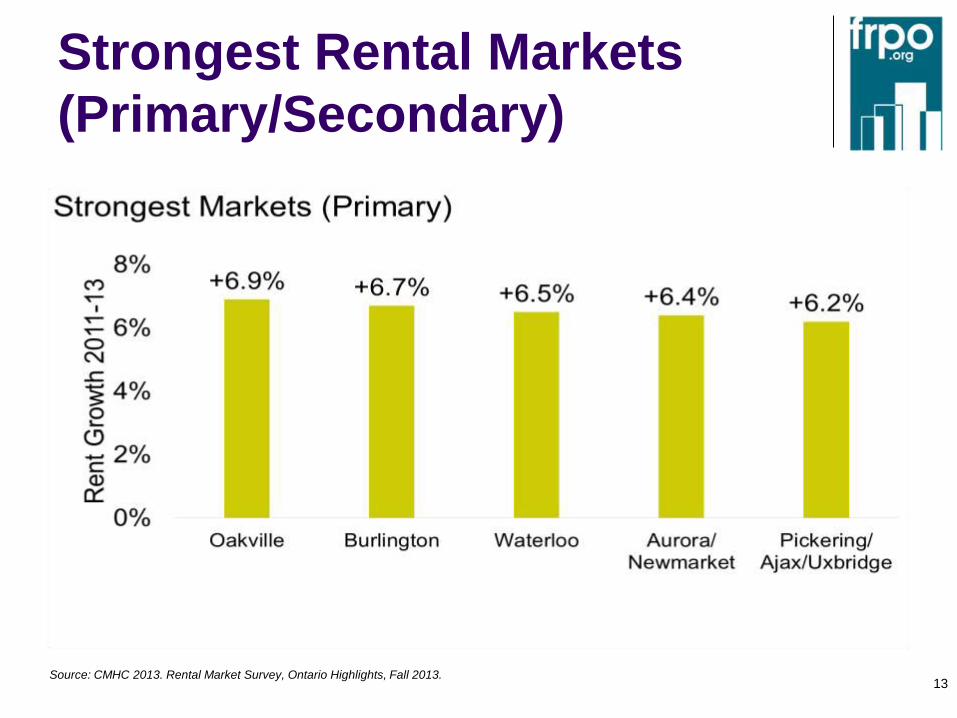
Strongest Rental Markets
(Primary/Secondary)
13 Source: CMHC 2013. Rental Market Survey, Ontario Highlights, Fall 2013.

Strongest Markets
(Secondary/Tertiary)
14 Source: CMHC 2013. Rental Market Survey, Ontario Highlights, Fall 2013.

Forget the Baby
Boomers
Meet the Millennials
15
Forget Baby-Boomers. Biggest
Impact from Millennials • Born between 1980-2000
• Now in young-adulthood, teens (Ages 15-35)
• 8.9 million in Canada. 4.5 million live with heir
parents. 700,000 unemployed. $225 billion in
labour income.
• Characteristics: Helicopter Parents,
Boomerang Kids, Peter Pan Generation,
Trophy Kids, Technologically Dependent,
“Underemployed”, Mobile, on-the-move.
16
Forget Baby-Boomers. Biggest
impact from Millennials
• Not interested in buying cars, don’t like the car
buying experience
• Dislike negotiating
• Challenge to afford car ownership and parking
• Prefer to live in walking/transit distance to
work
• Less interest in a suburban lifestyle. Prefer
urban infill projects, compact, efficient homes. 17

Millennials: Housing
Preferences
“An energy-sapping, high maintenance
money pit in the middle of nowhere.”
18

Millennials: Housing
Preferences
“Affordable, functional, hip, close to
work and friends.”
19

Millennials (Ages 15-35):
Key Demographic for Renting
20 Source: CMHC Rental Market Report - Greater Toronto Area - Date Released - Fall 2013
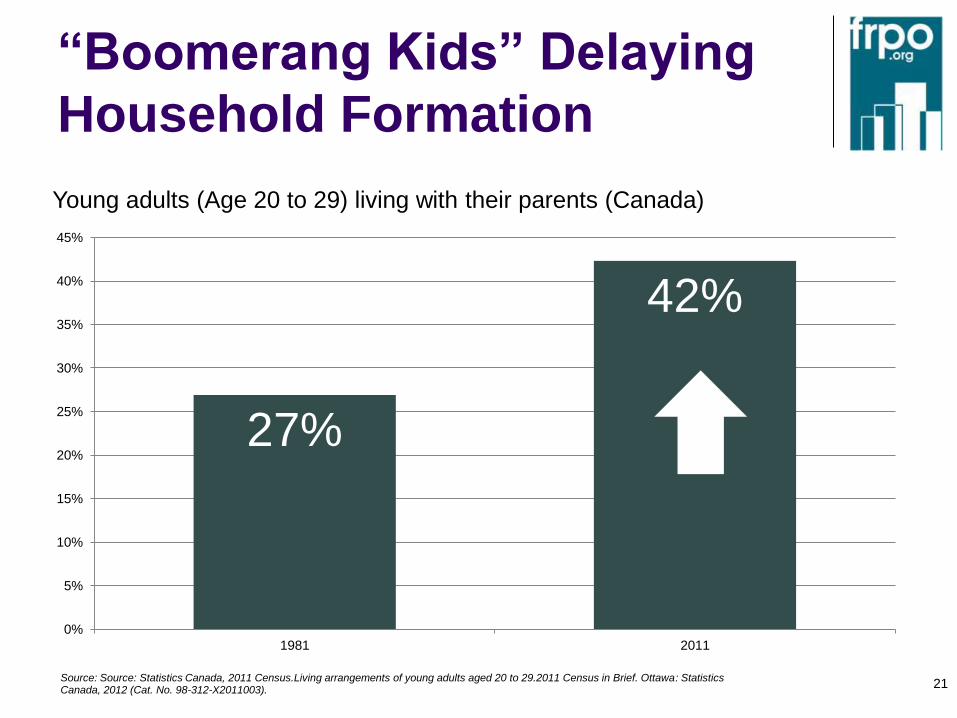
“Boomerang Kids” Delaying
Household Formation
21
27%
42%
0%
5%
10%
15%
20%
25%
30%
35%
40%
45%
1981 2011
Source: Source: Statistics Canada, 2011 Census.Living arrangements of young adults aged 20 to 29.2011 Census in Brief. Ottawa: Statistics Canada, 2012 (Cat. No. 98-312-X2011003).
Young adults (Age 20 to 29) living with their parents (Canada)

Low inflation & low
unemployment
22
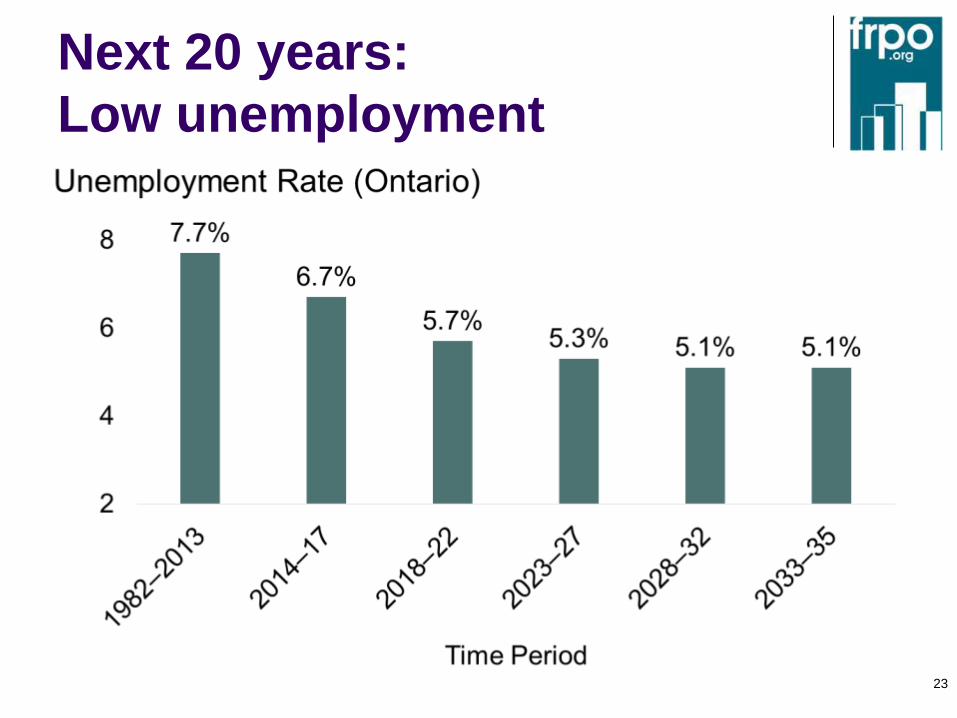
Next 20 years:
Low unemployment
23

Low unemployment
High unemployment is closely associated
with high levels of homeownership and vice
versa
High homeownership impairs the labour
market and mobility
Causes long commuting times and lowers
productivity
Homeowners oppose new development and
business investment in their neighbourhoods
24
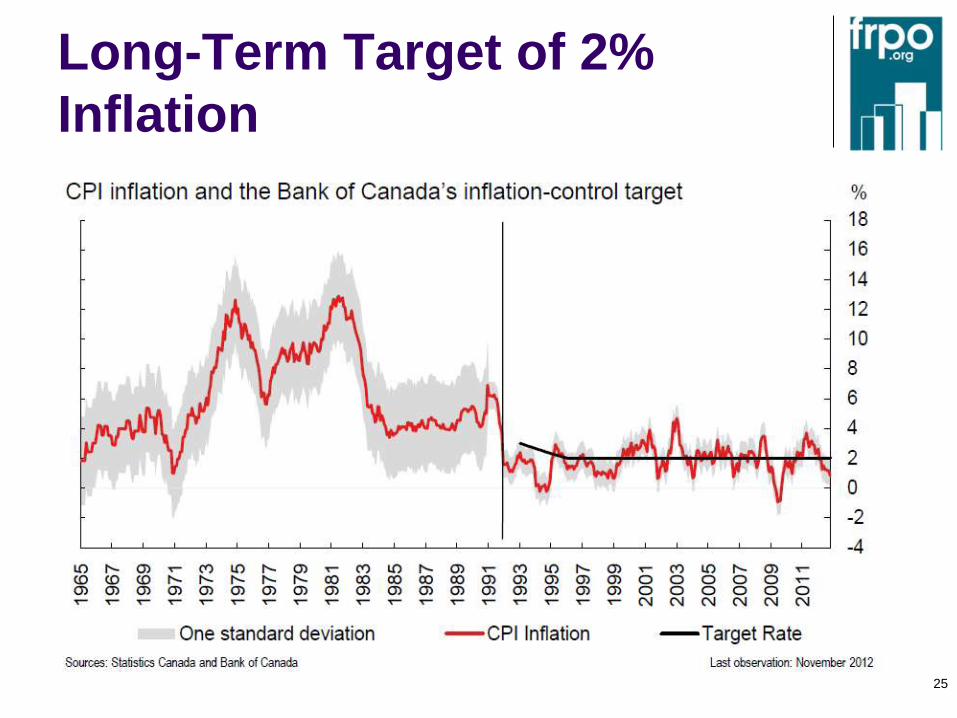
Long-Term Target of 2%
Inflation
25

Hydro and Gas Prices
Growing cost pressures
26
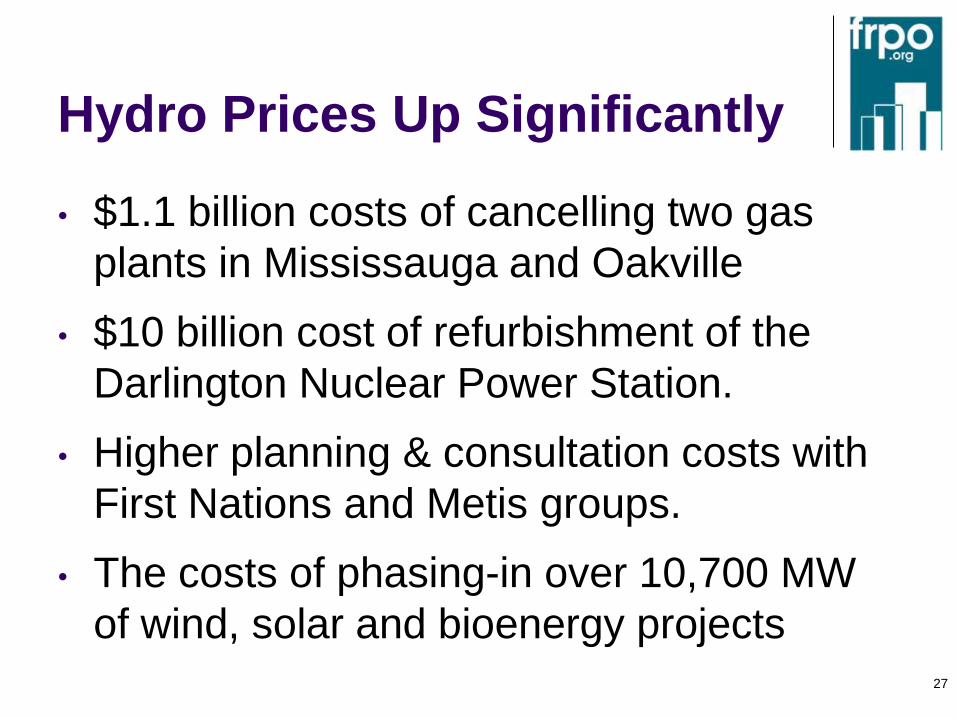
Hydro Prices Up Significantly
• $1.1 billion costs of cancelling two gas
plants in Mississauga and Oakville
• $10 billion cost of refurbishment of the
Darlington Nuclear Power Station.
• Higher planning & consultation costs with
First Nations and Metis groups.
• The costs of phasing-in over 10,700 MW
of wind, solar and bioenergy projects
27
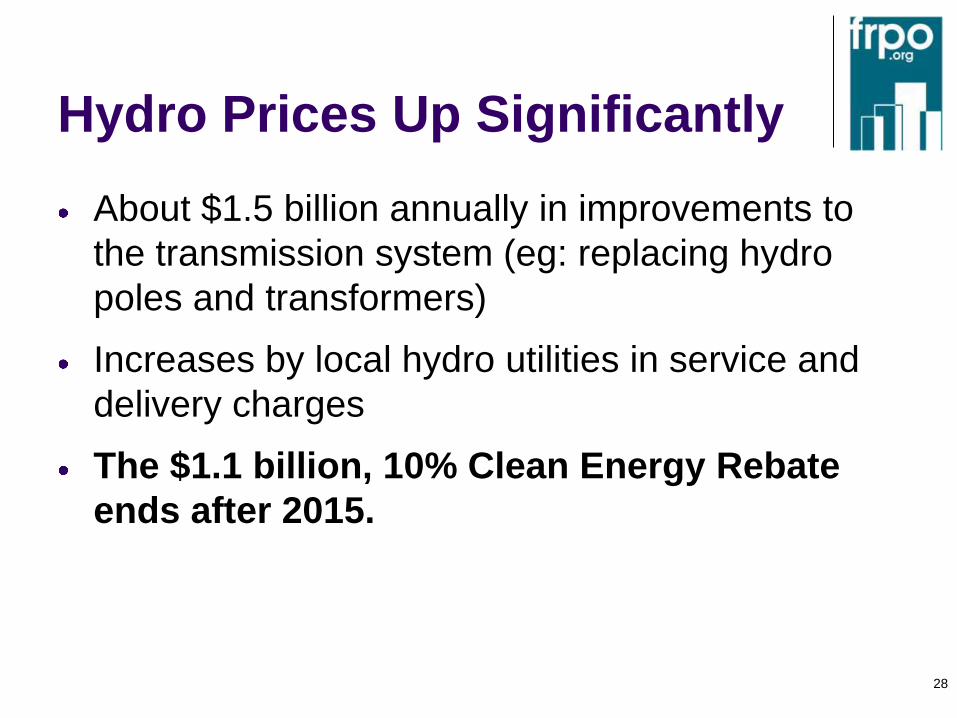
Hydro Prices Up Significantly
About $1.5 billion annually in improvements to
the transmission system (eg: replacing hydro
poles and transformers)
Increases by local hydro utilities in service and
delivery charges
The $1.1 billion, 10% Clean Energy Rebate
ends after 2015.
28

Future Hydro Price Hikes
29
-2%
0%
2%
4%
6%
8%
10%
12%
14%
16%
18%
2014 2015 2016 2017 2018 2019 2020 2021 2022 2023
An
nu
al In
crea
se (
%)
Typical Electricity Bill Forecast (10 Years) LTEP Forecast
"Realistic" Forecast
10%
OCEB
ends in
2016
Source: Ontario Ministry of Energy, 2013, Long Term Energy Plan; FRPO Calculations
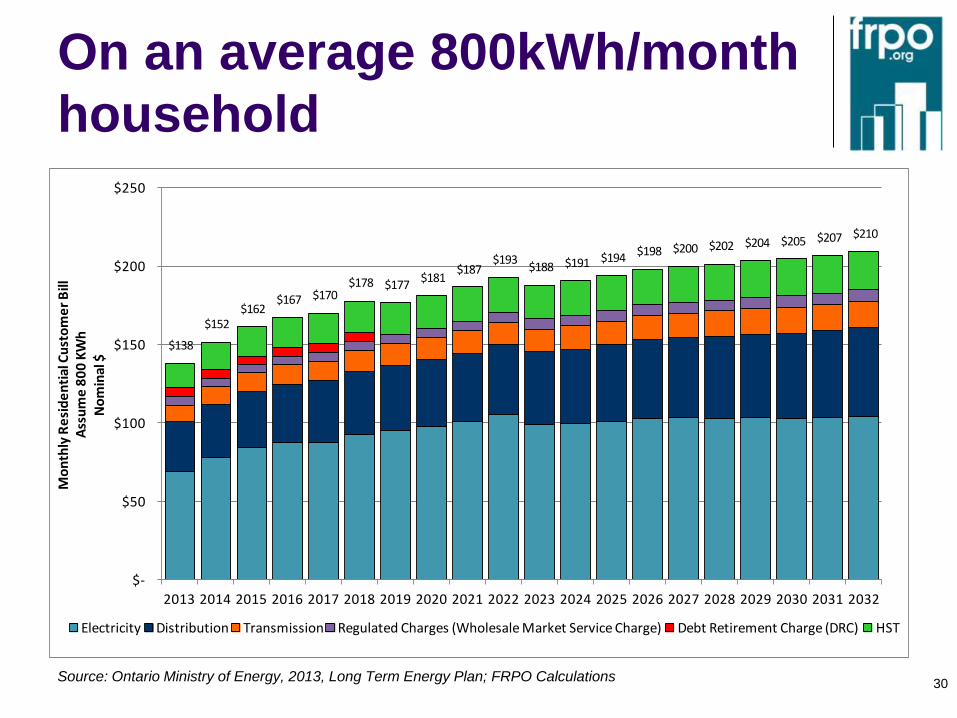
On an average 800kWh/month
household
30
$138
$152 $162
$167 $170 $178 $177
$181 $187
$193 $188 $191 $194
$198 $200 $202 $204 $205 $207 $210
$-
$50
$100
$150
$200
$250
2013 2014 2015 2016 2017 2018 2019 2020 2021 2022 2023 2024 2025 2026 2027 2028 2029 2030 2031 2032
Mo
nth
ly R
esi
de
nti
al C
ust
om
er
Bill
A
ssu
me
80
0 K
Wh
No
min
al $
Electricity Distribution Transmission Regulated Charges (Wholesale Market Service Charge) Debt Retirement Charge (DRC) HST
Source: Ontario Ministry of Energy, 2013, Long Term Energy Plan; FRPO Calculations

Hydro Prices Since 2002
31

Natural Gas: The Impact of
Cold • A long cold winter has dramatically impacted
natural gas prices
• NYMEX price increased 75% from Nov 2013
to Feb 2014
• Prices impacted by limited storage and
pipeline transmission capacity
• Hard to meet demand of long, cold winter
• Low inventory can impact supply for next
winter
• Storage levels at 10+ year lows 32

Natural Gas: The Impact of
Cold
33
$3.00
$3.25
$3.50
$3.75
$4.00
$4.25
$4.50
$4.75
$5.00
$5.25
$5.50
$5.75
$6.00
$6.25
1-A
pr-
13
15
-Ap
r-1
3
29
-Ap
r-1
3
13
-May
-13
27
-May
-13
10
-Ju
n-1
3
24
-Ju
n-1
3
8-J
ul-
13
22
-Ju
l-1
3
5-A
ug-
13
19
-Au
g-1
3
2-S
ep
-13
16
-Se
p-1
3
30
-Se
p-1
3
14
-Oct
-13
28
-Oct
-13
11
-No
v-1
3
25
-No
v-1
3
9-D
ec-
13
23
-Dec
-13
6-J
an-1
4
20
-Jan
-14
3-F
eb
-14
17
-Fe
b-1
4
3-M
ar-1
4
17
-Mar
-14
31
-Mar
-14
US$
/MM
Btu
Natural Gas Futures - Prompt Month(April 1, 2013 to March 31, 2014)
Gas prompt - NYMEX

Municipal Act Pitfalls
Licensing & Utility Arrears
34
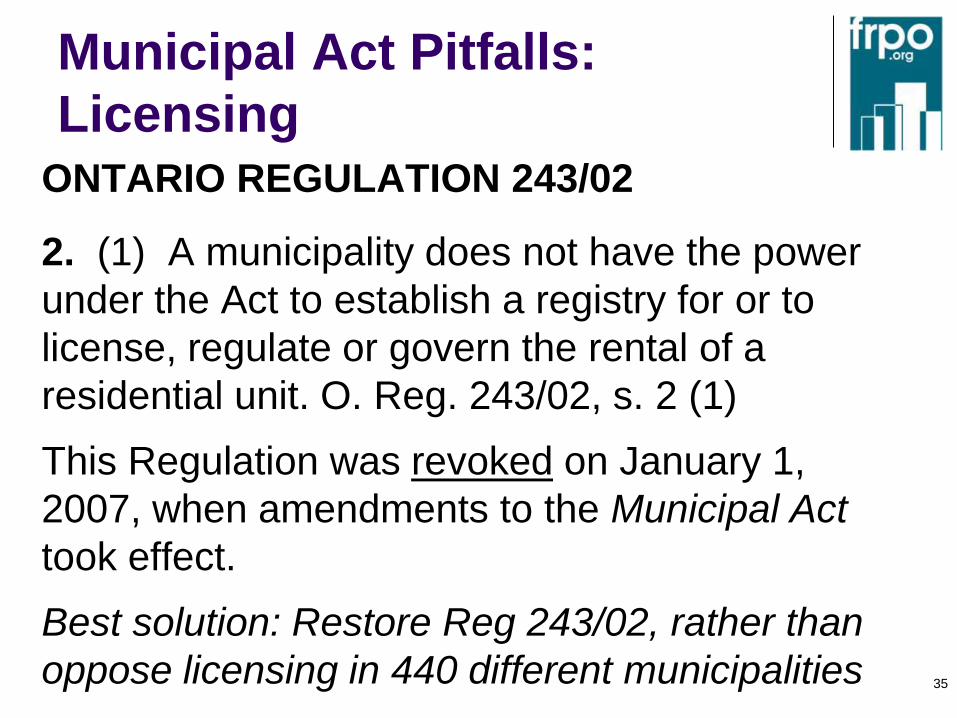
Municipal Act Pitfalls:
Licensing ONTARIO REGULATION 243/02
2. (1) A municipality does not have the power
under the Act to establish a registry for or to
license, regulate or govern the rental of a
residential unit. O. Reg. 243/02, s. 2 (1)
This Regulation was revoked on January 1,
2007, when amendments to the Municipal Act
took effect.
Best solution: Restore Reg 243/02, rather than
oppose licensing in 440 different municipalities 35

A big, new cost for landlords
and tenants – with no benefit
36
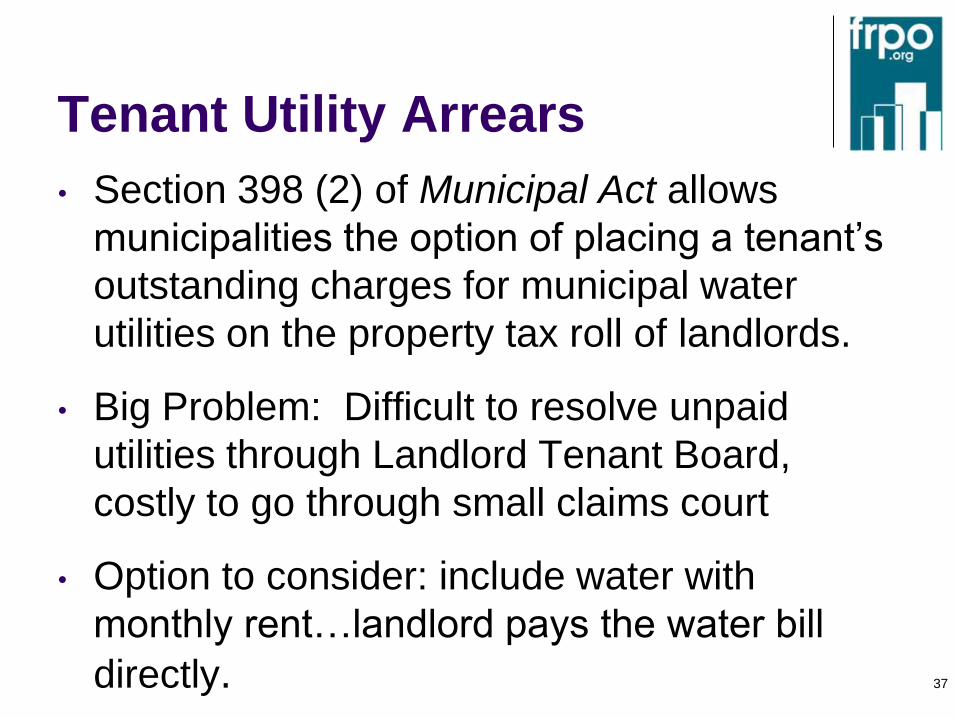
Tenant Utility Arrears
• Section 398 (2) of Municipal Act allows
municipalities the option of placing a tenant’s
outstanding charges for municipal water
utilities on the property tax roll of landlords.
• Big Problem: Difficult to resolve unpaid
utilities through Landlord Tenant Board,
costly to go through small claims court
• Option to consider: include water with
monthly rent…landlord pays the water bill
directly.
37

Poverty &
Affordability
38
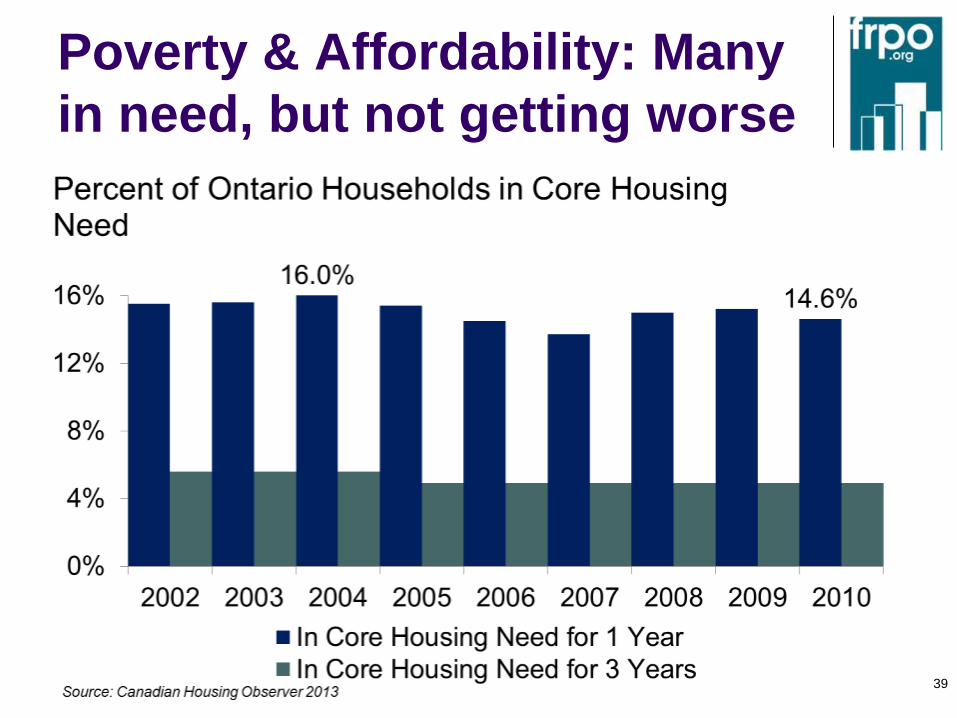
Poverty & Affordability: Many
in need, but not getting worse
39

Youth Unemployment:
Similar to previous recessions
40
Early 80’s
recession Early 90’s
recession
Late 00’s
recession

Immigration
41
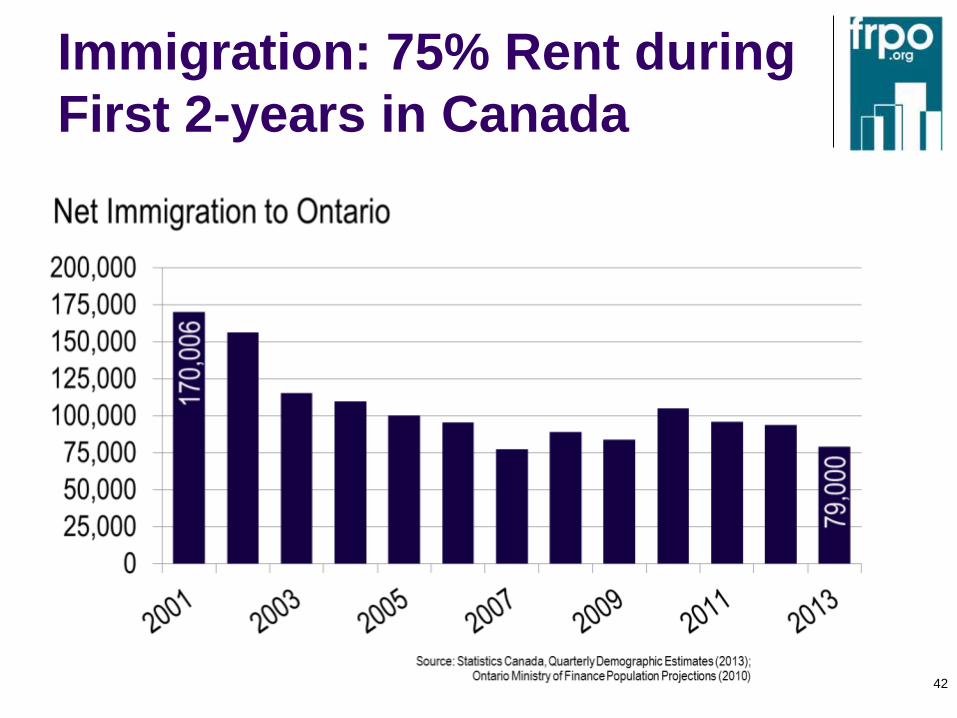
Immigration: 75% Rent during
First 2-years in Canada
42
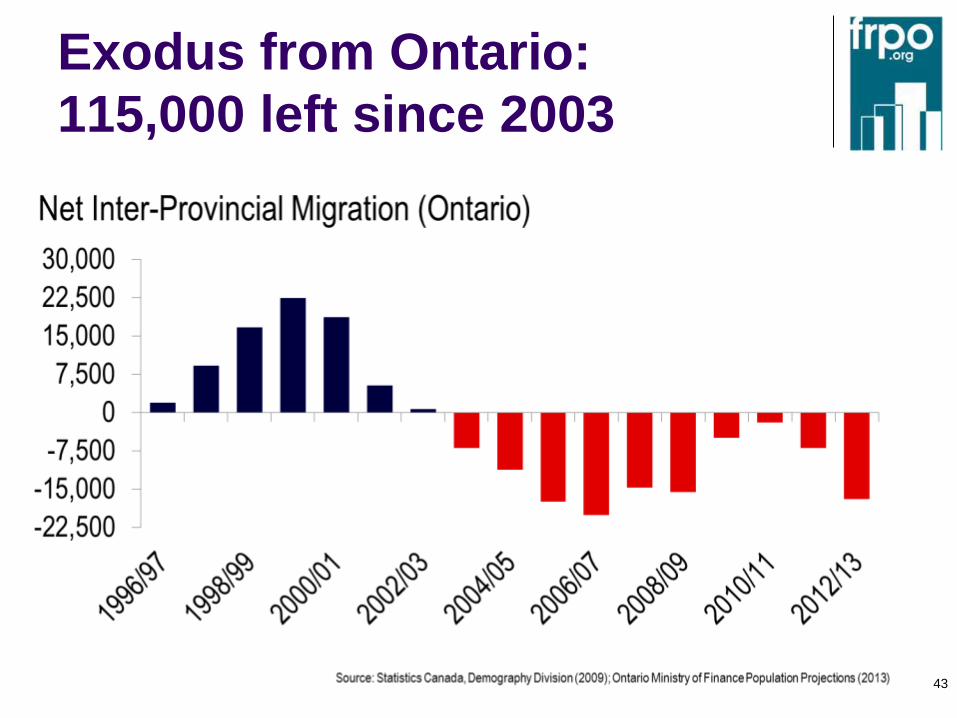
Exodus from Ontario:
115,000 left since 2003
43

Renting is the New
Normal
44

Renting is the New Normal
45
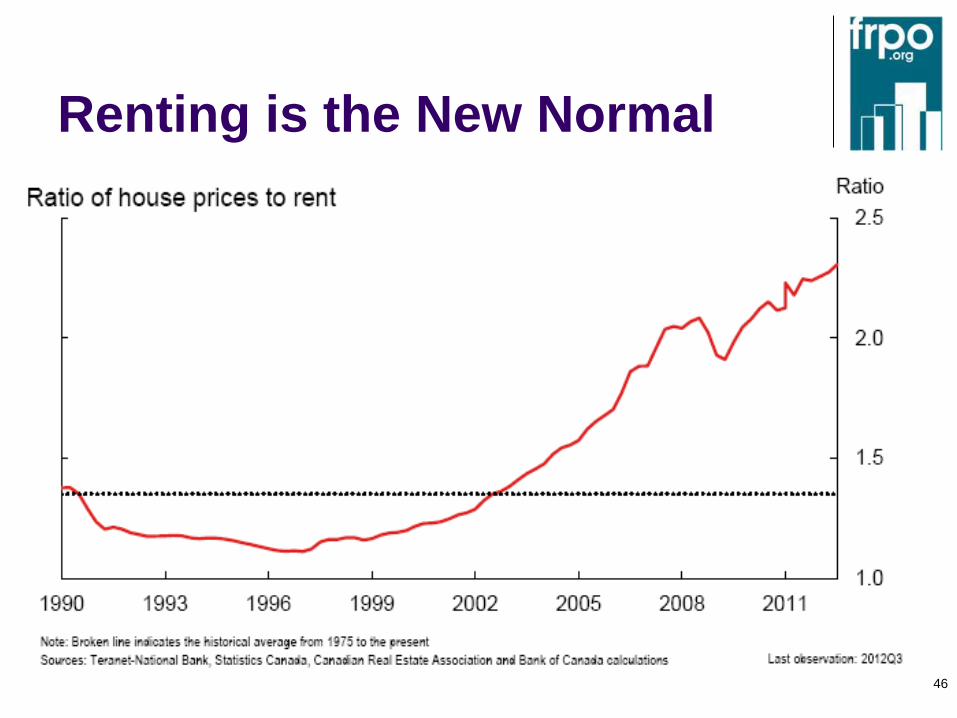
Renting is the New Normal
46