The State of our Toolbox: A Meta-analysis of Reliability …€¦ · The widespread usage of...
93
Florida International University FIU Digital Commons FIU Electronic eses and Dissertations University Graduate School 11-20-2012 e State of our Toolbox: A Meta-analysis of Reliability Measurement Precision Krzysztof Duniewicz Florida International University, kduni001@fiu.edu Follow this and additional works at: hp://digitalcommons.fiu.edu/etd is work is brought to you for free and open access by the University Graduate School at FIU Digital Commons. It has been accepted for inclusion in FIU Electronic eses and Dissertations by an authorized administrator of FIU Digital Commons. For more information, please contact dcc@fiu.edu. Recommended Citation Duniewicz, Krzysztof, "e State of our Toolbox: A Meta-analysis of Reliability Measurement Precision" (2012). FIU Electronic eses and Dissertations. 818. hp://digitalcommons.fiu.edu/etd/818
-
Upload
nguyenthuan -
Category
Documents
-
view
218 -
download
0
Transcript of The State of our Toolbox: A Meta-analysis of Reliability …€¦ · The widespread usage of...
Florida International UniversityFIU Digital Commons
FIU Electronic Theses and Dissertations University Graduate School
11-20-2012
The State of our Toolbox: A Meta-analysis ofReliability Measurement PrecisionKrzysztof DuniewiczFlorida International University, [email protected]
Follow this and additional works at: http://digitalcommons.fiu.edu/etd
This work is brought to you for free and open access by the University Graduate School at FIU Digital Commons. It has been accepted for inclusion inFIU Electronic Theses and Dissertations by an authorized administrator of FIU Digital Commons. For more information, please contact [email protected].
Recommended CitationDuniewicz, Krzysztof, "The State of our Toolbox: A Meta-analysis of Reliability Measurement Precision" (2012). FIU Electronic Thesesand Dissertations. 818.http://digitalcommons.fiu.edu/etd/818
FLORIDA INTERNATIONAL UNIVERSITY
Miami, Florida
THE STATE OF OUR TOOLBOX: A META-ANALYSIS OF RELIABILITY
MEASUREMENT PRECISION
A thesis submitted in partial fulfillment of the
requirements for the degree of
MASTER OF SCIENCE
in
PSYCHOLOGY
by
Krzysztof Duniewicz
2012
ii
To: Dean Kenneth G. Furton College of Arts and Sciences This thesis, written by Krzysztof Duniewicz and entitled The State of our Toolbox: A Meta-analysis of Reliability Measurement Precision having been approved in respect to style and intellectual content, is referred to you for judgment. We have read this thesis and recommend that it be approved.
_______________________________________
Victoria L. Pace
_______________________________________ Chockalingam Viswesvaran
_______________________________________ Jesse S. Michel, Major Professor
Date of Defense: November 20, 2012 The thesis of Krzysztof Duniewicz is approved.
_______________________________________ Dean Kenneth G. Furton
College of Arts and Sciences
_______________________________________ Dean Lakshimi N. Reddi
University Graduate School
Florida International University, 2013
iii
ABSTRACT OF THE THESIS
THE STATE OF OUR TOOLBOX: A META-ANALYSIS OF RELIABILITY
MEASUREMENT PRECISION
by
Krzysztof Duniewicz
Florida International University, 2012
Miami, Florida
Jesse S. Michel, Major Professor
My study investigated internal consistency estimates of psychometric surveys as
an operationalization of the state of measurement precision of constructs in industrial and
organizational (I/O) psychology. Analyses were conducted of samples used in research
articles published in the Journal of Applied Psychology between 1975 and 2010 in five
year intervals (K = 934) from 480 articles yielding 1427 coefficients. Articles and their
respective samples were coded for test-taker characteristics (e.g., age, gender, and
ethnicity), research settings (e.g., lab and field studies), and actual tests (e.g., number of
items and scale anchor points). A reliability and inter-item correlations depository was
developed for I/O variables and construct groups. Personality measures had significantly
lower inter-item correlations than other construct groups. Also, internal consistency
estimates and reporting practices were evaluated over time, demonstrating an
improvement in measurement precision and missing data.

iv
TABLE OF CONTENTS CHAPTER PAGE
I. INTRODUCTION……………………………………..………………...… 1
II. LITERATURE REVIEW……………………………..………………….... 1
Classical test theory………………………………………………….… 2 Study Purpose………………………………………………………..… 5 Characteristics that influence reliability: a. Individuals…………………………………………..………………6 b. Testing situations………………………………………………...… 7 c. Actual tests……………..………………………………………..… 9 Reliability according to I/O constructs………………………………… 12 Trends and reporting practices……………………………………….… 15
III. PRESENT STUDY…………………………………………..…………..… 17
IV. METHOD……………………………………………………..………….... 17 Sample………………………………………………………………..…17 Coding procedure…………………………………………………….… 18 Analyses………………………………………………………………... 21
V. RESULTS…………………………………………………..……………… 22
VI. DISCUSSION……………………………………………….…………..… 31 Recommendations for reliability precision…………………………..… 41 Limitations and future research……………………………………...… 42
REFERENCES………………………………………………………………… 45
TABLES……………………………………………………………………..… 56
v
LIST OF TABLES TABLE PAGE Table 1: Descriptive statistics for test-takers…………………………………….… 56 Table 2: Descriptive statistics for actual tests……………………………………… 60 Table 3: Means, standard deviations, and correlations among variables (data collapsed at the variable level)……………………………………………………... 64 Table 4: Means, standard deviations, and correlations among variables (data collapsed at the construct group level)……………………………………………...65 Table 5: Summary of reliability and inter-item correlation coefficients distributions for categorical variables………………………………..……………. 66 Table 6: Summary for regression analysis for predictive variables (data collapsed at the variable level)……………………………………………………... 68 Table 7: Summary for regression analysis for predictive variables (data collapsed at the construct group level)……………………………………………...69 Table 8: Summary for regression analysis predicting inter-item correlations …...... 70 Table 9: Summary for regression analysis predicting reliability…………………... 71 Table 10: Summary of I/O construct reliability and inter-item correlations coefficient distributions……………………………………………………………. 72 Table 11: Summary of scale-specific descriptives, reliability, and inter-item correlations coefficient distributions………………………………………………. 75 Table 12: Summary for average reliability for I/O construct groups by year……… 78 Table 13: Summary for average inter-item correlations for I/O construct groups by year…………………………………………………………………………….... 78 Table 14: Summary for regression analysis for trends among I/O constructs……... 79 Table 15: Summary for variable missing data by year…………………………….. 79 Table 16: Summary for regression analysis for trends in missing data………….… 80 Table 17: Distribution of content in the Journal of Applied Psychology by year….. 81

vi
Table 18: Summary of regression analyses for trends in content…………..........…85

1
THE STATE OF OUR TOOLBOX: A META-ANALYSIS OF RELIABILITY
MEASUREMENT PRECISION
INTRODUCTION/LITERATURE REVIEW
Industrial and organizational (I/O) researchers often measure unobservable human
characteristics such as job attitudes, perceptions of various work features (e.g., fairness),
and individual characteristics such as leadership capacity and personality. In order to
provide meaningful information in regards to such abstract concepts, called latent
constructs, psychometric tests are designed that are hypothesized to represent actual
behaviors (i.e., by measuring their underlying construct). Yet, developing hypotheses and
making inferences by eliciting these behaviors is not sufficient for adequate
psychological measurement. Psychometric test scores that are ascribed to actual
behaviors should exhibit two important properties: First, test scores should be consistent
across different types of measurements, and second, test scores must lead to adequate
interpretations of the underlying constructs under investigation. In other words, test
scores should be reliable and valid and the users of test scores have to convince their
audience that the scores adhere to specific statistical principles. The main overarching
statistical principles are, defined by the taxonomy of Cook and Campbell (1976) and
Scandura and Williams (2000), internal validity, external validity, construct validity, and
statistical conclusion validity. The central focus of the present study pertains to issues of
construct validity and the internal consistency of psychometric tests. Specifically, the
goal was to meta-analytically examine measurement precision and reporting practices of
item-level reliability used in I/O research. The current exploratory study consisted of an
examination of the characteristics and research design choices that impact the precision

2
of measurement tools and the development of benchmarks and commentary for the
appropriate use and future improvements of psychometric tests.
Classical Test Theory and Reliability Coefficients
Measures of internal consistency derive from Classical Test Theory (CTT) and
are meant to inform how two or more scores or conditions on a test are inter-related.
Importantly, there are many factors that can affect the internal consistency of any
estimate. For example, the passing of time, the use of different items, testing conditions,
and individual differences can all contribute to measurement error. Before describing in
detail the sources of error and their impact on reliability estimates, the following section
reviews the development of these estimates and their proliferation in test usage.
In the early 20th century, Spearman (1910) had devised the first recognized
measure of internal consistency: the split-half procedure. The mathematical equation
involved measuring the correlation of test items by separating them into odd and even
numbers. For example, a 20 item test would be split into two columns of 10 items and the
correlation of both column scores would be assessed. The Spearman method was sound
but it did not allow for deeper level statistical evaluations because simple alterations to
the formula provided inconsistent results. For example, instead of using odd and even
numbers, correlating values derived from multiples of three would result in different
coefficients estimates. Kuder and Richardson (1937) later developed the KR-20 measure
(i.e., named after the 20th formula in their seminal article) that resolved the split-half issue
but their method was still limited because it could only be applied to binary values (e.g.,
data defined by zeros and ones such as ‘yes/no’ or ‘agree/disagree’). In order to allow
more widespread application of reliability estimates, Cronbach (1951), who was largely
3
influenced by the work of Fisher (e.g., Fisher, 1918), developed a more general estimate
of internal consistency called ‘coefficient alpha’ that could be applied to any form or test
and allowed multiple mathematical permutations. Fisher, an English statistician and
evolutionary biologist formulated the concept of analysis of variance (ANOVA) to
determine optimal conditions for agricultural crop growth. Cronbach’s coefficient alpha
incorporated ANOVA principles and the KR-20 equation to create an estimate
represented by a matrix of scores that could evaluate item relationships as well as
multiple observers and/or observations.
Concurrent and subsequent advancements in CTT provided other ways to estimate
reliability of test scores (e.g., various other coefficients of internal consistency, test-retest,
form equivalence, etc.). However, the most commonly used reliability estimate today is
Cronbach’s alpha (Hogan, Benjamin, & Brezinksi, 2000). According to Cronbach and
Shavelson (2004), Cronbach’s original article has been cited over five thousand times and
approximately 350 times each year. As of August 2012, the article has been cited 17, 172
times (Google Scholar).
The widespread usage of Cronbach’s alpha as well as other statistical tools in
research studies is typically demonstrated through archival and simulation research
efforts. Such meta-analyses allow researchers to keep track of past research practices,
trace the use of methods and statistics over time, and envision future improvements. For
example, to display the ubiquitous use of coefficient alpha, Peterson (1994) reviewed 24
journals and reported 4,286 alpha coefficients ranging between .06 and .90 with a median
of .79. Rodriguez and Maeda (2006) conducted a meta-analysis of coefficient alpha and
used mathematical adjustments to account for changes in alpha as a result of test length

4
and observed score variance. Using general linear modeling, including ordinary least
squares modeling analysis of variance and regression to determine variance among
coefficient alphas, Rodriguez and Maeda conducted two studies to evaluate the efficacy
of coefficient alpha in learning consistency. As an example, their first study included a
sample of 67,821 students taking a mathematics test in different schools. The results
yielded a coefficient alpha of .93 across schools indicating a high consistency of teaching
standards.
Comparing psychometric tests and determining global estimates for measured
constructs can also be achieved using validity generalization. On the basis of the same
meta-analytic principles the particular method for internal consistency is reliability
generalization (RG). Reliability analysis carried out through generalization theory allows
for sampling from multiple sources as well as from test takers. The RG method permits
measurement error to derive from multiple sources and the influence of these sources on
a construct can be estimated. For example, researchers have applied RG to a variety of
psychometric scales such as the UCLA loneliness scale (Vassar & Crosby, 2008), the
Life Orientation Test (Vassar & Bradley, 2010), the Maslach Burnout Inventory
(Wheeler, Vassar, Worley, & Barnes, 2011), the Perception of Organizational Politics
Scale (Miller, Byrne, Rutherford, & Hansen, 2009), the Ways of Coping Scale (Rexrode,
Peterson, & O’Toole, 2008), the Survey of Perceived Organizational Support (Hellman,
Fuqua, & Worley, 2006), as well as to larger-scale constructs and their respective
measures such as the Big Five Factors (Viswesvaran & Ones, 2000). Although these
studies provide useful aggregate data for scale interpretation, the current study focused on

5
observed reliability coefficients rather than theory-generated coefficients, and primarily
on observed coefficient alpha.
The formula for Cronbach’s alpha is characterized by the number of components
or items that measure a variable, the variance of scores on these components, and the
sample size or number of responses to these components. Alpha is represented by the
Greek letter ‘α’ and the closer the alpha value is to one, the stronger the estimated
internal consistency. According to Nunnally (1967), an acceptable reliability coefficient
should be at least .70 and that is the generally accepted standard in basic research and
scale development. In the realm of I/O psychology, certain psychometric tests are used
for important personnel decisions and should be held to higher norms of reliability
precision. In other words, higher coefficients should be required for important personnel
decisions. The acceptable level of internal consistency should be relative to the
importance of the consequences related to test use, calling for a need for reliability
benchmarks or a depository of reliabilities for I/O constructs.
Study Purpose
The aim of my exploratory study was threefold. First, an investigation into
individual influences of test-takers that can contribute to error and variance in reliability
estimates was conducted. Individual characteristics such as the age, gender, and ethnicity
of sample participants can elicit differences in how test-takers respond and therefore
increase sample variance that contributes to measurement error and affects score
reliability. Also, situational influences such as conducting field surveys or experimental
lab studies and characteristics of the actual test such as the number of items and the range
of scale responses were examined. Second, my study compared average levels of
6
reliability estimates according to categories of constructs measured in order to
supplement RG studies by developing a depository for I/O related reliability estimates.
Specifically, reliability estimates were grouped into measures of behaviors, attitudes,
personality traits, abilities, and health-related outcomes. The reliability and inter-item
correlations of specific I/O variables within the five categories such as feedback seeking
(behavior), job commitment (attitude), conscientiousness (trait), leadership (ability), and
work stress (health-related outcome) were evaluated and compared. Third, I explored
trends in regards to reliability precision and how reliability estimates are reported in peer-
reviewed journals in order to ensure and encourage adequate sharing and interpretation of
reliability statistics. In short, the central theme of this study was to [1] explore the
influence of (a) individual, (b) situational, and (c) test characteristics on internal
consistency; [2] develop a summary and depository of reliabilities across types of I/O
variables and construct groups, and; [3] examine trends in reliability precision and
reporting practices.
1. Characteristics that influence reliability estimates
1.a. Characteristics of individuals
This first aim of the current study was to determine research study characteristics
that can have an impact on reliability estimates. These include individual, situational, and
test characteristics. Reliability is a feature of test scores and data rather than the
administered instruments (Rowley, 1976; Crocker & Algina, 1986; Eason, 1991). Davis
(1987) and Thomson (1994) added that because total score variance is an important
aspect of reliability the participants involved in studies will themselves affect score
reliability. For instance, using a cognitive ability example, Thomson explained that the
7
“same WISC-R that yields reliable scores for some adults on a given occasion of
measurement will not do so when the same test is administered to first-graders” (p.2).
Individual differences on reliability estimates have been found in previous RG
studies. For example, in a study of the Survey of Perceived Organizational Support
(SPOS), Hellman, Fuqua, and Worley (2006) found significant effects for age on
reliability coefficients. These findings support a previous notion that there can be a
positive relationship between age and certain work attitudes such as job satisfaction, job
involvement, and organizational commitment (see Rhodes, 1983 for a review). Other RG
studies also found that reliability varied in terms of individual characteristics such as
gender (Caruso, 2000; Caruso, Witkiewitz, Belcourt-Dittloff, & Gottlieb, 2001; Caruso &
Edwards, 2001; Beretvas, Suizzo, Durham, & Yarnell, 2008) age (Caruso & Edwards,
2001; Caruso, Witkiewitz, Belcourt-Dittloff, & Gottlieb, 2001), and other individual
features such as student and clinical samples (e.g., Caruso, 2000; Vacha-Haase, Kogan,
Tani, & Woodall, 2001). Another important feature of individual test-takers that has been
less studied in terms of variation in reliability is the ethnic/cultural distribution of study
samples and as such, the present study examined whether these characteristics had an
impact on reliability coefficients.
1.b. Characteristics of testing situations
Researchers constantly have to make decisions on the methods they will use in
order to test hypotheses and provide meaningful results that are reliable and valid. The
resulting choices often involve considerations of feasibility, cost, duration, and adherence
to ethical standards. Moreover, because there are inherent benefits and limitations within
different methods, I/O researchers have to resolve the dilemmas that inevitably come
8
with the methodological decisions they make (Stone-Romero, 2002). For example,
choosing to conduct a lab experiment over a field study or using a questionnaire that was
adapted and translated from another culture will provide advantages and disadvantages
for certain types of validity. Lab experiments offer strict control over measurement
constructs and provide strong internal validity but this strictness of research
characteristics puts into question the generalizability (external validity) of the resulting
data. On the other hand, conducting a field survey across organizations typically brings to
mind issues of causality and common method variance rather than generalization
problems associated with using student samples. In a meta-analysis of study limitations,
Brutus, Gill, and Duniewicz (2010) found there are indeed correlations between
methodological choices and different reported limitations. They found that the use of
survey was positively associated with internal validity issues and negatively associated
with external validity issues whereas experiments demonstrated the same relationships in
opposite directions. The authors also found that low reliability was reported in five
percent of their sample (N=1903, from 1995 to 2008) and was significantly more often
reported in surveys than other methods.
The testing environment can have special significance to test-takers. For example,
if a test environment is perceived as being evaluative in nature, it is more likely that high-
anxious individuals experience threat perceptions and anticipate negative consequences
that will affect their test performance (Sarason & Pierce, 1995). As such, individuals may
perceive high-stakes testing conditions such as those that involve personnel decisions
(e.g., hiring and promotions) as anxiety evoking whereas typical student lab experiments
may not elicit the same emotions that can lead to variance. Because lab experiments often
9
use student samples that are more homogeneous than working samples, it is expected that
reliability estimates will be higher for tests administered during lab experiments than for
tests administered in the field and/or used alongside other non-survey methods such as
interviews and observations.
Also, since it has been previously found that the language of administration can
impact reliability (Caruso & Edwards, 2001), my study compared reliability estimates
reported in studies conducted outside of North America in order to determine whether or
not construct measurement varied according to the area in which the psychometric test
was administered (e.g., by losing reliability in translation or by geographical/cultural
differences).
1.c. Characteristics of actual tests
Test characteristics that can contribute to error in measurement include the
complexity of items (e.g., Traub, 1994), the number of test items (e.g., Caruso &
Edwards, 2001), and survey decisions such as the range of scale points (e.g., Anastasi,
1976; Eysenck, 1982; Covington & Omelich, 1987). Because of the difficulty of
comparing test difficulty in a global meta-analysis, my study focused on the number of
test items and scale points.
The number of items in a measure has a direct impact on reliability. According to
Cortina (1993), there is a tendency for reliability to increase as a function of the number
of items in a psychometric scale. It is generally understood by the Spearman-Brown
prophecy that adding similar items in a test increases internal consistency estimates.
Psychometricians traditionally use the Spearman-Brown formula to determine scale
reliability after changing the length of a scale. Because the relationship between test

10
length and test reliability is nonlinear, the number of items required grows increasingly
larger the more precise the desired reliability. The test length and reliability relationship
indicates the importance of taking into account inter-item correlations because the true
precision of alpha is measured in terms of the standard error of inter-item correlations.
High inter-item correlations indicate that the items are measuring the same underlying
construct and hence, as inter-item correlations increase, Cronbach’s alpha increases as
well (Kuder & Richardson, 1937; Deese, 1959). Accounting for inter-item correlations is
important because these correlations determine reliability while accounting for the
number of items. For example, a measure with 30 items, with an inter-item correlation of
.30 would yield a higher alpha (α = .93) than a measure of 10 items with an inter-item
correlation of .50 (α = .89), though the inter-item correlations are much lower. As such,
the current study also incorporated inter-item correlations as coefficient alpha by itself
provides an incomplete assessment of scale reliability.
Another common theme in psychometric decisions is the range of scaled items. It
has been previously speculated that the number of anchor points does not make much of a
difference in terms of the internal consistency and stability of a scale (e.g., Komorita,
1963; Matell & Jacoby, 1972; Shutz & Rucker, 1975). On the other hand, Bass, Cascio,
and O’Connor (1974) found that the percentage of overlap in test-takers’ judgments of
frequency increased as the number of anchor points increased, suggesting there may be
an effect on reliability. Having more anchor points allowed for finer judgments that
subsequently improved reliability estimates. In a computer simulation study of a clinical
scale, Cicchetti, Showalter, and Tyrer (1985) found that dichotomous scales provided the
lowest reliability and that reliability increased with the number of scale points but

11
differences in reliability between seven-to-ten and 100-point scales were negligible.
Symonds (1924) originally recommended seven categories as the optimal number of
scale points (albeit for inter-rater reliability specifically) and Miller (1956) later
supported this view by indicating that the human brain is limited to process around seven
different items (plus or minus two), suggesting that adding more categories to scale items
would not provide more useful information. Conversely, other researchers have suggested
that the optimal number can be as high as 20 to 25 scale points (e.g., Guilford, 1954;
Garner, 1960). Using a Monte-Carlo approach, Lissitz and Green (1975) simulated the
effects of different numbers of scale points on three reliability measures. They found that
coefficient alpha estimates leveled off after five scale points and recommended that
researchers do not exceed five scale points because of the negligible increase in reliability
precision. Oaster (1989) came to a similar conclusion with seven scale points in regards
to test-retest and inter-item consistency. In terms of user preferences, Preston and Colman
(2000) found that test-takers preferred scales with five, seven and 10 scale points over
scales with 11 or more although the test-takers perceived that 11 and 101 scale points
“allowed you to express your feelings [more] adequately” (p.11). In sum, although there
is no general agreement on one optimal number of scale points, it seems that two or three
scale points are inadequate in providing enough meaningful information and more than
nine scale points provide minimal improvements in statistical precision (see Cox, 1980
for a review).
My study examined the characteristics of actual tests such as the number of test
items and scale points on average inter-item correlations and reliability. Further, because
few or no studies have examined the effects of the type of anchor scale used, this study
12
compared reliability estimates and inter-item correlations according to different types of
anchor scales (e.g., agreement, frequency, and magnitude). An additional consideration of
this study was to determine whether the study authors themselves had an impact on
reliability precision by recording their affiliation, or specifically, if they were
researchers/academics, consultants/organization-based, or mixed.
2. Reliability according to measured I/O constructs
The second aim of the current study was to compare construct-level attributes
because reliability estimates can also vary as a function of the constructs being measured.
Variables in I/O research can be classified into construct categories and these categories
could potentially be used as benchmarks for comparing reliability estimates. For
example, Mischel (1969) made a compelling argument that behaviors are less stable than
personality traits and therefore lower reliability estimates can be expected. The
measurement of personality was argued to be represented by stable, reliable, and highly
generalizable response patterns whereas the unreliability of behavioral measures was
interpreted to be due to the inconsistent and unstable nature of human behavior, rater
errors, and various methodological problems. Epstein (1979, 1980) later suggested that
measurement error and reliability in behavioral assessments can be stabilized by
aggregating ratings over situations and occasions. He found that measures of personality
and attitudes had low correlations with single direct observations of behaviors and that
reliability and stability increased when behavior was averaged over multiple events and
ratings. Corresponding closely to the Spearman-Brown formula, aggregating data (e.g.,
over subjects, situations, stimuli, or time), reduces measurement error, improves
reliability, and broadens the range of data generalizability. However, using an

13
aggregation strategy, Henson, Kogan, and Vacha-Haase (2001) found substantial
variation in reliability estimates of different scales for measuring teacher behaviors and
effectiveness, supporting the notion that behaviors may indeed be less stable than other
construct groups.
In accordance with Mischel (1969), if personality traits are more stable and
enduring than behaviors and abilities, then the tools researchers use to measure stable
constructs should demonstrate similar psychometric stability and precision. In fact,
previous studies have shown the opposite. Caruso (2000) found a large amount of
variability in reliability estimates of NEO personality scales. Specifically, agreeableness
provided the lowest reliability estimates, especially for males and clinical samples. In
other RG studies, researchers found an effect of age and student sampling to contribute to
variation in reliability scores of the Eysenck Personality Questionnaire (Caruso,
Witkiewitz, Belcourt-Dittloff, & Gottlieb, 2001) as well as scale length, gender, language
of administration, and age for the Junior Eysenck Personality Questionnaire (Caruso &
Edwards, 2001). Vacha-Haase, Kogan, Tani, and Woodall (2001) found that reliability
varied in terms of age, clinical/non-clinical samples, and different versions of the
Minnesota Multiphasic Personality Inventory (MMPI). Reliability was also found to vary
(e.g., due to gender effects) in a study comparing locus of control scales (Beretvas,
Suizzo, Durham, & Yarnell, 2008). These research examples indicate there is at least
some instability in reliability estimates within personality measurement.
There are fewer RG studies that have examined constructs within the realms of
behaviors, abilities, and attitudes. Surprisingly, considering that one of the most relevant
and studied variable in I/O research is job performance (Campbell, Gasser, & Oswald,
14
1996). Viswesvaran, Ones, and Schmidt (1996) found reliability differences between peer
and supervisor ratings as well as between interrater and intrarater ratings of job
performance. Also, as mentioned, Henson, et. al. (2001) found variations among different
measures of teacher effectiveness. Their data allowed the authors to determine which
scales were most biased by low reliability as a consequence of sampling (e.g., in this
case, gender) and psychometric properties to make recommendations for which scales
best represent the underlying construct (e.g., teacher effectiveness). It was also previously
mentioned that cognitive ability had a direct relationship with reliability and as such, it is
expected that like behaviors, ability measures are often involved in evaluative decision-
making (e.g., hiring/promotion) and are prone to response and rater errors. In the current
study, it was expected that behaviors and abilities constructs would yield lower reliability
estimates than personality and attitude constructs.
In terms of attitudes, Wallace and Wheeler (2002) provided support for the
stability of this type of construct. In an RG study of the Life Satisfaction Index (LSI), the
authors found adequate average reliability across studies, and found no significant effect
of other sample or psychometric attributes (e.g., age, gender, ethnicity, language, number
of items, length of scale, etc.). The authors did mention that an important limitation to
their findings was missing data and poor reporting practices. Fittingly, in the study by
Henson and colleagues (2002), the authors also conceded that their results may have been
inflated by poor reporting practices, noting that many studies in their sample did not
report reliability estimates and/or relied on past estimates in validation studies. The
current study compared reliability estimates and inter-item correlations among categories
of I/O constructs including: behaviors, abilities, attitudes, personality traits, and health-
15
related outcomes and examined trends and reporting practices such as missing data,
discussed next.
3. Trends in internal consistency precision and reporting practices
The final aim of the current study was to explore trends in reliability precision and
reporting practices as well as to offer recommendations for improvements in the
communication and interpretation of estimates. With the passing of time, technological
and theoretical advances should improve the precision of psychometric assessments,
assuming that researchers are motivated by achieving scientific rigor and work on
improving the measurement of psychological constructs. Better scales and higher
standards/benchmarks for reliability estimation should be apparent over time and as such,
it was expected that, generally, construct measurement in terms of reliability precision
improved over time.
Examining trends in precision will most likely be affected by statistics reporting
practices. It is not a novel concept that researchers have argued that many scales
described in various journals articles do not include adequate reports of psychometric
properties (e.g., Vacha-Haase, Kogan, & Thompson, 2000; Henson, 2001; Meier &
Davis, 1990; Wilson, 1980). For example, Vacha-Haase, Kogan, and Thompson (2000)
argued that many researchers practice ‘reliability induction’, that is the process of relying
on test manual or test validation reliability coefficients for actual study data. Henson
(2001) added that few studies report adequate psychometric data that can be useful for
future meta-analytical efforts. In a study on reliability reporting practices, Meier and
Davis (1990) found an alarmingly low number of reported estimates in a counseling
journal, although they did notice an increase over time. Fortunately, some journals are

16
more stringent in regards to data reporting practices. Journal editors increasingly
recognize the weakness in publication manuals and encourage authors to report adequate
coefficients and effect size information (Baugh, 2000). For example, in an editorial on
policies of the Journal of Applied Psychology, Murphy (1997) declared “So far, I have
not heard a good argument against presenting effect sizes. Therefore, unless there is a real
impediment to doing so, you should routinely include effect size information in the
papers you submit” (p. 4). Baugh (2000) also noted that although reporting effect size is
becoming increasingly recognized as a necessary practice, many researchers do not fully
understand the critical factors that determine these estimates. Score reliability is one such
factor that is fundamental in statistical measurement and can have a potentially
detrimental influence on effect size interpretations (Henson, 2001).
Aside from the general prescription of publication manuals for researchers to
report score reliability in their findings, little attention has been given to the
appropriateness of reliability estimate reporting in order to allow for adequate coefficient
interpretation and future meta-analytical use. Meier and Davis (1990) made the following
observations to researchers: First, many authors use the term ‘internal consistency’
loosely when reporting estimates. Internal consistency covers various different techniques
including split-half, KR-20, coefficient alpha, as well as other techniques based on
analysis of variance models. They recommended that journal editors insist that authors
identify the specific reliability method employed. Second, in accordance with Henson
(2001), because the source of many reliability estimates are unclear, readers may make
the erroneous assumption that the estimate derived from the study cited. Hence, they
recommended that authors explicitly report their own estimates because reliability is not a

17
characteristic of psychometrics but rather of individual test scores. Reliability estimates
differ in accordance to changes in sample composition and/or score variability and
researchers should compare their estimates with the sample composition and score
variability of previously reported coefficients (Thomson & Vacha-Hasse, 2000). Another
recommendation offered by Meier and Davis (1990) is to reinforce reader understanding
of sampling variance by encouraging authors to routinely report confidence intervals and
their related estimation methods alongside test score reliability. If such discussions on
reliability reporting have had an impact on actual reporting practices, then the
proliferation of using precise coefficient terms, reporting current study estimates, and
even reporting effect sizes should be apparent over time. My study examined such trends
in reliability reporting practices.
PRESENT STUDY
Overall, my study describes the state and trends of reliability estimation in I/O
research. Advantages of examining the state of reliability include adding to our
understanding of characteristics that influence test reliability and the development of
benchmarks for I/O construct measurement through a depository of reliability estimates.
Advantages of analyzing the trends in reliability include determining the level of progress
in reliability measurement precision and the evolution of statistical data reporting
practices.
METHOD
Sample
Journal articles that report reliability coefficients were collected using the
electronic database ‘PsycArticles’. The sample consists of all the articles published in the

18
Journal of Applied Psychology during the years 1975, 1980, 1985, 1990, 1995, 2000,
2005, and 2010. The target journal was selected because of its’ reputation for publishing
influential articles in I/O psychology (Zickar & Highhouse, 2001) and hence should
adhere to stricter guidelines for reporting statistical information. The decision to sample
data every five years provided the opportunity to go back a longer period of time in an
attempt to capture changes of measurement precision over time while maintaining a
manageable number of articles to be coded. Only quantitative research articles that
included at least one psychometric survey were coded, thus qualitative articles, book
reviews, and other commentaries were excluded. Out of the 773 articles published, 480
articles met these criteria and were included in the present study yielding 1427
coefficients from 934 samples. Further, because a small number of articles used the same
sample and in order not to violate the assumption of independence, data were aggregated
and reported at the sample level for each variable (e.g., turnover intentions) and construct
group (e.g., behaviors) level. Specifically, reliability and inter-item correlations estimates
were aggregated to ensure each level of analysis did not violate the assumption of
independence.
Coding procedure
I conducted the coding in this study. Thirty studies that met the selection criteria
were chosen randomly and coded by a subject matter expert (SME; e.g., advanced
doctoral student) to establish preliminary coder inter-reliability. Coder agreement was
estimated using Cohen’s kappa, a statistical measure for inter-rater agreement for
categorical variables (Fleiss, 1971). Thus inter-rater agreement was determined as
disagreement vs. agreement for each piece of information coded (e.g., 0=disagreement,

19
1=agreement). As a consequence of the objective nature of the study variables (e.g.,
sample sizes, coefficient estimates), inter-rater agreement was relatively high (К = .89)
following the guidelines of Landis and Koch (1977) and instances of disagreement were
discussed and resolved in order to improve subsequent coding. Thus, having the coding
performed by one individual in this study seemed sufficient. Content analysis was used to
transform textual material into quantifiable data. Content analysis has become a common
approach for transforming textual information into interpretable data (Patton & Johns,
1997). Coding included the following variables:
a) Sample size and descriptive variables
The number of participants of each sample was recorded alongside any
descriptive information about the sample. Specifically, sample mean age, sample gender
distribution (e.g., percentage of female participants), ethnicity distribution of the sample
(e.g., percentage of White participants), whether the sample was comprised of students,
and whether the study was conducted inside or outside of North America were coded. In
addition, in order to provide additional information and a more robust index of
participants’ age, the standard deviation of age was recorded when reported. Finally,
author affiliation was coded using a method for multiple authors similar to that used by
Silzer and Parson (2012), which indicates whether authors are academic/researchers only,
consultant/organization-based authors only, or a mix of both.
b) Test characteristics
The number of items used to measure each variable and the number of scale
points was recorded. Also, the type of scale used (e.g., agreement, frequency, magnitude-
extent, and quality) was coded. For example, an author reporting items measured on a

20
seven point Likert-type scale ranging from (1=’not at all’ to 7=’to a great extent’) was
coded as seven anchor points in a magnitude-extent scale.
c) Construct characteristics
The variables measured (e.g., as reported by the study authors) were recorded and
then classified into the five main construct categories: Behaviors, abilities, personality
traits, attitudes, and health outcomes. The classification of variables into construct groups
was performed by two independent SME’s (e.g., the author and the same doctoral student
used for coder reliability). For a more exhaustive inclusion of I/O variables, the
classification was conducted post-hoc. The list of measured variables was generated from
literature and the data and then the two SME’s separated the most commonly measured
variables into their respective construct groups. Coder agreement was verified using
Cohen’s kappa. Total agreement was relatively high (К = .83) and instances of
disagreement were discussed and resolved in order to improve the distribution of
variables in their respective groups.
d) Reliability characteristics
The type (e.g., KR-20, coefficient alpha) and estimated reliability (e.g., .70, .95)
for each study variable was recorded. On the basis of this information and the number of
items used to measure a variable, average inter-item correlations were also calculated
using the appropriate mathematical permutations.
e) Reporting style
The presentation and communication of reliability estimates were recorded by
coding whether a study author used actual coefficient terms or vague descriptions such as
internal consistency. Also, whether authors explicitly reported that reliability estimates
21
derived from actual study data or from previous validation studies or test developers was
coded. Coefficients that did not correspond to actual study samples were omitted from
analysis. Missing information at the level of any variable was also recorded and analyzed
over time by transforming all values into binary code (e.g., and value = ‘1’ for present
and ‘0’ for absent).
Analyses
Reliability coefficients and their properties (e.g., sample and test characteristics)
were first cumulated and descriptive information was generated to indicate the numbers
and types of studies in the sample in relation to all variables. Exploratory analyses were
conducted using a variety of statistical techniques. For example, reliability differences
among categorical variables (e.g., I/O construct group, type of anchor scale) were
evaluated by examining the means, standard deviations, and 95% confidence interval
overlap of reliability and average inter-item correlation coefficients (as in Visweswaran
& Ones, 2000). The sampling error associated with the coefficients was calculated as the
standard deviation divided by the square root of the number of estimates. A matrix of
correlations was computed to determine relations among scale variables (e.g., age,
gender, number of items, etc.). The predictive power of all scale variables on reliability
outcomes was determined using regression analysis. Regressions were used to
statistically demonstrate whether specific sample or test characteristics had a unique or
incremental predictive impact on reliability estimates. Using regressions analyses allowed
for linear modeling that determined which variable(s) best fit(s) the data and predicted
the magnitude of score reliability. Regression analyses were also used to measure trends
22
over time. Subsequent analyses using this method were also used to determine any trends
at the discrete variable level such as specific scales used and journal content analysis.
Finally, because of the exploratory nature of this study, power analyses were
conducted in order to determine the likelihood of making statistical inference errors and
avoid making erroneous inferences. ‘Type I’ errors occur when a true null hypothesis is
rejected and ‘Type II’ errors occur when a false null hypothesis is not rejected (see
Cohen, 1994, Sedlmeier & Gigerenzer, 1989, and Zwick & Marascuilo, 1984 for
reviews). Determining statistical power, in this case, consisted of estimating effect sizes
(e.g., small, medium, or large) derived from hypothesis criteria (e.g., null hypothesis or
small/medium-effect test), and the desired level of power using the F statistic. Statistical
packages such as SPSS provide the F statistic for regressions so mathematical
permutations following the work of Murphy and Myors (1998) were conducted to solve
for F in correlational data (e.g., by computing and applying the correlation coefficient
and the degrees of freedom). In order to determine acceptable power, the resulting F
statistic was compared to Murphy and Myors (1998) One Stop F Table describing power
estimates below .50 (low effect), between .50 and .80 (moderate effect), and above .80
(large effect).
RESULTS
The present study results include a description of data regarding [1] study
characteristics such as those of test-takers, research settings, and actual tests, [2] a meta-
analytic summary of reliability estimates according to study variables, and [3] an
examination of trends and reporting practices. In addition, the data were collapsed in
terms of the appropriate level of analysis in order to avoid violation of the independence
23
assumption, namely at the level of the construct group (e.g., behaviors) and at the level of
each individual variable (e.g., turnover intentions). Notably, statistics such as means and
standard deviations described below are unweighted meta-analytic means, SD’s, etc.
According to Fuller and Hester (1999) the unweighted method provides a more
conservative meta-analytic approach when generating observed variance and mean
sample variance, while offering larger confidence intervals, especially when accounting
for large sample outliers (in accordance with Osburn & Callender, 1992). Fuller and
Hester (1999) concluded that the unweighted method had negligible differences over the
weighted-sample method unless moderation-mediation models were utilized.
1. Characteristics of test-takers, research settings, and actual tests
Descriptive statistics regarding test-takers samples are summarized in Table 1.
The most common construct groups measured were attitudes (K = 501) and behaviors
(K= 372). When the data were collapsed at the construct group level, the largest sample
sizes were in abilities (M = 843.7, Median = 220.5) and attitudes (M = 652.8, Median =
256.0); the average age of participants was between 31.7 and 35.4 years, the average
percentage of females ranged from 47.8% to 55.7%, and the average percentage of White
participants ranged from 59.5% to 69.3%.
Notably, when the data were collapsed at the variable level and at least 10
samples were recorded, the youngest participants (27.2 years) were in personality
measures of self-efficacy and the oldest (36.6 years) were in health outcome measures of
role conflict/role ambiguity; the highest proportion of females (90.2%) involved
behavioral harassment measures, and the lowest (38.4%) involved trust ability measures.
In terms of ethnic distribution, the highest proportions of White participants were in

24
measures of harassment and cognitive ability (75.3% and 72.7%, respectively) and the
lowest were in measures of job performance (48.0%).
Descriptive statistics for test characteristics are summarized in Table 2. The
number of items used to measure variables ranged from two to 300 (M = 9.1, SD = 14.1)
and the number of scale anchor points ranged from two to 100 (M = 5.9, SD = 3.3).
Notably, when there were at least 10 samples in the population, the highest number of
items was used to measure cognitive ability (M = 52.5, SD = 65.7) and the lowest number
of items was used to measure distributive justice (M = 3.6, SD = 1.5). Although the range
of anchor points was 98, the most commonly measured variables used five or seven
anchor scale points (N = 256, or 26.23% of all reported anchor points).
To demonstrate the effects of individual and test characteristics on reliability and
average inter-item correlations, the overall means, standard deviations, and inter-
correlations (pairwise) are reported in Table 3, in which the data were collapsed at the
variable level, and Table 4, in which the data was collapsed at the construct group-level.
Notably, the number of items and reliability were significantly correlated both at the
variable-level, r(1235) = .12, p < .01, and at the construct group-level, r(818) = .12, p <
.01. Further, when the data were collapsed at the variable-level, reliability correlated
significantly with gender, r(1132) = .09 p < .01 as well as ethnicity, r(408) = -.10 p < .05;
when the data were collapsed at the construct group-level, reliability correlated
significantly with gender, r(731) = .13 p < .01, but not with ethnicity, r(262) = -.09 p =
ns. However, this change in significance is most likely due to a decrease in sample size
and thus power (e.g., r(408) = -.10 p < .05 vs. r(262) = -.09 p = ns ). Further, in terms of
power, the correlations among ethnicity and reliability and average inter-item correlations
25
were below .50. Using a standard for no effect (e.g., to reject the null hypothesis) and an
alpha of .01, power was above .80 for the correlation between gender and reliability.
In order to determine differences in categorical variables, reliability and average
inter-item correlation estimates distributions were constructed and are summarized in
Table 5. Categorical variables include the construct groups (e.g., behaviors, abilities,
personality traits, attitudes, and health outcomes), author affiliation (e.g., academic,
consultant, and mixed), primary research method (e.g., survey, experimental, interviews,
archival, and simulations), student sample or workers, scale type (e.g., agreement,
frequency, magnitude, and quality), study location (e.g., North America or outside), and
whether coefficients were presented in-text only or also in a chart.
In terms of research properties, the 95% confidence interval overlap suggests no
significant difference between students and workers, whether surveys were used alone or
in combination with other methods, whether coefficients were reported in-text or in a
chart, and whether the study was conducted in North America or elsewhere. In terms of
author affiliation for reliability, there was no overlap between confidence intervals of
academic authors (M = .82, SD = .11) and consultant authors (M = .69, SD = .14). Also,
there was no overlap in confidence intervals for inter-item correlation estimates of the
magnitude-extent type of anchor scale (M = .55, SD = .18) compared to frequency (M =
.46, SD = .16) and agreement (M = .45, SD = .18) types.
In order to determine the predictive strength of the combination of scale variables
on reliability and average inter-item correlations, regression analyses (conducted listwise
in order to allow for more predictive variables) were conducted and summarized in
Tables 6 through 9. Table 6 demonstrates regression results for predictive variables when
26
the data were collapsed at the variable level and Table 7 when the data were collapsed at
the construct group level. Notably, sample size, β = 0.14, t(233) = 2.17, p =.03 predicted
reliability estimates. The model also explained a significant proportion of reliability, R2 =
.06, F(7, 233) = 2.13, p = .04. Sample size β = 0.18, t(236) = 2.81, p <.01 and the number
of scale points β = 0.17, t(236) = 2.67, p <.01 predicted average inter-item correlations.
The model also explained a significant proportion of average inter-item correlations, R2 =
.07, F(6, 236) = 2.81, p = .01. In terms of power, the models for predicting reliability and
average inter-item correlations were only above .50 when the null effect size was
estimated.
Regression analyses using the same predictive variables were conducted for each
construct group and its’ individual variables. Ethnicity and student samples were omitted
in analyses at the variable level because of small samples. Also, number of items was
omitted as a predictor of inter-item correlations because the number of items is directly
related to estimating average inter-item correlations. There were no significant effects for
any construct group and all significant results for individual variables are summarized in
Table 8 for inter-item correlations and Table 9 for reliability estimates. In order to
provide stable measurements, only variables with ten or more estimates were analyzed.
2. Reliability according to measured I/O constructs
Descriptive statistics and distributions of reliability estimates and average inter-
item correlations for I/O variables and construct groups are summarized in Table 10. In
terms of construct groups, the highest reliability estimates (M = .82, SD = .10) and
average inter-item correlations (M = .48, SD = .02) were for attitude measures. The
lowest average inter-item correlations were for personality measures (M = .37, SD = .15).

27
The 95% confidence overlap for reliability estimates suggests no significant differences
among construct groups. There was no confidence interval overlap for average inter-item
correlations between personality (M = .37, SD = .15) and all other construct groups
suggesting that inter-item correlations for personality trait measures were significantly
lower than measures of behaviors, abilities, attitudes, and health outcomes.
At the individual variable level when at least five samples were coded (K >= 5),
the highest reliability (M = .87, SD = .09) and average inter-item correlations (M = .66,
SD = .20) for behaviors involved measures of effort while the lowest reliability involved
withdrawal from work (M = .70, SD = .10) and the lowest average inter-item correlations
involved ingratiation (M= .18, SD = .08). For abilities, the highest reliability estimates
were for measures of empowerment (M = .90, SD = .07), the highest average inter-item
correlations were for trust (M = .55, SD = .12) while the lowest estimates involved
cognitive ability (reliability M = .78, SD = .17; average inter-item correlations M = .17,
SD = .23). For personality traits, the highest reliability estimates were for negative affect
(M = .85, SD = .05) and measures of self-efficacy had the highest average inter-item
correlations (M= .42, SD = .14). Measures of locus of control had the lowest reliability
(M = .69, SD = .12) and measures of openness to experience and agreeableness had the
lowest observed average inter-item correlations at .24 (SD = .11, .15, respectively). For
attitudes, interactional justice had the highest reliability (M = .88, SD = .04) and
measures of distributive justice had the highest average inter-item correlations (M = .67,
SD = .20) while engagement had the lowest estimates (reliability M = .71, SD = .25;
average inter-item correlations M = .36, SD = .19). For health outcomes, measures of
anxiety had the highest reliability (M = .90, SD = .03) and measures of depression had
28
the highest average inter-item correlations (M = .54, SD = .09) whereas measures of work
demands had the lowest estimates (reliability M = .73, SD = .21; average inter-item
correlations M = .41, SD = .12).
Descriptive statistics and distributions displaying the number of items and scale
points as well as means, standard deviations, and 95% confidence intervals for
reliabilities and average inter-item correlations for specific scales are summarized in
Table 11. Authors that used various versions of Costa and McCrae’s (1992) NEO
personality inventory to measure agreeableness had the highest number of items (M =
20.5) and had the second lowest average inter-item correlations (M = .14) behind
Bateman and Crant’s (1993) measure of proactive personality (M = .13). Hom, Griffeth,
and Sellaro’s (1984) measure of turnover used the least number of items (M = 2.3) and
had the highest average inter-item correlations (M = .73). In terms of reliability, Caplan,
Cobb, French, Harrison, and Pinneau’s (1975) measure of job stress had the highest
estimates (M = .95) whereas Bateman and Crant’s (1993) measure of proactive
personality had the lowest estimates (M = .68). An observation of confidence interval
overlap indicated a few significant differences among individual scales but the small
number of samples suggests these differences should be interpreted with caution.
Notably, when there were at least 10 observed samples (K > 10), there was no confidence
interval overlap between average inter-item correlations of Smith, Kendall, and Hulin
(1969) and Hackman and Oldham’s (1975) measures of job satisfaction (M = .32, .51; SD
= .14, .12; K = 12, 12, respectively) suggesting that Hackman and Oldham’s measure had
significantly higher average inter-item correlations.

29
3. Trends in internal consistency precision and reporting practices
Tables 12 and 13 describe means and standard deviations for reliability and
average inter-item correlations, respectively, by year and for each construct group.
Among all construct groups, the lowest means for both reliability and average inter-item
correlations were found in earlier years. For example, in 1975, measures of behaviors (M
= .73, SD = .12), abilities (M = .76, SD = 16), personality (M = .67, SD = .06), attitudes
(M = .79, SD = .10), and health outcomes (M = .73, SD = .17) were all significantly
lower than in 2010 during which means for behaviors (M = .85, SD = .07), abilities (M =
.86, SD = .07), personality (M = .83, SD = .07), attitudes (M = .84, SD = .09), and health
outcomes (M = .82, SD = .06) were all significantly higher. Subsequent trends analyses
using linear regression resulted in a main effect for the passing of time. Each variable
listed received a separate regression over the year of publication. Table 14 summarizes
these regression analyses, indicating that both reliability estimates, β = 0.30, t(932) =
9.52, p <.01, and average inter-item correlations, β = 0.26, t(844) = 7.95, p <.01,
increased as a function of time. Further, using year of publication as the predictor
variable explained a significant proportion of reliability, R2 = .09, F(1, 932) = 90.70, p <
.01, and average inter-item correlations, R2 = .07, F(1, 844) = 63.23, p < .01. Power for
reliability over time was above .80 when estimating for a small to moderate effect size
(five percent of variance) at an alpha level of .05 and power was above .80 for average
inter-item correlations over time when a small effect size (less than one percent variance)
at an alpha level of .01 was estimated.
Next, results concerning authors’ reporting format of reliability coefficients,
missing data, and content analysis are described. In terms of reporting format, most
30
authors explicitly identified the type of coefficient they used. Specifically, the
coefficients identified in for all samples included percentages (N = 2), KR20 (N = 14),
and coefficient alpha (N = 788). Notably, in 17 cases or 2% of the sample, the coefficient
was undeclared and, in 91 cases or 10% of the sample, the authors used terms such as
‘internal consistency’ or ‘reliability’ instead of the actual coefficient type.
In terms of missing data, the data were transformed to binary values (e.g., ‘0’
when a value was absent and ‘1’ when a value was present). Means and standard
deviations for missing data by year are summarized in Table 15. Overall, the sample
distribution in terms of ethnicity (corresponding to 24% of reliability estimates) and the
type of anchor scale used (52%) were the least present. The number of items (84%) to
measure each variable was the most present. Table 16 demonstrates regression analyses
for trends in missing data. Each variable listed for missing data had a separate regression
over the year of publication. For all relevant variables, there was a significant decrease in
missing data over time. For example, the reporting of sample ethnicity distribution
increased over time, β = 0.05, t(931) = 6.38, p <.01 and the passing of time explained a
significant proportion of the data R2 = .04, F(1, 931) = 40.66, p < .01. In other words,
over time, authors have increased the reporting of relevant sample and test characteristics.
Finally, in order to demonstrate trends in the proportion of I/O content measured,
Table 17 describes the number and percentage of content by year for each variable and
construct group in the sample and Table 18 summarizes regression analyses for trends in
the frequency and percentage of overall content that were statistically significant.
Measures of affect (e.g., negative and positive), the Big-Five personality traits, justice
(e.g., procedural, distributive, and interactional), and commitment (e.g., goal, affective,
31
continuance, and organizational) were collapsed (e.g., to have only one reliability
estimate per sample) into their respective global constructs in order to increase the
sample size. Over time, there was a significant increase in the percentage of overall
content for measures of OCB’s (β = 0.81, p <.05), charisma (β = 0.73, p <.05), the Big-
Five personality traits (β = 0.92, p <.01), justice (β = 0.88, p <.01), work-family conflict
(β = 0.78, p <.05), and perceptions of job alternatives (β = 0.05, p <.01), as well as a
decrease in dependability measures (β = -0.78, p <.05) and overall health outcome
measures (β = -0.24, p <.05).
DISCUSSION
The present study demonstrates some interesting aspects of survey reliability
precision for research articles published in the Journal of Applied Psychology. The results
identify various characteristics that have an impact on reliability precision and provide a
depository delineating these characteristics for the most commonly measured variables in
I/O psychology. Importantly, the findings suggest that test characteristics such as the
number of items and the type of anchor scale used have a greater impact on reliability
than sample demographics (e.g., gender, age, ethnicity, and students vs. workers) and
study settings such as using surveys alone or alongside experiments and interviews, and
whether the study was conducted in North America. The following sections review and
discuss findings concerning characteristics that influence reliability, differences among
construct groups and variables, as well as trends and reporting practices. Specifically, it
appears that psychometric surveys in this study show negligible bias towards individuals.
Rather, it is the number of items and the type of anchor scale points that influence
reliability the most. Next, a rationale is provided for findings regarding characteristics of
32
test-takers, testing situations, and actual tests. Then, the depository of reliability precision
is discussed, trends in reliability estimation and reporting practices are interpreted, and
recommendations for data reporting are provided. Finally, limitations of the current study
are provided alongside suggestions for future research.
Characteristics of individual test-takers (sample-level)
Participant age did not have any predictive impact on reliability and although
gender and ethnicity were found to be correlated with reliability, gender did not correlate
significantly with average inter-item correlations and the correlation between ethnicity
and reliability became non-significant when the data were collapsed at the construct
group level. One possible explanation of these inconsistent findings is that analyses of
ethnicity and average inter-item correlations data both suffered from missing data and
hence, smaller samples were analyzed. Another explanation concerns sources of
measurement error relating to individual differences such as cognitive strain and test
anxiety. Because individuals tend to vary in terms of cognitive ability and anxiety,
sample demographics such as gender, age, and ethnicity were expected to contribute to
responding differences (e.g., error) that impact the reliability of test scores.
Guion (1965) argued that respondents with low cognitive ability tend to yield
lower reliability scores due to frustration resulting in random responding. Using a
military sample, Stone, Gueutal, and Stone (1990) assessed differences in reliability
determining cognitive ability (e.g., using the Wonderlic test) on a variety of attitude
variables such as job satisfaction and job commitment. The authors found a significant
effect of cognitive ability on reliability estimates in 14 out of 27 measures, indicating that
cognitive ability can have an effect on reliability measurement precision. In terms of

33
demographics, there is little evidence for gender differences in cognitive ability but in
terms of ethnicity, Whites typically outperform Black and Hispanic test takers on
cognitive ability tests (e.g., Berry, Clark, & McClure, 2011). If these ethnic differences in
cognitive ability truly have an impact on reliability, the current study found evidence of
the opposite. In fact, ethnicity correlated with reliability in an unexpected direction. Non-
Whites yielded slightly higher reliability estimates, but only when their data were
collapsed at the variable level. Given the relatively small effect sizes, these findings
suggest that ethnic differences may not impact reliability a great deal for I/O variables,
putting into question the relationships between cognitive ability and ethnicity in regards
to the reliability of workplace measures.
In terms of anxiety, according to Lazarus (1993), test-anxious individuals tend to
react with negative perceptions, reduced feelings of self-efficacy, and intense emotional
reactions to the potential threat of low performance such as the associated consequences
of failure. Blacks and Hispanics have been found in numerous studies to be more test-
anxious due to various socializing factors contributing to negative test attitudes (e.g.,
Phillips, 1975, Samuda, 1975, Hill & Wigfield, 1984; Zeidner & Safir, 1989). Also,
women are typically said to be more sensitive to evaluation situations than men and as a
consequence show more test anxiety yet previous meta-analytical findings (e.g.,
Hembree, 1988; Benson, et. al., 1992) and the current study results suggest modest
gender group differences. In fact, Women, as with non-Whites, yielded slightly higher
reliability estimates but gender did not have an effect on average inter-item correlations
(e.g., that are a more robust estimate of reliability precision). Elderly subjects have also
been understood to be more anxious than their younger counterparts, especially in
34
cognitive ability tests, due to their perceptions of declining abilities. Yet, previous
experimental findings suggest that test anxiety may not affect the performance of elderly
subjects a great deal more than younger persons (e.g., Mueller, Kausler, Faherty, &
Oliveri, 1980). The current meta-analytic findings did not find a significant effect of age
on overall reliability estimates and average inter-item correlations. As such, these
findings suggest that although there may be individual differences in anxiety, these
differences have modest, if any, impact on reliability estimates and current power
analyses support this notion.
Power analyses provided support for a minimal effect of test-taker characteristics
on reliability and average inter-item correlations. For example, although the correlation
between gender and reliability achieved acceptable power when estimating a null effect,
simply rejecting the null hypothesis has been criticized because of the implausibility that
a treatment has no effect whatsoever (Murphy, 1990). In the current study, the effect of
age, gender, and ethnicity on reliability did not achieve acceptable power when the effect
size was estimated to be less than 1% of variance explained, indicating that sample
characteristics have a negligible effect on the reliability of most I/O survey measures.
Characteristics of testing situations
It was previously mentioned that testing environments that are perceived as
evaluative in nature can have an impact on test performance (Sarason & Pierce, 1995).
Typical lab experiments that use student samples were expected to elicit higher reliability
estimates, yet the results of the current study did not find support for any differences
between student and working samples in terms of reliability precision. Also, there were
no differences in terms of study design. Neither reliability estimates nor average inter-
35
item correlations were significantly different when survey measures were administered
alongside other research methods. Inter-item correlations effectively control for test
length but there were no significant differences in the number of items between surveys
administered alone or alongside experimental procedures or interviews. It has been
previously suggested that surveys make greater cognitive demands on individuals than
other research methods such as interviews (Anastasi, 1976). According to Anastasi, when
research subjects lack the ability to properly understand tests, they lose motivation to
complete the test resulting in unanswered items, higher random error variance, and lower
internal consistency. The current study focused solely on survey measures so it would be
interesting for future studies to examine why and how different combinations of
psychometrics affect reliability. The complexity of test items could offer one explanation
yet the effect of test difficulty on reliability remains to be determined.
Also, it was previously mentioned that the language of test administration in
studies could have an impact on reliability (e.g., Caruso & Edwards, 2001). The findings
in the current study do not support this notion because reliability and average inter-item
correlations were not significantly lower for studies conducted outside of North America.
According to these results, reliability precision was not compromised when variables
were measured in other countries. These results were unexpected because of the
anticipated effect of language understanding differences, translation issues, cultural
inconsistencies in the interpretation of variables, and/or higher test anxiety in foreign
countries. Previous research has found that test anxiety is a relatively heterogeneous
cross-cultural phenomenon (Benson, et. al, 1992). Based on a sample of 14 nations,
Benson et al. reported that the highest test-anxiety values were found in Egypt, Jordan,
36
and Hungary, followed by Puerto Rico, Korea, and Germany. The lowest anxiety levels
were reported for China, Italy, Japan, and the Netherlands. When data were grouped into
geographical regions, the highest mean anxiety was observed in Islamic countries, South
America, and Eastern Europe. Unfortunately, the small sample size for studies conducted
outside of North America did not allow for such a more fine-grained comparison between
nations so such comparisons and the variables that contribute to any cultural reliability
differences remain to be examined in future studies.
Characteristics of the actual tests
Results from the current study supported the notion that test characteristics such
as the number of items and the type of anchor scales used had an impact on reliability
precision. The number of items in a measure correlated significantly with reliability
estimates and average inter-item correlations. Also, the number of items was the strongest
predictor of reliability which was not surprising considering that adding similar items to a
scale will improve reliability (i.e., Spearman-Brown prophecy). Yet, the current study
emphasizes the use of average inter-item correlations because simply adding more items
can distort the overall picture of internal consistency. It is recommended that authors
routinely provide inter-item correlations alongside reliability estimates in order to give
clearer and more robust information for overall scale reliability precision.
The non-significant results concerning the number of scale points were
unexpected. There were very few samples that used two or three anchor points or more
than nine so this study provides little evidence as to whether using too few or too many
anchor points has any detrimental impact on either reliability or inter-item correlations.
Interestingly, the type of scale anchor points used did make a difference for inter-item

37
correlations. Specifically, magnitude-extent types of anchor points (e.g., 1 = to a small
extent, 5 = to a large extent) provided the strongest average inter-item correlations and
hence, scale users and developers should be encouraged to use these types over others
such as agreement (e.g., 1 = strongly disagree, 5 = strongly agree) or quality-accuracy
(e.g., 1 = very inaccurate, 5 = very accurate) types. A possible explanation may be that
magnitude-extent scales are used more often in specific types of construct measurement
or had significantly less or more items than other types. Post hoc examinations revealed
that magnitude-extend scales were used in most construct groups. However, they had
significantly less items (M = 6.79, SD = 6.10) than frequency type anchor scales (M =
10.41, SD = 18.99; and approaching significance for having fewer items than agreement
scales; M = 7.60, SD = 7.17), indicating that scale length contributed to higher average
inter-item correlations in magnitude-extent types of anchor scales.
Reliability and average inter-item correlations also varied based on author
affiliation. Although the number of samples used by consultant-only and mixed authors
was rather small, reliability and inter-item correlations were generally lower when
consultants were involved. This may indicate that academic authors have a higher
standard for reliability estimates and other scale psychometrics than consultants (e.g.,
resulting from basic research objectives), whereas the latter may focus more on general
survey content and sampling procedures (e.g., resulting from applied research objectives).
Nonetheless, due to the small number of samples, it was difficult to determine why these
group differences occurred and power analyses did not achieve acceptable levels beyond
rejecting the null hypothesis (i.e., below .5 when estimating a small to moderate effect
size).
38
The reliability depository
One of the greatest contributions of the current study was to develop a depository
of reliability precision for future scale uses and development. Having the averages,
standard deviations, and confidence intervals for reliability and average inter-item
correlations at the levels of variables, constructs, and actual scales should be a useful
reference tool for academics and practitioners in making important decisions on which
scales to use, for general variable measurement, construct development, and to provide
information for future VG and meta-analytical studies.
Further, results show that measures of personality have important shortcomings in
terms of average inter-item correlations over other types of constructs. Specifically,
measures used to assess variables such as locus of control (LOC), openness to
experience, and agreeableness all had average inter-item correlations below .28. Notably,
measures of the Big-Five personality traits were among constructs that had significant
predictors (e.g., number of scale points and age) for average inter-item correlations, with
43% of variance explained that can account for the low estimates of personality
measures. So, for example, researchers and practitioners using personality measures may
be able to increase the inter-item correlations of these measures by ensuring an adequate
number of anchor points (e.g., seven or nine). Also, the age of participants seemed to
matter for inter-item correlations of personality measures but these results should be
interpreted with caution because significant results occurred only when the standard
deviation for age was entered as a predictor (i.e., age in years did not significantly predict
the reliability of personality measures). Lower standard deviations in age resulted in
higher average inter-item correlations. In other words, smaller distributions of
39
participants’ age predicted higher average inter-item correlations in personality measures,
supporting the notion that homogeneous samples typically yield higher internal
consistency than heterogeneous samples (Traub, 1994).
Overall, the resultant depository offers interesting descriptive information for
researchers and practitioners; however, the predictive models fall short in explaining
meaningful levels of variance in reliability estimates. These results suggest that
psychometric surveys have been developed and improved over time in order to be
relatively unbiased in regards to sample characteristics such as age, gender, and ethnicity.
Missing data, trends, and content analysis
Missing data at the level of any variable is problematic for any study (e.g.,
primary studies such as survey research and secondary data analysis such as meta-
analyses), especially when conducting pairwise and/or listwise analyses with multiple
variables. In the current study, information concerning the ethnic distribution of the
sample was the least reported, followed by the number and type of anchor points.
Whether or not such variables and other test and test-taker characteristics matter or not to
authors, they provide important pieces of information that can be used for the
interpretation of primary data and in subsequent analyses. For example, researchers
desiring to conduct VG studies or similar meta-analyses would be limited in making
inferences about ethnicity effects (.e.g., as a moderator) because more than half the
studies found in this journal did not include usable information. Fortunately, trends
analysis results show a general decrease in missing data for all measured variables in the
current study, indicating that authors are reporting more information and/or that journal
editors have become stricter in regulating missing data. Notably, some authors provided

40
partial information in terms of test-taker characteristics. For example, some authors
would provide the age range rather than the mean. Such partial information, although
informative, does not allow for full interpretation of primary data or for subsequent
analyses without imposing important limitations on the data. As such, authors and journal
editors should abide to higher standards of descriptive data reporting (e.g., means and
standard deviations) and these standards should be included in all publication manuals.
Another important finding of this study is the general increase in reliability and
average inter-item correlations for most groups of constructs over time. Aside for inter-
item correlations for health outcome constructs, all other groups of measures increased as
a function of time, indicating that our standards and practice for measurement precision
and reliability have generally improved. The non-significant results for health outcome
construct inter-item correlations may be due to a relatively small sample (e.g., due to
missing number of items data) that prevented significant trend results.
Finally, the content analysis performed in this study provides interesting
additional descriptive information to readers of the Journal of Applied Psychology and
for the depository of reliability precision included in this manuscript. Content analysis
allows I/O researchers and practitioners to track the frequency of usage of old and new
constructs. For example, results show that over time, there was an increase in the usage of
measures of OCBs, charisma, the Big-Five personality traits, justice, work-family
conflict, and perceptions of job alternatives, whereas measures of dependability have
fallen out of favor. Also, when solely looking at the frequency of measured constructs
(e.g., as opposed to the percentage of content), results show a general increase in content

41
for most I/O measures, meaning that over time, authors are using more combinations of
measures in their research studies1.
Recommendations for reliability precision
To complement the aforementioned implications of this study, the following
recommendations are proposed concerning the reporting of reliability. First, as mentioned
previously, despite the decrease in missing data, journal and publication manual
guidelines do not specifically address issues regarding the reporting of reliability and
especially, inter-item correlations data. All relevant information, including test-taker
demographic information and test characteristics should be made readily available in all
manuscripts that conduct survey assessments. Not only will this practice provide clearer
information concerning reliability precision and interpretation of primary study data, it
will also allow for subsequent meta-analytical efforts to be conducted without the loss of
important data. Second, aside from using adequate sample sizes, authors and reviewers
should be cognizant of the effect of the number of items on reliability and inter-item
correlations. Increasing the number of similar items in a measure will likely increase the
reliability coefficient and this effect highlights the importance of reporting inter-item
correlations to better interpret and understand the level of reliability precision in each
measure. Third, although this study did not find significant results for what the ideal
number of anchor points is, it is recommended that any number between five and nine
would be effective, providing support for earlier work (e.g., Lissitz & Green, 1975;
Oaster, 1989).
1 There was no significant increase in articles published in the Journal of Applied Psychology in the sample.

42
Limitations and future research
In conclusion, a few limitations and recommendations for future research deserve
consideration. First, the exploratory nature of the current study and its mixed results bring
to mind the concepts of statistical inference errors. For example, making statements
regarding significant correlations between reliability and ethnicity could be conceived as
a false positive, or ‘Type I’ error because although the correlations may have been
significant, they were low in magnitude, indicating that ethnicity may only have a
marginal effect on reliability. Conversely, suggesting that surveys are unbiased based on
the mixed results between reliability and average inter-item correlations could be
regarded as a false negative, or ‘Type II’ error when a true null hypothesis was not
rejected (e.g., making inferences based on the non-significant results among variables and
reliability/inter-item correlations). In order to reduce the chance of making such errors,
power analyses were conducted in order to avoid making erroneous conclusions and to
help explain the overall significance of these mixed results. Johns (2006) noted that the
functional relationship between variables is dependent on research context that is likely
responsible for variations in research findings. One possible solution for reducing such
result variations in this particular context would be to increase the sample size of
published studies and develop a more comprehensive analysis of the variables that impact
reliability.
Second, the current study was limited to only one journal and noteworthy, one of
the prominent journals in the field of I/O psychology. As such, besides the
aforementioned problems associated with the small number of samples, especially
regarding comparisons of actual scales, extremely low or high numbers of anchor points,

43
and a lack of consulting and mixed authorship affiliations and authors from foreign
countries, articles within this journal may not accurately represent the state-of-science of
I/O construct reliability. However, analyzing one of the most prominent journals in the
field of I/O psychology provides an important example in hopes to strengthen publication
standards and avoid data communication flaws in other journals. Future research should
consider analyzing samples from more I/O and business journals to improve the
generalizability of results. Adding more journals would allow for meaningful
comparisons between measured variables, construct groups, actual scales used, as well as
between different journal content and publication standards. For example, adding journals
such as the Journal of Occupational Health Psychology would increase the current
study’s low incidence of health outcome constructs and allow for cross-journal
comparisons of standards in internal consistency precision.
Third, coding data every five years may only provide snapshots of the state of
reliability precision over time. As mentioned in the introduction, methodological
decisions inevitably impact study limitations (Stone-Romero, 2002). Using five year
intervals allowed for a longer period of analysis dating back to 1975 in order to capture
long-term changes in reliability and journal content. Future research should consider
coding and analyzing all journal issues by using multiple coders/authors. This more
exhaustive research initiative would allow for a more comprehensive analysis of trends
and avoid circumstances such as the occurrence of special journal issues with restricted
content (e.g., with a limited burden of multiple coder issues because of the straight-
forward nature of the coding task) alongside correcting for range restrictions such as
those presented in the current study.

44
Fourth, the current study only examined one type of reliability: item-level survey
reliability. Future research should consider comparing item-level reliability with other
types, such as inter-rater and test-retest reliability, as well as their relationships with other
types of validity (e.g., internal, statistical conclusion, external). Subsequent studies
examining differences among the types of surveys, item complexity, and the usage of
surveys alongside other research methods such as observations, experiments, and
interviews in the measurement of I/O variables will help researchers and practitioners to
develop reliable and valid psychometric tools that impact important workplace decisions
such as hiring and promotion.
In conclusion, the current study demonstrates an important meta-analytic outlook
on the past and current state of reliability precision. The depository of reliability and
average inter-item correlations should provide researchers and practitioners a valuable
reference tool for future research and applied objectives; and the recommendations for
reliability data reporting should be a beneficial guide for authors and journal editors in
improving the communication and interpretation of reliability statistics.
45
REFERENCES
Anastasi, A. (1976). Psychological testing. New York: Macmillan. Allen, N.J., & Meyer, J.P. (1990). The measurement and antecedents of affective,
continuance and normative commitment to the organization. Journal of Occupational Psychology, 63, 1–18.
Avolio, B.J., Bass, B.M., & Jung, D.I. (1999). Re-examining the components of
transformational leadership and transactional leadership using the Multifactor Leadership Questionnaire. Journal of Occupational and Organizational Psychology, 72, 441–462.
Bass, B.M. (1985). Leadership and performance beyond expectations. New York: Free
Press. Bass, B.M., Cascio, W.F., & O’Connor, E.J. (1974). Magnitude estimations of
expressions of frequency and amount. Journal of Applied Psychology, 59, 313-320.
Bateman, T.S., & Crant, J.M. (1993). The proactive component of organizational
behavior. Journal of Organizational Behavior, 14, 103–118 Baugh, F. (2000). Correcting effect sizes for score reliability: A reminder that
measurement and substantive issues are linked inextricably. Educational and Psychological Measurement, 62, 254-263.
Benson, J., Moulin-Julian, M., Schwarzer, C., Seipp, B., & El-Zahhar, N. (1992). Cross-
validation of a revised test anxiety scale using multi-national samples. In Hagtvet, K.A., Johnsen, A., & Backer, T. (Eds.) Advances in test anxiety research, vol. 7. Lisse, Netherlands: Swets & Zeitlinger Publishers.
Beretvas, N., Suizzo, M.A., Durham, J.A., & Yarnell, L.M. (2008). A reliability
generalization study of scores on Rotter’s and Nowicki-Strickland’s Locus of Control Scales. Educational and Psychological Measurement, 68, 97-119.
Berry, C.M., Clark, M.A., & McClure, T.K. (2011). Racial/ethnic differences in the
criterion-related validity of cognitive ability tests: A qualitative and quantitative review. Journal of Applied Psychology, 96, 881-906.
Brayfield, A.H., & Rothe, H.F. (1951). An index of job satisfaction. Journal of Applied
Psychology, 35, 307–311.
46
Brutus, S., Harjinder, G., & Duniewicz, K. (2010). State of science in industrial and organizational psychology: A review of self-reported limitations. Personnel Psychology, 63, 907-936.
Cambell, J.P., Gasser, M.B., & Oswald, F.L. (1996). The substantive nature of job
performance variability. In Murphy, K. (Ed.), Individual differences and behavior in organizations (pp. 258-299). San Francisco: Jossey-Bass.
Cammann, C., Fichman, M., Jenkins, D., & Klesh, J. (1979). The Michigan
Organizational Assessment Questionnaire. Unpublished manuscript, University of Michigan, Ann Arbor.
Caplan, R.D., Cobb, S., French, J.R.P., Harrison, R., & Pinneau, S.R. (1975). Job
demands and worker health. (NIOSH Publication No. 75–160). Washington, DC: Department of Health, Education, and Welfare.
Caruso, J.C. (2000). Reliability generalization of the Neo Personality Scales. Educational
and Psychological Measurement, 60, 236-254. Caruso, J.C. & Edwards, S. (2001). Reliability generalization of the Junior Eysenck
Personality Questionnaire. Personality and Individual Differences, 31, 173-184. Caruso, J.C., Witkiewitz, K., Belcourt-Dittloff, A. & Gottblieb, J.D. (2001). Reliability of
scores from the Eysenck Personality Questionnaire: A reliability generalization study. Educational and Psychological Measurement, 61, 675-689.
Cicchetti, D.V., Showalter, D., & Tyrer, P.J. (1985). The effect of number of rating scale
categories on levels of inter-rater reliability: a Monte-Carlo investigation. Applied Psychological Measurement, 9, 31-36.
Cohen, J. (1994). The earth is round (p < .05). American Psychologist, 49, 997-1003. Colarelli, S.M. (1984). Methods of communication and mediating processes in realistic
job previews. Journal of Applied Psychology, 69, 633–642. Colquitt, J.A. (2001). On the dimensionality of organizational justice: A construct
validation of a measure. Journal of Applied Psychology, 86, 386–400. Cook T.D. & Campbell D.T. (1976). The design and conduct of quasi-experiments and
true experiments in field settings. In Dunnette, M. (Ed.), Handbook of industrial and organizational psychology (pp. 223–336). Chicago: Rand McNally.
Cortina, J.M. (1993). What is coefficient alpha? An examination of theory and
applications. Journal of Applied Psychology, 78, 98-104.
47
Costa, P.T. & McCrae, R.R. (1989). The NEO PI/FFI manual supplement: Personality Inventory manual. Odessa, FL: Psychological Assessment Resources.
Costa, P.T. & McCrae, R.R. (1991). NEO Five-Factor Inventory (Form S). Odessa, FL:
Psychological Assessment Resources. Costa, P.T. & McCrae, R.R. (1992). NEO PI-R professional manual. Odessa, FL:
Psychological Assessment Resources. Covington, M.V. & Omelich, C.L. (1987). Item difficulty and test performance among
high-anxious and low-anxious students. In Scwarzer, R., Van der Ploeg, H.M., & Spielberger, C.D. (Eds.), Advances in test anxiety research, vol. 5. Berwyn, PA: Swets North America.
Cox, E.P. (1980). The optimal number of response alternatives for a scale: a review.
Journal of Marketing Research, 17, 407-422. Crocker, L. & Algina, J. (1996). Introduction to Classical and Modern Test Theory. New
York: Holt, Rinehart and Winston. Cronbach, L.J. (1951). Coefficient alpha and the internal structure of tests.
Psychometrika, 16, 297-334. Cronbach, L.J. & Shavelson, R.J. (2004). My current thoughts on coefficient alpha and
successor procedures. Educational and Psychological Measurement, 64, 391-418. Deese, J. (1959). Influence of inter-item associative strength upon immediate free recall.
Psychological Reports, 5, 305-312. Eason, S. (1991). Why generalizability theory yields better results than classical test
theory: A primer with concrete examples. In Thomson, B. (Ed.), Advances in educational research: Substantive findings, methodological developments, (Vol. 1, p. 83-98). Greenwich, CT: JAI Press.
Eden, D., & Aviram, A. (1993). Self-efficacy training to speed reemployment: Helping
people to help themselves. Journal of Applied Psychology, 78, 352–360. Eden, D., & Zuk, Y. (1995). Seasickness as a self-fulfilling prophecy: Raising self-
efficacy to boost performance at sea. Journal of Applied Psychology, 80, 628–635 Epstein, S. (1979). The stability of behavior: I. On predicting most of the people much of
the time. Journal of Personality and Social Psychology, 37, 1097-1126. Epstein, S. (1980). The stability of behavior: Implications for psychological research.
American Psychologist, 9, 790-806.
48
Eysenck, M.W. (1982). Attention, and arousal: Cognition and performance. New York, NY: Springer-Verlag.
Eysenck, H.J. & Eysenck, S.B.G. (1968). Manual for the Eysenck Personality Inventory.
San Diego, CA: Educational and Industrial Testing Service. Fisher, R. (1918). Studies in crop variation: An examination of the yield of dressed grain
from Broadbalk. Journal of Agricultural Science, 11, 107-135. Fleiss, J.L. (1971). Measuring nominal scale agreement among many raters.
Psychological Bulletin, 76, 378-382. Fuller, J.B. & Hester, K. (1999). Comparing the sample-weighted and unweighted meta-
analysis: An applied perspective. Journal of Management, 25, 803-828. Garner, W.R. (1960). Rating scales, discriminability, and information transmission.
Psychological Review, 67, 343-352. Goldberg, L.R. (1992). The development of markers for the Big-Five factor structure.
Psychological Assessment, 4, 26–42. Goldberg, L.R. (1999). A broad-bandwidth, public domain, personality inventory
measuring the lower-level facets of several five-factor models. In Merviedle, I., Deary, I.J., Fruyt, F.D., & Osetendorf, F. (Eds.), Personality psychology in Europe (Vol. 7, pp. 7–28). Tilburg, the Netherlands: Tilburg University Press.
Graen, G.B., & Uhl-Bien, M. (1995). Relationship-based approach to leadership:
Development of leader–member exchange (LMX) theory of leadership over 25 years: Applying a multi-level multi-domain perspective. Leadership Quarterly, 6, 219–247.
Graen, G., Liden, R., & Hoel, W. (1982). Role of leadership in the employee withdrawal
process. Journal of Applied Psychology, 67, 868–872. Guilford, J.P. (1954). Psychometric Methods, 2nd Edition. New York, NY: McGraw-Hill. Guion, R.M. (1965). Personnel testing. New York, NY: McGraw-Hill. Hackman, J.R. & Oldham, G.R. (1975). Development of the Job Diagnostic Survey.
Journal of Applied Psychology, 60, 159–170. Hanisch, K.A., & Hulin, C.L. (1990). Job attitudes and organizational withdrawal: An
examination of retirement and other voluntary withdrawal behavior. Journal of Vocational Behavior, 37, 60–78.

49
Hellman, C.M., Fuqua, D.R., & Worley, J. (2006). A reliability generalization study on the Survey of Perceived Organizational Support: The effects of mean age and number f items on score reliability. Educational and Psychological Measurement, 66, 631-642.
Hembree, R. (1988). Corelates, causes, effects, and treatment of test anxiety. Review of
Educational Research, 58, 47-77 Henson, R.K. (2001). Understanding internal consistency reliability estimates: A
conceptual primer on coefficient alpha. Measurement and Evaluation in Counseling and Development, 34, 177-198.
Henson, R.K., Kogan, L.R., & Vacha-Haase, T. (2001). A reliability generalization study
of the teach efficacy scale and related instruments. Educational and Psychological Measurement, 61, 404-420.
Hill, K.T. & Wigfield, A. (1984). Test anxiety: A major educational problem and what
can be done about it. The Elementary School Journal, 85, 105-126. Hogan, T.P., Benjamin, A., & Brezinski, K.L. (2000). Reliability methods: A note on the
frequency of use of various types. Educational and Psychological Measurement, 60, 523-531.
Hom, P.W., Griffeth, R.W., & Sellaro, L. (1984). The validity of Mobley's (1977)
turnover model. Organizational Behavior and Human Performance, 34, 141–174. House, R.J. & Rizzo, J.R. (1972). Role conflict and ambiguity as critical variables in a
model of organizational behavior. Organizational Behavior and Human Performance, 7, 467–505.
Hunter, J.E. & Schmidt, F.L. (2004). Methods of meta-analysis: Correcting for bias in
research findings, 2nd edition. London, UK: Sage Publishing Inc. Iyengar, S. & Greenhouse, J. (1988). Selection models and the file drawer problem.
Statistical Science, 3, 109-135. Johns, G. (2006). The essential impact of context on organizational behavior. Academy of
Management Review, 31, 386–408. Judge, T.A., Locke, E.A., Durham, C.C., & Kluger, A.N. (1998). Dispositional effects on
job and life satisfaction: The role of core evaluations. Journal of Applied Psychology, 83, 17–34.
Komorita, S.S. (1963). Attitude content, intensity, and the neutral point on a Likert scale.
Journal of Social Psychology, 61, 327-334.

50
Kuder, G. F. & Richardson, M.W. (1937). The theory of the estimation of test reliability. Psychometrika, 2, 151-160.
Landis, J.R. & Koch, G.C. (1977). The measurement of observer agreement for
categorical data. Biometrics, 33, 159-174. Lazarus, R.S. (1993). From psychological stress to the emotions: A history of changing
outlooks. Annual Review of Psychology, 44, 1-21. Lee, K. & Allen, N.J. (2002). Organizational citizenship behavior and workplace
deviance: The role of affect and cognitions. Journal of Applied Psychology, 87, 131–142.
Levenson, H. (1981). Differentiating among internality, powerful others, and chance. In
Lefcourt, H.M. (Ed.). Research with the locus of control construct (pp. 15–63). New York: Academic Press.
Liden, R.C. & Maslyn, J.M. (1998). Multidimensionality of leader–member exchange:
An empirical assessment through scale development. Journal of Management, 24, 43–72.
Lissitz, R.W. & Green, S.B. (1975). Effect of the number of scale points on reliability: A
Monte Carlo approach. Journal of Applied Psychology, 60, 10-13. Matell, M.S. & Jacoby, J. (1972). Is there an optimal number of alternatives for Likert-
scale items? Effects of testing time and scale properties. Journal of Applied Psychology, 56, 506-509.
Meier, S.T., & Davis, S.R. (1990). Trends in reporting psychometric properties of scales
used in counseling psychology research. Journal of Counseling Psychology, 37, 113-115.
Meyer, J.P. & Allen, N.J. (1984). Testing the “side-bet theory” of organizational
commitment: Some methodological considerations. Journal of Applied Psychology, 69, 372–378.
Miller, G.A. (1956). The magical number seven, plus or minus two: Some limits on our
capacity for processing information. Psychological Review, 63, 81-97. Miller, B.K., Byrne, Z.S., Rutherford, M.A., & Hansen, A.M. (2009). Perceptions of
organizational politics: A demonstration of the reliability generalization technique. Journal of Managerial Issues, 21, 280-300.
Mischel, W. (1969). Continuity and change in personality. American Psychologist, 24,
1012-1018.

51
Mowday, R.T., Steers, R.M., & Porter, L.W. (1979). The measurement of organizational commitment. Journal of Vocational Behavior, 14, 224–247.
Mowday, R.T, Porter, L.W., & Steers, R.M. (1982). Employee-organization linkages.
New York: Academic Press. Mueller, J.H., Kausler, D.H., Faherty, A., & Oliveri, M. (1980). Reaction time as a
function of age, anxiety, and typicality. Bulletin of the Psychometrics Society, 16, 473-476.
Murphy, K. (1990). If the null hypothesis is impossible, why test it? American
Psychologist, 45, 403-404. Murphy, K. (1997). Editorial. Journal of Applied Psychology, 82, 3-5. Murphy, K. & Myors, B. (1998). Statistical power analysis: A simple and general model
for traditional and modern hypothesis tests. Mahwah, NJ: Lawrence Erlbaum. Niehoff, B.P. & Moorman, R.H. (1993). Justice as a mediator of the relationship between
methods of monitoring and organizational citizenship behavior. Academy of Management Journal, 36, 527–556.
Oaster, T.R. (1989). Number of alternatives per choice point and stability of Likert-type
scales. Perceptual and Motor Skills, 68, 549-550. Osburn, H.G. & Callender, G.W. (1992). A meta-analysis of the relationship between
individual job satisfaction and individual performance. Academy of Management Review, 9, 712-721.
Ostroff, C. & Kozlowski, S.W.J. (1992). Organizational socialization as a learning
process: The role of information acquisition. Personnel Psychology, 45, 849–874 Parker, D.F., & DeCotiis, T.A. (1983). Organizational determinants of job stress.
Organizational Behavior and Human Decision Processes, 32, 160–177. Patton, E. & Johns, G. (2007). Women’s absenteeism in the popular press: Evidence for a
gender-specific absence culture. Human Relations, 60, 1579-1612. Peterson, R.A. (1994). A meta-analysis of Cronbach’s coefficient alpha. Journal of
Consumer Research, 21, 381-391. Phillips, W.M. (1975). Educational policy, community participation, and race. Journal of
Negro Education, 3, 257-267.

52
Porter, L.W. & Smith, F.J. (1970). The etiology of organizational commitment. Unpublished manuscript, University of California at Irvine.
Porter, L.W., Steers, R.M., Mowday, R.T., & Boulian, P V. (1974). Organizational
commitment, job satisfaction, and turnover among psychiatric technicians. Journal of Applied Psychology, 59, 603–609.
Preston, C.C. & Colman, A.M. (2000). Optimal number of response categories in rating
scales: Reliability, validity, discriminating power, and respondent preferences. Acta Psychologica, 104, 1-15.
Rexrode, K.R., Peterson, S., & O’Toole, S. (2008). The Ways of Coping Scale: A
reliability generalization study. Educational and Psychological Measurement, 68, 262-280.
Rhodes, S.R. (1983). Age-related differences in work attitudes and behavior: A review
and conceptual analysis. Psychological Bulleting, 93, 328-367. Riggs, M.L., Warka, J., Babasa, B., Betancourt, R., & Hooker, S. (1994). Development
and validation of self-efficacy and outcome expectancy scales for job-related applications. Educational and Psychological Measurement, 58, 1017–1034.
Rizzo, J.R., House, R.J., & Lirtzman, S.I. (1970). Role conflict and ambiguity in complex
organizations. Administrative Science Quarterly, 15, 150–163. Rodriguez, M.C. & Maeda, Y. (2006). Meta-analysis of coefficient alpha. Psychological
Methods, 11, 306-322. Rosenthal, R. (1979). The file drawer problem and tolerance for null results.
Psychological Bulletin, 86, 638-641. Rotter, J.B. (1966). Generalized expectancies for internal versus external control of
reinforcement. Psychological Monographs, 80, 1–28. Roznowski, M. (1989). An examination of the measurement properties of the Job
Descriptive Index with experimental items. Journal of Applied Psychology, 74, 805–814.
Samuda, R.J. (1975). Psychological testing of American minorities: Issues and
consequences. Oxford, England: Dodd-Mead. Sarason, I.G. & Pierce, G.R. (1995). Social and personal relationships: Current issues,
future directions. Journal of Social and Personal Relationships, 12, 613-619.

53
Scandura, T.A., & Graen, G.B. (1984). Moderating effects of initial leader–member exchange status on the effects of a leadership intervention. Journal of Applied Psychology, 69, 428–436.
Scandura T.A. & Williams E.A. (2000). Research methodology in management: Current
practices, trends, and implications for future research. Academy of Management Journal, 43, 1248–1264.
Scargle, J.D. (2000). Publication bias: The file-drawer problem in scientific inference.
Journal of Scientific Exploration, 14, 94-106. Schutz, H.G. & Rucker, M.H. (1975). A comparison of variable configuration across
scale lengths: An empirical study. Educational and Psychological Measurement, 35, 319-324.
Sedlmeier, P. & Gigerenzer, G. (1989). Do studies of statistical power have an effect on
the power of studies? Psychological Bulletin, 105, 309-316. Silzer, R. & Parson, C. (2012). Industrial-organizational psychology journals and the
science-practitioner gap. The Industrial-Organizational Psychologist, 49, 97-117. Smith, P.C., Kendall, L.M., & Hulin, C.L. (1969). The measurement of satisfaction in
work and retirement: A strategy for the study of attitudes. Skokie, IL: Rand-McNally.
Smith, P.C., Sademan, B., & McCrary, L. (1992). Development and validation of the
Stress in General (SIG) scale. Paper presented at Society for Industrial and Organizational Psychology, Montreal, Quebec, Canada.
Spearman, C.C. (1910). Correlation calculated from faulty data. British Journal of
Psychology, 3, 271-295. Spielberger, C.D. (1979). Preliminary manual for the State–Trait Personality Inventory
(STPI). Unpublished manuscript, University of South Florida, Tampa. Spielberger, C.D., Gorsuch, R.L., & Lushene, R.E. (1970). STAI manual for the State–
Trait Anxiety Inventory. Palo Alto, CA: Consulting Psychologists Press. Stone, E.F., Gueutal, H.G., & Stone, D.L. (1990). Influence of cognitive ability on
responses to questionnaire measures: Measurement precision and missing response problems. Journal of Applied Psychology, 75, 418-427.
Stone-Romero, E.F. (2002). The relative validity and usefulness of various research
designs. In Rogelberg, S.G. (Ed.). Handbook of research methods in industrial and organizational psychology. London: Blackwell.
54
Symonds, P.M. (1924). On the loss of reliability in ratings due to coarseness of the scale.
Journal of Experimental Psychology, 7, 456-461. Thomson, B. (1994). Common methodology mistakes in dissertations, revisited. Paper
presented at the annual meeting of the American Educational Research Association, New Orleans.
Traub, R.E. (1994). Reliability for the Social Sciences: Theory and Applications, Vol. 3.
London: Sage. Thomson, B. & Vacha-Haase., T. (2000). Psychometrics is datametrics: The test is not
reliable. Educational and Psychological Measurement, 60, 174-195. Vacha-Haase, T., Kogan, L.R., Tani, C.R., & Woodall, R.A. (2001). Reliability
generalization: Exploring variation of reliability coefficients of MMPI clinical scales scores. Educational and Psychological Measurement, 61, 45-59.
Vacha-Haase, T., Kogan, L.R., & Thompson, B. (2000). Sample compositions and
variabilities in published studies versus those in test manuals: Validity of score reliability induction. Educational and Psychological Measurement, 60, 509-522.
Vassar, M. & Bradley, G. (2010). A reliability generalization study of coefficient alpha
for the Life Orientation Test. Journal of Personality Assessment, 92, 362-370. Vassar, M. & Crosby, J.W. (2008). A reliability generalization study of coefficient alpha
for the UCLA Loneliness Scale. Journal of Personality Assessment, 90, 601-607. Viswesvaran, C. & Ones, D.S. (2000). Measurement error in “Big Five Factors”
personality assessment: Reliability generalization across studies and measures. Educational and Psychological Measurement, 60, 224-235
Viswesvaran, C., Ones, D.S., & Schmidt, F.L. (1996). Comparative analysis of the
reliability of job performance ratings. Journal of Applied Psychology, 81, 557-574.
Wallace, K.A. & Wheeler, A.J. (2002). Reliability generalization of the Life Satisfaction
Index. Educational and Psychological Measurement, 62, 674-684. Warr, P. & Routledge, T. (1969). An opinion scale for the measurement of managers' job
satisfaction. Occupational Psychology, 43, 95–109. Warr, P., Cook, J.D., & Wall, T.D. (1979). Scales for the measurement of work attitudes
and aspects of psychological well-being. Journal of Occupational Psychology, 52, 129–148.
55
Watson, D. & Clark, L.A. (1984). Negative affectivity: The disposition to experience
aversive emotional states. Psychological Bulletin, 96, 465–490. Watson, D., Clark, L.A., & Tellegen, A. (1988). Development and validation of brief
measures of positive and negative affect: The PANAS scales. Journal of Personality and Social Psychology, 54, 1063–1070.
Weiss, D.J., Dawis, R.V., England, G.W., & Lofquist, L.H. (1967). Manual for the
Minnesota Satisfaction Questionnaire. Minneapolis: University of Minnesota, Industrial Relations Center.
Wheeler, D.L., Vassar, M., Worley, J.A., & Barnes, L.L. (2011). A reliability
generalization meta-analysis of coefficient alpha for the Maslach Burnout Inventory. Educational and Psychological Measurement, 71, 231-244.
Williams, L.J. & Anderson, S.E. (1991). Job satisfaction and organizational commitment
as predictors of organizational citizenship and in-role behaviors. Journal of Management, 17, 601–617.
Wilson, V.L. (1980). Research techniques in AERJ articles: 1969 to 1978. Educational
Researcher, 9, 5-10. Zeidner, M. & Safir, M.P. (1989). Sex, ethnic, and social differences in test anxiety
among Israeli adolescents. Journal of Genetic Psychology: Research and Theory on Human Development, 150, 175-185.
Zickar, M.J. & Highhouse, S. (2001). Measuring prestige of journals in industrial-
organizational psychology. The Industrial-Organizational Psychologist, 38, 29-36.
Zwick, R. & Marascuilo, L. (1984). Selection of pairwise comparison procedures for
parametric and nonparametric analysis of variance models. Psychological Bulletin, 95, 148-155.

56
Table 1 Descriptive Statistics for Test Takers of I/O Constructs and Construct Groups Sample Size Age Gender Ethnicity Variable K M SD K M SD K M SD K M SD Behaviors 372 452.53 1282.781 230 32.531 8.9587 304 55.387 29.3962 131 62.1 38.0job performance 45 608.6 2114.9 28 33.7 9.2 33 51.6 30.0 10 48.0 42.2leader effectiveness 37 284.6 312.7 22 32.3 7.8 29 57.1 30.0 9 49.9 36.5turnover 28 319.0 291.8 21 31.4 6.8 24 53.3 28.0 17 49.1 39.5OCB 18 329.6 274.5 16 33.0 9.0 16 56.3 27.1 5 50.0 46.5harassment 14 1177.6 3000.2 4 38.3 13.5 13 90.2 15.6 12 75.3 31.4withdrawal 10 504.1 416.7 8 31.7 9.9 10 63.2 36.5 9 72.2 41.2goal setting 9 205.4 59.0 4 26.2 9.0 7 53.3 24.2 0 . .CWB 8 384.5 397.6 7 36.3 8.1 7 61.3 9.6 0 . .negotiation 8 129.8 76.4 4 29.9 0.2 8 75.0 26.7 4 75.0 50.0cooperation 7 1530.9 3454.0 2 24.4 3.3 4 39.1 22.2 3 54.7 48.2ingratiation 7 266.1 126.5 5 21.6 3.0 5 39.0 23.5 2 78.5 7.8effort 5 389.2 476.8 2 20.6 0.6 3 56.0 15.6 2 84.5 9.2abusive supervision 4 189.0 140.3 4 37.0 8.1 4 66.9 7.0 0 . .conflict resolution 4 160.8 141.3 1 30.9 . 3 23.6 22.0 0 . .denial 4 140.5 83.6 0 . . 4 100.0 0.0 4 75.0 50.0achievement striving 3 151.0 34.8 3 26.3 11.7 3 40.0 32.7 1 100.0 .agency 3 187.3 118.3 2 23.0 1.4 3 68.0 7.2 1 95.0 .rejecting 3 218.0 68.7 3 30.7 5.7 3 54.0 34.4 2 39.9 11.7unethical pro org beh 3 286.0 67.0 3 35.5 10.7 3 64.2 12.8 1 68.0 aggression 2 98.5 26.2 2 30.2 16.8 2 72.5 38.9 1 70.0 .incivility 2 1129.0 418.6 2 44.7 6.2 2 100.0 0.0 2 90.5 3.5prosocial beh 2 243.5 14.8 0 . . 0 . . 0 . .aap intentions 2 498.0 132.9 0 . . 1 45.0 . 1 66.0 absenteeism 1 194.0 . 0 . . 1 0.0 . 0 . .other behaviors 143 454.0 1158.8 87 33.4 9.3 116 49.7 28.9 45 62.7 38.4Abilities 222 843.7 2120.8 124 31.7 10.0 177 47.8 27.1 73 63.5 34.0G 19 1920.1 3476.6 6 20.1 17.9 14 47.7 16.8 7 72.7 15.9
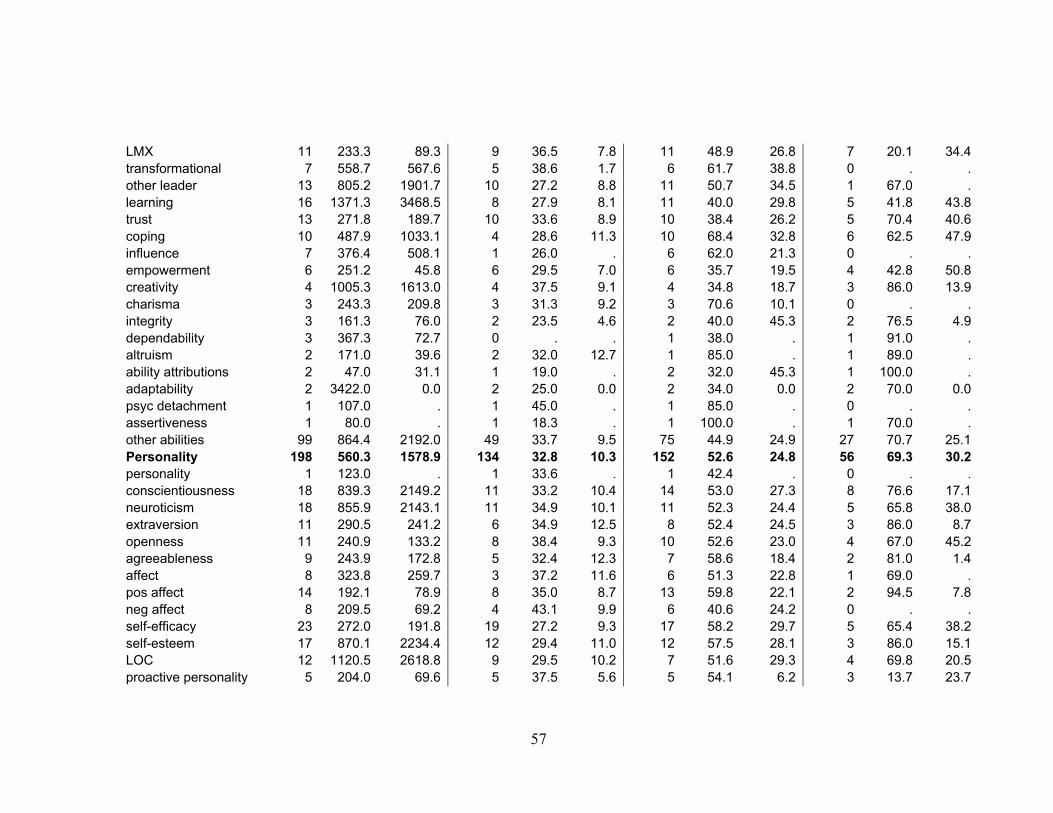
57
LMX 11 233.3 89.3 9 36.5 7.8 11 48.9 26.8 7 20.1 34.4transformational 7 558.7 567.6 5 38.6 1.7 6 61.7 38.8 0 . .other leader 13 805.2 1901.7 10 27.2 8.8 11 50.7 34.5 1 67.0 .learning 16 1371.3 3468.5 8 27.9 8.1 11 40.0 29.8 5 41.8 43.8trust 13 271.8 189.7 10 33.6 8.9 10 38.4 26.2 5 70.4 40.6coping 10 487.9 1033.1 4 28.6 11.3 10 68.4 32.8 6 62.5 47.9influence 7 376.4 508.1 1 26.0 . 6 62.0 21.3 0 . .empowerment 6 251.2 45.8 6 29.5 7.0 6 35.7 19.5 4 42.8 50.8creativity 4 1005.3 1613.0 4 37.5 9.1 4 34.8 18.7 3 86.0 13.9charisma 3 243.3 209.8 3 31.3 9.2 3 70.6 10.1 0 . .integrity 3 161.3 76.0 2 23.5 4.6 2 40.0 45.3 2 76.5 4.9dependability 3 367.3 72.7 0 . . 1 38.0 . 1 91.0 .altruism 2 171.0 39.6 2 32.0 12.7 1 85.0 . 1 89.0 .ability attributions 2 47.0 31.1 1 19.0 . 2 32.0 45.3 1 100.0 .adaptability 2 3422.0 0.0 2 25.0 0.0 2 34.0 0.0 2 70.0 0.0psyc detachment 1 107.0 . 1 45.0 . 1 85.0 . 0 . .assertiveness 1 80.0 . 1 18.3 . 1 100.0 . 1 70.0 .other abilities 99 864.4 2192.0 49 33.7 9.5 75 44.9 24.9 27 70.7 25.1Personality 198 560.3 1578.9 134 32.8 10.3 152 52.6 24.8 56 69.3 30.2personality 1 123.0 . 1 33.6 . 1 42.4 . 0 . .conscientiousness 18 839.3 2149.2 11 33.2 10.4 14 53.0 27.3 8 76.6 17.1neuroticism 18 855.9 2143.1 11 34.9 10.1 11 52.3 24.4 5 65.8 38.0extraversion 11 290.5 241.2 6 34.9 12.5 8 52.4 24.5 3 86.0 8.7openness 11 240.9 133.2 8 38.4 9.3 10 52.6 23.0 4 67.0 45.2agreeableness 9 243.9 172.8 5 32.4 12.3 7 58.6 18.4 2 81.0 1.4affect 8 323.8 259.7 3 37.2 11.6 6 51.3 22.8 1 69.0 .pos affect 14 192.1 78.9 8 35.0 8.7 13 59.8 22.1 2 94.5 7.8neg affect 8 209.5 69.2 4 43.1 9.9 6 40.6 24.2 0 . .self-efficacy 23 272.0 191.8 19 27.2 9.3 17 58.2 29.7 5 65.4 38.2self-esteem 17 870.1 2234.4 12 29.4 11.0 12 57.5 28.1 3 86.0 15.1LOC 12 1120.5 2618.8 9 29.5 10.2 7 51.6 29.3 4 69.8 20.5proactive personality 5 204.0 69.6 5 37.5 5.6 5 54.1 6.2 3 13.7 23.7

58
CSE 4 290.0 408.7 1 42.7 . 3 57.6 8.6 1 84.0 .type A 3 224.7 117.0 3 36.3 11.9 3 2.0 3.5 1 96.0 .machiavellianism 2 437.0 65.1 2 21.0 0.0 2 46.0 0.0 0 . .dominant personality 2 4788.0 6464.4 1 24.0 . 1 77.0 . 1 93.0 .moral identity 1 185.0 . 1 28.5 . 1 31.0 . 0 . .other traits 31 558.7 1639.7 24 33.4 10.5 25 50.7 25.2 13 62.5 31.9Attitudes 501 652.8 3117.9 313 34.0 8.8 394 51.7 27.3 173 61.0 36.8job sat 90 642.9 1766.2 51 34.7 7.3 64 60.7 28.5 37 66.9 38.1life sat 11 353.7 245.3 7 39.7 15.3 10 65.2 33.1 5 73.0 38.5other sats 18 5127.9 14781.9 8 35.0 8.0 14 69.9 30.5 9 77.4 17.6org commit 36 592.1 1879.2 25 32.9 6.4 30 48.6 26.2 14 55.5 39.1affective commit 13 479.3 360.4 11 35.2 8.1 11 51.0 28.9 4 40.5 47.2continuance commit 6 503.7 542.2 3 30.9 6.5 3 87.3 17.6 2 89.5 0.7goal commit 2 253.5 91.2 1 38.0 . 2 66.7 9.4 0 . .justice 4 788.0 1078.1 2 30.6 10.1 4 48.8 17.5 2 66.0 4.2proc justice 27 224.1 155.7 22 33.5 8.4 26 43.3 17.8 9 44.1 42.9distr justice 12 206.8 107.9 10 31.7 10.4 12 43.6 17.0 5 41.9 38.3interac justice 5 188.2 100.5 5 33.0 10.9 5 58.9 16.3 2 43.5 61.5social support 25 302.0 460.6 15 35.7 11.0 16 42.2 34.2 3 21.0 36.4motivation 16 369.2 457.4 9 27.1 8.8 11 49.0 20.2 3 60.3 53.1eval attitudes 11 184.8 82.6 4 41.0 1.4 8 51.8 24.3 5 74.8 9.5engagement 10 243.6 131.5 8 37.8 5.9 8 42.0 34.1 4 66.5 44.8climate 10 718.9 1156.3 6 36.3 4.4 8 53.5 37.2 2 94.5 7.8WFC 10 825.7 1003.5 5 33.7 3.6 8 47.5 25.2 4 35.5 41.5mood 5 251.6 248.2 4 22.7 7.8 5 68.8 24.6 2 84.0 5.7job alternatives 4 1028.5 940.7 1 33.0 . 2 38.2 18.2 3 50.0 44.9aap attitudes 4 320.8 219.5 2 31.6 9.1 3 41.7 10.4 3 76.0 8.7job embedd 3 390.7 76.7 1 42.5 . 1 57.0 . 1 0.0 .other attitudes 179 492.2 1336.4 113 33.9 9.4 143 48.5 26.9 54 61.2 35.8Health outcomes 124 353.1 337.9 77 35.4 10.8 103 55.7 33.5 37 59.5 41.0role conflict 30 302.0 260.7 15 36.6 8.0 19 52.7 35.2 5 52.2 48.4stress 26 407.0 390.2 15 36.3 10.4 21 54.3 36.9 11 66.6 43.2

59
burnout 13 401.2 473.5 9 39.9 9.5 11 70.5 15.3 4 42.3 50.4anxiety 10 401.3 364.3 9 23.6 4.9 9 59.1 37.9 3 38.0 39.6depression 8 429.5 390.2 8 30.4 10.1 8 50.8 37.7 5 60.4 41.7work demands 7 215.4 125.4 5 28.1 8.3 7 50.6 39.0 1 91.0 .psyc complaints 6 485.7 402.8 5 42.4 8.8 6 49.9 35.5 1 35.0 .mental health 4 261.5 100.9 0 . . 4 67.5 47.2 2 94.5 7.8frustration 4 442.3 560.6 4 31.4 11.8 4 61.7 21.2 1 35.0 .job strain 3 160.7 132.7 2 41.4 5.5 3 69.1 10.8 0 . .other outcomes 13 288.8 237.6 5 51.0 9.0 11 45.5 34.1 4 68.0 45.9Other 7 1162.9 2590.9 4 23.0 4.9 4 48.2 20.6 4.0 74.7 7.4Total 1424 593.8 2224.8 882 33.2 9.5 1134 52.6 28.2 474.0 62.6 36.2* Note: Gender and ethnicity are represented by the reported percentage of females and Whites, respectively.

60
Table 2 Descriptive Statistics for Scale Properties of I/O Constructs and Construct Groups Items Scale Points Variable K M SD MIN MAX K M SD MIN MAX Behaviors 326 7.6 17.9 2 300 281 5.8 1.2 2 11 job performance 38 6.8 3.6 2 15 35 5.7 1.1 3 8 leader effectiveness 32 6.8 11.7 2 70 25 6.2 1.2 5 9 turnover 28 4.1 2.4 2 12 15 5.7 1.2 3 7 OCB 17 7.3 4.8 3 21 16 5.3 0.7 5 7 harassment 11 9.8 7.1 2 23 14 5.1 0.5 5 7 goal setting 9 4.7 2.4 2 8 5 5.2 0.4 5 6 CWB 8 8.5 2.3 5 12 8 6.5 0.9 5 7 negotiation 8 2.5 0.5 2 3 8 6.0 1.1 5 7 withdrawal 5 6.0 3.7 3 12 10 5.8 1.0 5 7 cooperation 5 6.0 6.7 2 18 5 5.4 0.9 5 7 effort 5 4.4 1.5 2 6 3 6.3 1.2 5 7 ingratiation 5 20.0 0.0 20 20 5 6.2 1.1 5 7 abusive supervision 4 7.5 5.0 5 15 4 6.5 1.0 5 7 conflict resolution 4 3.3 1.5 2 5 3 7.0 2.0 5 9 denial 4 3.0 1.2 2 4 4 5.0 0.0 5 5 achievement striving 3 6.3 1.2 5 7 3 5.0 0.0 5 5 rejecting 3 4.0 0.0 4 4 3 7.0 0.0 7 7 unethical pro org beh 3 6.0 0.0 6 6 3 7.0 0.0 7 7 agency 2 5.0 0.0 5 5 2 7.0 0.0 7 7 incivility 2 4.5 0.7 4 5 2 5.0 0.0 5 5 prosocial beh 2 7.5 3.5 5 10 2 5.0 0.0 5 5 aap intentions 2 5.0 0.0 5 5 2 7.0 0.0 7 7
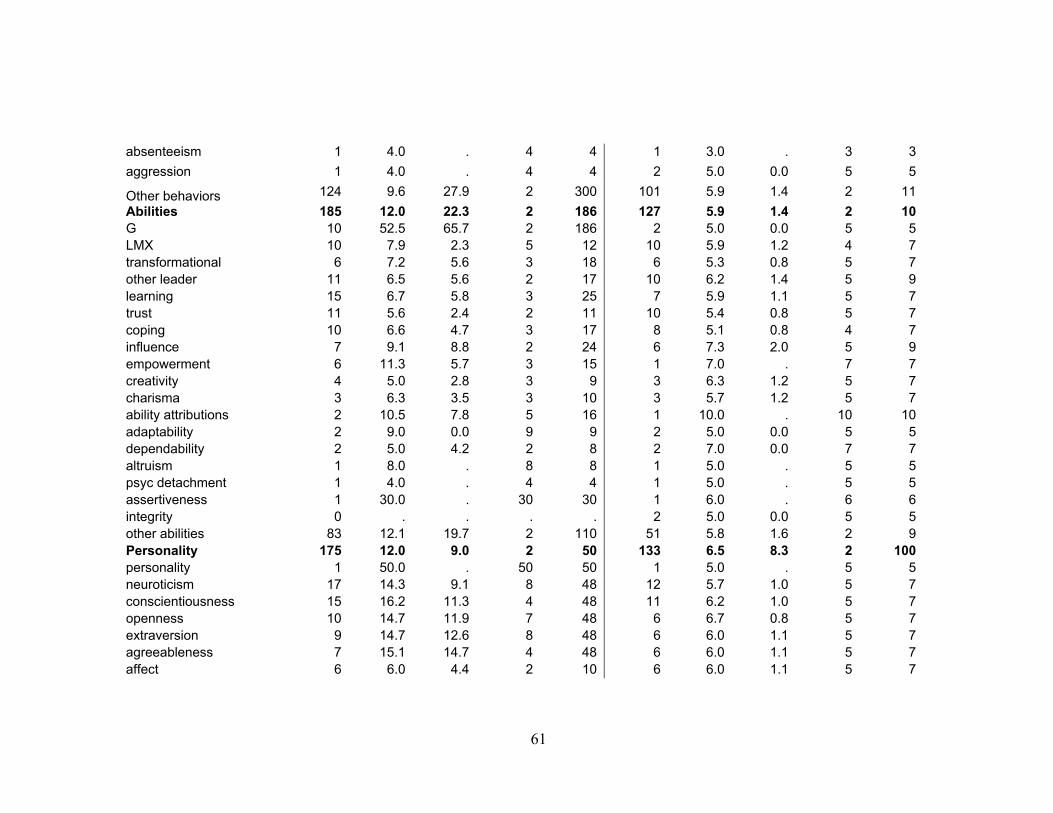
61
absenteeism 1 4.0 . 4 4 1 3.0 . 3 3 aggression 1 4.0 . 4 4 2 5.0 0.0 5 5 Other behaviors 124 9.6 27.9 2 300 101 5.9 1.4 2 11 Abilities 185 12.0 22.3 2 186 127 5.9 1.4 2 10 G 10 52.5 65.7 2 186 2 5.0 0.0 5 5 LMX 10 7.9 2.3 5 12 10 5.9 1.2 4 7 transformational 6 7.2 5.6 3 18 6 5.3 0.8 5 7 other leader 11 6.5 5.6 2 17 10 6.2 1.4 5 9 learning 15 6.7 5.8 3 25 7 5.9 1.1 5 7 trust 11 5.6 2.4 2 11 10 5.4 0.8 5 7 coping 10 6.6 4.7 3 17 8 5.1 0.8 4 7 influence 7 9.1 8.8 2 24 6 7.3 2.0 5 9 empowerment 6 11.3 5.7 3 15 1 7.0 . 7 7 creativity 4 5.0 2.8 3 9 3 6.3 1.2 5 7 charisma 3 6.3 3.5 3 10 3 5.7 1.2 5 7 ability attributions 2 10.5 7.8 5 16 1 10.0 . 10 10 adaptability 2 9.0 0.0 9 9 2 5.0 0.0 5 5 dependability 2 5.0 4.2 2 8 2 7.0 0.0 7 7 altruism 1 8.0 . 8 8 1 5.0 . 5 5 psyc detachment 1 4.0 . 4 4 1 5.0 . 5 5 assertiveness 1 30.0 . 30 30 1 6.0 . 6 6 integrity 0 . . . . 2 5.0 0.0 5 5 other abilities 83 12.1 19.7 2 110 51 5.8 1.6 2 9 Personality 175 12.0 9.0 2 50 133 6.5 8.3 2 100 personality 1 50.0 . 50 50 1 5.0 . 5 5 neuroticism 17 14.3 9.1 8 48 12 5.7 1.0 5 7 conscientiousness 15 16.2 11.3 4 48 11 6.2 1.0 5 7 openness 10 14.7 11.9 7 48 6 6.7 0.8 5 7 extraversion 9 14.7 12.6 8 48 6 6.0 1.1 5 7 agreeableness 7 15.1 14.7 4 48 6 6.0 1.1 5 7 affect 6 6.0 4.4 2 10 6 6.0 1.1 5 7

62
pos affect 14 11.4 5.1 5 23 10 5.1 1.1 4 7 neg affect 8 8.0 2.6 4 10 6 5.2 1.0 4 7 self-efficacy 22 12.4 9.4 3 47 16 5.4 1.5 4 11 self-esteem 15 10.9 5.7 3 25 12 5.0 1.0 4 7 LOC 10 9.9 7.8 4 29 7 5.0 1.5 2 7 proactive personality 5 11.6 5.1 6 17 4 6.5 1.0 5 7 CSE 4 12.0 0.0 12 12 4 6.5 1.0 5 7 type A 2 6.5 3.5 4 9 2 7.0 0.0 7 7 machiavellianism 2 20.0 0.0 20 20 2 7.0 0.0 7 7 dominant personality 1 12.0 . 12 12 0 . . . . moral identity 1 5.0 . 5 5 1 5.0 . 5 5 other traits 26 7.7 5.3 2 20 21 10.5 20.6 5 100 Attitudes 444 8.0 7.8 2 72 346 5.8 1.4 2 12 job sat 75 8.7 10.5 2 72 57 5.3 1.5 3 7 life sat 11 7.4 5.2 3 20 8 5.5 1.4 3 7 other sats 14 6.7 4.5 2 16 12 5.2 1.6 3 7 org commit 30 9.1 3.6 3 15 23 6.1 1.2 3 7 affective commit 10 7.3 1.2 6 9 10 6.2 1.0 5 7 continuance commit 6 7.2 2.6 2 9 6 5.7 1.0 5 7 goal commit 2 6.5 2.1 5 8 2 6.0 1.4 5 7 justice 4 10.5 6.4 7 20 3 5.0 0.0 5 5 proc justice 26 5.9 3.3 2 20 25 6.0 1.3 5 10 distr justice 12 3.6 1.5 2 7 10 6.5 2.1 5 10 interac justice 5 6.0 3.9 4 13 4 6.5 1.0 5 7 social support 22 10.0 6.1 3 21 14 5.9 1.5 2 7 motivation 15 9.4 6.4 3 21 8 6.8 1.3 5 9 WFC 10 7.1 4.9 2 16 9 5.2 1.6 2 7 eval attitudes 10 19.9 25.0 2 58 9 7.1 2.0 4 10 engagement 9 7.1 4.0 2 15 7 5.4 0.8 5 7 climate 8 9.0 5.4 3 16 7 5.6 1.0 5 7 mood 4 9.0 7.5 3 20 3 4.7 0.6 4 5 job alternatives 4 2.3 0.5 2 3 1 5.0 . 5 5

63
aap attitudes 4 5.0 0.0 5 5 4 7.5 0.6 7 8 job embedd 3 23.0 13.9 7 31 1 5.0 . 5 5 Other Attitudes 160 7.3 6.4 2 45 123 5.9 1.4 3 12 Health Outcomes 101 7.6 5.1 2 21 84 5.2 1.4 3 10 role conflict 27 5.6 2.5 2 14 20 5.7 1.2 4 9 stress 16 8.7 5.6 2 18 18 4.6 1.6 3 7 burnout 12 7.0 2.4 4 12 10 6.1 1.1 4 7 anxiety 8 10.6 5.7 4 20 7 4.6 0.5 4 5 depression 6 12.7 8.5 3 21 5 4.6 0.5 4 5 work demands 6 5.0 3.5 2 11 5 5.2 1.1 4 7 psyc complaints 5 8.4 6.5 3 19 1 5.0 . 5 5 mental health 4 16.5 5.2 12 21 4 5.0 1.2 4 6 frustration 4 2.8 0.5 2 3 4 5.3 1.0 4 6 job strain 3 8.0 4.0 4 12 1 7.0 . 7 7 other outcomes 10 6.2 4.5 2 13 9 4.7 2.2 3 10 Other 6 9.3 14.2 2 38 5 5.8 1.1 5 7 Total 1237 9.1 14.1 2 300 976 5.9 3.3 2 100

64
Table 3 Means, standard deviations, and pairwise correlations among variables Variable M SD 1 2 3 4 5 6 7 8 1 Sample size 605.62 1952.61 2 Age 32.63 9.51 .12 3 Age (sd) 6.89 3.53 .06 .79** 4 Gender 50.07 28.63 .02 -.11** -.09* 5 Ethnicity 64.11 34.22 .04 .17** .07 .13** 6 Items 8.42 12.47 .10** -.10** -.07 .01 .06 7 Scale points 5.92 3.58 -.02 -.02 .01 -.07** .05 .01 8 Reliability 0.81 0.11 .05 -.01 .03 .09** -.08 .12** .01 9 Inter-item cor. 0.45 0.18 .02 .02 .07 .02 -.10* -.38** .00 .60** Note: *p< .05 **p< .01: Data collapsed at the variable level. Gender and ethnicity were measured by the reported percentage of females and Whites, respectively. N range = 411 to 1427.
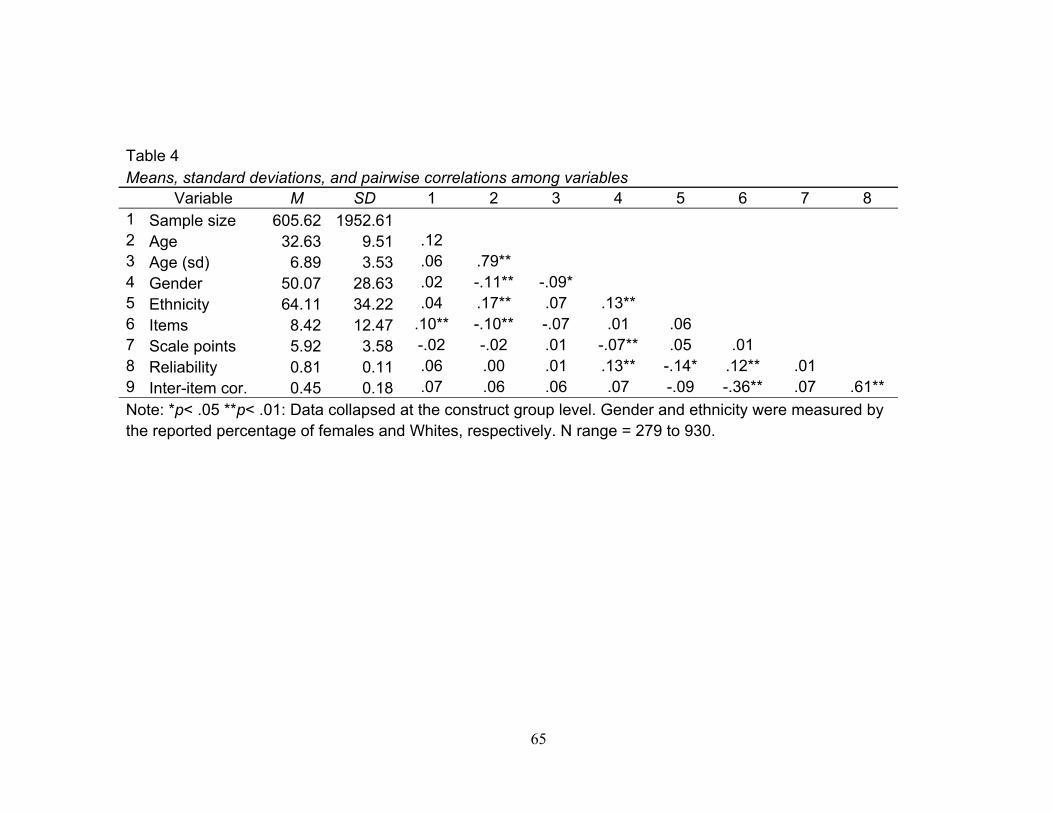
65
Table 4 Means, standard deviations, and pairwise correlations among variables Variable M SD 1 2 3 4 5 6 7 8 1 Sample size 605.62 1952.61 2 Age 32.63 9.51 .12 3 Age (sd) 6.89 3.53 .06 .79** 4 Gender 50.07 28.63 .02 -.11** -.09* 5 Ethnicity 64.11 34.22 .04 .17** .07 .13** 6 Items 8.42 12.47 .10** -.10** -.07 .01 .06 7 Scale points 5.92 3.58 -.02 -.02 .01 -.07** .05 .01 8 Reliability 0.81 0.11 .06 .00 .01 .13** -.14* .12** .01 9 Inter-item cor. 0.45 0.18 .07 .06 .06 .07 -.09 -.36** .07 .61** Note: *p< .05 **p< .01: Data collapsed at the construct group level. Gender and ethnicity were measured by the reported percentage of females and Whites, respectively. N range = 279 to 930.
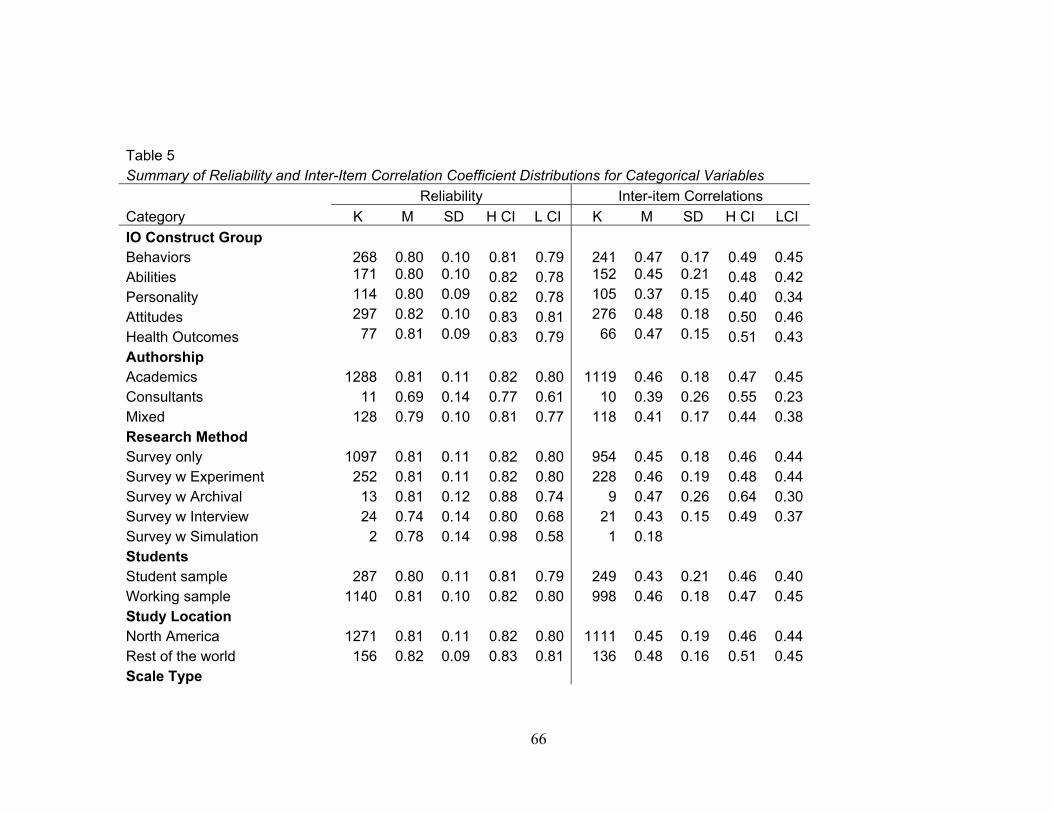
66
Table 5 Summary of Reliability and Inter-Item Correlation Coefficient Distributions for Categorical Variables Reliability Inter-item Correlations Category K M SD H CI L CI K M SD H CI LCI IO Construct Group Behaviors 268 0.80 0.10 0.81 0.79 241 0.47 0.17 0.49 0.45Abilities 171 0.80 0.10 0.82 0.78 152 0.45 0.21 0.48 0.42Personality 114 0.80 0.09 0.82 0.78 105 0.37 0.15 0.40 0.34Attitudes 297 0.82 0.10 0.83 0.81 276 0.48 0.18 0.50 0.46Health Outcomes 77 0.81 0.09 0.83 0.79 66 0.47 0.15 0.51 0.43Authorship Academics 1288 0.81 0.11 0.82 0.80 1119 0.46 0.18 0.47 0.45Consultants 11 0.69 0.14 0.77 0.61 10 0.39 0.26 0.55 0.23Mixed 128 0.79 0.10 0.81 0.77 118 0.41 0.17 0.44 0.38Research Method Survey only 1097 0.81 0.11 0.82 0.80 954 0.45 0.18 0.46 0.44Survey w Experiment 252 0.81 0.11 0.82 0.80 228 0.46 0.19 0.48 0.44Survey w Archival 13 0.81 0.12 0.88 0.74 9 0.47 0.26 0.64 0.30Survey w Interview 24 0.74 0.14 0.80 0.68 21 0.43 0.15 0.49 0.37Survey w Simulation 2 0.78 0.14 0.98 0.58 1 0.18 Students Student sample 287 0.80 0.11 0.81 0.79 249 0.43 0.21 0.46 0.40Working sample 1140 0.81 0.10 0.82 0.80 998 0.46 0.18 0.47 0.45Study Location North America 1271 0.81 0.11 0.82 0.80 1111 0.45 0.19 0.46 0.44Rest of the world 156 0.82 0.09 0.83 0.81 136 0.48 0.16 0.51 0.45Scale Type
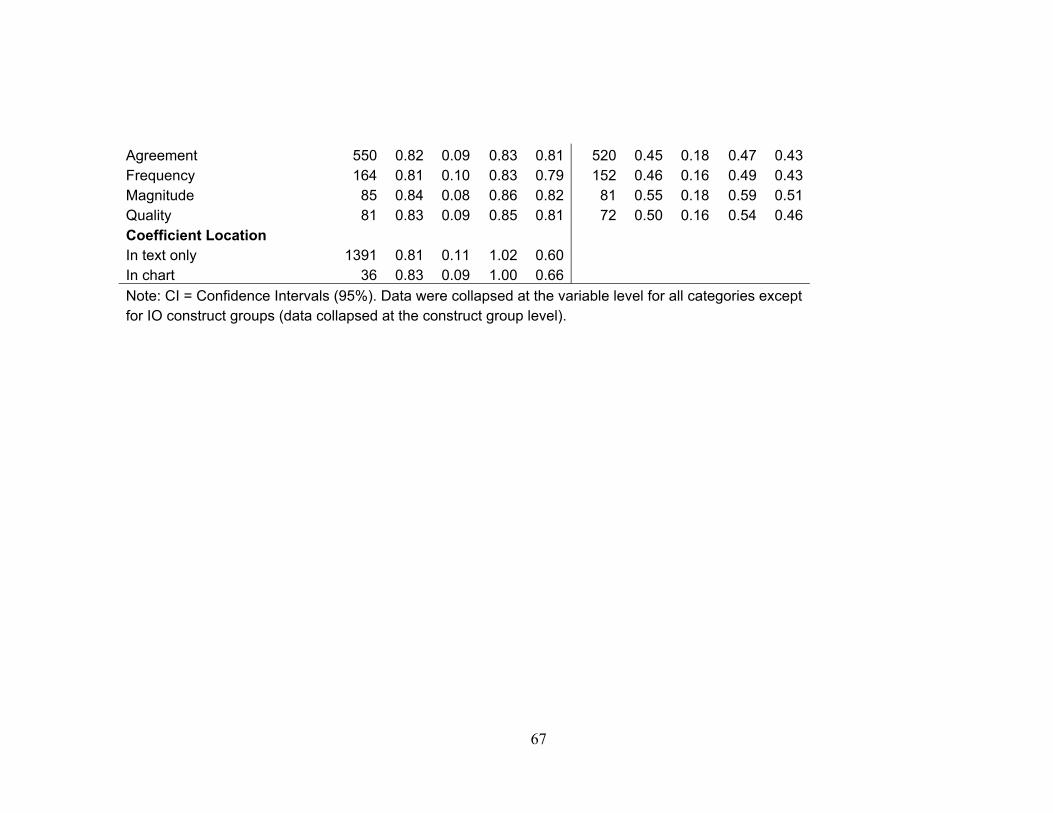
67
Agreement 550 0.82 0.09 0.83 0.81 520 0.45 0.18 0.47 0.43Frequency 164 0.81 0.10 0.83 0.79 152 0.46 0.16 0.49 0.43Magnitude 85 0.84 0.08 0.86 0.82 81 0.55 0.18 0.59 0.51Quality 81 0.83 0.09 0.85 0.81 72 0.50 0.16 0.54 0.46Coefficient Location In text only 1391 0.81 0.11 1.02 0.60 In chart 36 0.83 0.09 1.00 0.66 Note: CI = Confidence Intervals (95%). Data were collapsed at the variable level for all categories except for IO construct groups (data collapsed at the construct group level).

68
Table 6 Summary for Listwise Linear Regression Analysis for Predictive Variables Reliability Inter-Item Correlations Variable B SE B β B SE B β Sample size 2.24 0.00 0.14 * 5.53 0.00 0.18 **Scale points 0.00 0.00 0.02 0.02 0.01 0.17 **Age 0.00 0.00 -0.17 0.00 0.00 0.12 Gender -6.33 0.00 -0.02 -5.06 0.00 -0.01 Ethnicity 0.00 0.00 -0.08 0.00 0.00 -0.07 Students -0.02 0.02 -0.10 0.01 0.04 0.01 Items 0.00 0.00 0.07 N 241 243 R² 0.06 0.07 F for change in R² 2.13 * 2.81 ** Note: *p< .05 **p< .01. Data collapsed at the variable level. Gender and ethnicity were measured by the reported percentage of females and Whites, respectively
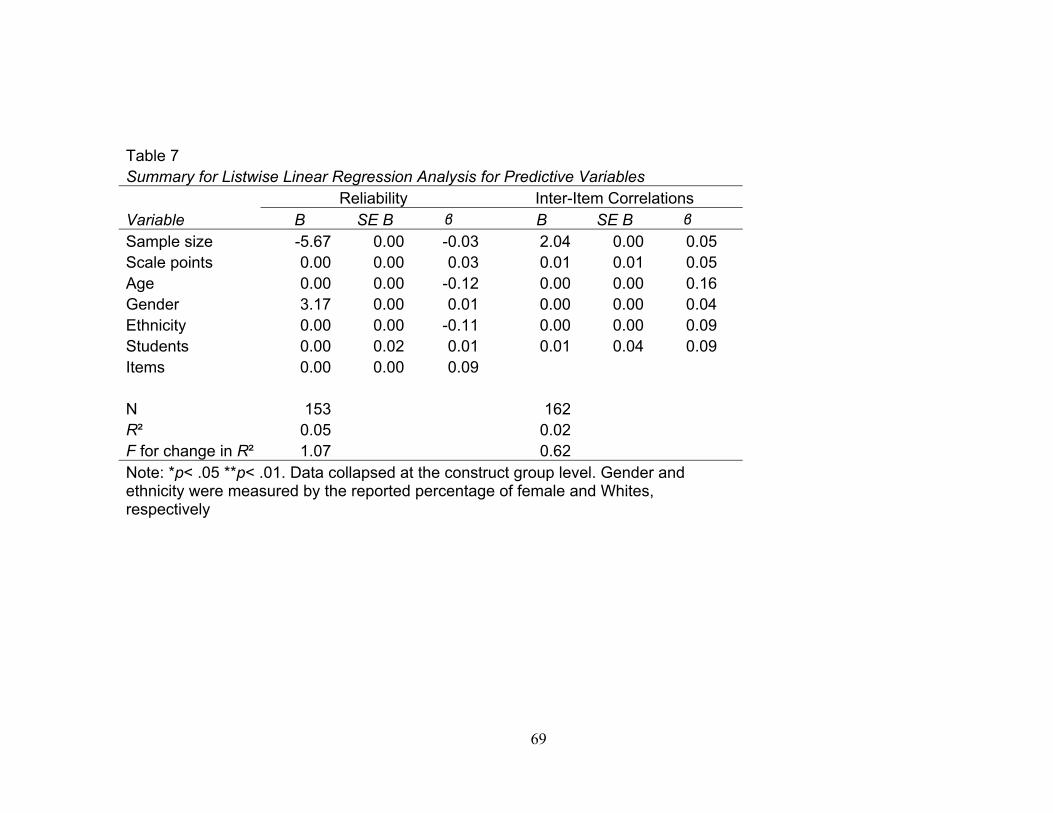
69
Table 7 Summary for Listwise Linear Regression Analysis for Predictive Variables Reliability Inter-Item Correlations Variable B SE B β B SE B β Sample size -5.67 0.00 -0.03 2.04 0.00 0.05 Scale points 0.00 0.00 0.03 0.01 0.01 0.05 Age 0.00 0.00 -0.12 0.00 0.00 0.16 Gender 3.17 0.00 0.01 0.00 0.00 0.04 Ethnicity 0.00 0.00 -0.11 0.00 0.00 0.09 Students 0.00 0.02 0.01 0.01 0.04 0.09 Items 0.00 0.00 0.09 N 153 162 R² 0.05 0.02 F for change in R² 1.07 0.62 Note: *p< .05 **p< .01. Data collapsed at the construct group level. Gender and ethnicity were measured by the reported percentage of female and Whites, respectively

70
Table 8 Summary for Linear Regression Analysis for Variables Predicting Inter-Item Correlations Leader Behaviors Big-Five Job Satisfaction Variable B SE B β B SE B β B SE B Β Sample size 2.22 0.00 0.01 * 0.00 0.00 -0.37 9.09 0.00 0.17 Scale points 0.05 0.03 0.32 0.03 0.03 0.91 ** 0.07 0.02 0.58 **Age 0.00 0.01 0.29 -0.02 0.01 -0.83 * 0.00 0.00 -0.08 Gender 0.00 0.00 0.42 * 0.00 0.00 -0.13 0.00 0.00 0.13 N 14 24 35 R² 0.79 0.43 0.31 F for change in R² 6.01 ** 3.52 * 3.43 * Note: *p < .05 **p <.01 (Standard deviation for Age was used in Big-5 analysis). Gender was measured using the reported percentage of female participants. Only variables with N > 10 were observed.
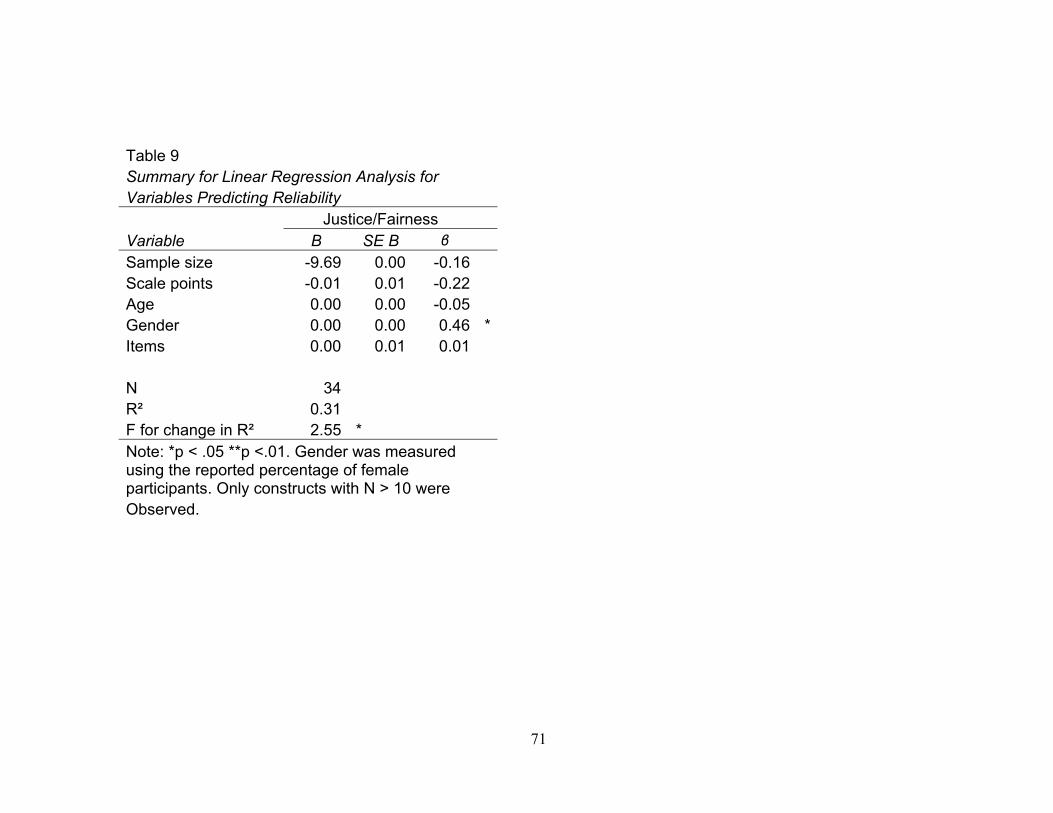
71
Table 9 Summary for Linear Regression Analysis for Variables Predicting Reliability Justice/Fairness Variable B SE B β Sample size -9.69 0.00 -0.16 Scale points -0.01 0.01 -0.22 Age 0.00 0.00 -0.05 Gender 0.00 0.00 0.46 *Items 0.00 0.01 0.01 N 34 R² 0.31 F for change in R² 2.55 * Note: *p < .05 **p <.01. Gender was measured using the reported percentage of female participants. Only constructs with N > 10 were Observed.
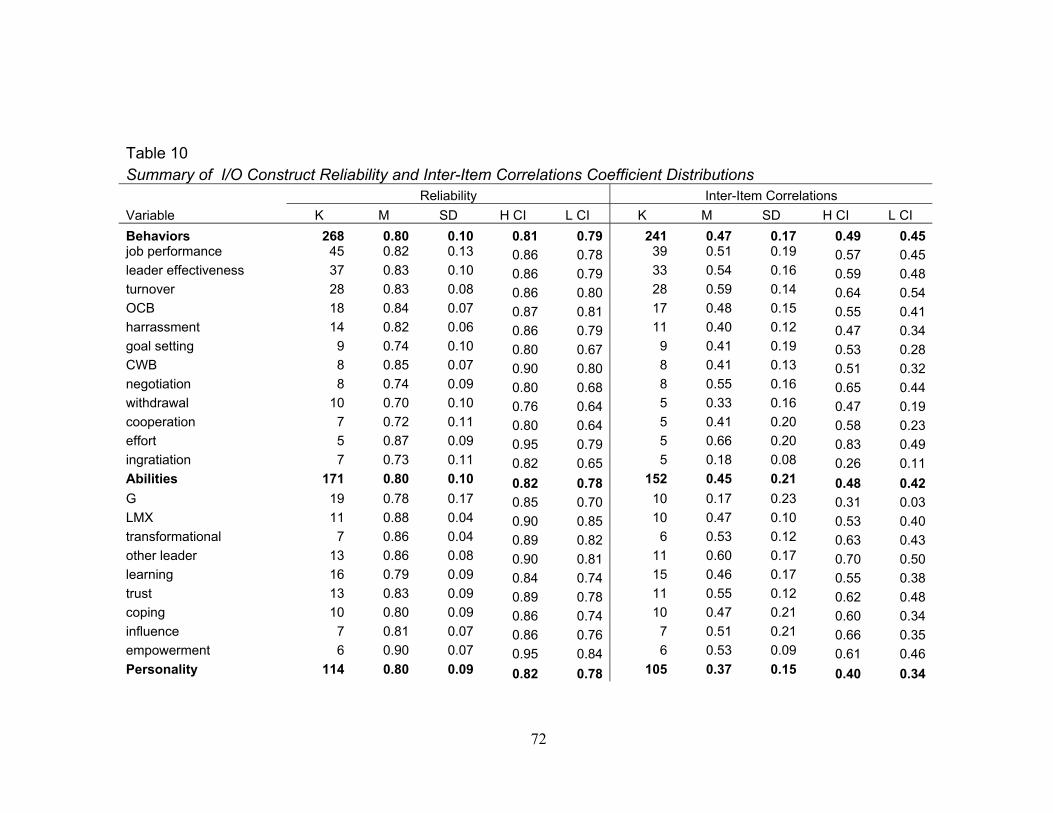
72
Table 10 Summary of I/O Construct Reliability and Inter-Item Correlations Coefficient Distributions Reliability Inter-Item Correlations Variable K M SD H CI L CI K M SD H CI L CI Behaviors 268 0.80 0.10 0.81 0.79 241 0.47 0.17 0.49 0.45job performance 45 0.82 0.13 0.86 0.78 39 0.51 0.19 0.57 0.45leader effectiveness 37 0.83 0.10 0.86 0.79 33 0.54 0.16 0.59 0.48turnover 28 0.83 0.08 0.86 0.80 28 0.59 0.14 0.64 0.54OCB 18 0.84 0.07 0.87 0.81 17 0.48 0.15 0.55 0.41harrassment 14 0.82 0.06 0.86 0.79 11 0.40 0.12 0.47 0.34goal setting 9 0.74 0.10 0.80 0.67 9 0.41 0.19 0.53 0.28CWB 8 0.85 0.07 0.90 0.80 8 0.41 0.13 0.51 0.32negotiation 8 0.74 0.09 0.80 0.68 8 0.55 0.16 0.65 0.44withdrawal 10 0.70 0.10 0.76 0.64 5 0.33 0.16 0.47 0.19cooperation 7 0.72 0.11 0.80 0.64 5 0.41 0.20 0.58 0.23effort 5 0.87 0.09 0.95 0.79 5 0.66 0.20 0.83 0.49ingratiation 7 0.73 0.11 0.82 0.65 5 0.18 0.08 0.26 0.11Abilities 171 0.80 0.10 0.82 0.78 152 0.45 0.21 0.48 0.42G 19 0.78 0.17 0.85 0.70 10 0.17 0.23 0.31 0.03LMX 11 0.88 0.04 0.90 0.85 10 0.47 0.10 0.53 0.40transformational 7 0.86 0.04 0.89 0.82 6 0.53 0.12 0.63 0.43other leader 13 0.86 0.08 0.90 0.81 11 0.60 0.17 0.70 0.50learning 16 0.79 0.09 0.84 0.74 15 0.46 0.17 0.55 0.38trust 13 0.83 0.09 0.89 0.78 11 0.55 0.12 0.62 0.48coping 10 0.80 0.09 0.86 0.74 10 0.47 0.21 0.60 0.34influence 7 0.81 0.07 0.86 0.76 7 0.51 0.21 0.66 0.35empowerment 6 0.90 0.07 0.95 0.84 6 0.53 0.09 0.61 0.46Personality 114 0.80 0.09 0.82 0.78 105 0.37 0.15 0.40 0.34

73
neuroticism 18 0.82 0.08 0.86 0.78 17 0.31 0.11 0.36 0.25conscientiousness 18 0.81 0.07 0.84 0.78 15 0.27 0.19 0.37 0.18openness 11 0.77 0.09 0.82 0.71 10 0.24 0.11 0.30 0.17extraversion 11 0.80 0.07 0.84 0.76 9 0.28 0.14 0.37 0.19agreeableness 9 0.79 0.09 0.84 0.73 7 0.24 0.15 0.35 0.13affect 8 0.84 0.11 0.92 0.77 6 0.55 0.13 0.65 0.44pos affect 8 0.82 0.08 0.88 0.76 8 0.41 0.14 0.51 0.31neg affect 14 0.85 0.05 0.88 0.82 14 0.38 0.13 0.45 0.31self-efficacy 23 0.84 0.09 0.88 0.81 22 0.42 0.14 0.47 0.36self-esteem 17 0.82 0.08 0.86 0.78 15 0.36 0.16 0.44 0.28LOC 12 0.69 0.12 0.76 0.63 10 0.27 0.11 0.33 0.20proactive personality 5 0.84 0.08 0.91 0.77 5 0.34 0.04 0.38 0.31Attitudes 297 0.82 0.10 0.83 0.81 276 0.48 0.18 0.50 0.46job sat 90 0.83 0.09 0.85 0.81 75 0.50 0.18 0.54 0.46life sat 11 0.86 0.03 0.88 0.84 11 0.50 0.11 0.57 0.44other sats 18 0.81 0.10 0.86 0.77 14 0.51 0.22 0.62 0.39org commit 36 0.84 0.08 0.86 0.81 30 0.41 0.12 0.45 0.36affective commit 13 0.83 0.05 0.86 0.81 10 0.45 0.13 0.52 0.37continuance commit 6 0.78 0.06 0.83 0.73 6 0.39 0.21 0.56 0.22proc justice 27 0.84 0.10 0.87 0.80 26 0.52 0.17 0.58 0.45distr justice 12 0.85 0.12 0.91 0.78 12 0.67 0.20 0.78 0.55interac justice 5 0.88 0.04 0.92 0.85 5 0.60 0.13 0.71 0.48social support 25 0.84 0.13 0.89 0.78 22 0.46 0.19 0.54 0.39motivation 16 0.81 0.10 0.86 0.76 15 0.42 0.22 0.53 0.31WFC 10 0.81 0.10 0.87 0.75 10 0.48 0.22 0.61 0.34eval attitudes 11 0.77 0.12 0.84 0.70 10 0.38 0.26 0.54 0.22engagement 10 0.71 0.25 0.86 0.56 10 0.36 0.19 0.48 0.25climate 10 0.87 0.07 0.91 0.83 8 0.55 0.09 0.62 0.49mood 5 0.77 0.08 0.84 0.69 4 0.37 0.17 0.53 0.20

74
Health Outcomes 77 0.81 0.09 0.83 0.79 66 0.47 0.15 0.51 0.43role conflict 30 0.79 0.07 0.81 0.76 26 0.44 0.13 0.49 0.39stress 26 0.80 0.10 0.84 0.76 17 0.46 0.13 0.52 0.40burnout 13 0.84 0.05 0.87 0.81 12 0.45 0.11 0.51 0.39anxiety 10 0.90 0.03 0.92 0.88 8 0.50 0.14 0.59 0.40depression 8 0.84 0.13 0.94 0.75 6 0.54 0.09 0.62 0.47work demands 7 0.73 0.21 0.88 0.57 6 0.41 0.12 0.50 0.32psyc complaints 6 0.86 0.04 0.90 0.82 5 0.47 0.14 0.59 0.35Note: Only constructs with K >= 5 are included in this table. CI = Confidence intervals (95%). Data for construct groups and variables were collapsed at their respective levels.
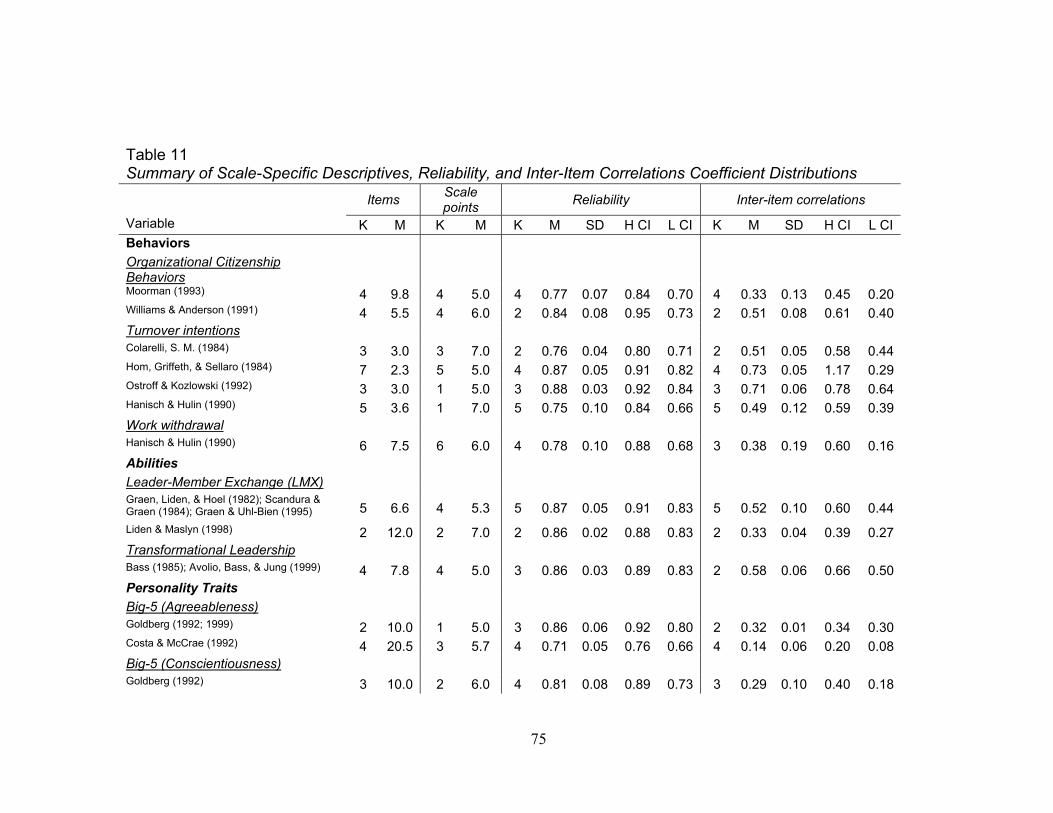
75
Table 11 Summary of Scale-Specific Descriptives, Reliability, and Inter-Item Correlations Coefficient Distributions Items Scale
points Reliability Inter-item correlations
Variable K M K M K M SD H CI L CI K M SD H CI L CI Behaviors Organizational Citizenship Behaviors Moorman (1993) 4 9.8 4 5.0 4 0.77 0.07 0.84 0.70 4 0.33 0.13 0.45 0.20Williams & Anderson (1991) 4 5.5 4 6.0 2 0.84 0.08 0.95 0.73 2 0.51 0.08 0.61 0.40Turnover intentions Colarelli, S. M. (1984) 3 3.0 3 7.0 2 0.76 0.04 0.80 0.71 2 0.51 0.05 0.58 0.44Hom, Griffeth, & Sellaro (1984) 7 2.3 5 5.0 4 0.87 0.05 0.91 0.82 4 0.73 0.05 1.17 0.29Ostroff & Kozlowski (1992) 3 3.0 1 5.0 3 0.88 0.03 0.92 0.84 3 0.71 0.06 0.78 0.64Hanisch & Hulin (1990) 5 3.6 1 7.0 5 0.75 0.10 0.84 0.66 5 0.49 0.12 0.59 0.39Work withdrawal Hanisch & Hulin (1990) 6 7.5 6 6.0 4 0.78 0.10 0.88 0.68 3 0.38 0.19 0.60 0.16Abilities Leader-Member Exchange (LMX) Graen, Liden, & Hoel (1982); Scandura & Graen (1984); Graen & Uhl-Bien (1995) 5 6.6 4 5.3 5 0.87 0.05 0.91 0.83 5 0.52 0.10 0.60 0.44Liden & Maslyn (1998) 2 12.0 2 7.0 2 0.86 0.02 0.88 0.83 2 0.33 0.04 0.39 0.27Transformational Leadership Bass (1985); Avolio, Bass, & Jung (1999) 4 7.8 4 5.0 3 0.86 0.03 0.89 0.83 2 0.58 0.06 0.66 0.50Personality Traits Big-5 (Agreeableness) Goldberg (1992; 1999) 2 10.0 1 5.0 3 0.86 0.06 0.92 0.80 2 0.32 0.01 0.34 0.30Costa & McCrae (1992) 4 20.5 3 5.7 4 0.71 0.05 0.76 0.66 4 0.14 0.06 0.20 0.08Big-5 (Conscientiousness) Goldberg (1992) 3 10.0 2 6.0 4 0.81 0.08 0.89 0.73 3 0.29 0.10 0.40 0.18

76
Costa & McCrae (1989; 1992) 6 17.7 4 6.3 6 0.82 0.08 0.89 0.75 6 0.31 0.25 0.51 0.11Big-5 (Extraversion) Goldberg, L. R. (1992) 3 10.0 1 5.0 4 0.83 0.07 0.90 0.76 3 0.38 0.05 0.43 0.33Costa & McCrae (1992) 5 18.8 3 6.3 5 0.75 0.02 0.77 0.73 5 0.18 0.07 0.24 0.12Big-5 (Neuroticism) Goldberg (1992) 3 10.0 1 7.0 1 0.55 0.55 0.55 0 Costa & McCrae (1991; 1992) 7 16.9 5 5.8 7 0.81 0.04 0.84 0.78 7 0.25 0.10 0.32 0.18Eysenck & Eysenck (1968) 3 12.0 4 5.0 3 0.90 0.01 0.91 0.89 3 0.42 0.02 0.44 0.40Big-5 (Openness to experience) Goldberg (1992; 1999) 5 11.6 2 7.0 3 0.84 0.07 0.97 0.71 3 0.36 0.11 0.57 0.15Costa & McCrae (1992) 6 20.5 6 6.5 6 0.83 0.05 0.87 0.79 5 0.30 0.06 0.35 0.25Proactive personality Bateman & Crant (1993) 5 11.6 4 6.5 4 0.68 0.09 0.77 0.59 4 0.13 0.78 0.21 0.05Self-efficacy Eden & Zuk (1995); Eden & Aviram (1993) 3 17.0 0 3 0.86 0.09 0.96 0.76 3 0.31 0.14 0.47 0.15Judge, Locke, Durham, & Kluger (1998) 4 7.0 4 5.0 4 0.84 0.04 0.88 0.80 4 0.43 0.07 0.50 0.36Riggs, Warka, Babasa, Betancourt, & Hooker (1994) 4 9.3 4 5.5 4 0.91 0.04 0.95 0.87 4 0.53 0.10 0.63 0.43
Positive Affect Watson, Clark, & Tellegen (1988) 3 8.0 2 5.0 3 0.88 0.05 0.93 0.83 3 0.52 0.09 0.62 0.42Negative Affect Watson & Clark (1984) 8 10.0 6 4.7 8 0.85 0.03 0.87 0.83 8 0.37 0.07 0.42 0.33Locus of Control (LOC) Levenson (1981) 5 5.6 5 5.4 5 0.69 0.07 0.75 0.63 5 0.31 0.09 0.39 0.23Rotter (1966) 3 17.0 1 2.0 3 0.77 0.07 0.85 0.69 3 0.20 0.13 0.34 0.06Attitudes Job satisfaction Brayfield & Rothe (1951) 5 5.0 5 5.8 5 0.85 0.03 0.88 0.82 5 0.56 0.07 0.63 0.49Hackman & Oldham (1975) 12 4.1 7 6.3 10 0.80 0.08 0.85 0.75 9 0.51 0.12 0.59 0.43

77
Roznowski (1989) 3 18.7 3 3.7 4 0.83 0.03 0.86 0.80 3 0.32 0.18 0.52 0.12Smith, Kendall, & Hulin (1969) 12 18.6 13 4.1 17 0.84 0.05 0.86 0.82 12 0.32 0.14 0.40 0.24Warr & Routledge (1969); Warr, Cook, & Wall (1979). 2 15.5 2 7.0 3 0.83 0.11 0.95 0.71 2 0.36 0.06 0.45 0.27Cammann, Fichman, Jenkins, & Klesh (1979) 6 3.0 5 6.4 6 0.85 0.06 0.90 0.80 6 0.67 0.11 0.76 0.58Weiss, Dawis, England, & Lofquist (1967) 3 17.0 2 5.0 3 0.84 0.05 0.89 0.79 3 0.27 0.10 0.38 0.16Organizational Commitment Allen & Meyer (affective; 1990) 2 5.5 2 6.0 3 0.76 0.12 0.89 0.63 2 0.36 0.00 0.36 0.36Porter & Smith (1970) Porter, Steers, Mowday, & Boulian (1974); Mowday, Steers, & Porter (1979; 1982)
13 9.7 8 6.4 15 0.83 0.10 0.88 0.78 13 0.38 0.16 0.46 0.30
Meyer & Allen (1984) 3 7.3 2 6.0 2 0.87 0.05 0.94 0.80 2 0.54 0.01 0.56 0.52Justice and Fairness Colquitt (distributive; 2001) 3 3.3 3 5.0 3 0.84 0.12 0.97 0.71 3 0.67 0.24 0.94 0.40Niehoff & Moorman (distributive; 1993) 2 4.5 2 6.0 2 0.89 0.06 0.98 0.80 2 0.72 0.30 1.13 0.31Colquitt (procedural; 2001) 12 7.3 12 5.3 12 0.87 0.07 0.91 0.83 12 0.52 0.18 0.62 0.42Health Outcomes Role ambiguity Rizzo, House, & Lirtzman (1970) 8 6.9 2 5.0 9 0.78 0.05 0.81 0.75 8 0.39 0.06 0.43 0.35Job stress Smith, Sademan, & McCrary (1992) 2 18.0 2 3.0 2 0.89 0.01 0.91 0.87 2 0.31 0.03 0.35 0.27Caplan, Cobb, French, Harrison, & Pinneau (1975) 2 17.0 2 5.0 2 0.95 0.01 0.96 0.94 2 0.51 0.04 0.56 0.46
Anxiety Parker & DeCotiis (1983) 2 15.0 2 5.0 2 0.94 0.00 0.94 0.94 2 0.51 0.00 0.51 0.51Spielberger, Gorsuch, & Lushene (1970); Spielberger (1979) 3 13.3 2 4.0 2 0.90 0.06 1.01 0.79 1 0.23 0.23 0.23
Note: Scales displayed were chosen when N > 2 and/or had at least one other meaningful comparison scale by construct; CI = confidence intervals (95%)

78
Table 12 Summary for Average Reliability for I/O Construct Groups by Year Behaviors Abilities Personality Attitudes Health outcomes Year K M SD K M SD K M SD K M SD K M SD 1975 10 0.73 0.12 5 0.76 0.15 4 0.67 0.06 18 0.79 0.10 9 0.73 0.171980 9 0.72 0.15 7 0.77 0.14 4 0.68 0.08 12 0.77 0.14 4 0.82 0.081985 18 0.71 0.21 15 0.71 0.18 2 0.88 0.01 23 0.79 0.17 4 0.71 0.091990 24 0.78 0.14 19 0.75 0.15 9 0.73 0.08 32 0.79 0.16 8 0.80 0.071995 22 0.77 0.14 19 0.74 0.16 11 0.77 0.12 18 0.78 0.08 10 0.78 0.102000 48 0.79 0.09 36 0.79 0.11 24 0.82 0.09 53 0.83 0.09 18 0.85 0.082005 67 0.82 0.09 35 0.83 0.08 31 0.82 0.06 74 0.83 0.06 11 0.85 0.052010 67 0.85 0.07 42 0.86 0.07 29 0.83 0.07 64 0.84 0.09 13 0.82 0.06
Table 13 Summary for Average Inter-Item Correlations for I/O Construct Groups by Year Behaviors Abilities Personality Attitudes Health outcomes Year K M SD K M SD K M SD K M SD K M SD 1975 6 0.43 0.14 3 0.41 0.17 3 0.37 0.03 12 0.38 0.17 6 0.47 0.171980 7 0.34 0.12 6 0.33 0.20 4 0.21 0.12 11 0.38 0.17 3 0.41 0.081985 14 0.38 0.20 14 0.40 0.22 2 0.52 0.35 20 0.43 0.12 3 0.52 0.201990 19 0.42 0.25 15 0.26 0.20 8 0.27 0.15 31 0.44 0.24 8 0.38 0.071995 20 0.44 0.15 18 0.39 0.21 10 0.30 0.12 17 0.45 0.15 9 0.38 0.172000 44 0.44 0.18 31 0.42 0.18 24 0.37 0.16 50 0.50 0.17 13 0.50 0.142005 65 0.51 0.17 33 0.54 0.19 28 0.40 0.11 72 0.49 0.15 11 0.56 0.152010 61 0.52 0.15 38 0.52 0.17 26 0.38 0.14 62 0.56 0.16 12 0.46 0.14
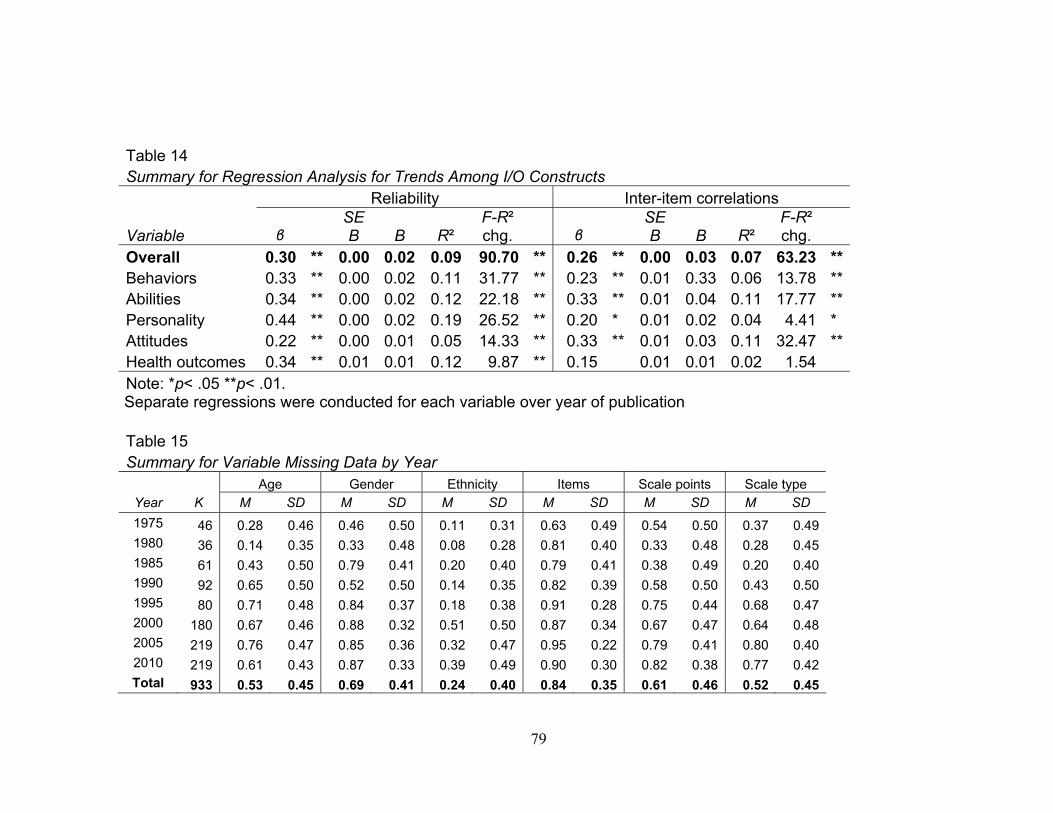
79
Table 14 Summary for Regression Analysis for Trends Among I/O Constructs Reliability Inter-item correlations
Variable β SE B B R²
F-R² chg. β
SE B B R²
F-R² chg.
Overall 0.30 ** 0.00 0.02 0.09 90.70 ** 0.26 ** 0.00 0.03 0.07 63.23 **Behaviors 0.33 ** 0.00 0.02 0.11 31.77 ** 0.23 ** 0.01 0.33 0.06 13.78 **Abilities 0.34 ** 0.00 0.02 0.12 22.18 ** 0.33 ** 0.01 0.04 0.11 17.77 **Personality 0.44 ** 0.00 0.02 0.19 26.52 ** 0.20 * 0.01 0.02 0.04 4.41 * Attitudes 0.22 ** 0.00 0.01 0.05 14.33 ** 0.33 ** 0.01 0.03 0.11 32.47 **Health outcomes 0.34 ** 0.01 0.01 0.12 9.87 ** 0.15 0.01 0.01 0.02 1.54 Note: *p< .05 **p< .01.
Separate regressions were conducted for each variable over year of publication Table 15 Summary for Variable Missing Data by Year Age Gender Ethnicity Items Scale points Scale type
Year K M SD M SD M SD M SD M SD M SD 1975 46 0.28 0.46 0.46 0.50 0.11 0.31 0.63 0.49 0.54 0.50 0.37 0.491980 36 0.14 0.35 0.33 0.48 0.08 0.28 0.81 0.40 0.33 0.48 0.28 0.451985 61 0.43 0.50 0.79 0.41 0.20 0.40 0.79 0.41 0.38 0.49 0.20 0.401990 92 0.65 0.50 0.52 0.50 0.14 0.35 0.82 0.39 0.58 0.50 0.43 0.501995 80 0.71 0.48 0.84 0.37 0.18 0.38 0.91 0.28 0.75 0.44 0.68 0.472000 180 0.67 0.46 0.88 0.32 0.51 0.50 0.87 0.34 0.67 0.47 0.64 0.482005 219 0.76 0.47 0.85 0.36 0.32 0.47 0.95 0.22 0.79 0.41 0.80 0.402010 219 0.61 0.43 0.87 0.33 0.39 0.49 0.90 0.30 0.82 0.38 0.77 0.42Total 933 0.53 0.45 0.69 0.41 0.24 0.40 0.84 0.35 0.61 0.46 0.52 0.45
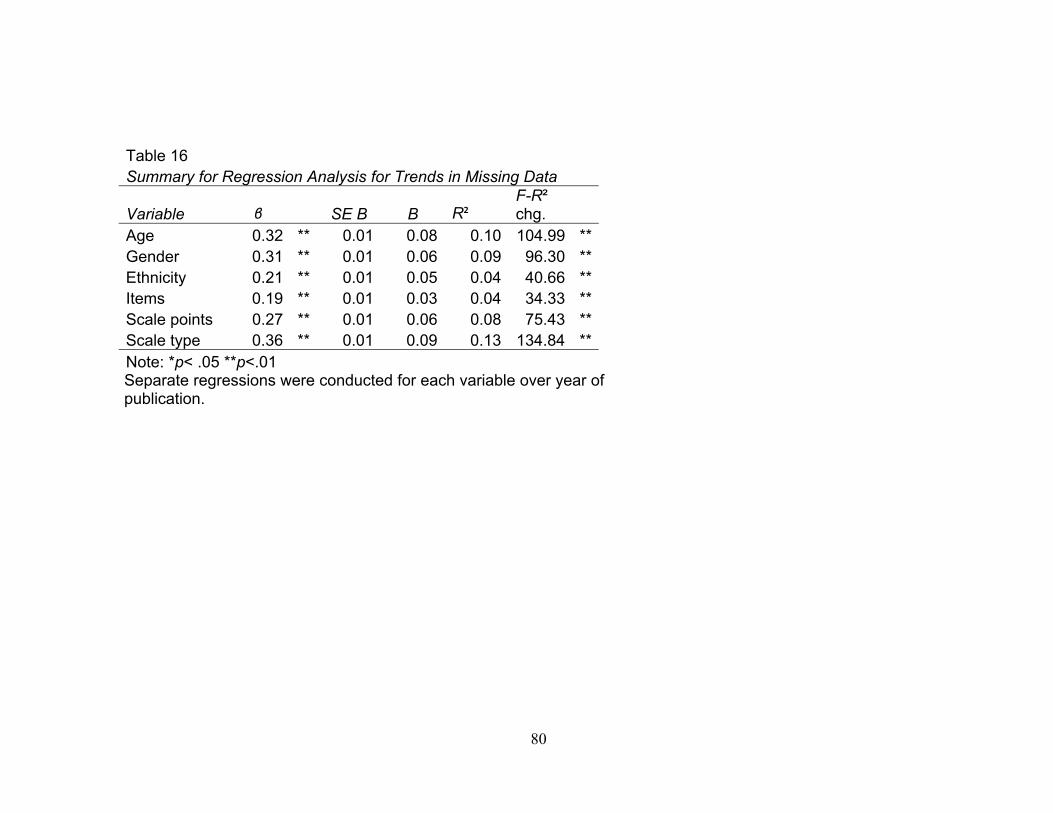
80
Table 16 Summary for Regression Analysis for Trends in Missing Data
Variable β SE B B R² F-R² chg.
Age 0.32 ** 0.01 0.08 0.10 104.99 **Gender 0.31 ** 0.01 0.06 0.09 96.30 **Ethnicity 0.21 ** 0.01 0.05 0.04 40.66 **Items 0.19 ** 0.01 0.03 0.04 34.33 **Scale points 0.27 ** 0.01 0.06 0.08 75.43 **Scale type 0.36 ** 0.01 0.09 0.13 134.84 **Note: *p< .05 **p<.01
Separate regressions were conducted for each variable over year of publication.

81
Table 17 Distribution of Content in The Journal of Applied Psychology by Year 1975 1980 1985 1990 1995 2000 2005 2010 K % K % K % K % K % K % K % K % Behaviors 11 22.4 9 21.4 15 20.5 28 24.3 27 25.5 54 21.1 84 28.7 80 29.1Job performance 2 4.1 3 7.1 1 1.4 8 7.0 5 4.7 3 1.2 14 4.8 9 3.3Leader beh. / effectiveness 4 8.2 1 2.4 4 5.5 2 1.7 2 1.9 5 2.0 9 3.1 9 3.3Turnover intentions / job search 0 0.0 0 0.0 0 0.0
1 0.9 4 3.8
12 4.7
7 2.4 4 1.5
Org. citizenship beh. 0 0.0 0 0.0 0 0.0 0 0.0 0 0.0 2 0.8 5 1.7 10 3.6Harassment 0 0.0 0 0.0 0 0.0 0 0.0 0 0.0 5 2.0 8 2.7 1 0.4Work withdrawal 0 0.0 0 0.0 0 0.0 0 0.0 0 0.0 6 2.3 4 1.4 0 0.0Goal setting 0 0.0 0 0.0 0 0.0 0 0.0 0 0.0 0 0.0 4 1.4 1 0.4Negotiation 0 0.0 0 0.0 0 0.0 0 0.0 0 0.0 0 0.0 4 1.4 4 1.5Org. deviance / CWB 1 2.0 0 0.0 0 0.0 0 0.0 0 0.0 2 0.8 0 0.0 5 1.8Cooperation 1 2.0 1 2.4 0 0.0 1 0.9 0 0.0 2 0.8 2 0.7 0 0.0Effort 1 2.0 0 0.0 0 0.0 1 0.9 1 0.9 1 0.4 0 0.0 0 0.0Impression mana./ingratiation 0 0.0 0 0.0 0 0.0 1 0.9 2 1.9 2 0.8 0 0.0 0 0.0Abusive supervision .0 0.0 .0 0.0 .0 0.0 .0 0.0 .0 0.0 .0 0.0 1 0.3 3 1.1Conflict resolution 0 0.0 1 2.4 0 0.0 0 0.0 1 0.9 0 0.0 0 0.0 2 0.7Denial .0 0.0 .0 0.0 .0 0.0 .0 0.0 .0 0.0 .0 0.0 4 1.4 0 0.0Achievement striving 0 0.0 0 0.0 0 0.0 1 0.9 1 0.9 0 0.0 1 0.3 0 0.0Rejecting/excluding 0 0.0 0 0.0 0 0.0 0 0.0 0 0.0 0 0.0 0 0.0 3 1.1Unethical pro-org beh. 0 0.0 0 0.0 0 0.0 0 0.0 0 0.0 0 0.0 0 0.0 3 1.1Absenteeism 0 0.0 0 0.0 0 0.0 1 0.9 0 0.0 0 0.0 0 0.0 0 0.0Affirmative action prg. intentions 0 0.0 0 0.0 0 0.0 0 0.0 0 0.0
2 0.8
0 0.0 0 0.0
Agency .0 0.0 .0 0.0 .0 0.0 .0 0.0 .0 0.0 .0 0.0 .0 0.0 2 0.7

82
Aggression .0 0.0 .0 0.0 .0 0.0 .0 0.0 0 0.0 1 0.4 0 0.0 1 0.4Incivility 0 0.0 0 0.0 0 0.0 0 0.0 0 0.0 0 0.0 2 0.7 0 0.0Prosocial beh. 0 0.0 0 0.0 0 0.0 2 1.7 0 0.0 0 0.0 0 0.0 0 0.0Other behaviors 2 4.1 3 7.1 10 13.7 10 8.7 11 10.4 11 4.3 19 6.5 23 8.4Abilities 6 12.2 7 16.7 15 20.5 17 14.8 22 20.8 41 16.0 35 11.9 46 16.7 Leadership (LMX) 0 0.0 0 0.0 1 1.4 0 0.0 1 0.9 2 0.8 1 0.3 6 2.2 Leadership (transf./trans.) 0 0.0 0 0.0 0 0.0 0 0.0 2 1.9 1 0.4 4 1.4 0 0.0 Leadership (other types) 0 0.0 2 4.8 0 0.0 2 1.7 3 2.8 0 0.0 4 1.4 2 0.7Cognitive ability 1 2.0 1 2.4 2 2.7 1 0.9 1 0.9 5 2.0 2 0.7 6 2.2Learning ability 1 2.0 1 2.4 0 0.0 1 0.9 0 0.0 9 3.5 3 1.0 1 0.4Trust 1 2.0 0 0.0 1 1.4 0 0.0 1 0.9 2 0.8 1 0.3 7 2.5Coping ability 0 0.0 0 0.0 0 0.0 2 1.7 1 0.9 1 0.4 5 1.7 1 0.4Empowerment 0 0.0 0 0.0 0 0.0 0 0.0 0 0.0 5 2.0 1 0.3 0 0.0Creativity / innovation 0 0.0 0 0.0 0 0.0 0 0.0 0 0.0 1 0.4 0 0.0 3 1.1Adaptability 0 0.0 0 0.0 0 0.0 0 0.0 0 0.0 2 0.8 0 0.0 0 0.0Charisma 0 0.0 0 0.0 0 0.0 0 0.0 0 0.0 0 0.0 1 0.3 2 0.7Dependability 1 2.0 1 2.4 0 0.0 1 0.9 0 0.0 0 0.0 0 0.0 0 0.0Ability attributions 0 0.0 0 0.0 0 0.0 0 0.0 2 1.9 0 0.0 0 0.0 0 0.0Altruism 0 0.0 0 0.0 0 0.0 0 0.0 0 0.0 1 0.4 1 0.3 0 0.0Assertiveness 0 0.0 0 0.0 0 0.0 0 0.0 0 0.0 1 0.4 0 0.0 0 0.0Influence 0 0.0 0 0.0 0 0.0 1 0.9 0 0.0 0 0.0 0 0.0 0 0.0Psychological detachment 0 0.0 0 0.0 0 0.0 0 0.0 0 0.0 0 0.0 0 0.0 1 0.4Other abilities 2 4.1 2 4.8 11 15.1 9 7.8 11 10.4 11 4.3 12 4.1 17 6.2Personality Traits 4 8.2 4 9.5 5 6.8 12 10.4 16 15.1 47 18.4 53 18.1 41 14.9Big Five 0 0.0 0 0.0 0 0.0 2 1.7 5 4.7 21 8.2 18 6.1 21 7.6Affect 0 0.0 0 0.0 2 2.7 4 3.5 0 0.0 7 2.7 10 3.4 7 2.5Self-efficacy 0 0.0 0 0.0 1 1.4 0 0.0 3 2.8 10 3.9 7 2.4 2 0.7

83
Self-esteem 0 0.0 1 2.4 2 2.7 0 0.0 3 2.8 6 2.3 5 1.7 0 0.0Locus of control 0 0.0 1 2.4 0 0.0 3 2.6 0 0.0 3 1.2 4 1.4 1 0.4Proactive personality 0 0.0 0 0.0 0 0.0 0 0.0 0 0.0 0 0.0 3 1.0 1 0.4Core-self evaluations (CSE) .0 0.0 .0 0.0 .0 0.0 .0 0.0 .0 0.0 .0 0.0 1 0.3 3 1.1Dominant personality .0 0.0 .0 0.0 .0 0.0 1 0.9 0 0.0 0 0.0 1 0.3 0 0.0Machiavellianism 0 0.0 0 0.0 0 0.0 0 0.0 2 1.9 0 0.0 0 0.0 0 0.0Type A 2 4.1 0 0.0 0 0.0 0 0.0 0 0.0 0 0.0 0 0.0 0 0.0Moral identity 0 0.0 0 0.0 0 0.0 0 0.0 0 0.0 0 0.0 0 0.0 1 0.4Other personality traits 2 4.1 2 4.8 0 0.0 2 1.7 3 2.8 0 0.0 4 1.4 5 1.8Attitudes 14 28.6 16 38.1 32 43.8 43 37.4 27 25.5 85 33.2 109 37.2 84 30.5 Satisfaction (job) 0 0.0 5 11.9 7 9.6 15 13.0 5 4.7 20 7.8 19 6.5 11 4.0 Satisfaction (life) 0 0.0 1 2.4 1 1.4 1 0.9 0 0.0 2 0.8 3 1.0 3 1.1 Satisfaction (other types) 0 0.0 0 0.0 2 2.7 2 1.7 3 2.8 4 1.6 5 1.7 1 0.4Commitment 2 4.1 2 4.8 3 4.1 4 3.5 3 2.8 10 3.9 19 6.5 10 3.6Justice 0 0.0 0 0.0 0 0.0 0 0.0 1 0.9 12 4.7 12 4.1 21 7.6Perceptions support 1 2.0 0 0.0 1 1.4 7 6.1 1 0.9 5 2.0 7 2.4 3 1.1Motivation 0 0.0 1 2.4 3 4.1 1 0.9 1 0.9 6 2.3 2 0.7 2 0.7Climate / safety 2 4.1 0 0.0 1 1.4 0 0.0 0 0.0 2 0.8 3 1.0 2 0.7Performance evaluation attitudes 1 2.0
1 2.4
2 2.7
0 0.0
0 0.0
4 1.6
0 0.0 2 0.7
Work-family conflict 0 0.0 0 0.0 0 0.0 0 0.0 1 0.9 2 0.8 5 1.7 2 0.7Involvement / engagement 0 0.0 0 0.0 0 0.0 0 0.0 0 0.0 0 0.0 3 1.0 1 0.4Job embeddedness 0 0.0 0 0.0 0 0.0 1 0.9 0 0.0 0 0.0 3 1.0 3 1.1Mood 0 0.0 0 0.0 0 0.0 1 0.9 2 1.9 0 0.0 1 0.3 1 0.4Attitudes twd. affirmative action 0 0.0
0 0.0
0 0.0
0 0.0
0 0.0
4 1.6
0 0.0 0 0.0
Perceptions of job alternatives 0 0.0 0 0.0 0 0.0 0 0.0 0 0.0 1 0.4 1 0.3 2 0.7Other attitudes 8 16.3 6 14.3 12 16.4 11 9.6 10 9.4 13 5.1 26 8.9 20 7.3
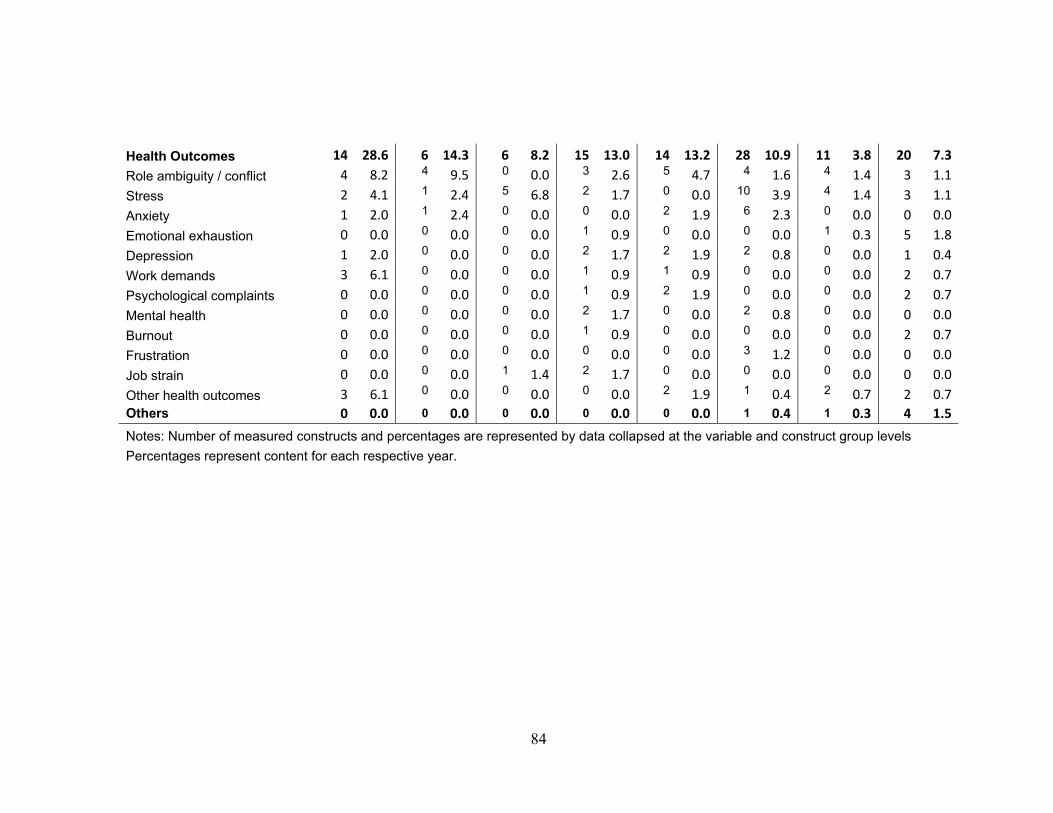
84
Health Outcomes 14 28.6 6 14.3 6 8.2 15 13.0 14 13.2 28 10.9 11 3.8 20 7.3Role ambiguity / conflict 4 8.2 4 9.5 0 0.0 3 2.6 5 4.7 4 1.6 4 1.4 3 1.1Stress 2 4.1 1 2.4 5 6.8 2 1.7 0 0.0 10 3.9 4 1.4 3 1.1Anxiety 1 2.0 1 2.4 0 0.0 0 0.0 2 1.9 6 2.3 0 0.0 0 0.0Emotional exhaustion 0 0.0 0 0.0 0 0.0 1 0.9 0 0.0 0 0.0 1 0.3 5 1.8Depression 1 2.0 0 0.0 0 0.0 2 1.7 2 1.9 2 0.8 0 0.0 1 0.4Work demands 3 6.1 0 0.0 0 0.0 1 0.9 1 0.9 0 0.0 0 0.0 2 0.7Psychological complaints 0 0.0 0 0.0 0 0.0 1 0.9 2 1.9 0 0.0 0 0.0 2 0.7Mental health 0 0.0 0 0.0 0 0.0 2 1.7 0 0.0 2 0.8 0 0.0 0 0.0Burnout 0 0.0 0 0.0 0 0.0 1 0.9 0 0.0 0 0.0 0 0.0 2 0.7Frustration 0 0.0 0 0.0 0 0.0 0 0.0 0 0.0 3 1.2 0 0.0 0 0.0Job strain 0 0.0 0 0.0 1 1.4 2 1.7 0 0.0 0 0.0 0 0.0 0 0.0Other health outcomes 3 6.1 0 0.0 0 0.0 0 0.0 2 1.9 1 0.4 2 0.7 2 0.7Others 0 0.0 0 0.0 0 0.0 0 0.0 0 0.0 1 0.4 1 0.3 4 1.5Notes: Number of measured constructs and percentages are represented by data collapsed at the variable and construct group levels Percentages represent content for each respective year.
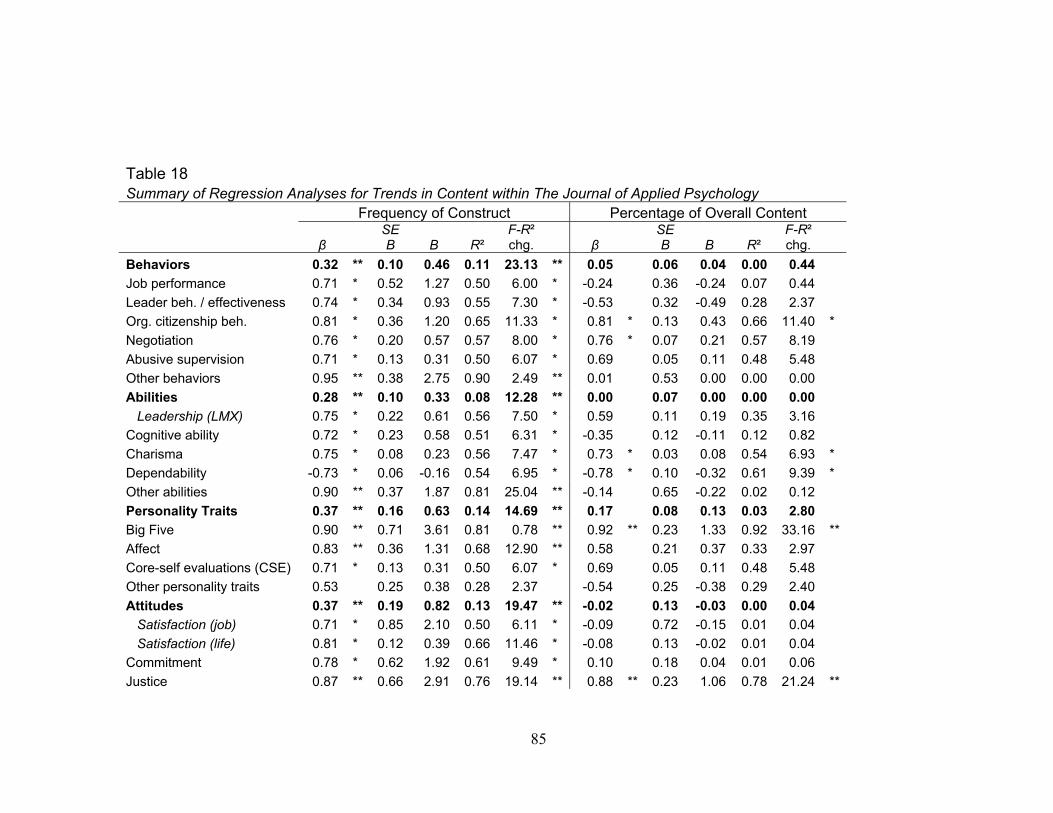
85
Table 18 Summary of Regression Analyses for Trends in Content within The Journal of Applied Psychology Frequency of Construct Percentage of Overall Content
β SE B B R²
F-R² chg. β
SE B B R²
F-R² chg.
Behaviors 0.32 ** 0.10 0.46 0.11 23.13 ** 0.05 0.06 0.04 0.00 0.44 Job performance 0.71 * 0.52 1.27 0.50 6.00 * -0.24 0.36 -0.24 0.07 0.44 Leader beh. / effectiveness 0.74 * 0.34 0.93 0.55 7.30 * -0.53 0.32 -0.49 0.28 2.37 Org. citizenship beh. 0.81 * 0.36 1.20 0.65 11.33 * 0.81 * 0.13 0.43 0.66 11.40 * Negotiation 0.76 * 0.20 0.57 0.57 8.00 * 0.76 * 0.07 0.21 0.57 8.19 Abusive supervision 0.71 * 0.13 0.31 0.50 6.07 * 0.69 0.05 0.11 0.48 5.48 Other behaviors 0.95 ** 0.38 2.75 0.90 2.49 ** 0.01 0.53 0.00 0.00 0.00 Abilities 0.28 ** 0.10 0.33 0.08 12.28 ** 0.00 0.07 0.00 0.00 0.00 Leadership (LMX) 0.75 * 0.22 0.61 0.56 7.50 * 0.59 0.11 0.19 0.35 3.16 Cognitive ability 0.72 * 0.23 0.58 0.51 6.31 * -0.35 0.12 -0.11 0.12 0.82 Charisma 0.75 * 0.08 0.23 0.56 7.47 * 0.73 * 0.03 0.08 0.54 6.93 * Dependability -0.73 * 0.06 -0.16 0.54 6.95 * -0.78 * 0.10 -0.32 0.61 9.39 * Other abilities 0.90 ** 0.37 1.87 0.81 25.04 ** -0.14 0.65 -0.22 0.02 0.12 Personality Traits 0.37 ** 0.16 0.63 0.14 14.69 ** 0.17 0.08 0.13 0.03 2.80 Big Five 0.90 ** 0.71 3.61 0.81 0.78 ** 0.92 ** 0.23 1.33 0.92 33.16 **Affect 0.83 ** 0.36 1.31 0.68 12.90 ** 0.58 0.21 0.37 0.33 2.97 Core-self evaluations (CSE) 0.71 * 0.13 0.31 0.50 6.07 * 0.69 0.05 0.11 0.48 5.48 Other personality traits 0.53 0.25 0.38 0.28 2.37 -0.54 0.25 -0.38 0.29 2.40 Attitudes 0.37 ** 0.19 0.82 0.13 19.47 ** -0.02 0.13 -0.03 0.00 0.04 Satisfaction (job) 0.71 * 0.85 2.10 0.50 6.11 * -0.09 0.72 -0.15 0.01 0.04 Satisfaction (life) 0.81 * 0.12 0.39 0.66 11.46 * -0.08 0.13 -0.02 0.01 0.04 Commitment 0.78 * 0.62 1.92 0.61 9.49 * 0.10 0.18 0.04 0.01 0.06 Justice 0.87 ** 0.66 2.91 0.76 19.14 ** 0.88 ** 0.23 1.06 0.78 21.24 **
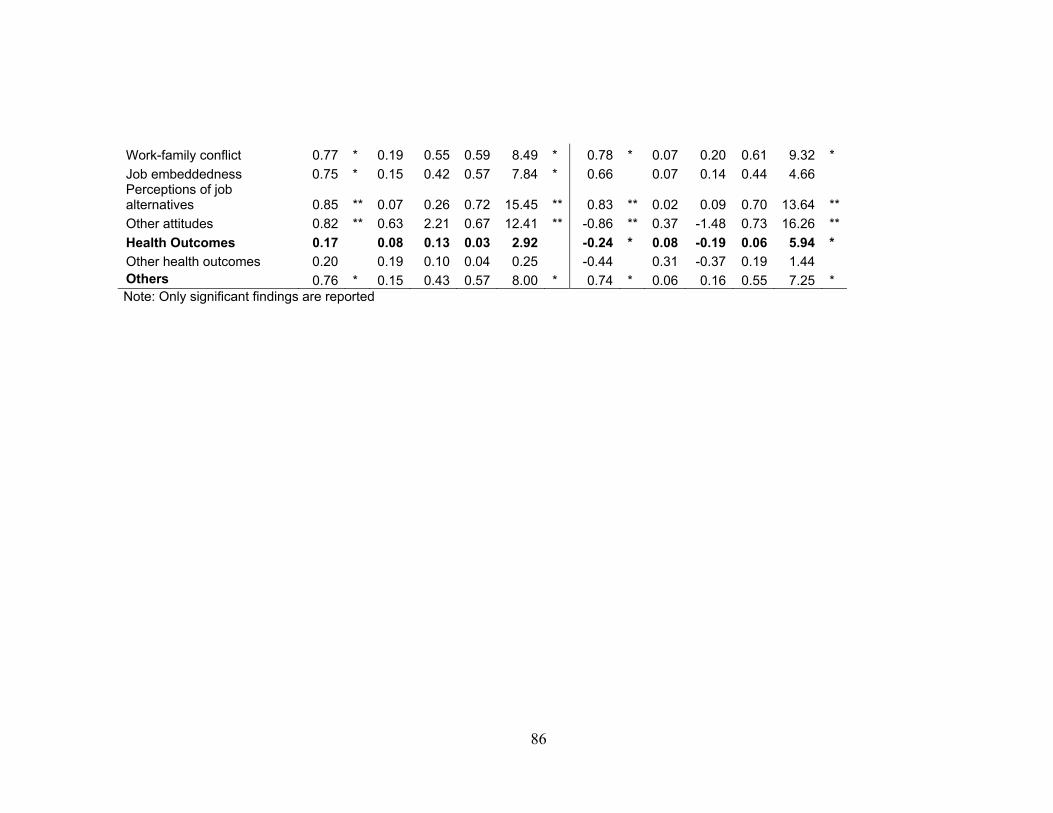
86
Work-family conflict 0.77 * 0.19 0.55 0.59 8.49 * 0.78 * 0.07 0.20 0.61 9.32 * Job embeddedness 0.75 * 0.15 0.42 0.57 7.84 * 0.66 0.07 0.14 0.44 4.66 Perceptions of job alternatives 0.85 ** 0.07 0.26 0.72 15.45 ** 0.83 ** 0.02 0.09 0.70 13.64 **Other attitudes 0.82 ** 0.63 2.21 0.67 12.41 ** -0.86 ** 0.37 -1.48 0.73 16.26 **Health Outcomes 0.17 0.08 0.13 0.03 2.92 -0.24 * 0.08 -0.19 0.06 5.94 * Other health outcomes 0.20 0.19 0.10 0.04 0.25 -0.44 0.31 -0.37 0.19 1.44 Others 0.76 * 0.15 0.43 0.57 8.00 * 0.74 * 0.06 0.16 0.55 7.25 *
Note: Only significant findings are reported