The State of Facilities at Midwestern Institutions
17
Center University of Missouri – Columbia University of Missouri – Kansas City University of Missouri – St. Louis University of Nebraska at Kearney University of Nebraska at Lincoln University of Nebraska Medical Center University of Nebraska Omaha University of New Brunswick University of New Hampshire University of New Haven University of New Mexico University of North Texas University of Northern Iowa University of Notre Dame University of Oregon University of Ottawa University of Pennsylvania University of Redlands University of Rhode Island University of Rochester University of San Diego University of San Francisco University of Southern Maine University of Southern Mississippi University of St. Thomas University of Tennessee Health Science Center University of Tennessee, Knoxville University of Texas at Dallas University of the Sciences in Philadelphia University of Toledo University of Vermont University of Washington Vanderbilt University Virginia Commonwealth University Virginia Department of General Services Wagner College Wake Forest University Washburn University Washington University in St. Louis Wellesley College Wesleyan University West Chester University State of Facilities in Higher Education: 2015 Benchmarks, Best Practices, & Trends Midwestern Institutions
-
Upload
sightlines -
Category
Education
-
view
162 -
download
5
Transcript of The State of Facilities at Midwestern Institutions

University of Mississippi Medical
Center
University of Missouri – Columbia
University of Missouri – Kansas City
University of Missouri – St. Louis
University of Nebraska at Kearney
University of Nebraska at Lincoln
University of Nebraska Medical Center
University of Nebraska Omaha
University of New Brunswick
University of New Hampshire
University of New Haven
University of New Mexico
University of North Texas
University of Northern Iowa
University of Notre Dame
University of Oregon
University of Ottawa
University of Pennsylvania
University of Redlands
University of Rhode Island
University of Rochester
University of San Diego
University of San Francisco
University of Southern Maine
University of Southern Mississippi
University of St. Thomas
University of Tennessee Health
Science Center
University of Tennessee, Knoxville
University of Texas at Dallas
University of the Sciences in
Philadelphia
University of Toledo
University of Vermont
University of Washington
Vanderbilt University
Virginia Commonwealth University
Virginia Department of General
Services
Wagner College
Wake Forest University
Washburn University
Washington University in St. Louis
Wellesley College
Wesleyan University
West Chester University
State of Facilities in Higher Education: 2015 Benchmarks, Best Practices, & Trends
Midwestern Institutions

16%
24%
33%
27%
0%
10%
20%
30%
40%
50%
60%
70%
80%
90%
100%
Midwest Region
% o
f S
pa
ce
2015 Age Profile
Under 10 10 to 25 25 to 50 Over 50
High Risk
% of Space Over 25 Years Old Continues to Rise
2
Roughly 60% of space is over 25 years old, which is a critical age threshold that threatens the reliability of program delivery. While
some Midwestern institutions have been able to renovate their 25 to 50 year old space, others have had to watch their facilities age
without significant renovation and are now crossing over into the over 50 year old category, significantly compounding the challenge
of finding money to address the preponderance of needs coming due.
10-25
25-50
Focus on PM:
Significant need for PM in
young systems.
Low Risk:
“Honeymoon” period –
little need for capital
reinvestment.
Medium Risk:
Lower cost space
renewal updates needed.
Higher Risk:
Life Cycles coming due in
core building
components.
React as Needed:
Issues in components
past the end of their
lifecycles will demand
reactive maintenance.
Highest Risk:
Life cycles of major components past due –end of building life cycle
approaching.
Operational
Demands:Capital Risk:
Under
10
Over
50
Balance PM and Reactive
Maintenance:
Younger components still
require PM.
Aging components require
reactive maintenance.

0%
2%
4%
6%
8%
10%
12%
14%
16%
Space Growth Enrollment Growth
Declining Enrollment Adds to Challenge of Managing Density
3
In addition to older space, Midwestern institutions are dealing with flat enrollment rates while experiencing some of the highest
percentage increases in space since 2008. To the point where the increase in space is practically double the increase in
enrollment. As a result, Midwestern campuses are experiencing steady declines in student density (22% decrease since
2008), which raises questions about how space will be managed with fewer students. With future enrollment projections
difficult to determine, managing campus density will be a critical strategy in the future as rightsizing decisions may become a
reality.
Central Eastern Midwest Rocky Mountain Southern Pacific Coast

Capital Funding Slow to Recover; Hitting Highs in 2013
4
0.00
1.00
2.00
3.00
4.00
5.00
6.00
2008 2009 2010 2011 2012 2013 2014 2015
Annual Capital One-Time Capital
$/G
SF
Midwestern institutions took a sizable cut in capital funding in 2010 and it took until 2013 for these institutions to make
a full recovery. While facing several years of stagnant investment levels, Midwestern institutions realized that they had
to reexamine their funding strategies. Although total capital spending was slow to recover, annual capital spending has
been on the rise since 2011 as campuses have begun to look at institutional sources of funding more seriously in
recent years. This funding type enables leaders to be proactive about pending critical needs and flexibly apply
appropriations to preserve physical assets. This becomes increasingly important when institutions are unable to rely
on large one-time infusions of capital to address major needs.

Mix of Capital Spending on the Right Track
5
42% 39% 38% 38% 38% 37%41% 38%
40%43%
49% 48% 46% 46% 41% 44%
18% 18%13% 14% 16% 17% 18% 18%
0%
10%
20%
30%
40%
50%
60%
70%
80%
90%
100%
2008 2009 2010 2011 2012 2013 2014 2015
Space Renewal & Safety Code Envelope & Building Systems Infrastructure
In addition to total spending and funding sources, project selection must also be taken into account to fully understand the
impact of historical investment patterns. To counteract the limited capital dollars available, Midwestern institutions have
recently made strong efforts to invest a greater portion of their capital into high priority project needs that affect building
reliability (envelope and mechanical systems) rather than space upgrades. Sightlines has found that space renewal
projects last about 12 years while envelope and buildings systems investment last 30 years or more. So, while
funding remains limited, the shift of that funding to more durable, high ROI investments is an important strategy.

Facilities Operating Budgets Slowly Rising
6
3.53 3.64 3.58 3.53 3.56 3.65 3.67 3.7
0.25 0.27 0.27 0.28 0.30 0.32 0.31 0.34
0.00
1.00
2.00
3.00
4.00
5.00
2008 2009 2010 2011 2012 2013 2014 2015
Daily Service Planned Maintenance
Facilities operating budgets are starting to grow at Midwestern institutions, but at very modest rates. When
compared to steady state adjusted levels, campuses are funding their facilities operations approx. 13% less than
the rate of inflation. This is forcing campuses to try to do more with less.
$/G
SF
3.5
3.6
3.7
3.8
3.9
4
4.1
4.2
0
20,000
40,000
60,000
80,000
100,000
120,000
To
tal G
SF
/FT
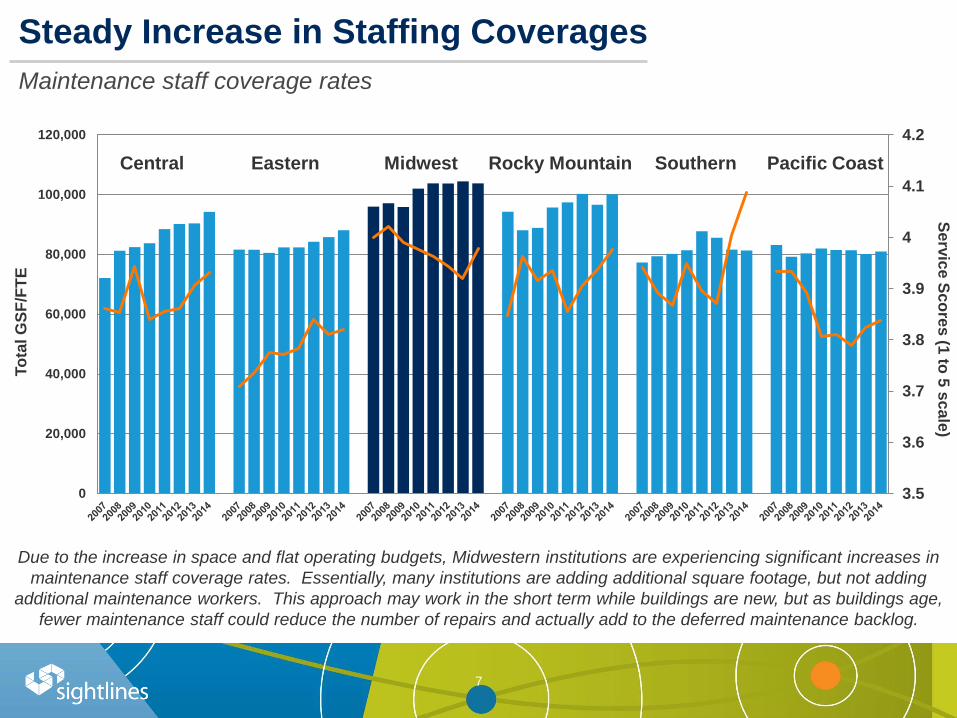
ESteady Increase in Staffing Coverages
Maintenance staff coverage rates
7
Central Eastern Midwest Rocky Mountain Southern Pacific Coast
Due to the increase in space and flat operating budgets, Midwestern institutions are experiencing significant increases in
maintenance staff coverage rates. Essentially, many institutions are adding additional square footage, but not adding
additional maintenance workers. This approach may work in the short term while buildings are new, but as buildings age,
fewer maintenance staff could reduce the number of repairs and actually add to the deferred maintenance backlog.
Se
rvic
e S
co
res
(1 to
5 s
ca
le)

Facilities Asset Reinvestment Needs Continue to Grow
8
60
65
70
75
80
85
90
95
100
2008 2009 2010 2011 2012 2013 2014 2015
While funding shifts to more durable, high ROI investments have helped to mitigate some risk, overall funding
reductions have caused facilities backlogs to increase by almost 21% since 2008. Finance and Facilities leaders
at Midwestern institutions will need to look into implementing strategies that make the problem smaller and more
manageable, which will help build confidence among decision makers and lead to a greater commitment of capital
and operational resources for facilities.
$/G
SF
9
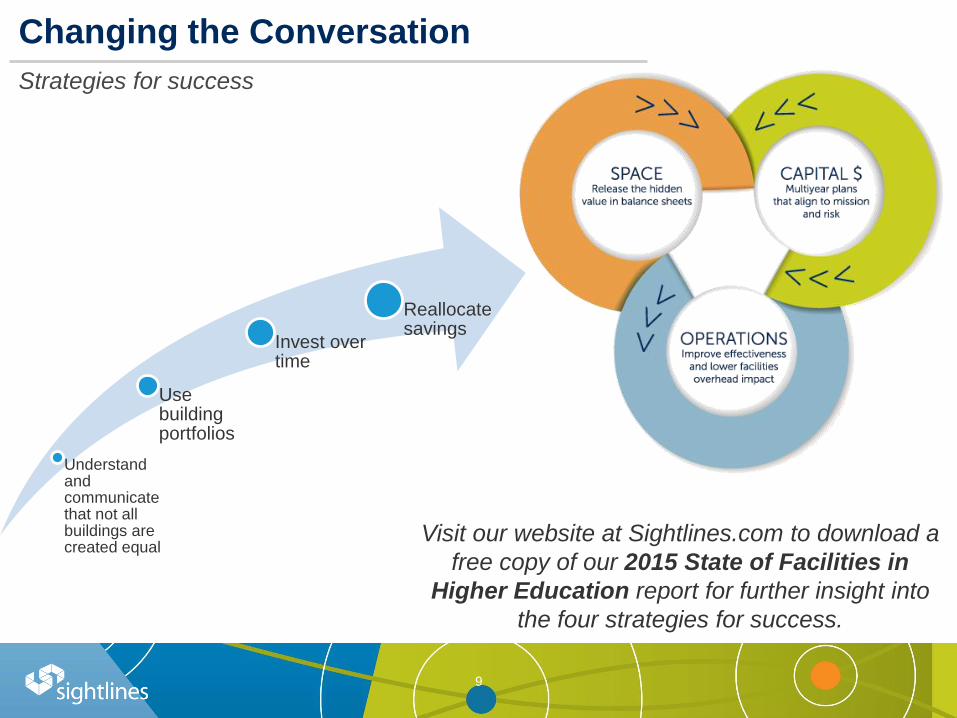
Changing the Conversation
Strategies for success
Understand and communicate that not all buildings are created equal
Use building portfolios
Invest over time
Reallocate savings
Visit our website at Sightlines.com to download a
free copy of our 2015 State of Facilities in
Higher Education report for further insight into
the four strategies for success.

About Sightlines
10

What Does Sightlines Do?
We Connect the Boiler Room
to the Boardroom.

Who Partners with Sightlines?
Robust membership includes colleges, universities, consortiums, and state systems
12
* U.S. News 2016 Rankings
Sightlines is proud to
announce that:
• 450 colleges and
universities are
Sightlines clients
including over 350
ROPA members.
• Consistently over 90%
member retention rate
• We have clients in
over 40 states, the
District of Columbia
and five Canadian
provinces
• More than 125 new
institutions became
Sightlines members
since 2013
Sightlines advises state
systems in:
• Alaska
• California
• Florida
• Hawaii
• Maine
• Massachusetts
• Minnesota
• Mississippi
• Missouri
• Nebraska
• New Hampshire
• New Jersey
• Pennsylvania
• Texas
Serving the Nation’s Leading Institutions:
• 70% of the Top 20 Colleges*
• 75% of the Top 20 Universities*
• 34 Flagship State Universities
• 14 of the 14 Big 10 Institutions
• 12 of the 14 SEC Institutions
• 9 of the 12 Ivy Plus Institutions
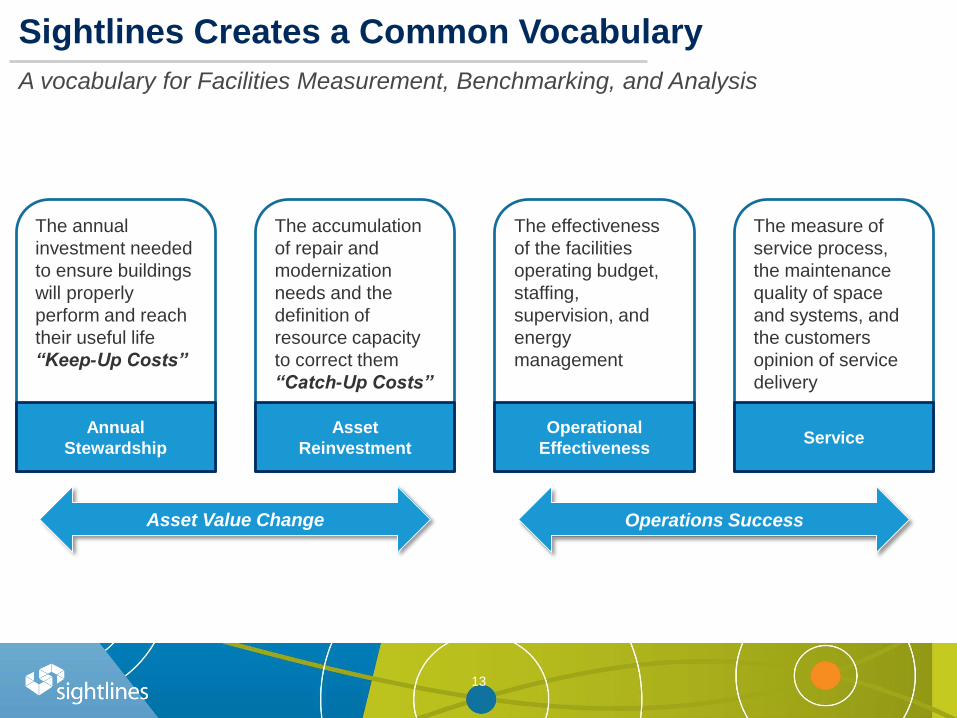
Sightlines Creates a Common Vocabulary
A vocabulary for Facilities Measurement, Benchmarking, and Analysis
13
Asset Value Change
The annual
investment needed
to ensure buildings
will properly
perform and reach
their useful life
“Keep-Up Costs”
Annual
Stewardship
The accumulation
of repair and
modernization
needs and the
definition of
resource capacity
to correct them
“Catch-Up Costs”
Asset
Reinvestment
The effectiveness
of the facilities
operating budget,
staffing,
supervision, and
energy
management
Operational
Effectiveness
The measure of
service process,
the maintenance
quality of space
and systems, and
the customers
opinion of service
delivery
Service
Operations Success

Sightlines Drives a New Conversation
Facilities intelligence toolkit that connects the dots between space, capital, and operating policies
14
A new conversation around facilities management…
• Treats physical plant like a core business
• Uses concepts of endowment management to contextualize investment decisions;
• Aligns facilities operations and capital investment with institutional mission and finance;
• Uses predictive analysis to focus on outcomes and not inputs.
• Lets you tell your “facilities story” as effective as possible.

Three Phases for Continuous Improvement
15
ROPA+ model
16
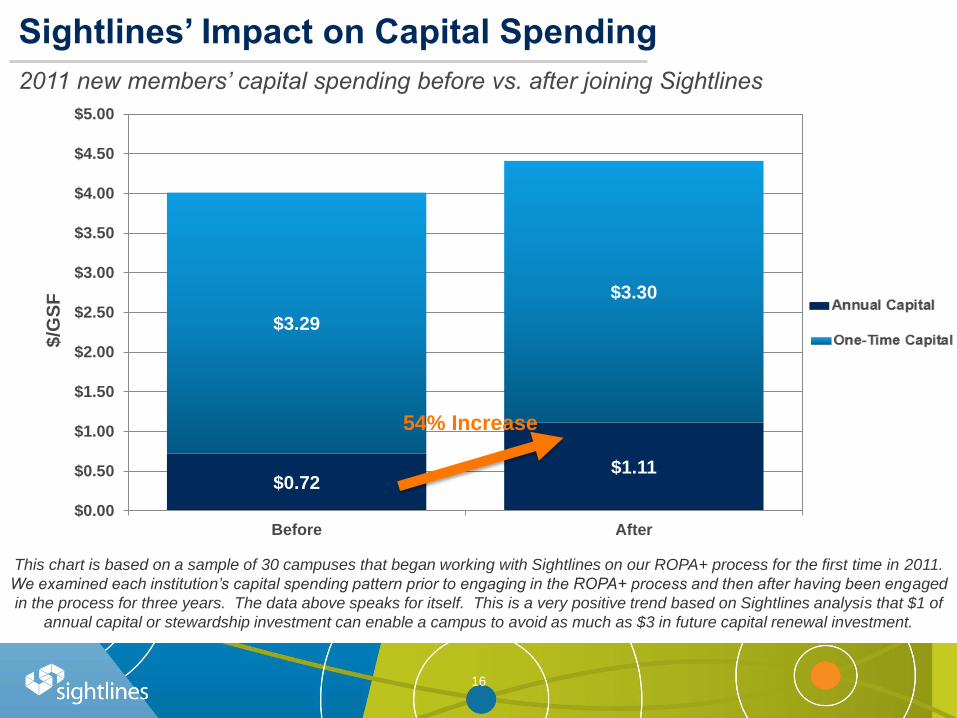
Sightlines’ Impact on Capital Spending
2011 new members’ capital spending before vs. after joining Sightlines
$0.72$1.11
$3.29
$3.30
$0.00
$0.50
$1.00
$1.50
$2.00
$2.50
$3.00
$3.50
$4.00
$4.50
$5.00
Before After
$/G
SF
54% Increase
This chart is based on a sample of 30 campuses that began working with Sightlines on our ROPA+ process for the first time in 2011.
We examined each institution’s capital spending pattern prior to engaging in the ROPA+ process and then after having been engaged
in the process for three years. The data above speaks for itself. This is a very positive trend based on Sightlines analysis that $1 of
annual capital or stewardship investment can enable a campus to avoid as much as $3 in future capital renewal investment.

Connect with Sightlines
Get in touch with us to start a new facilities conversation on campus
17
We’re eager to discuss your needs and answer any questions you may have
about our Facilities Intelligence Solutions or these latest trends.
Call us at
(203) 682-4950
Email us at
Website:
www.sightlines.com/
contact-us