The State of Affairs - Sandvine...Amazon Fire TV Stick 4K 1.5% Amazon Fire TV Stick 35.7% Device...
7
1 SANDVINE.COM The State of Affairs Video and Television Piracy Worldwide Over the past two years, as part of Sandvine’s Global Internet Phenomena Report activities, we released spotlight reports that examined the data fraud and revenue assurance issues that network operators are facing around the world. Several of these reports focused specifically on the threats that subscription television piracy poses to network operators, content creators, and rights holders. With the issue of copyright enforcement becoming a growing topic of interest worldwide, Sandvine released the first worldwide market study on subscription television piracy services to provide real network data on the prevalence of video piracy. While this report does provide high-level context for the video piracy issues at hand, for additional technical context and background on these issues, we encourage you to download the following reports from Sandvine’s website: Video and Television Piracy Whitepaper 2019 Global Internet Phenomena Spotlight: Piracy Revived: File sharing is again over 30% of worldwide upstream bandwidth consumption 2018 Global Internet Phenomena Spotlight: Video Piracy in North America 2018 Global Internet Phenomena Spotlight: Video Piracy in Canada 2017 Global Internet Phenomena Spotlight: Subscription Television Piracy INTRODUCTION TO SUBSCRIPTION TELEVISION PIRACY Today, despite the continued growth in licensed services, there are still consumers committing content fraud and using piracy services offered for below the cost of legal content. This new breed of piracy providers is penetrating the market, and their network usage is of the same order of magnitude as many live television streaming services. An emergent form of subscription television piracy (aimed at replicating the live television experience offered by cable and satellite providers) is seeing an increased adoption in developed markets. Left unchecked, we expect this live television piracy trend to grow both due to the ease and relatively low cost of accessing unlicensed content and due to the infrastructure available on the internet for pirates to leverage. The risk to content service providers is enormous; networks will struggle with bandwidth consumed and content providers will not get revenue for their content and, with the increasing fragmentation of the market, we expect these issues to grow over the next few years. WHITEPAPER
Transcript of The State of Affairs - Sandvine...Amazon Fire TV Stick 4K 1.5% Amazon Fire TV Stick 35.7% Device...
CASE STUDYWHITEPAPER
1 SANDVINE.COM
The State of Affairs Video and Television Piracy Worldwide
Over the past two years, as part of Sandvine’s Global Internet Phenomena Report
activities, we released spotlight reports that examined the data fraud and revenue
assurance issues that network operators are facing around the world. Several of these
reports focused specifically on the threats that subscription television piracy poses to
network operators, content creators, and rights holders.
With the issue of copyright enforcement becoming a growing topic of interest worldwide,
Sandvine released the first worldwide market study on subscription television piracy services
to provide real network data on the prevalence of video piracy.
While this report does provide high-level context for the video piracy issues at hand, for
additional technical context and background on these issues, we encourage you to download
the following reports from Sandvine’s website:
Video and Television Piracy Whitepaper
2019 Global Internet Phenomena Spotlight: Piracy Revived: File sharing is again over
30% of worldwide upstream bandwidth consumption
2018 Global Internet Phenomena Spotlight: Video Piracy in North America
2018 Global Internet Phenomena Spotlight: Video Piracy in Canada
2017 Global Internet Phenomena Spotlight: Subscription Television Piracy
INTRODUCTION TO SUBSCRIPTION TELEVISION PIRACYToday, despite the continued growth in licensed services, there are still consumers committing
content fraud and using piracy services offered for below the cost of legal content. This new
breed of piracy providers is penetrating the market, and their network usage is of the same
order of magnitude as many live television streaming services.
An emergent form of subscription television piracy (aimed at replicating the live television
experience offered by cable and satellite providers) is seeing an increased adoption in
developed markets. Left unchecked, we expect this live television piracy trend to grow both
due to the ease and relatively low cost of accessing unlicensed content and due to the
infrastructure available on the internet for pirates to leverage.
The risk to content service providers is enormous; networks will struggle with bandwidth
consumed and content providers will not get revenue for their content and, with the increasing
fragmentation of the market, we expect these issues to grow over the next few years.
WHITEPAPER
CASE STUDYWHITEPAPER
2
SANDVINE STUDY DATA DETAILSSandvine’s Global Internet Phenomena Report examines a representative cross-section
of the world’s leading fixed and mobile content service providers. This report is made
possible by the voluntary participation of our customers.
The data gathered is completely subscriber-anonymous and no information regarding specific
content or personally identifiable information including, but not limited to, IP or MAC
addresses and subscriber IDs were collected during this study.
The data behind this report is inclusively representative of the following:
Regional Information
Canada, United States, Europe, Middle East, and North Africa
Network Coverage Information
• Information from six networks
• Networks collectively have 65 million fixed internet subscribers
• Sandvine study participation is a percentage of the 65 million fixed internet subscribers
Data Coverage
Data collected over two months, from the end of July to the end of September.
Statistics analyzed include:
• Network-wide subscription television piracy proliferation rates
• 1+ billion usage records from fraudulent subscription television piracy activity
• Data is reported as a monthly usage figure
SUBSCRIPTION TELEVISION PIRACYBy producing or licensing television, film, sports, and other premium content, content
service providers aim to create content libraries that increase the appeal of bundled offers
(e.g., triple and quad play services) to stand out from the competition and provide exclusive
value to their subscribers.
To better understand the problem of live television piracy services, Sandvine worked with fixed access
content service providers worldwide to research the adoption of subscription television piracy services
on their networks.
As the first step towards understanding the prevalence and characteristics of television piracy
service consumption, Sandvine researched and identified the leading television piracy services
using both network data and information from online forums that openly discuss the topic.
This research allowed us to construct and maintain an up-to-date list of television piracy
services; this list could then be used to measure and project the number of subscribers
accessing television piracy services on a real-time basis.
SANDVINE.COM
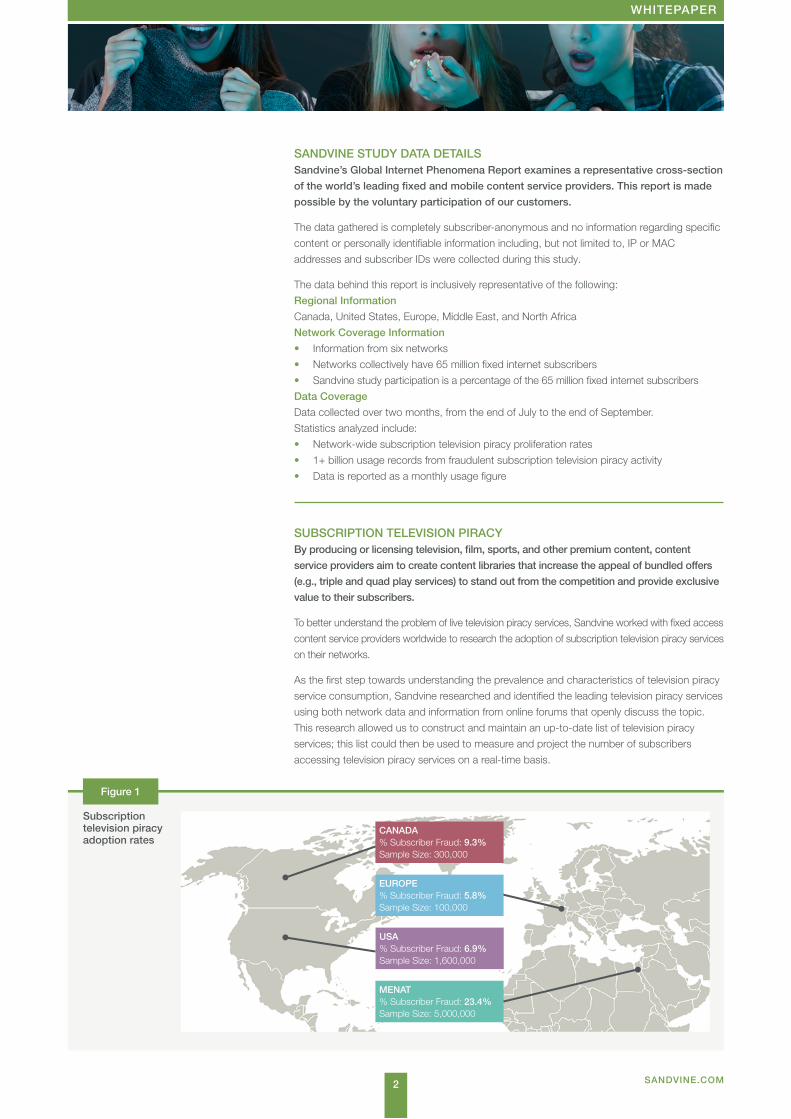
Figure 1
Subscription television piracy adoption rates
CANADA% Subscriber Fraud: 9.3%Sample Size: 300,000
USA % Subscriber Fraud: 6.9%Sample Size: 1,600,000
MENAT % Subscriber Fraud: 23.4%Sample Size: 5,000,000
EUROPE % Subscriber Fraud: 5.8%Sample Size: 100,000

CASE STUDYWHITEPAPER
3
The data in Fig. 1 presents monthly usage subscriber fraud averaged over the course of the
two months of the study (July-September 2019).
Our research across multiple Tier 1 fixed access networks reveals that adoption rates of
subscription television piracy vary regionally. As discussed in prior reports, demographics
matter; this is reflected in the MENAT 23.4% fraud numbers, where subscribers turn to illicit
services merely to get access to content, as there are few legitimate means of attaining the
content they desire to view.
Since the 2018 Global Internet Phenomena Report, there has been growth in both the
American market (up from 5.5%) and Canadian markets (up from 8.3%). For the first time,
IPTV usage has been reported from a European operator coming in at 5.8%, but Sandvine
expects subscribership growth as the soccer (football) season gets underway.
The applications and hardware enabling subscription television piracy itself do not generate
sufficient identifiable data; however, by looking at the heartbeat traffic, it can be easily be
identified within a household. As such, one can classify the usage behavior of an average
household that is pirating content.
For further information, please contact us and Sandvine can provide further information on how to
interpret subscription television piracy adoption data.
SUBSCRIPTION TELEVISION PIRACY ECOSYSTEMBeyond satisfying curiosity about the device and software ecosystem, investigating the
devices subscribers are using can help content service providers gain a more
comprehensive understanding of the security threats on the network.
Most importantly is that these fraudulent IPTV services share the same ecosystem as
platforms that can be configured to use completely legal, fee-paid services, as an alternative
to a cable or satellite connection, but modified with piracy configured add-ons to access
premium content. For unlicensed content being delivered over this ecosystem, we classify
services for Video on Demand (VOD) and for live streaming IPTV.
The bulk of live streaming IPTV fraudulent subscription television traffic (Fig. 2) utilizes the
Amazon Fire Stick, the Mag Box, or an android device (likely running KODI or KODI-like
applications) taking up 85.6% of the market share of devices. It is also interesting to note that
there is an extremely long tail of devices that make up this ecosystem.
SANDVINE.COM
Figure 2
Analytics of the market share of devices generating live streaming IPTV, fraudulent subscription television traffic
Device Analytics
Content Type Licensed Unlicensed IPTV VOD
Mag Box 33.8%
Android Device 14.7%
Amazon Fire TV Stick 4K 1.8%
Roku 1.5%
Samsung TV 1.2%
Linux PC 1.2%
Amazon Fire TV 4K 1.2%
Windows PC 0.9%
IPTV STB 0.8%
Amazon Fire TV Stick 37.1%
Device Rank Percent
Amazon Fire TV Stick 1 37.09%
MAG Box 2 33.80%
Android Device 3 14.70%
Amazon Fire TV Stick 4K 4 1.80%
Roku 5 1.51%
Samsung TV 6 1.24%
Linux PC 7 1.22%
Amazon Fire TV 4K 8 1.21%
Windows PC 9 0.94%
IPTV STB 10 0.81%

CASE STUDYWHITEPAPER
4 SANDVINE.COM
Figure 3
Device Analytics
Content Type Licensed Unlicensed IPTV VOD
Android Device 16.0%
Windows PC 15.2%
Macintosh 5.4%
iPhone 4.5%
Windows Device 4.10%
PlayStation 4 2.1%
Apple Device 1.7%
Roku 1.7%
Amazon Fire TV Stick 4K 1.5%
Amazon Fire TV Stick 35.7%
Device Rank Percent
Amazon Fire TV Stick 1 35.69%
Android Device 2 15.97%
Windows PC 3 15.17%
Macintosh 4 5.39%
iPhone 5 4.49%
Windows Device 6 4.12%
PlayStation 4 7 2.05%
Apple Device 8 1.71%
Roku 9 1.70%
Amazon Fire TV Stick 4K 10 1.49%
Top 10 analytics of the market share of devices generating the bulk of VOD, fraudulent subscription television traffic
The majority of VOD fraudulent subscription television traffic utilizes the Amazon Fire Stick, an
android device (likely running the KODI or KODI-like applications), or an emulator on a
Windows PC, which takes up 66.9% of the market share of devices. Noticeably, the MAG
box, an exclusively IPTV set-top box, is not in the top 10. For VOD (Fig. 3), we are seeing a
growth in emulator-type applications that are often circulated as apps in app stores.
From a licensed perspective, it is observed that the operator-owned set-top box is providing
almost the bulk of the licensed subscription television traffic, with Roku, the Amazon Fire
Stick, and an android device rounding out the top four (Fig. 4). The challenge within this
complex ecosystem is to be able to accurately understand which services are providing illicit
content as opposed to legal content.
Figure 4
Device Analytics
Content Type Licensed Unlicensed IPTV VOD
Operator STB 24.5%
Amazon Fire TV Stick 18.2%
Android Device 7.8%
MAG Box 3.3%
Samsung TV 2.4%
Windows PC 1.8%
Chromecast 1.7%
PlayStation 4 1.4%
Vizio 1.2%
Roku 30.6%
Device Rank Percent
Roku 1 30.60%
Operator STB 2 24.46%
Amazon Fire TV Stick 3 18.16%
Android Device 4 7.80%
MAG Box 5 3.31%
Samsung TV 6 2.36%
Windows PC 7 1.83%
Chromecast 8 1.65%
PlayStation 4 9 1.45%
Vizio 10 1.20%
Top 10 devices generating licensed content based on market share

CASE STUDYWHITEPAPER
5
With the same ecosystem providing legal services, it is not a stretch to think that an average,
non-tech-savvy consumer who buys a set-top box from an electronics or computer store and
then pays money to subscribe to a service could conclude that the actions are legitimate,
rather than contributing to an ecosystem of fraud and piracy.
Nevertheless, the reality is different.
SUBSCRIPTION TELEVISION PIRACY ORIGINSUnderstanding the fraudulent ecosystem, including the differentiation between legal
and illicit services provided on the same application, allows for Sandvine to have a
global context in understanding where the data behind the illicit services is being
served from.
Taking a look at a cross section of data from multiple Tier 1 American content service
providers, we can see the interesting trends that emerge from where the data is coming from.
Logistically, the most servers servicing the ecosystem come from the United States (Fig. 5),
but in terms of actual bandwidth (Fig. 6), it is overtaken by servers hosted internationally. Due
to the complexity of the legal issues, many providers are based internationally to make it more
difficult to pursue direct legal action against both the hosting service (if hosted) and the owner
of the service provider themselves.
SANDVINE.COM
Figure 5
Geographic distribution by server count
Rank Country
1 USA
2 Canada
3 UK
4 Netherlands
5 France
Figure 6
Geographic distribution by bandwidth
Rank Country
1 Canada
2 Czech Republic
3 USA
4 Germany
5 Netherlands

SUBSCRIPTION TELEVISION PIRACY VIEWERSHIPBecause millions, and even billions, of dollars are invested by content service providers
to produce, license, and distribute content, understanding which channels subscribers
are watching can provide valuable insight (Fig.7).
International/Regional ContentThe most significant channels, in terms of overall bandwidth usage, are international channels.
The top channels vary from network-to-network (and even from neighborhood-to-
neighborhood) because of shifting demographics but, as an example, two of the top five
channels were channels originating from Southeast Asia.
While local cable and satellite providers do offer some channels from Southeast Asia, those
channels are typically offered as a bolt-on to an existing television package. Without paying to
legitimately license the content, television piracy services can meet the demand for non-local
content at a price that is significantly lower than official channels.
News
The top bandwidth-consuming channels on every network examined are 24/7 cable news
channels, which may come as a surprise to many. What is interesting about the shape of
the traffic curves is that the levels remain relatively constant throughout the day. Like all
video applications, pirate television bandwidth peaks in the evening as people come home,
but the traffic curve of news channels differs from the shape of the television piracy services
as a whole.
This use case makes us believe that pirate television services could be common in locations
like waiting rooms, office lobbies, or bars where a television is installed to help distract clients
while they are waiting for an appointment.
Live Sports One of the main sources of revenue for modern sports leagues is television rights. During our
study, there were a few marked events that occurred over the summer, but three significant
spikes associated with the India versus West Indies matches occurred (Fig. 8). For
broadcasters, the business case for live sports content is a simple one; unlike Game of
Thrones, where it is possible to avoid spoilers and watch the next day, sporting events are
best experienced live.
CASE STUDYWHITEPAPER
6 SANDVINE.COM
Figure 7
An example of the traffic share in a major North American city
Fraudulent Channel Traffic Share
Volume
Highest 5 IPTV Channel (Group) Percentage of Traffic
Regional Content 30.21%
Sports 6.45%
News 5.14%
Local Content 3.50%
Kids 2.01%
>

CASE STUDYWHITEPAPER
CONCLUSIONS
Sandvine is publishing this report due to the increased interest from numerous network
operators, content creators, and media outlets, all of whom are aware of the challenges
posed by the distribution of pirated video content, but none of whom have access to
data that quantifies the problem.
Sandvine believes that emergent forms of subscription television piracy represent a real threat
to the revenue streams of network operators, not only because the content is being stolen,
but because in some instances subscribers are paying to pirate these services, with no
money going into the pockets of the content creators or rights holders.
While legal services like Netflix are still more widely adopted, subscription pirate television
services have grown rapidly after having no adoption five years ago.
The piracy figures reported in this report should also be considered a floor and not a ceiling as our data
does not capture all video piracy conducted from a traditional web browser, and it is very likely that
many households are not participating in both emergent forms of video piracy covered in this report.
For further information, please contact us. We would be happy to provide further information
on how to interpret subscription television piracy adoption data and answer any questions you
may have.
7Copyright © 2015 Sandvine Networks. All rights reserved. All other trademarks are property of their respective owners.
ABOUT SANDVINESandvine helps organizations run world-class networks with Active Network Intelligence, leveraging machine learning analytics and closed-loop automation to identify and adapt to network behavior in real-time. With Sandvine, organizations have the power of a highly automated platform from a single vendor that delivers a deep understanding of their network data to drive faster, better decisions. For more information, visit sandvine.com or follow Sandvine on Twitter at @Sandvine.
Copyright ©2020 Sandvine Corporation. All rights reserved. Any unauthorized reproduction prohibited. All other trademarks are the property of their respective owners.
This documentation, including all documentation incorporated by reference herein such as documentation provided or made available on the Sandvine website, are provided or made accessible “AS IS” and “AS AVAILABLE” and without condition, endorsement, guarantee, representation, or warranty of any kind by Sandvine Corporation and its affiliated companies (“Sandvine”), and Sandvine assumes no responsibility for any typographical, technical, or other inaccuracies, errors, or omissions in this documentation. In order to protect Sandvine proprietary and confidential information and/or trade secrets, this documentation may describe some aspects of Sandvine technology in generalized terms. Sandvine reserves the right to periodically change information that is contained in this documentation; however, Sandvine makes no commitment to provide any such changes, updates, enhancements, or other additions to this documentation to you in a timely manner or at all.
SANDVINE.COMv20200224
USA 2055 Junction AvenueSuite Number 105San Jose, CA, 95131 USA
EUROPE Svärdfiskgatan 4 432 40 Varberg,Halland Sweden T. +46 340.48 38 00
CANADA 408 Albert Street, Waterloo, Ontario N2L 3V3, Canada T. +1 519.880.2600
ASIA RMZ Ecoworld, Building-1, Ground Floor, East Wing Devarabeesanahalli, Bellandur, Outer Ring Road, Bangalore 560103, India T. +91 80677.43333
>
Figure 8
Analysis of the percentage of IPTV traffic related to sports, highlighting the three significant spikes in traffic during the India and West Indies matches
Fraudulent Channel Traffic Share
Volume


![Model No: TV STAR Smart Stick III · Use HDMI cable to connect “TVSTAR Smart Stick III” with your TV. 2. ... Paspauskite piktogramą [Screen], kad pakeistumėte mini ... Garantinė](https://static.fdocuments.us/doc/165x107/5ce6834d88c99304558b4eda/model-no-tv-star-smart-stick-use-hdmi-cable-to-connect-tvstar-smart-stick.jpg)