THE SPELEOTHEM RECORD OF CLIMATE CHANGE IN …ingham/saudicaves/OF-2004-8.pdf · THE SPELEOTHEM...
46
THE SPELEOTHEM RECORD OF CLIMATE CHANGE IN SAUDI ARABIA BY DOMINIK FLEITMANN, ALBERT MATTER , J OHN J. PINT, AND MAHMOUD A. AL-SHANTI OPEN-FILE REPORT SGS-OF-2004-8 1425 H 2004 G
-
Upload
duongthien -
Category
Documents
-
view
217 -
download
3
Transcript of THE SPELEOTHEM RECORD OF CLIMATE CHANGE IN …ingham/saudicaves/OF-2004-8.pdf · THE SPELEOTHEM...

i
THE SPELEOTHEM RECORD OF CLIMATE CHANGE IN SAUDI ARABIA
BY
DOMINIK FLEITMANN, ALBERT MATTER, JOHN J. PINT, AND
MAHMOUD A. AL-SHANTI
OPEN-FILE REPORTSGS-OF-2004-8
1425 H 2004 G
ii
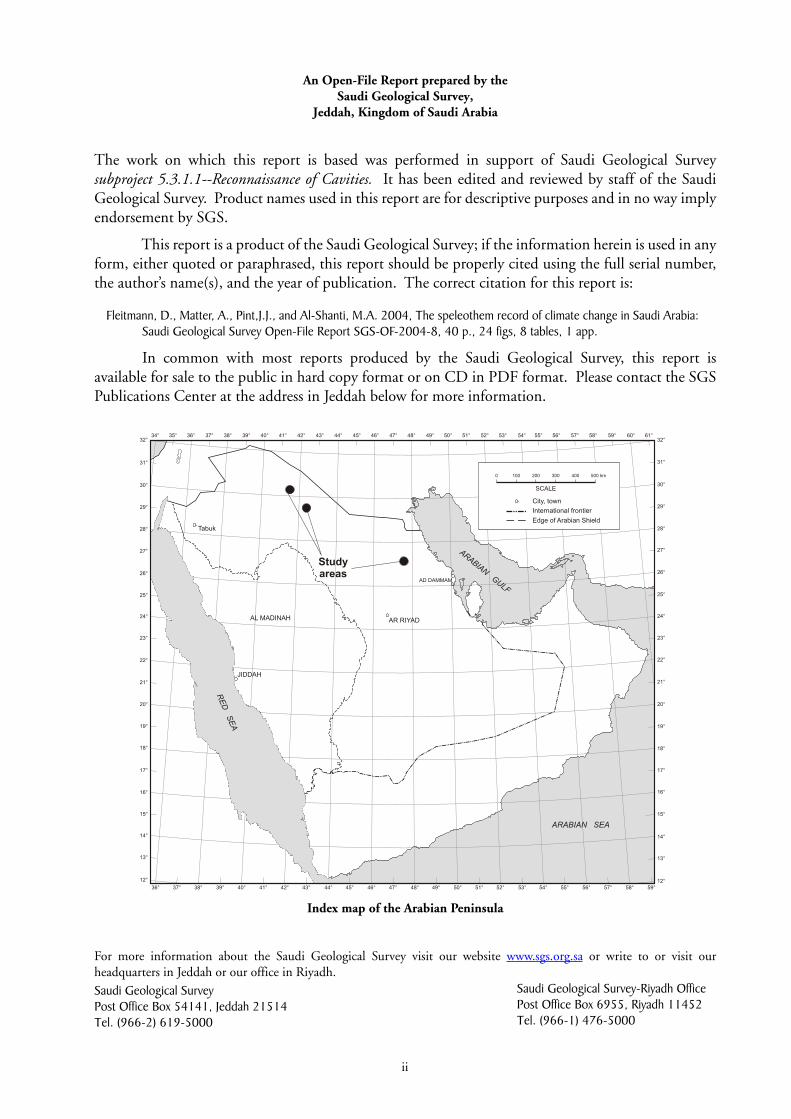
An Open-File Report prepared by theSaudi Geological Survey,
Jeddah, Kingdom of Saudi Arabia
The work on which this report is based was performed in support of Saudi Geological Survey subproject 5.3.1.1--Reconnaissance of Cavities. It has been edited and reviewed by staff of the Saudi Geological Survey. Product names used in this report are for descriptive purposes and in no way imply endorsement by SGS.
This report is a product of the Saudi Geological Survey; if the information herein is used in any form, either quoted or paraphrased, this report should be properly cited using the full serial number, the author’s name(s), and the year of publication. The correct citation for this report is:
Fleitmann, D., Matter, A., Pint,J.J., and Al-Shanti, M.A. 2004, The speleothem record of climate change in Saudi Arabia: Saudi Geological Survey Open-File Report SGS-OF-2004-8, 40 p., 24 figs, 8 tables, 1 app.
In common with most reports produced by the Saudi Geological Survey, this report is available for sale to the public in hard copy format or on CD in PDF format. Please contact the SGS Publications Center at the address in Jeddah below for more information.
Index map of the Arabian Peninsula
For more information about the Saudi Geological Survey visit our website www.sgs.org.sa or write to or visit our headquarters in Jeddah or our office in Riyadh.Saudi Geological SurveyPost Office Box 54141, Jeddah 21514Tel. (966-2) 619-5000
Saudi Geological Survey-Riyadh OfficePost Office Box 6955, Riyadh 11452Tel. (966-1) 476-5000
12°
13°
14°
15°
16°
17°
18°
19°
20°
21°
22°
23°
24°
25°
26°
27°
28°
29°
30°
31°
32°34° 35° 36° 37° 38° 39° 40° 41° 42° 43° 44° 45° 46° 47° 48° 49° 50° 51° 52° 53° 54° 55° 56° 57° 58° 59° 60° 61°
12°
13°
14°
15°
16°
17°
18°
19°
20°
21°
22°
23°
24°
25°
26°
27°
28°
29°
30°
31°
32°
36° 37° 38° 39° 40° 41° 42° 43° 44° 45° 46° 47° 48° 49° 50° 51° 52° 53° 54° 55° 56° 57° 58° 59°
Edge of Arabian Shield
International frontier
City, town
ARABIAN SEA
AL MADINAH AR RIYAD
AD DAMMAM
Tabuk
AR
ABIA
N
GU
LF
500 km4003002001000
SCALE
Studyareas
RE
DS
EA
JIDDAH

iii
TABLE OF CONTENTS
Page
ABSTRACT....................................................................................................................................1
ABSTRACT ARA BIC ....................................................................................................................2
INTRODUCTION........................................................................................................................3
RESEARCH GOAL........................................................................................................................3
METEOROLOGICAL CONDITIONS........................................................................................3
General Circulation Patterns .....................................................................................................3
Variation of the Indian Ocean Monsson....................................................................................4
Climate in Saudi Arabia ............................................................................................................4
SPELEOTHEMS AS AN ARCHIVE OF ENVIRONMENTAL CHANGES................................5
Introduction..............................................................................................................................5
U-Series Disequilibrium Dating of Speleothems........................................................................5
Stable Isotopes...........................................................................................................................7
Itroduction..........................................................................................................................7
Stable isotopic composition of precipitation ........................................................................7
Oxygen isotopes (δ18O) in speleothems .............................................................................8
Carbon isotopes (δ13C) in speleothems ............................................................................10
SAMPLE DESCRIPTION ...........................................................................................................10
Surprise Cave (Dahl al Mofaja’ah) ...........................................................................................11
Broken-Leg Cave (Dahl Abu Rijl Maksura) .............................................................................11
Star Cave (Kahf al Najmah).....................................................................................................11
Stalagmites SA “B”, “C” and “D”............................................................................................11
RESULTS .....................................................................................................................................14
U-Series Disequilibrium Dating ..............................................................................................14
Stable-Isotope Composition of Speleothem Calcite .................................................................14
DISCUSSION..............................................................................................................................15
Oxygen-Isotope Composition of Modern Rainfall and Modern Groundwaters .......................15
Oxygen-Isotope Composition of Fossil Stalagmites .................................................................17
Pleistocene and Holocene Climate Variations on the Arabian Peninsula ..................................18
Introduction......................................................................................................................18
Holocene climate variability ..............................................................................................20
Middle to late Pleistocene climate variability (from 12,000 BP to 400,000 BP).................22
Early to middle Pleistocene climate variability (from 12,000 BP to 400,000 BP) ..............23
REFERENCES.............................................................................................................................24
APPENDIX
iv
CONTENTS (cont’d.)
Page
FIGURES
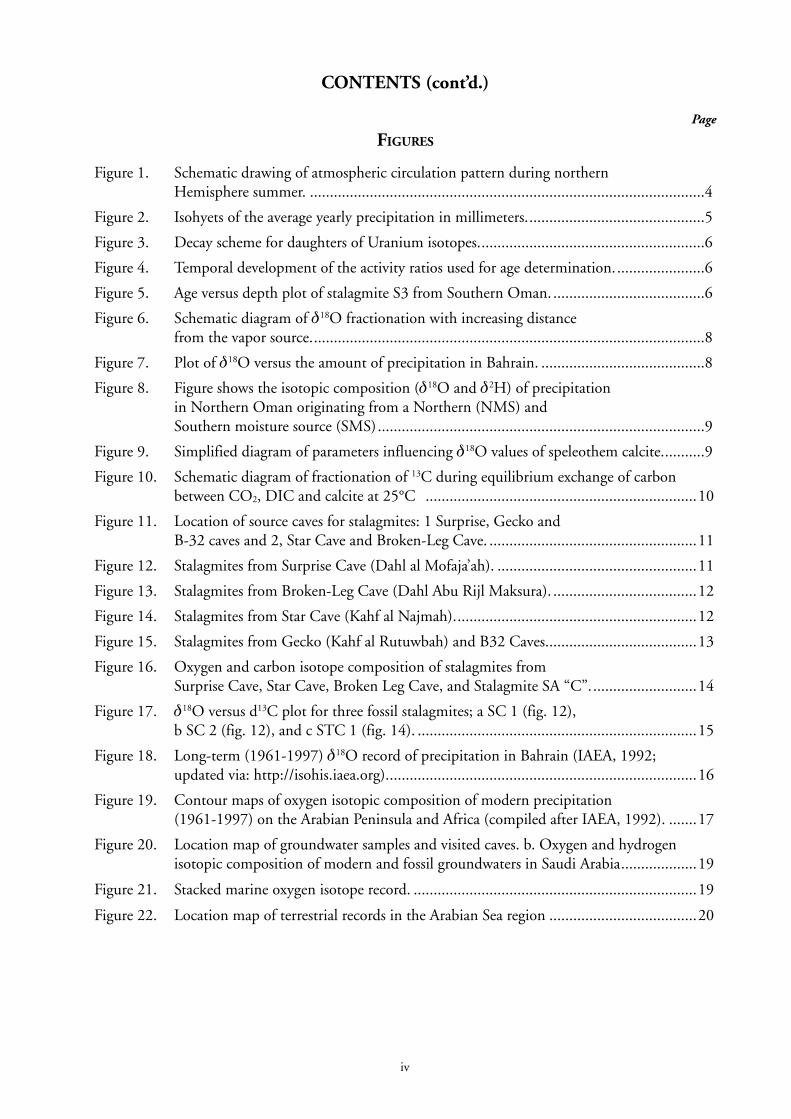
Figure 1. Schematic drawing of atmospheric circulation pattern during northernHemisphere summer. ...................................................................................................4
Figure 2. Isohyets of the average yearly precipitation in millimeters.............................................5
Figure 3. Decay scheme for daughters of Uranium isotopes.........................................................6
Figure 4. Temporal development of the activity ratios used for age determination.......................6
Figure 5. Age versus depth plot of stalagmite S3 from Southern Oman. ......................................6
Figure 6. Schematic diagram of δ18O fractionation with increasing distancefrom the vapor source...................................................................................................8
Figure 7. Plot of δ18O versus the amount of precipitation in Bahrain. .........................................8
Figure 8. Figure shows the isotopic composition (δ18O and δ2H) of precipitationin Northern Oman originating from a Northern (NMS) andSouthern moisture source (SMS)..................................................................................9
Figure 9. Simplified diagram of parameters influencing δ18O values of speleothem calcite...........9
Figure 10. Schematic diagram of fractionation of 13C during equilibrium exchange of carbon between CO2, DIC and calcite at 25°C ....................................................................10
Figure 11. Location of source caves for stalagmites: 1 Surprise, Gecko andB-32 caves and 2, Star Cave and Broken-Leg Cave. ....................................................11
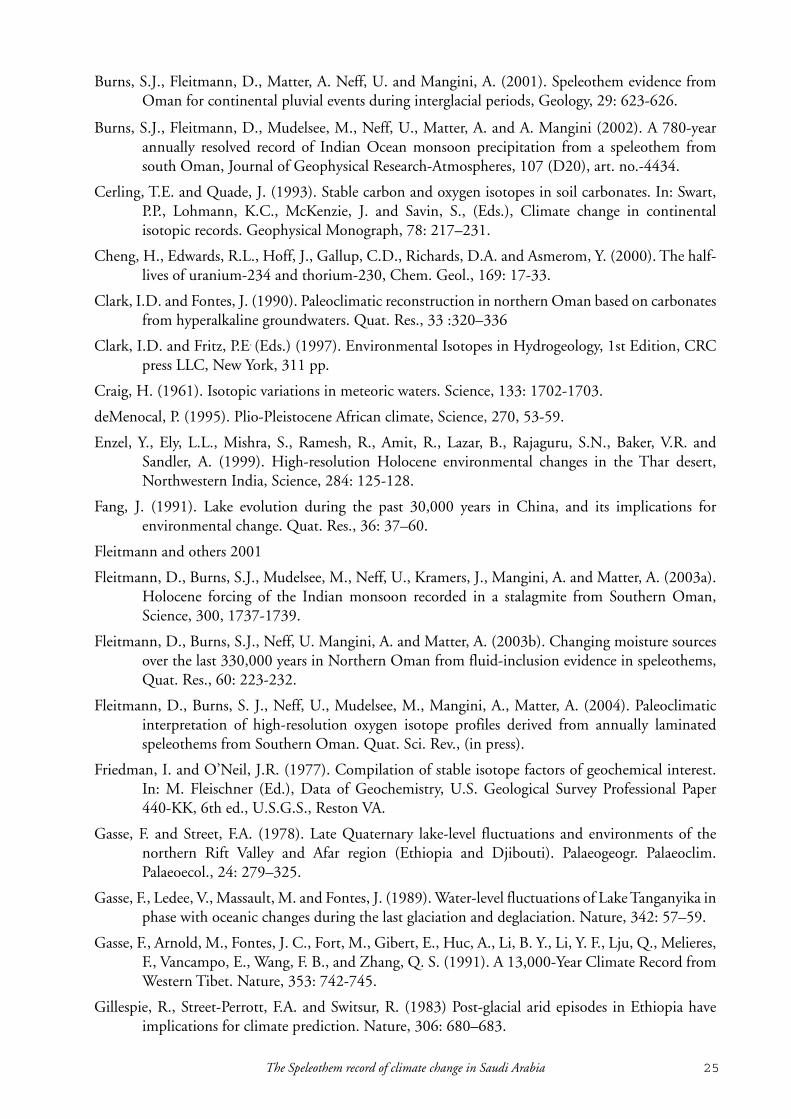
Figure 12. Stalagmites from Surprise Cave (Dahl al Mofaja’ah). ..................................................11
Figure 13. Stalagmites from Broken-Leg Cave (Dahl Abu Rijl Maksura). ....................................12
Figure 14. Stalagmites from Star Cave (Kahf al Najmah).............................................................12
Figure 15. Stalagmites from Gecko (Kahf al Rutuwbah) and B32 Caves......................................13
Figure 16. Oxygen and carbon isotope composition of stalagmites fromSurprise Cave, Star Cave, Broken Leg Cave, and Stalagmite SA “C”...........................14
Figure 17. δ18O versus d13C plot for three fossil stalagmites; a SC 1 (fig. 12),b SC 2 (fig. 12), and c STC 1 (fig. 14). ......................................................................15
Figure 18. Long-term (1961-1997) δ18O record of precipitation in Bahrain (IAEA, 1992;updated via: http://isohis.iaea.org)..............................................................................16
Figure 19. Contour maps of oxygen isotopic composition of modern precipitation(1961-1997) on the Arabian Peninsula and Africa (compiled after IAEA, 1992). .......17
Figure 20. Location map of groundwater samples and visited caves. b. Oxygen and hydrogen isotopic composition of modern and fossil groundwaters in Saudi Arabia...................19
Figure 21. Stacked marine oxygen isotope record. .......................................................................19
Figure 22. Location map of terrestrial records in the Arabian Sea region .....................................20
v
CONTENTS (cont’d.)
Page
FIGURES
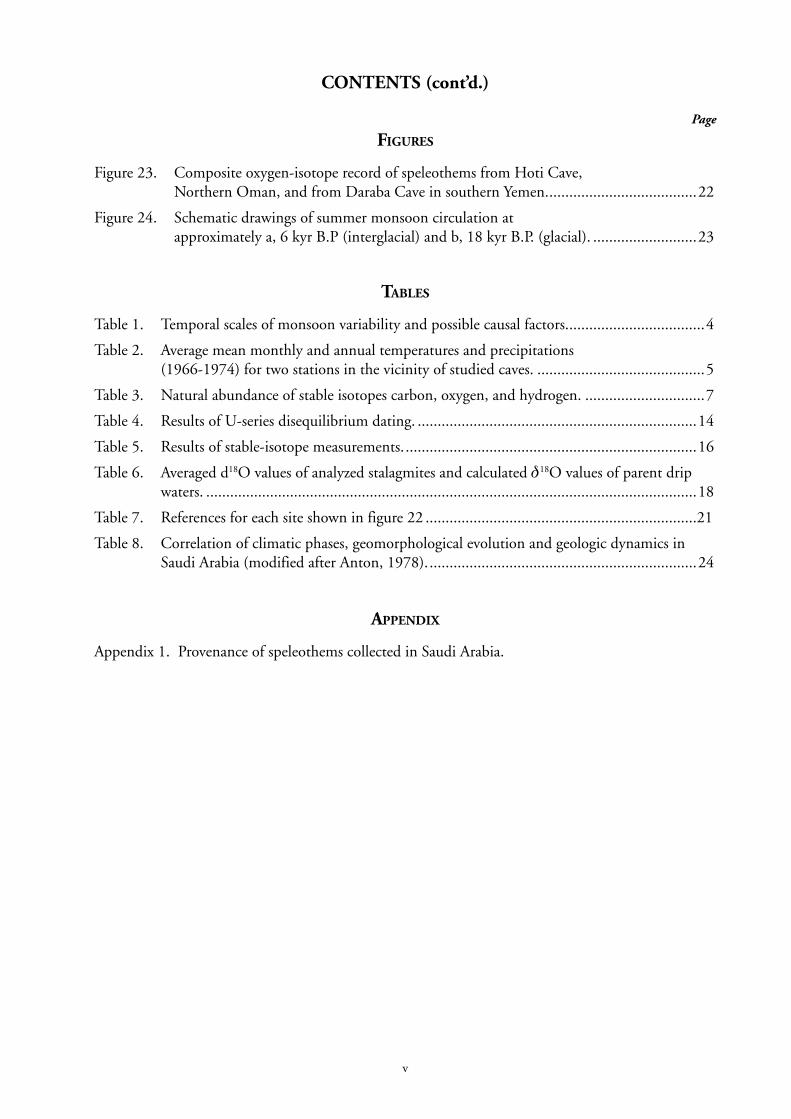
Figure 23. Composite oxygen-isotope record of speleothems from Hoti Cave,Northern Oman, and from Daraba Cave in southern Yemen......................................22
Figure 24. Schematic drawings of summer monsoon circulation atapproximately a, 6 kyr B.P (interglacial) and b, 18 kyr B.P. (glacial). ..........................23
TABLES
Table 1. Temporal scales of monsoon variability and possible causal factors...................................4
Table 2. Average mean monthly and annual temperatures and precipitations(1966-1974) for two stations in the vicinity of studied caves. ..........................................5
Table 3. Natural abundance of stable isotopes carbon, oxygen, and hydrogen. ..............................7
Table 4. Results of U-series disequilibrium dating. ......................................................................14
Table 5. Results of stable-isotope measurements..........................................................................16
Table 6. Averaged d18O values of analyzed stalagmites and calculated δ18O values of parent drip waters. ...........................................................................................................................18
Table 7. References for each site shown in figure 22 ....................................................................21
Table 8. Correlation of climatic phases, geomorphological evolution and geologic dynamics in Saudi Arabia (modified after Anton, 1978)....................................................................24
APPENDIX
Appendix 1. Provenance of speleothems collected in Saudi Arabia.

vi
1The Speleothem record of climate change in Saudi Arabia
THE SPELEOTHEM RECORD OF CLIMATE CHANGE IN SAUDI ARABIA
BY
D. FLEITMANN*, A. MATTER, J.J. PINT, AND M.A. AL-SHANTI
ABSTRACT
Reconstructing the Quaternary climatic history of Saudi Arabia is extremely difficult due to the scarcity of paleoclimate archives. Our current knowledge of climate changes is limited to the last 40,000 years and entirely based on radiocarbon-dated tufas, lake deposits, and alluvial sediments. As all of these records are incomplete due to erosion, the climate history of Saudi Arabia remained largely unknown. More detailed information, however, possibly can be gained from stalagmites, which can be found in numerous caves in Saudi Arabia. A total of 13 samples were collected from three caves, two located in the northern and one in the central part of Saudi Arabia. Uranium-series dating of the stalagmites reveals that all, except one, were as old as or significantly older than 400,000 years, and therefore beyond the limit of the uranium-series method. As stalagmites need water to grow, this may indicate that arid climate conditions prevailed in the central and northern parts of Saudi Arabia since at least 400,000 years B.P. or that periods of increased rainfall were too short and sporadic to favor deposition of large stalagmites. Oxygen and carbon isotopic composition of the collected samples suggest that all speleothem samples were deposited under more humid and cooler climate conditions than those prevailing today.
*Communications to: Dept. of Geological and Environmental Science, Stanford University, Stanford CA 94305-2115([email protected])

2 D. Fleitmann and others, 2004

3The Speleothem record of climate change in Saudi Arabia
INTRODUCTION
In September of 1997, the Geological Institute of the University of Bern, Switzerland, began a project for the development of paleoclimate records for central and northern Arabia. One of the sources of data used for this project was the spectral analysis of isotopic records and annual growth layer thickness of stalagmites from caves in Oman and Yemen. The goal was to produce high-quality paleoclimatic reconstructions for the region on a variety of timescales in order to better understand the Indian Ocean monsoon, which is a major weather system, affecting one of the most densely populated areas of the planet.
On July 4, 2001, representatives of the Saudi Geological Survey (SGS) and the University of Bern met in Switzerland to discuss the possibility of including speleothems from Saudi Arabia in the study project. The result was the collection, in 2001 and 2002, of stalagmites from five limestone caves in Saudi Arabia and their subsequent analysis at the University of Bern.
This report discusses the rationale and methodology for this speleothem-based study, documents the collecting of stalagmites in Saudi Arabia, and presents the results of analyses carried out in Switzerland.
RESEARCH GOAL
The research goal of this project was to use speleothems, such as stalagmites, stalactites, and flowstones, as a paleoclimate archive. The data obtained by U/Th dating and stable-isotope analysis should have permitted the reconstruction of climate variations in Saudi Arabia that took place during the last 400,000 years. Previous work performed on speleothems from Oman and Yemen revealed that speleothems provide detailed information on climate variations on annual to millennial time scales (Burns and others, 1998; 2001; 2002; 2003; Fleitmann and others, 2002; 2003a; 2003b; 2004; Neff and others, 2001). Encouraged by their successful work in Oman and Yemen, the chief author and second author extended their work to Saudi Arabia. The two main research goals of their proposal submitted to the SGS in September 2001 were as follows:
• To develop a record of the overall climate history of the region over the course of the past several glacial/interglacial cycles, back to approximately 400,000 years BP.
• To generate a much higher resolution climate record for the Holocene and modern. On longer timescales, Saudi Arabia is ideally located to monitor important aspects of the Indian monsoon, particularly variations in the mean summer location of the Intertropical Convergence Zone (ITCZ). In combination with data obtained from speleothems from Oman and Yemen, it was hoped that data from Saudi speleothems would have provided important information on the dynamics of the ITCZ. In addition, this may have shed light on the interaction between the Mediterranean climate system and the Indian Ocean monsoon climate system on various time scales.
METEOROLOGICAL CONDITIONS
GENERAL CIRCULATION PATTERNS
The atmospheric circulation over the Arabian Peninsula is significantly governed by the seasonal migration of the Intertropical Convergence Zone (ITCZ) and the reversing monsoon winds (fig. 1a, b). During the winter months the ITCZ and the associated precipitation belt are located south of the equator (fig. 1b). At this time the atmospheric pressure gradient between a high-pressure cell over the Eurasian continent and the low-pressure ITCZ over the Southern Indian Ocean results in moderate northeast winds (Northeast Monsoon). In spring, when the northern tropical and subtropical landmasses begin to warm up, the ITCZ moves northward, the pressure gradient reverses and south-

4 D. Fleitmann and others, 2004
westerly winds (Indian monsoon) blow over the Indian Ocean. In July to August, the ITCZ finally reaches its northernmost position and the Indian Ocean monsoon reaches its maximum intensity (fig. 1a). By September the ITCZ begins to migrate southward and the strength of the Indian monsoon diminishes.
VARIABILITY OF THE INDIAN OCEAN MONSOON
The strength of the Indian Ocean monsoon is determined by a number of forcing mechanisms, which operate over a variety of time scales, ranging from intra-seasonal to millennial. Climatic forcing can be divided into (1) external forcing, affecting the earth’s climate through solar or orbital changes, and (2) internal forcing, which is the response of the earth’s climate system to external forcing. Table 1 gives a brief summary of the possible mechanisms causing monsoon variability.
CLIMATE IN SAUDI ARABIA
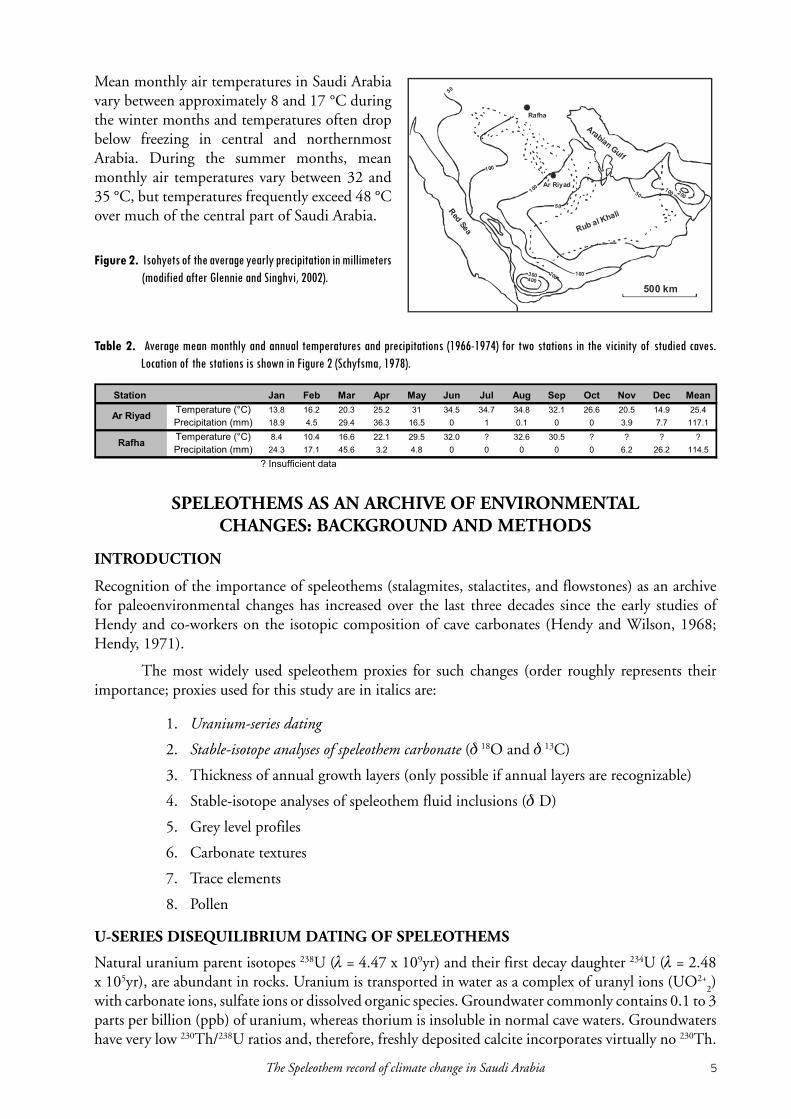
The present climate of Saudi Arabia is classified as “arid” (Schyfsma, 1978), except for the Asir province of Saudi Arabia. Rainfall is sparse with an average annual rainfall of approximately 100 mm or less (fig. 2), and more than half of the total area of Saudi Arabia is desert. Significant spring rainfall occurs in the central and southern regions, whereas significant amounts of rainfall occur in the northern, western, and eastern regions during winter. Summer rainfall is restricted to the Asir province, where total annual precipitation, predominantly occurring during the summer months, averages 500 mm.
�
�
�
�
�
����
����
� �
�
Figure 1. Schematic drawing of atmospheric circulation pattern during northern Hemisphere summer (a, left figure) and winter (b, right figure). Dashed line marks the position of the Intertropical Convergence Zone (ITCZ).
Table 1. Temporal scales of monsoon variability and possible causal factors (modified after Nicholson, 2000)
Scale Intra-seasonal Inter-annual Decadal and Century
Millennia and longer
Features Active and break monsoon phases; 30-50 day oscillations
Droughts and floods Changes in the frequency of droughts and floods
Changes in the areal extents of monsoons
Factors Atmospheric variability; tropical mid-latitudeinteractions; soil moisture; sea surface temperature
Atmospheric interactions; El Niño; Southern Oscillation; top layers of tropical oceans (SSTs); snow cover; land surface characteristics
Monsoon circulation variations; deep-ocean involvement; green-house gas increase; human activities; biosphere changes; volcanic dust
Global climate excursions; ice ages; warm epochs; sun-earth geometry
5The Speleothem record of climate change in Saudi Arabia
Mean monthly air temperatures in Saudi Arabia vary between approximately 8 and 17 °C during the winter months and temperatures often drop below freezing in central and northernmost Arabia. During the summer months, mean monthly air temperatures vary between 32 and 35 °C, but temperatures frequently exceed 48 °C over much of the central part of Saudi Arabia.
SPELEOTHEMS AS AN ARCHIVE OF ENVIRONMENTALCHANGES: BACKGROUND AND METHODS
INTRODUCTION
Recognition of the importance of speleothems (stalagmites, stalactites, and flowstones) as an archive for paleoenvironmental changes has increased over the last three decades since the early studies of Hendy and co-workers on the isotopic composition of cave carbonates (Hendy and Wilson, 1968; Hendy, 1971).
The most widely used speleothem proxies for such changes (order roughly represents their importance; proxies used for this study are in italics are:
1. Uranium-series dating
2. Stable-isotope analyses of speleothem carbonate (δ 18O and δ 13C)
3. Thickness of annual growth layers (only possible if annual layers are recognizable)
4. Stable-isotope analyses of speleothem fluid inclusions (δ D)
5. Grey level profiles
6. Carbonate textures
7. Trace elements
8. Pollen
U-SERIES DISEQUILIBRIUM DATING OF SPELEOTHEMS
Natural uranium parent isotopes 238U (λ = 4.47 x 10⁹yr) and their first decay daughter 234U (λ = 2.48 x 10⁵yr), are abundant in rocks. Uranium is transported in water as a complex of uranyl ions (UO2+
2)
with carbonate ions, sulfate ions or dissolved organic species. Groundwater commonly contains 0.1 to 3 parts per billion (ppb) of uranium, whereas thorium is insoluble in normal cave waters. Groundwaters have very low 230Th/238U ratios and, therefore, freshly deposited calcite incorporates virtually no 230Th.
Figure 2. Isohyets of the average yearly precipitation in millimeters (modified after Glennie and Singhvi, 2002).
��
�
�
��
�
�
��
�����
�������
�������
���������
���
����� ��
�����
�
�!�!�"�� #�� $�� %�� �&� %� #�� #�� ��' ��& ()! *"+ ,�) %���
������������� ���� ���� ���� ���� �� ���� ���� ���� ���� ���� ���� ���� ����
��������������� ���� ��� ���� ���� ���� � � ��� � � ��� ��� �����
������������� ��� ���� ���� ���� ���� ���� � ���� ���� � � � �
��������������� ���� ���� ���� ��� ��� � � � � � ��� ���� �����
��� �!!������"���
����� ��
�����
�
Table 2. Average mean monthly and annual temperatures and precipitations (1966-1974) for two stations in the vicinity of studied caves. Location of the stations is shown in Figure 2 (Schyfsma, 1978).
6 D. Fleitmann and others, 2004
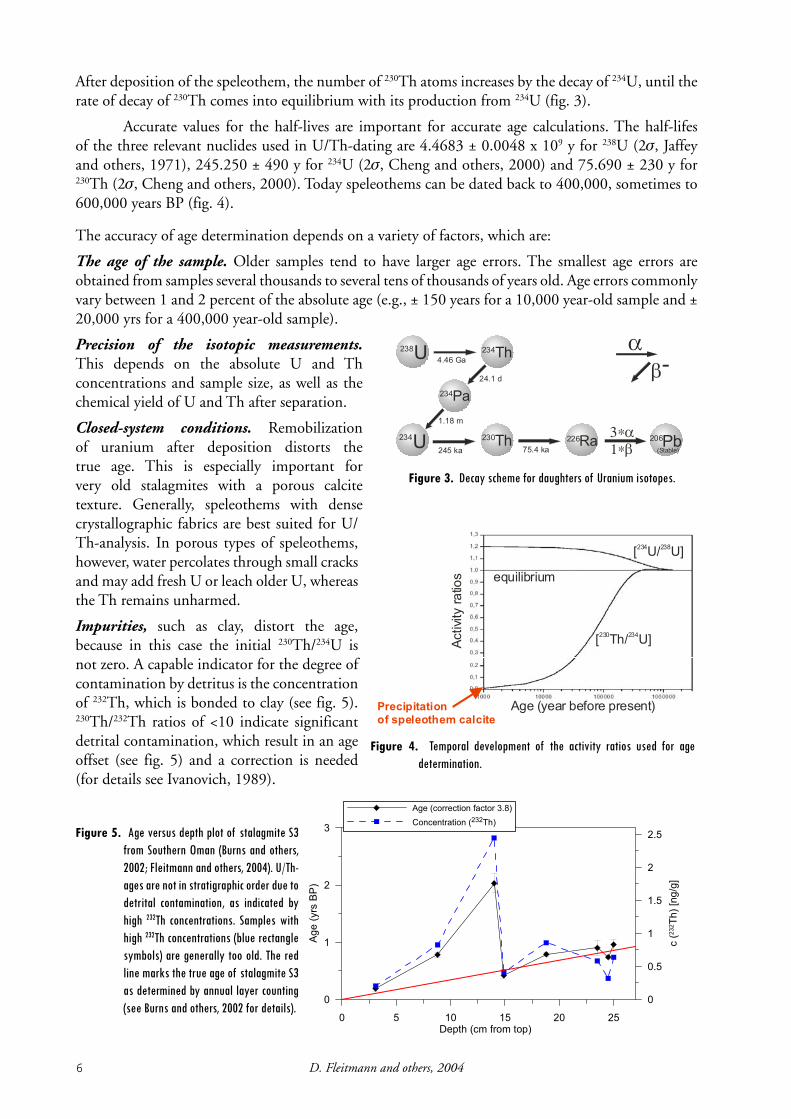
After deposition of the speleothem, the number of 230Th atoms increases by the decay of 234U, until the rate of decay of 230Th comes into equilibrium with its production from 234U (fig. 3).
Accurate values for the half-lives are important for accurate age calculations. The half-lifes of the three relevant nuclides used in U/Th-dating are 4.4683 ± 0.0048 x 10⁹ y for 238U (2σ, Jaffey and others, 1971), 245.250 ± 490 y for 234U (2σ, Cheng and others, 2000) and 75.690 ± 230 y for 230Th (2σ, Cheng and others, 2000). Today speleothems can be dated back to 400,000, sometimes to 600,000 years BP (fig. 4).
The accuracy of age determination depends on a variety of factors, which are:
The age of the sample. Older samples tend to have larger age errors. The smallest age errors are obtained from samples several thousands to several tens of thousands of years old. Age errors commonly vary between 1 and 2 percent of the absolute age (e.g., ± 150 years for a 10,000 year-old sample and ± 20,000 yrs for a 400,000 year-old sample).
Precision of the isotopic measurements. This depends on the absolute U and Th concentrations and sample size, as well as the chemical yield of U and Th after separation.
Closed-system conditions. Remobilization of uranium after deposition distorts the true age. This is especially important for very old stalagmites with a porous calcite texture. Generally, speleothems with dense crystallographic fabrics are best suited for U/Th-analysis. In porous types of speleothems, however, water percolates through small cracks and may add fresh U or leach older U, whereas the Th remains unharmed.
Impurities, such as clay, distort the age, because in this case the initial 230Th/234U is not zero. A capable indicator for the degree of contamination by detritus is the concentration of 232Th, which is bonded to clay (see fig. 5). 230Th/232Th ratios of <10 indicate significant detrital contamination, which result in an age offset (see fig. 5) and a correction is needed (for details see Ivanovich, 1989).
Figure 3. Decay scheme for daughters of Uranium isotopes.
#
��
$� �%�&
�&
#
���
���
���
���
��� ��� ���
'��%(�
����)�
����"
�����
���*� ����*�
������
�
�+
Figure 5. Age versus depth plot of stalagmite S3 from Southern Oman (Burns and others, 2002; Fleitmann and others, 2004). U/Th-ages are not in stratigraphic order due to detrital contamination, as indicated by high 232Th concentrations. Samples with high 232Th concentrations (blue rectangle symbols) are generally too old. The red line marks the true age of stalagmite S3 as determined by annual layer counting (see Burns and others, 2002 for details).
� � �� �� �� ��,���&��!��� ���
�
�
�
�
-.�/� 0�
�
���
�
���
�
���
�
����& 1�.2.3
-.�����������!��������
�����������������&
�
�4��(�%����
1 #2 #3��� ���
1 �&2 #3��� ���
-.�/���%�!������ ���
-���5��/�����
-��)�&�!�!�"��"��.&���"!�� �)��)�!�
Figure 4. Temporal development of the activity ratios used for age determination.

7The Speleothem record of climate change in Saudi Arabia
STABLE ISOTOPES
INTRODUCTION
The most commonly used stable isotopes are H, C, N, O, and S, because these elements occur in abundance in our environment. Three elements, hydrogen, carbon, and oxygen, are prominent in the dissolution and deposition of carbonate. The isotopes of these elements have the same number of protons and electrons, but a different number of neutrons in their nuclei, and occur in two or more isotopic configurations (Table 3).
The isotopic configuration does not affect the chemical behavior of these elements, but will cause distinct isotopic fractionation between different physical phases, such as during evaporation and condensation. Heavier isotopes tend to be more abundant in the denser phases, such as in the liquid rather than in the gas. The partitioning is controlled by the temperature of the system (equilibrium fractionation) or by kinetic mechanisms such as evaporation or condensation (kinetic fractionation). Fractionation between two physical phases (e.g., water-vapor) or in chemical transformations (e.g., CO
2 + H
2O H
2CO
3) is expressed by the fractionation factor α, which is the ratio of the isotope ratios
for the reactant and the product:
Isotope concentrations describe the ratio of rare, heavy isotopes per thousand relative to the light isotope in a molecule (e.g. 18O/16O). By convention, isotope concentrations are denoted with “delta” (δ) and “permil” (‰), which describes the deviation in parts per thousand from international standards.
The common standard used to describe oxygen and hydrogen isotope ratios of water are VSMOW (Vienna Standard Mean Ocean Water) and VPDB (Vienna Pee Dee Belemnite) for oxygen and carbon isotope ratios of carbonates.
STABLE ISOTOPIC COMPOSITION OF PRECIPITATION
The hydrogen (δ2H) and oxygen (δ18O) isotopic composition of precipitation is controlled by a variety of parameters. The most important ones among these are the vapor source, the meteorological history, and the climatic conditions (mainly temperature and air humidity). δ18O and δ2H in meteoric waters vary systematically on a global scale and, therefore, a Global Meteoric Water Line (GMWL; δ2H = 8 x δ18O + 10) roughly defines the relationship between δ18O and δ2H in meteoric waters around the world (Craig, 1961). However, it is important to note that the GMWL represents an average of many local or regional meteoric water lines, which may differ from the GMWL due to varying climatic and geographic parameters.
Table 3. Natural abundance of stable isotopes carbon, oxygen, and hydrogen.
����"�� ���6�����
���6����
(/ '�� ��76������
��76������
��76�8����
� ��"'�� �99 6�������
�9, 6������
�."!"&�)��������)��012
�
� � ��������������� �� ���� � ��� ����
��������
���� ��
���� ���������� �
� �� ���� ��
����
� �� ���� ��
���
�����
���� ���������� �������
�������
�������������� ����
��������
��� !" �#�$��� �� �%� &� &%�'���� �� �( ��
�
8 D. Fleitmann and others, 2004
Generally, a number of different meteorological effects influence the isotopic composition of precipitation. In tropical and subtropical areas, such as in Oman, Yemen, and Saudi Arabia, the isotopic composition of precipitation is predominantly influenced by at least three parameters. These are the amount and/or the source of precipitation. These parameters are described in detail in the following paragraphs.
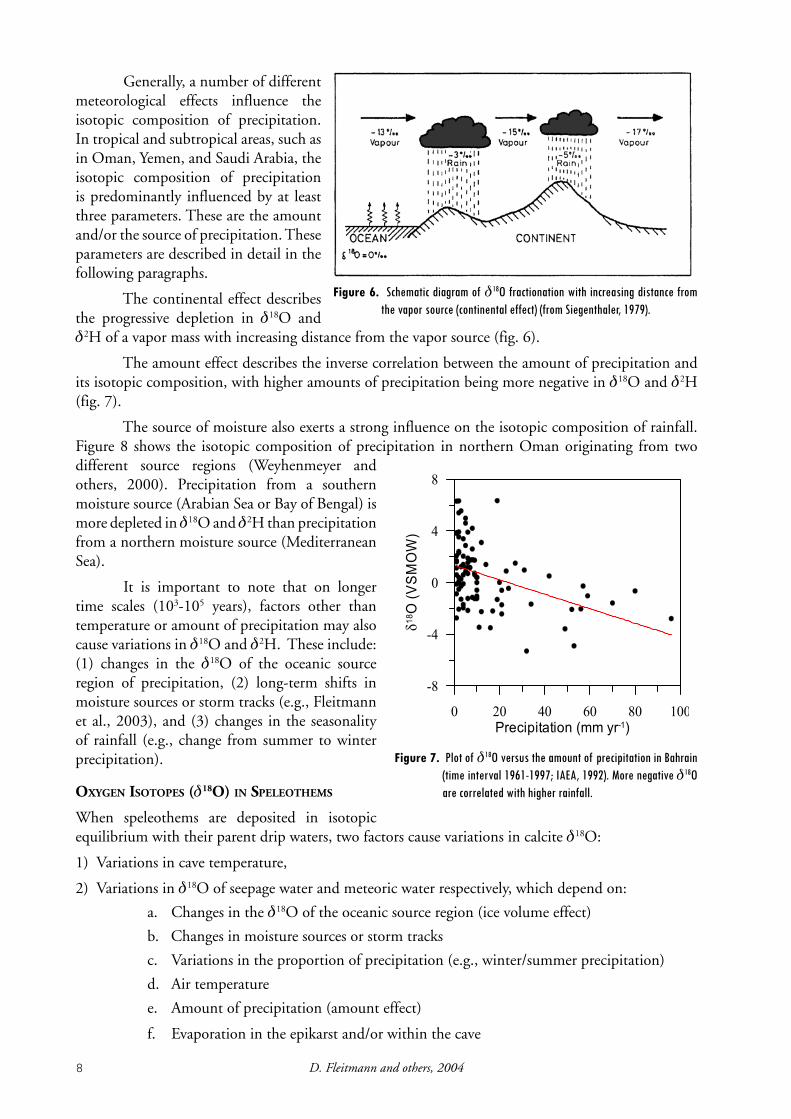
The continental effect describes the progressive depletion in δ18O and δ2H of a vapor mass with increasing distance from the vapor source (fig. 6).
The amount effect describes the inverse correlation between the amount of precipitation and its isotopic composition, with higher amounts of precipitation being more negative in δ18O and δ2H (fig. 7).
The source of moisture also exerts a strong influence on the isotopic composition of rainfall. Figure 8 shows the isotopic composition of precipitation in northern Oman originating from two different source regions (Weyhenmeyer and others, 2000). Precipitation from a southern moisture source (Arabian Sea or Bay of Bengal) is more depleted in δ18O and δ2H than precipitation from a northern moisture source (Mediterranean Sea).
It is important to note that on longer time scales (103-105 years), factors other than temperature or amount of precipitation may also cause variations in δ18O and δ2H. These include: (1) changes in the δ18O of the oceanic source region of precipitation, (2) long-term shifts in moisture sources or storm tracks (e.g., Fleitmann et al., 2003), and (3) changes in the seasonality of rainfall (e.g., change from summer to winter precipitation).
OXYGEN ISOTOPES (δ18O) IN SPELEOTHEMS
When speleothems are deposited in isotopic equilibrium with their parent drip waters, two factors cause variations in calcite δ18O:
1) Variations in cave temperature,
2) Variations in δ18O of seepage water and meteoric water respectively, which depend on:
a. Changes in the δ18O of the oceanic source region (ice volume effect)
b. Changes in moisture sources or storm tracks
c. Variations in the proportion of precipitation (e.g., winter/summer precipitation)
d. Air temperature
e. Amount of precipitation (amount effect)
f. Evaporation in the epikarst and/or within the cave
Figure 6. Schematic diagram of δ18O fractionation with increasing distance from the vapor source (continental effect) (from Siegenthaler, 1979).
Figure 7. Plot of δ18O versus the amount of precipitation in Bahrain (time interval 1961-1997; IAEA, 1992). More negative δ18O are correlated with higher rainfall.
� �� )� �� �� ������������������/�+�
��
�)
�
)
�
���7:';7<
�

9The Speleothem record of climate change in Saudi Arabia
In most caves, air temperature reflects mean annual surface temperature (Wigley and Brown, 1976). Due to the temperature dependent fractionation of 18O between calcite and water (-0.24‰ per 1°C) (O’Neil and others, 1969), either paleo-temperatures or paleo-groundwater values can be estimated (fig. 9). To do so however, two conditions must be satisfied: (1) the speleothem must have been deposited in isotopic equilibrium and (2) the δ18O of seepage water must have remained essentially constant. In almost all caves, however, the temperature-controlled (due to equilibrium fractionation) variations of δ18O are obscured by variations in δ18O of seepage water and surface precipitation (which can also be related to temperature). For example, the empirical relationship between oxygen-isotope composition of precipitation and temperature is generally –0.4 to -0.6‰ more negative per 1 degree Celsius increase in air temperature (fig. 9b). The possible effects of changing storm tracks, amount of precipitation, and evaporation on δ18O of speleothem calcite is shown in Figure 9c and d.
To summarize, changes in the δ18O of meteoric water and therefore cave seepage water influence the δ18O of speleothem calcite and, thus, obscure the temperature-controlled signal in most caves. Additionally, these other effects, such as changes in storm tracks and evaporation, provide important information about changes in climatic conditions and atmospheric circulation respectively.
Based on our previous studies performed on speleothems from Oman and Yemen–areas with very similar climates–we suggest that δ18O values of speleothem calcite mainly reflect three parameters. These are the amount of precipitation, the source of moisture, and evaporation (for details see pages 6-7; Burns and others, 1998; 2001; 2002; 2003; Fleitmann and others, 2003a; b; 2004).
+�� +� +� +� +� � � �
���7=
+��
+��
+��
+��
�
����9=
>���&������ ���� �����
'���&������ ���� �����
*3�%
4�
�3�%4�
���
���
�
Figure 8. Figure shows the isotopic composition (δ18O and δ2H) of precipitation in Northern Oman originating from a Northern (NMS) and Southern moisture source (SMS) (Weyhenmeyer et al., 2000; 2002). Solid blue and red lines show the Northern and Southern Local Meteoric Water Lines (LMWL) as defined by Weyhenmeyer et al. (2000, 2002) for Northern Oman.
?5���������6���������� ���?6�
56- � 7��
��(����
� �
������ � 7�������������@��������=������������ �
��
� � 7��
��(����
� �
�&��.��� ��������* 8�������!���������� ���8 �������A��������� �� ���
"� ����7��(����
�
�
)
� �� ��� � !������������"����.��(�����������������@+����=������������ �
�
� �� ���
����#��
�
�
� �
�
Figure 9. Simplified diagram of parameters influencing δ18O values of speleothem calcite: a increase in cave air temperature, b increase in surface air temperatures, c change in δ18O of precipitation, d evaporation.
10 D. Fleitmann and others, 2004
CARBON ISOTOPES (δ13C) IN SPELEOTHEMS
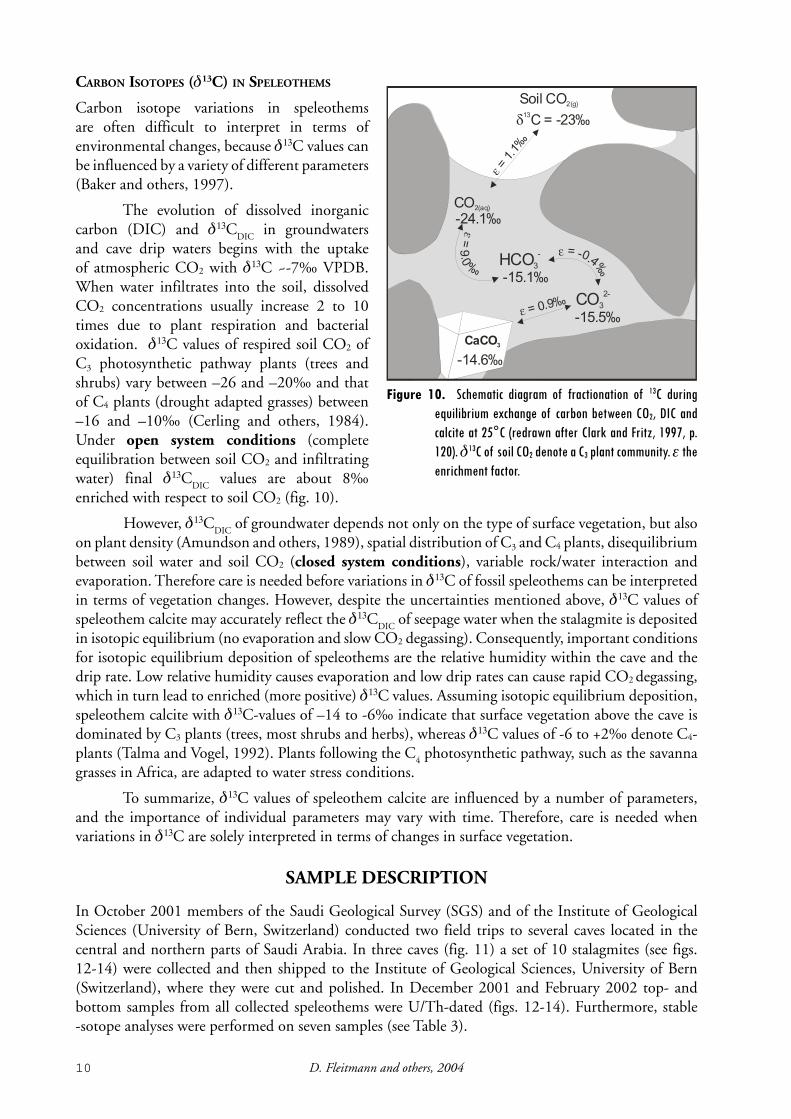
Carbon isotope variations in speleothems are often difficult to interpret in terms of environmental changes, because δ13C values can be influenced by a variety of different parameters (Baker and others, 1997).
The evolution of dissolved inorganic carbon (DIC) and δ13C
DIC in groundwaters
and cave drip waters begins with the uptake of atmospheric CO2 with δ13C ~-7‰ VPDB. When water infiltrates into the soil, dissolved CO2 concentrations usually increase 2 to 10 times due to plant respiration and bacterial oxidation. δ13C values of respired soil CO2 of C3 photosynthetic pathway plants (trees and shrubs) vary between –26 and –20‰ and that of C4 plants (drought adapted grasses) between –16 and –10‰ (Cerling and others, 1984). Under open system conditions (complete equilibration between soil CO2 and infiltrating water) final δ13C
DIC values are about 8‰
enriched with respect to soil CO2 (fig. 10).
However, δ13CDIC
of groundwater depends not only on the type of surface vegetation, but also on plant density (Amundson and others, 1989), spatial distribution of C3 and C4 plants, disequilibrium between soil water and soil CO2 (closed system conditions), variable rock/water interaction and evaporation. Therefore care is needed before variations in δ13C of fossil speleothems can be interpreted in terms of vegetation changes. However, despite the uncertainties mentioned above, δ13C values of speleothem calcite may accurately reflect the δ13C
DIC of seepage water when the stalagmite is deposited
in isotopic equilibrium (no evaporation and slow CO2 degassing). Consequently, important conditions for isotopic equilibrium deposition of speleothems are the relative humidity within the cave and the drip rate. Low relative humidity causes evaporation and low drip rates can cause rapid CO2 degassing, which in turn lead to enriched (more positive) δ13C values. Assuming isotopic equilibrium deposition, speleothem calcite with δ13C-values of –14 to -6‰ indicate that surface vegetation above the cave is dominated by C3 plants (trees, most shrubs and herbs), whereas δ13C values of -6 to +2‰ denote C4-plants (Talma and Vogel, 1992). Plants following the C
4 photosynthetic pathway, such as the savanna
grasses in Africa, are adapted to water stress conditions.
To summarize, δ13C values of speleothem calcite are influenced by a number of parameters, and the importance of individual parameters may vary with time. Therefore, care is needed when variations in δ13C are solely interpreted in terms of changes in surface vegetation.
SAMPLE DESCRIPTION
In October 2001 members of the Saudi Geological Survey (SGS) and of the Institute of Geological Sciences (University of Bern, Switzerland) conducted two field trips to several caves located in the central and northern parts of Saudi Arabia. In three caves (fig. 11) a set of 10 stalagmites (see figs. 12-14) were collected and then shipped to the Institute of Geological Sciences, University of Bern (Switzerland), where they were cut and polished. In December 2001 and February 2002 top- and bottom samples from all collected speleothems were U/Th-dated (figs. 12-14). Furthermore, stable -sotope analyses were performed on seven samples (see Table 3).
Figure 10. Schematic diagram of fractionation of 13C during equilibrium exchange of carbon between CO2, DIC and calcite at 25°C (redrawn after Clark and Fritz, 1997, p. 120). δ13C of soil CO2 denote a C3 plant community. ε the enrichment factor.
'��(�7�.
�7��4
����B+��=
B���=
B���=
B���
=B+���=
+����=
+����=
+����=
9�7�
+
�7�
�+
���(�
+����=
11The Speleothem record of climate change in Saudi Arabia
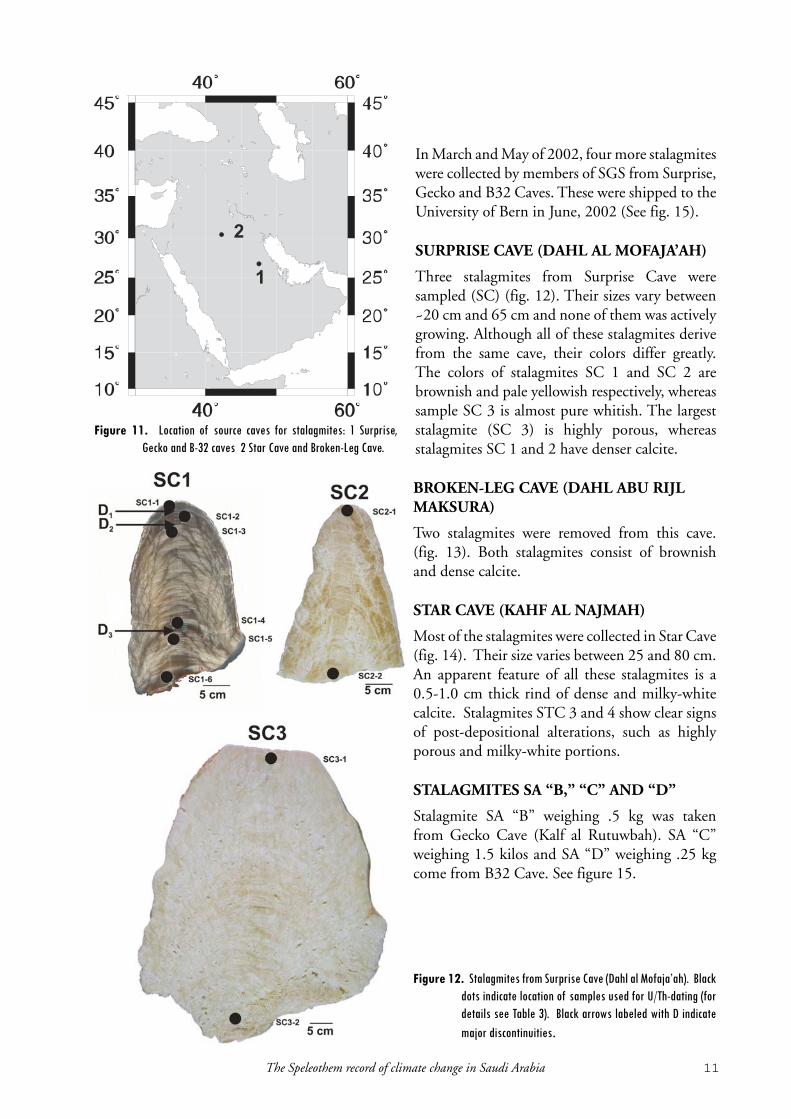
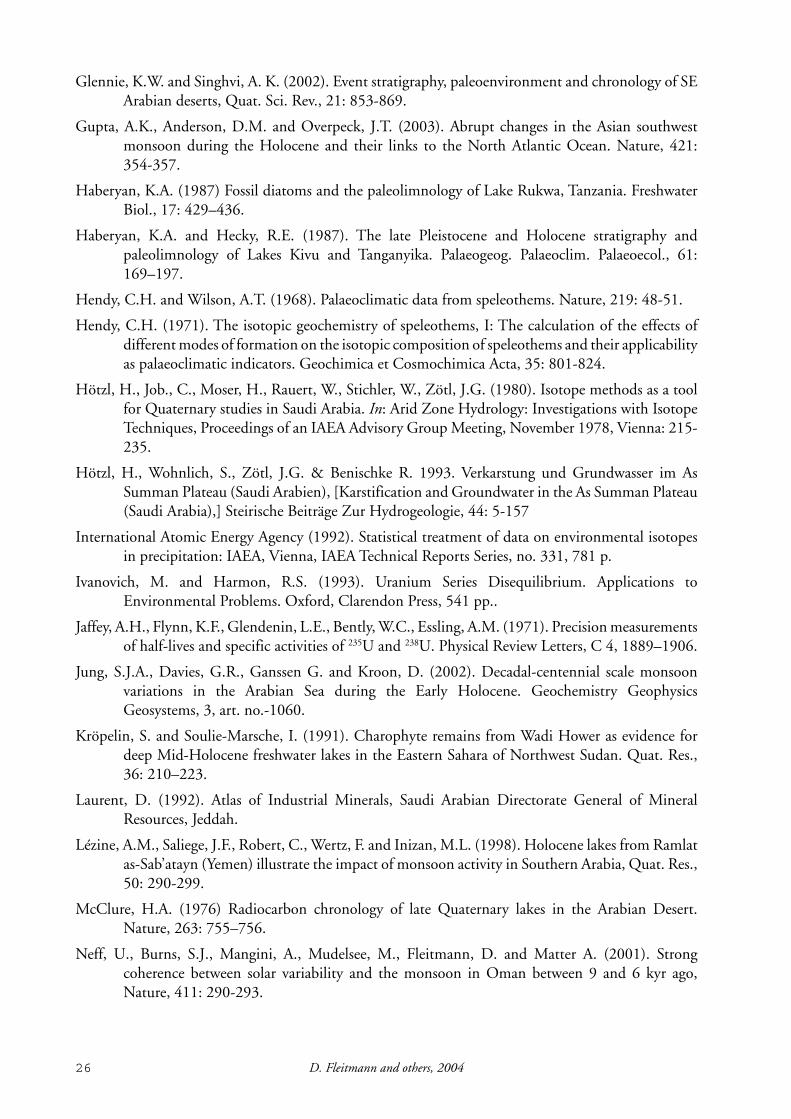
In March and May of 2002, four more stalagmites were collected by members of SGS from Surprise, Gecko and B32 Caves. These were shipped to the University of Bern in June, 2002 (See fig. 15).
SURPRISE CAVE (DAHL AL MOFAJA’AH)
Three stalagmites from Surprise Cave were sampled (SC) (fig. 12). Their sizes vary between ~20 cm and 65 cm and none of them was actively growing. Although all of these stalagmites derive from the same cave, their colors differ greatly. The colors of stalagmites SC 1 and SC 2 are brownish and pale yellowish respectively, whereas sample SC 3 is almost pure whitish. The largest stalagmite (SC 3) is highly porous, whereas stalagmites SC 1 and 2 have denser calcite.
BROKEN-LEG CAVE (DAHL ABU RIJL MAKSURA)
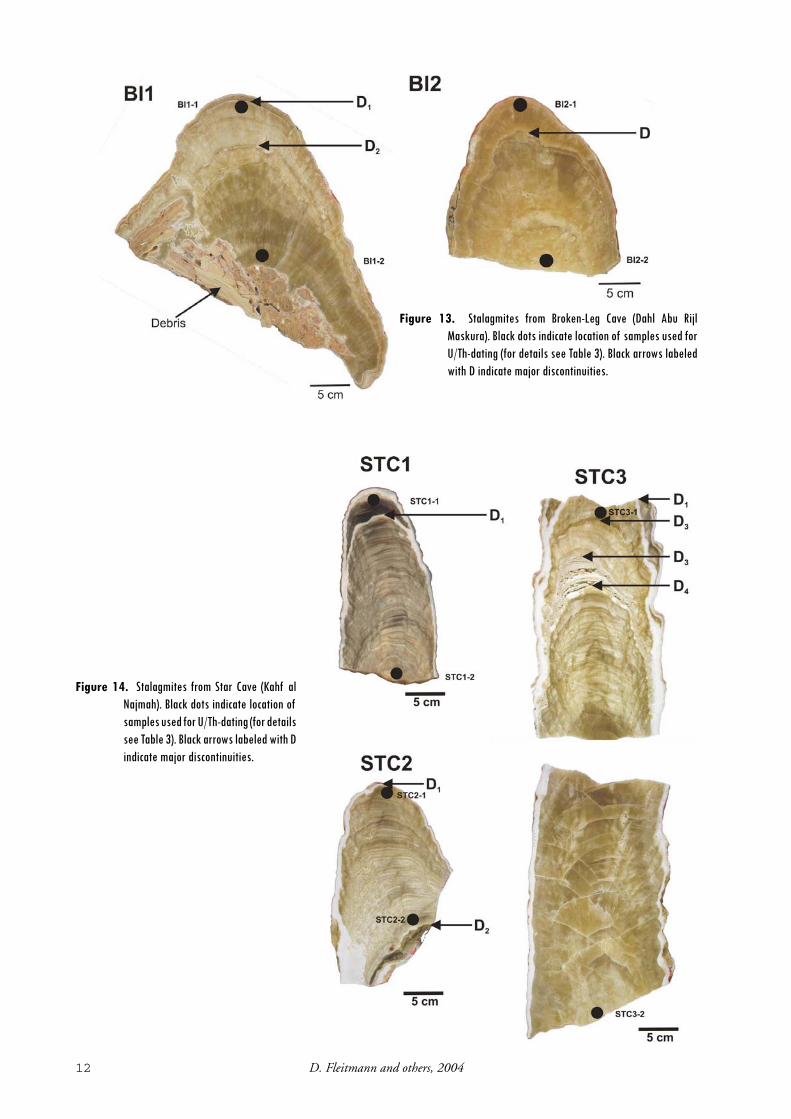
Two stalagmites were removed from this cave. (fig. 13). Both stalagmites consist of brownish and dense calcite.
STAR CAVE (KAHF AL NAJMAH)
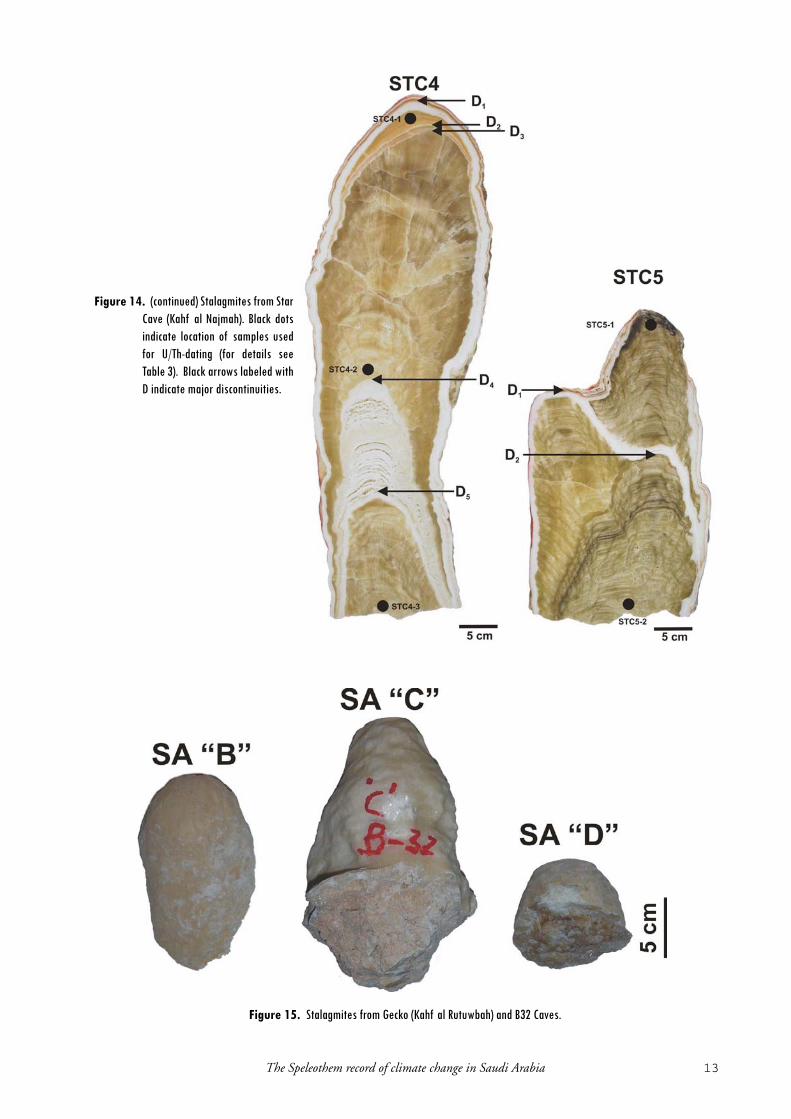
Most of the stalagmites were collected in Star Cave (fig. 14). Their size varies between 25 and 80 cm. An apparent feature of all these stalagmites is a 0.5-1.0 cm thick rind of dense and milky-white calcite. Stalagmites STC 3 and 4 show clear signs of post-depositional alterations, such as highly porous and milky-white portions.
STALAGMITES SA “B,” “C” AND “D”
Stalagmite SA “B” weighing .5 kg was taken from Gecko Cave (Kalf al Rutuwbah). SA “C” weighing 1.5 kilos and SA “D” weighing .25 kg come from B32 Cave. See figure 15.
Figure 11. Location of source caves for stalagmites: 1 Surprise, Gecko and B-32 caves 2 Star Cave and Broken-Leg Cave.
�
�
�
Figure 12. Stalagmites from Surprise Cave (Dahl al Mofaja’ah). Black dots indicate location of samples used for U/Th-dating (for details see Table 3). Black arrows labeled with D indicate major discontinuities.
12 D. Fleitmann and others, 2004
Figure 13. Stalagmites from Broken-Leg Cave (Dahl Abu Rijl Maskura). Black dots indicate location of samples used for U/Th-dating (for details see Table 3). Black arrows labeled with D indicate major discontinuities.
Figure 14. Stalagmites from Star Cave (Kahf al Najmah). Black dots indicate location of samples used for U/Th-dating (for details see Table 3). Black arrows labeled with D indicate major discontinuities.
13The Speleothem record of climate change in Saudi Arabia
Figure 14. (continued) Stalagmites from Star Cave (Kahf al Najmah). Black dots indicate location of samples used for U/Th-dating (for details see Table 3). Black arrows labeled with D indicate major discontinuities.
�
Figure 15. Stalagmites from Gecko (Kahf al Rutuwbah) and B32 Caves.
14 D. Fleitmann and others, 2004
RESULTS
U-SERIES DISEQUILIBRIUM DATING
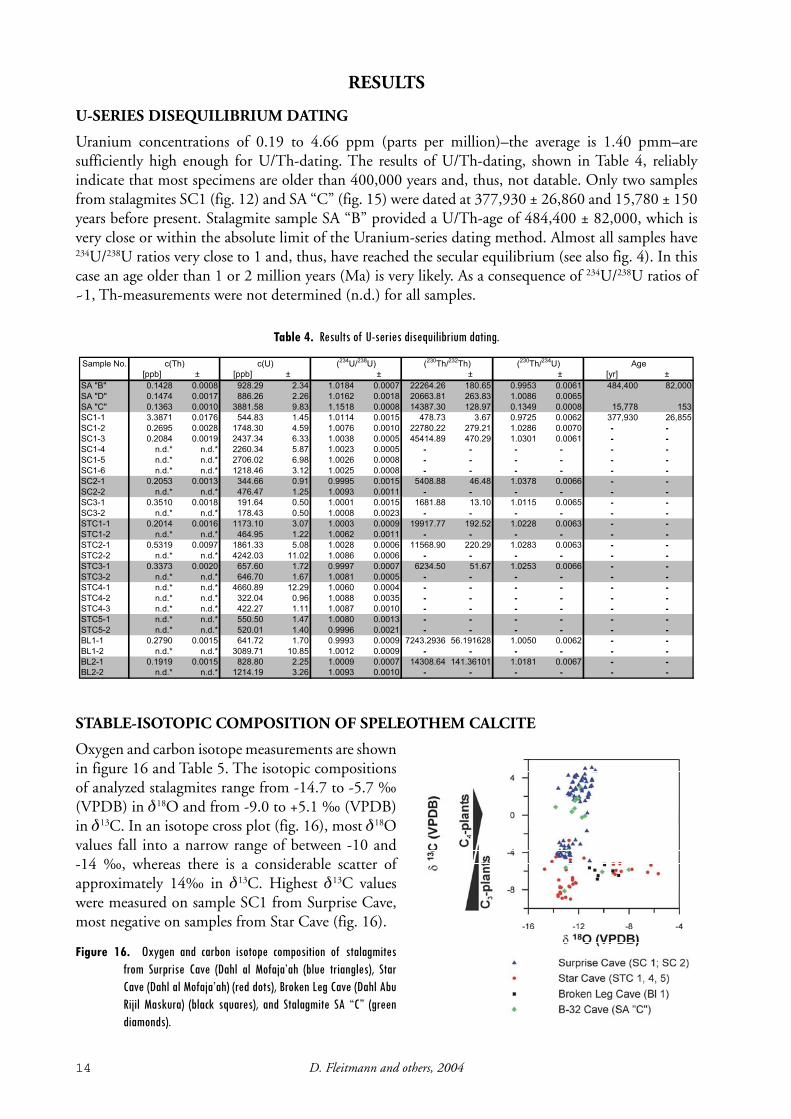
Uranium concentrations of 0.19 to 4.66 ppm (parts per million)–the average is 1.40 pmm–are sufficiently high enough for U/Th-dating. The results of U/Th-dating, shown in Table 4, reliably indicate that most specimens are older than 400,000 years and, thus, not datable. Only two samples from stalagmites SC1 (fig. 12) and SA “C” (fig. 15) were dated at 377,930 ± 26,860 and 15,780 ± 150 years before present. Stalagmite sample SA “B” provided a U/Th-age of 484,400 ± 82,000, which is very close or within the absolute limit of the Uranium-series dating method. Almost all samples have 234U/238U ratios very close to 1 and, thus, have reached the secular equilibrium (see also fig. 4). In this case an age older than 1 or 2 million years (Ma) is very likely. As a consequence of 234U/238U ratios of ~1, Th-measurements were not determined (n.d.) for all samples.
STABLE-ISOTOPIC COMPOSITION OF SPELEOTHEM CALCITE
Oxygen and carbon isotope measurements are shown in figure 16 and Table 5. The isotopic compositions of analyzed stalagmites range from -14.7 to -5.7 ‰ (VPDB) in δ18O and from -9.0 to +5.1 ‰ (VPDB) in δ13C. In an isotope cross plot (fig. 16), most δ18O values fall into a narrow range of between -10 and -14 ‰, whereas there is a considerable scatter of approximately 14‰ in δ13C. Highest δ13C values were measured on sample SC1 from Surprise Cave, most negative on samples from Star Cave (fig. 16).
Table 4. Results of U-series disequilibrium dating.�'���(�>��
1��%3 C 1��%3 C C C C 1/�3 C
'-D0D ������ ������ ������ ���� ������ ������ �������� ������ ������ ������ ���8��� ��8���
'-D,D ������ ������ ������ ���� ������ ������ �������� ������ ������ ������
'-D�D ������ ������ ������� ���� ������ ������ �������� ������ ������ ������ ��8��� ���
'��+� ������ ������ ������ ���� ������ ������ ������ ���� ������ ������ ���8��� ��8���
'��+� ������ ������ ������� ���� ������ ������ �������� ������ ������ ������ 3 3
'��+� ������ ������ ������� ���� ������ ������ �������� ������ ������ ������ 3 3
'��+� ��"�E ��"�E ������� ���� ������ ������ 3 3 3 3 3 3
'��+� ��"�E ��"�E ������� ���� ������ ������ 3 3 3 3 3 3
'��+� ��"�E ��"�E ������� ���� ������ ������ 3 3 3 3 3 3
'��+� ������ ������ ������ ���� ������ ������ ������� ����� ������ ������ 3 3
'��+� ��"�E ��"�E ������ ���� ������ ������ 3 3 3 3 3 3
'��+� ������ ������ ������ ���� ������ ������ ������� ����� ������ ������ 3 3
'��+� ��"�E ��"�E ������ ���� ������ ������ 3 3 3 3 3 3
'���+� ������ ������ ������� ���� ������ ������ �������� ������ ������ ������ 3 3
'���+� ��"�E ��"�E ������ ���� ������ ������ 3 3 3 3 3 3
'���+� ������ ������ ������� ���� ������ ������ �������� ������ ������ ������ 3 3
'���+� ��"�E ��"�E ������� ����� ������ ������ 3 3 3 3 3 3
'���+� ������ ������ ������ ���� ������ ������ ������� ����� ������ ������ 3 3
'���+� ��"�E ��"�E ������ ���� ������ ������ 3 3 3 3 3 3
'���+� ��"�E ��"�E ������� ����� ������ ������ 3 3 3 3 3 3
'���+� ��"�E ��"�E ������ ���� ������ ������ 3 3 3 3 3 3
'���+� ��"�E ��"�E ������ ���� ������ ������ 3 3 3 3 3 3
'���+� ��"�E ��"�E ������ ���� ������ ������ 3 3 3 3 3 3
'���+� ��"�E ��"�E ������ ���� ������ ������ 3 3 3 3 3 3
0F�+� ������ ������ ������ ���� ������ ������ ��������� ��������� ������ ������ 3 3
0F�+� ��"�E ��"�E ������� ����� ������ ������ 3 3 3 3 3 3
0F�+� ������ ������ ������ ���� ������ ������ �������� ��������� ������ ������ 3 3
0F�+� ��"�E ��"�E ������� ���� ������ ������ 3 3 3 3 3 3
-.����
�&2���
# ��& �# ���
#2���
# ���
�&2���
�&
�
Figure 16. Oxygen and carbon isotope composition of stalagmites from Surprise Cave (Dahl al Mofaja’ah (blue triangles), Star Cave (Dahl al Mofaja’ah) (red dots), Broken Leg Cave (Dahl Abu Rijil Maskura) (black squares), and Stalagmite SA “C” (green diamonds).

15The Speleothem record of climate change in Saudi Arabia
The fidelity of calcite δ18O values as a proxy for paleoprecipitation– δ18O depends heavily on the assumption that the latter has remained unaltered. However, evaporation in the epikarst and/or inside the cave can significantly alter the original δ18O values of precipitation and groundwater respectively. Whether stalagmites from Saudi Arabia were deposited in isotopic equilibrium with their parent drip waters and whether the δ18O drip water values accurately reflected the oxygen-isotope composition of precipitation is elusive. Hendy (1971) proposed a set of criteria to distinguish between equilibrium and kinetic isotope fractionation within a stalagmite. One criterion for kinetic fractionation is a strong correlation between δ18O and δ13C values. A statistically significant correlation between both proxies suggests that the stalagmite was not deposited in isotopic equilibrium and, therefore, δ18O values do not accurately reflect δ18O values of cave drip water and precipitation respectively. Furthermore, kinetic fractionation due to rapid CO2 degassing and/or evaporation also strongly affects δ13C values and, in this case, δ13C values might not provide valuable information on surface vegetation and/or soil productivity.
The weak correlation between δ18O and δ13C for three stalagmites (figs. 17a-c), with correlation coefficients (r2) varying between 0.03 and 0.18, suggest that they were likely deposited in isotopic equilibrium with their parent drip waters. δ18O and δ13C values are therefore useable proxies for precipitation and vegetation respectively.
DISCUSSION
As previously shown in section 5.1, collected stalagmites were, with only one exception (SA “C”), at or far beyond the limit of the U/Th-dating method (~400,000 years) and currently no methods exist to precisely date stalagmites older than 400,000 years. As paleoclimate studies generally rely on age control, the results obtained from the studied stalagmites provide only very limited paleoclimate information. However, results of stable-isotope analysis may provide some paleoclimate information, which we will discuss in the following sections.
OXYGEN-ISOTOPE COMPOSITION OF MODERN RAINFALL AND MODERN GROUNDWATERS
The knowledge of the modern oxygen-isotopic composition of precipitation is essential before δ18O values of fossil speleothems can be used as a climate proxy. However, to date there is a lack of long-term isotope databases for precipitation in Saudi Arabia. The longest available continuous isotope record, covering the last 40 years, derives from Bahrain (26.27 °N; 50.62 °E; 2 meters above sea level; IAEA, 1992). This oxygen-isotope record, shown in figure 18, indicates that δ18O values of precipitation scatter between -10 and 6.3 ‰ (VSMOW), averaging 0.36 ‰. Extrapolated δ18O rainfall data for
Figure 17. δ18O versus δ13C plot for three fossil stalagmites; a) SC 1 (fig. 12), b) SC 2 (fig. 12), and c) STC 1 (fig. 14). The lack of correlation between δ18O and δ13C suggest that the stalagmites were deposited in isotopic equilibrium.
��) ��( ��� ��� ���
�������*+',�
�
�
�
(
)
-
�
����&
��+'
,�
�
��) ��( ��� ���
����� �*+',�
��
�-
�)
�(
��
��
����&
��+'
,�
�
��) ��(�- ��( ����- ���
����� �*+',�
�.�-
�.
���-
��
�/�-
�/
���-
����&
��+'
,�
)
���7�8��0��7��2 ���7�89�0��7��2 ���7�8�:�0��7��2
�

16 D. Fleitmann and others, 2004
the Arabian Peninsula (fig. 19) suggest that 18O values of modern precipitation generally vary between -6 and 3 ‰ (VSMOW). Although available data are rather scarce, most δ18O values of precipitation in Saudi Arabia tend to range from –2 to 2 ‰ (VSMOW).
Table 5. Results of stable-isotope measurements.
���� �
��7 �
��� �
��7 �
��� �
��7 �
��� �
��7 �
��� �
��7
���� +����� +���� +����� +���� +����� +���� +���� +���� +�����
���� +����� +���� +����� +���� +����� +���� +���� +���� +�����
���� +����� +���� +����� +���� +����� +���� +���� ���� +�����
���� +����� +���� +����� +���� +����� +���� +����� ���� +�����
���� +����� +���� +����� +���� +����� +���� +����� ���� +�����
���� +����� +���� +����� +���� +����� +���� +����� ���� +�����
���� +����� +���� +����� +���� +����� +���� +�����
���� +����� +���� +����� +���� +�����
���� +����� +���� +����� +���� +�����
���� +����� +���� +����� +���� +�����
���� +����� +���� +����� +���� +�����
���� +����� +���� +����� +���� +�����
���� +����� +���� +����� +���� +����� ��%-�5
���� +����� +���� +����� +���� +�����
���� +����� +���� +����� +���� +�����
���� +����� +���� +����� ���� ���� +��������� +����� +���� +����� ���� +���� +�����
���� +����� +���� +����� ���� �
��7 ����� +���� +�����
���� +����� +���� +����� ����� +���� +�����
���� +����� +���� +����� +���� +����� ���� +���� +����
���� +����� +���� +����� +���� +����� ;���� +���� +��������� +����� +���� +����� +���� +����� ���<�< ���� +�����
���� +����� +���� +����� +���� +�����
���� +����� +���� +����� +���� +�����
���� +����� +���� +����� +���� +�����
���� +����� +���� +����� +���� +�����
���� +����� +���� +����� +���� +�����
���� +����� +���� +����� +���� +�����
���� +����� +���� +����� +���� +�����
���� +����� +���� +����� +���� +�����
���� +�����
���� +�����
���� +����� ���� �
��7
���� +�����
���� +����� +���� +����
���� +����� +���� +����
���� +����� +���� +����
���� +����� +���� +����
���� +����� +���� +����
���� +����� +���� +����
���� +����� +���� +����
���� +����� +���� +����
���� +����� +���� +����
���� +����� +���� +����
���� +�����
���� +�����
���� +�����
���� +�����
���� +�����
���� +�����
���� +�����
���� +�����
���� +�����
����
���<�<
�����
���� ���� ����� ;����
���� ����
��7
�=5���5
�
Figure 18. Long-term (1961-1997) δ18O record of precipitation in Bahrain (IAEA, 1992; updated via: http://isohis.iaea.org). Dashed red lines show standard deviation from the long-term average.
�.�� �.�- �./� �./- �.�� �.�- �..� �..- ����G���
���
��
�)
�
)
�
���7:';7<
-5���.�B����=
�
17The Speleothem record of climate change in Saudi Arabia
OXYGEN-ISOTOPE COMPOSITION OF FOSSIL STALAGMITES
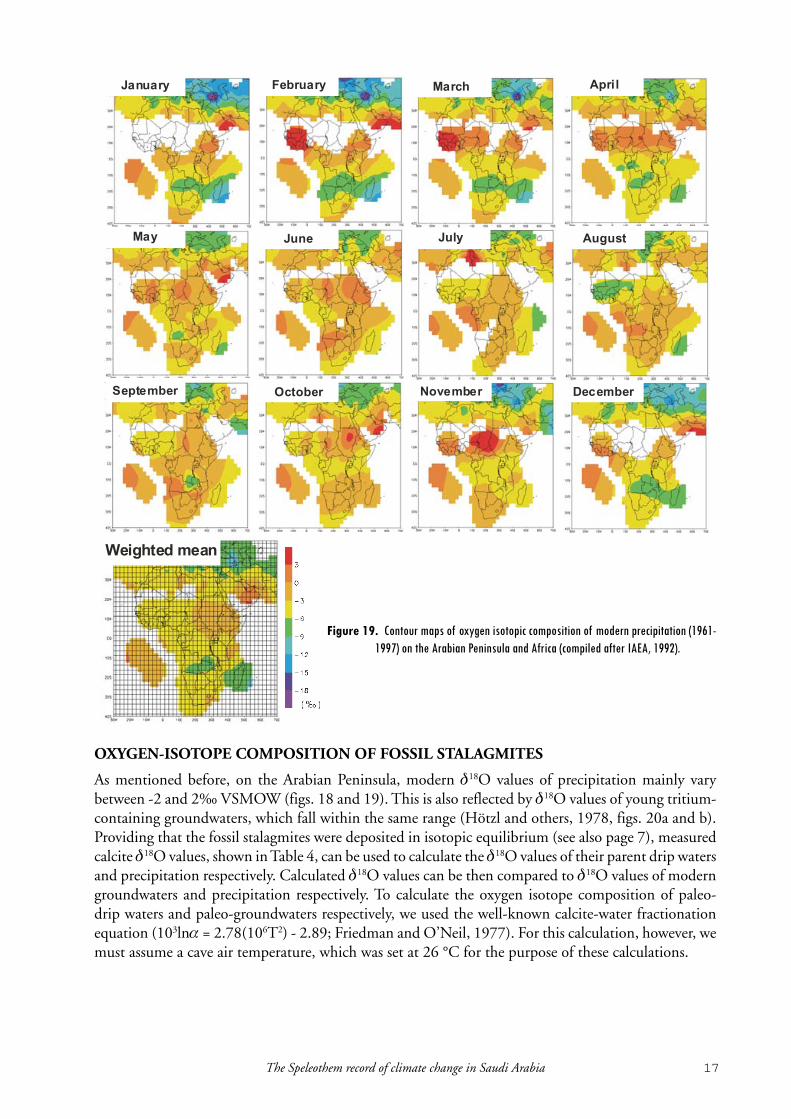
As mentioned before, on the Arabian Peninsula, modern δ18O values of precipitation mainly vary between -2 and 2‰ VSMOW (figs. 18 and 19). This is also reflected by δ18O values of young tritium-containing groundwaters, which fall within the same range (Hötzl and others, 1978, figs. 20a and b). Providing that the fossil stalagmites were deposited in isotopic equilibrium (see also page 7), measured calcite δ18O values, shown in Table 4, can be used to calculate the δ18O values of their parent drip waters and precipitation respectively. Calculated δ18O values can be then compared to δ18O values of modern groundwaters and precipitation respectively. To calculate the oxygen isotope composition of paleo-drip waters and paleo-groundwaters respectively, we used the well-known calcite-water fractionation equation (103lnα = 2.78(106T2) - 2.89; Friedman and O’Neil, 1977). For this calculation, however, we must assume a cave air temperature, which was set at 26 °C for the purpose of these calculations.
4��'�!��� ���
#����� $������ %��)� �&���
%� #��� #�� ��'�.!
,�)� ���*"+� ���()!"�����&!� ���
�
Figure 19. Contour maps of oxygen isotopic composition of modern precipitation (1961-1997) on the Arabian Peninsula and Africa (compiled after IAEA, 1992).
18 D. Fleitmann and others, 2004
For a measured calcite δ18O value of -14‰ (VPDB) we determine the corresponding drip water δ18O value in the following way:
1. Estimated cave air temperature at time of speleothem formation: T = 26 °C
2. Convert measured calcite δ18O value of -14‰ VPDB to VSMOW:
δ18OVSMOW = 1.03091 δ18OVPDB + 30.91 = 16.48‰
3. By using the following formula we can calculate δ18O of drip water
δ18OWATER = EXP(0.001(103ln(δ18OCALCITE + 1000)-2.78*106 (T)-2 – (-2.89)))-1000
insert: T = 26 °C or 299 K; δ18OCALCITE = 16.48‰ (VSMOW)
δ18OWATER = EXP(0.001(103ln(16.48 + 1000)-2.78*106 (299)-2 – (-2.89)))-1000
δ18OWATER = -11.80‰ (VSMOW)
4. The δ18O value of the parent drip water was -11.80‰ (VSMOW).
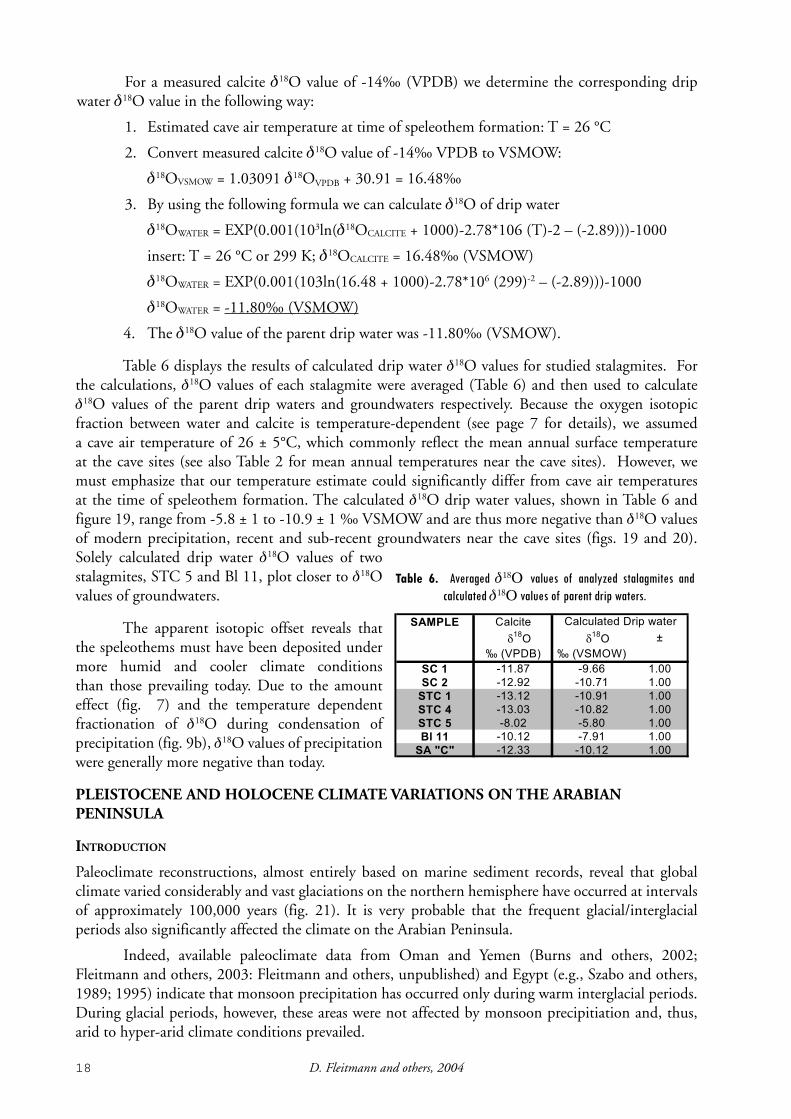
Table 6 displays the results of calculated drip water δ18O values for studied stalagmites. For the calculations, δ18O values of each stalagmite were averaged (Table 6) and then used to calculate δ18O values of the parent drip waters and groundwaters respectively. Because the oxygen isotopic fraction between water and calcite is temperature-dependent (see page 7 for details), we assumed a cave air temperature of 26 ± 5°C, which commonly reflect the mean annual surface temperature at the cave sites (see also Table 2 for mean annual temperatures near the cave sites). However, we must emphasize that our temperature estimate could significantly differ from cave air temperatures at the time of speleothem formation. The calculated δ18O drip water values, shown in Table 6 and figure 19, range from -5.8 ± 1 to -10.9 ± 1 ‰ VSMOW and are thus more negative than δ18O values of modern precipitation, recent and sub-recent groundwaters near the cave sites (figs. 19 and 20). Solely calculated drip water δ18O values of two stalagmites, STC 5 and Bl 11, plot closer to δ18O values of groundwaters.
The apparent isotopic offset reveals that the speleothems must have been deposited under more humid and cooler climate conditions than those prevailing today. Due to the amount effect (fig. 7) and the temperature dependent fractionation of δ18O during condensation of precipitation (fig. 9b), δ18O values of precipitation were generally more negative than today.
PLEISTOCENE AND HOLOCENE CLIMATE VARIATIONS ON THE ARABIAN PENINSULA
INTRODUCTION
Paleoclimate reconstructions, almost entirely based on marine sediment records, reveal that global climate varied considerably and vast glaciations on the northern hemisphere have occurred at intervals of approximately 100,000 years (fig. 21). It is very probable that the frequent glacial/interglacial periods also significantly affected the climate on the Arabian Peninsula.
Indeed, available paleoclimate data from Oman and Yemen (Burns and others, 2002; Fleitmann and others, 2003: Fleitmann and others, unpublished) and Egypt (e.g., Szabo and others, 1989; 1995) indicate that monsoon precipitation has occurred only during warm interglacial periods. During glacial periods, however, these areas were not affected by monsoon precipitiation and, thus, arid to hyper-arid climate conditions prevailed.
��%-�5 ��(����
������7 ����
��7 C
=:�,0 =:';7<
���� +����� +���� ����
���� +����� +����� ����
����� +����� +����� ����
����� +����� +����� ����
���� +���� +���� ����
;���� +����� +���� ����
���<�< +����� +����� ����
��(��(���",���A����
�
Table 6. Averaged δ18Ο values of analyzed stalagmites and calculated δ18Ο values of parent drip waters.
19The Speleothem record of climate change in Saudi Arabia
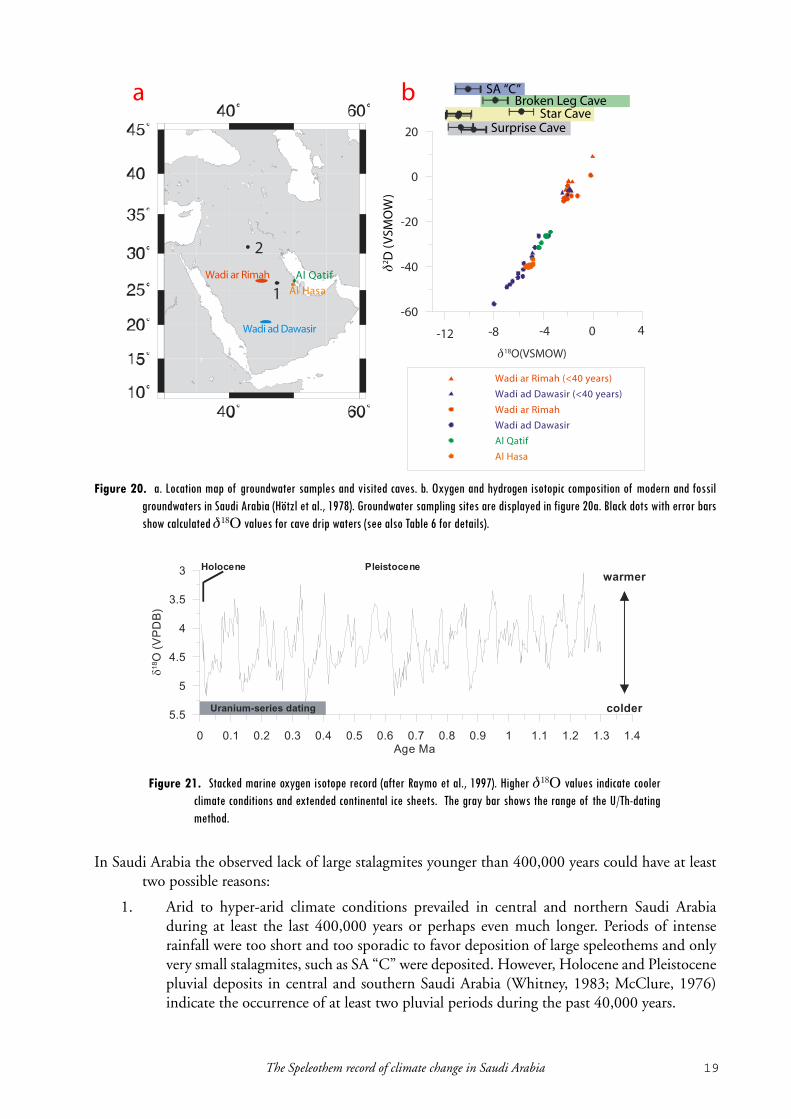
In Saudi Arabia the observed lack of large stalagmites younger than 400,000 years could have at least two possible reasons:
1. Arid to hyper-arid climate conditions prevailed in central and northern Saudi Arabia during at least the last 400,000 years or perhaps even much longer. Periods of intense rainfall were too short and too sporadic to favor deposition of large speleothems and only very small stalagmites, such as SA “C” were deposited. However, Holocene and Pleistocene pluvial deposits in central and southern Saudi Arabia (Whitney, 1983; McClure, 1976) indicate the occurrence of at least two pluvial periods during the past 40,000 years.
Figure 20. a. Location map of groundwater samples and visited caves. b. Oxygen and hydrogen isotopic composition of modern and fossil groundwaters in Saudi Arabia (Hötzl et al., 1978). Groundwater sampling sites are displayed in figure 20a. Black dots with error bars show calculated δ18Ο values for cave drip waters (see also Table 6 for details).
Uranium-series dating
0 0.1 0.2 0.3 0.4 0.5 0.6 0.7 0.8 0.9 1 1.1 1.2 1.3 1.4Age Ma
5.5
5
4.5
4
3.5
3
18O
(VP
DB
)
warmer
colder
Holocene Pleistocene
Figure 21. Stacked marine oxygen isotope record (after Raymo et al., 1997). Higher δ18Ο values indicate cooler climate conditions and extended continental ice sheets. The gray bar shows the range of the U/Th-dating method.
20 D. Fleitmann and others, 2004
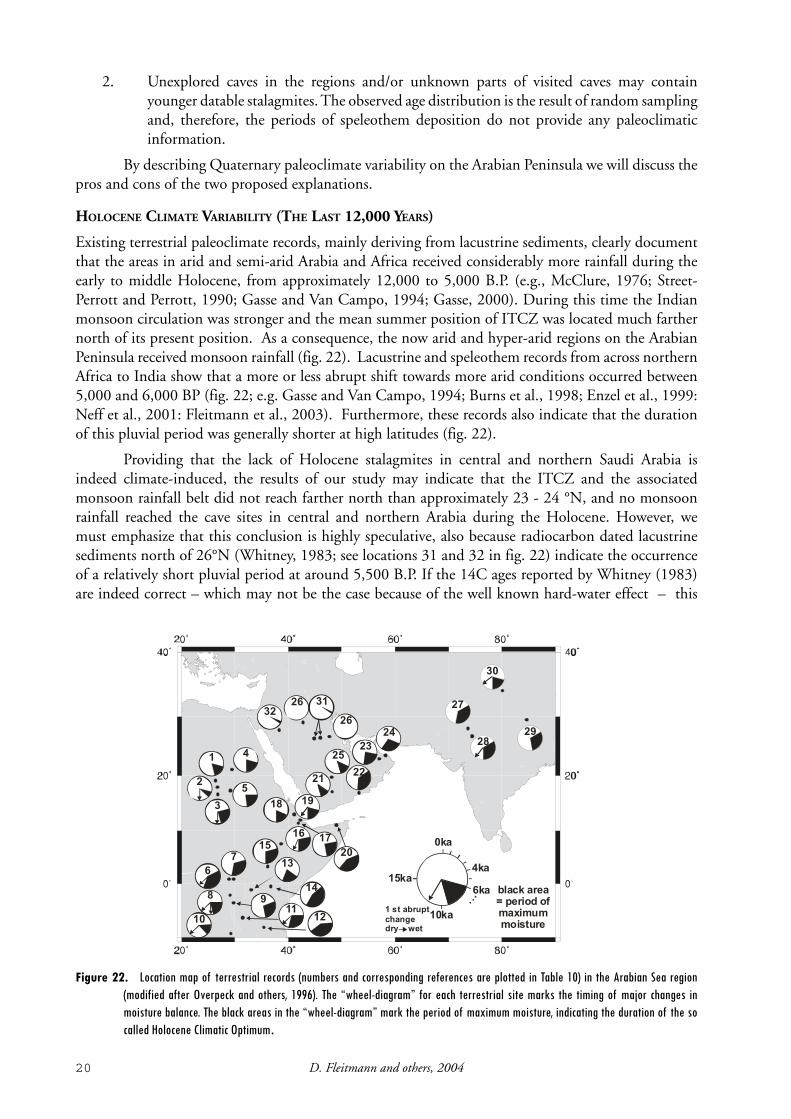
2. Unexplored caves in the regions and/or unknown parts of visited caves may contain younger datable stalagmites. The observed age distribution is the result of random sampling and, therefore, the periods of speleothem deposition do not provide any paleoclimatic information.
By describing Quaternary paleoclimate variability on the Arabian Peninsula we will discuss the pros and cons of the two proposed explanations.
HOLOCENE CLIMATE VARIABILITY (THE LAST 12,000 YEARS)
Existing terrestrial paleoclimate records, mainly deriving from lacustrine sediments, clearly document that the areas in arid and semi-arid Arabia and Africa received considerably more rainfall during the early to middle Holocene, from approximately 12,000 to 5,000 B.P. (e.g., McClure, 1976; Street-Perrott and Perrott, 1990; Gasse and Van Campo, 1994; Gasse, 2000). During this time the Indian monsoon circulation was stronger and the mean summer position of ITCZ was located much farther north of its present position. As a consequence, the now arid and hyper-arid regions on the Arabian Peninsula received monsoon rainfall (fig. 22). Lacustrine and speleothem records from across northern Africa to India show that a more or less abrupt shift towards more arid conditions occurred between 5,000 and 6,000 BP (fig. 22; e.g. Gasse and Van Campo, 1994; Burns et al., 1998; Enzel et al., 1999: Neff et al., 2001: Fleitmann et al., 2003). Furthermore, these records also indicate that the duration of this pluvial period was generally shorter at high latitudes (fig. 22).
Providing that the lack of Holocene stalagmites in central and northern Saudi Arabia is indeed climate-induced, the results of our study may indicate that the ITCZ and the associated monsoon rainfall belt did not reach farther north than approximately 23 - 24 °N, and no monsoon rainfall reached the cave sites in central and northern Arabia during the Holocene. However, we must emphasize that this conclusion is highly speculative, also because radiocarbon dated lacustrine sediments north of 26°N (Whitney, 1983; see locations 31 and 32 in fig. 22) indicate the occurrence of a relatively short pluvial period at around 5,500 B.P. If the 14C ages reported by Whitney (1983) are indeed correct – which may not be the case because of the well known hard-water effect – this
black area = period of maximum moisture
4ka
1 st abruptchangedry wet
6ka
10ka
15ka
0ka
29
30
28
27
2423
2017
1918
1 4
5
3
222
21
1615
14
12
13
1110
8
67
9
25
26
26 3132
Figure 22. Location map of terrestrial records (numbers and corresponding references are plotted in Table 10) in the Arabian Sea region (modified after Overpeck and others, 1996). The “wheel-diagram” for each terrestrial site marks the timing of major changes in moisture balance. The black areas in the “wheel-diagram” mark the period of maximum moisture, indicating the duration of the so called Holocene Climatic Optimum.

21The Speleothem record of climate change in Saudi Arabia
apparent inconsistency would support our interpretation that the lack of Holocene stalagmites is probably the result of random sampling. If so, it might be still possible that speleothems from other caves in central and northern Saudi Arabia may cover this period.
Table 7. References for each site shown in Figure 22.
Site number Site or core name Reference(s)
1 Oyo Ritchie et al. 1985; Ritchie 1994
2 Bir Atrun (El Atrun Oasis) Ritchie 1987; Ritchie and Haynes 1987
3 Lake Sidigh complex Pachur and Hoelzmann 1991
4 Selima Oasis Ritchie and Haynes 1987
5 Wadi Howar Pachur and Kröpelin 1987, Kröpelin and Soulie-Marshe 1991
6 Muchoya Swamp Taylor 1990
7 Ahakagyezi Swamp Taylor 1990
8 Lake Kivu Haberyan and Hecky 1987
9 Kuruyange Bonnefille et al. 1991
10 Lake Cheshi Stager 1988
11 Lake Tanganyka Gasse et al. 1991; Haberyan and Hecky 1987, Vincens 1989, 1991
12 Lake Rukwa Haberyan 1987
13 Lake Viktoria Adamson et al. 1980
14 Mt. Satima mire Street-Perrott and Perrott 1990
15 Lake Turkana Owen et al. 1982
16 Lake Ziway-Shala complex Gasse and Street 1978; Street-Perrott and Perrott 1990
17 Lake Abhé Gasse and Street 1978; Gillespie et al. 1983
18 Lake Afrera Gasse and Street 1978; Gillespie et al. 1983
19 Lake Asal Gasse and Street 1978; Gillespie et al. 1983
20 Galweda and Hayla Cave Brook et al. 1990
21 Ramlat as-Sab’atayn Lézine et al., 1998
22 Stalagmites, Southern Oman Fleitmann et al. 2001, 2003a
23 Nizwa complex Clark and Fontes 1990
24 Stalagmites, Northern Oman Neff et al. 2001; Burns et al. 1998, 2001
25 Rub`al Khali McClure 1976
26 Caves in Saudi Arabia This study
27 Lunkaransar Bryson and Swain 1981; Swain et al., 1983; Enzel et al., 1999
28 Didwana Lake Bryson and Swain 1981; Swain et al., 1983; Singh et al. 1990
29 Southern Tibet lakes Fang 1991
30 Sumix Co Gasse et al. 1991; Van Campo and Gasse 1993
31 N. as Sirr and N. Urayk Whitney, 1983
32 An Nafud Whitney, 1983
22 D. Fleitmann and others, 2004
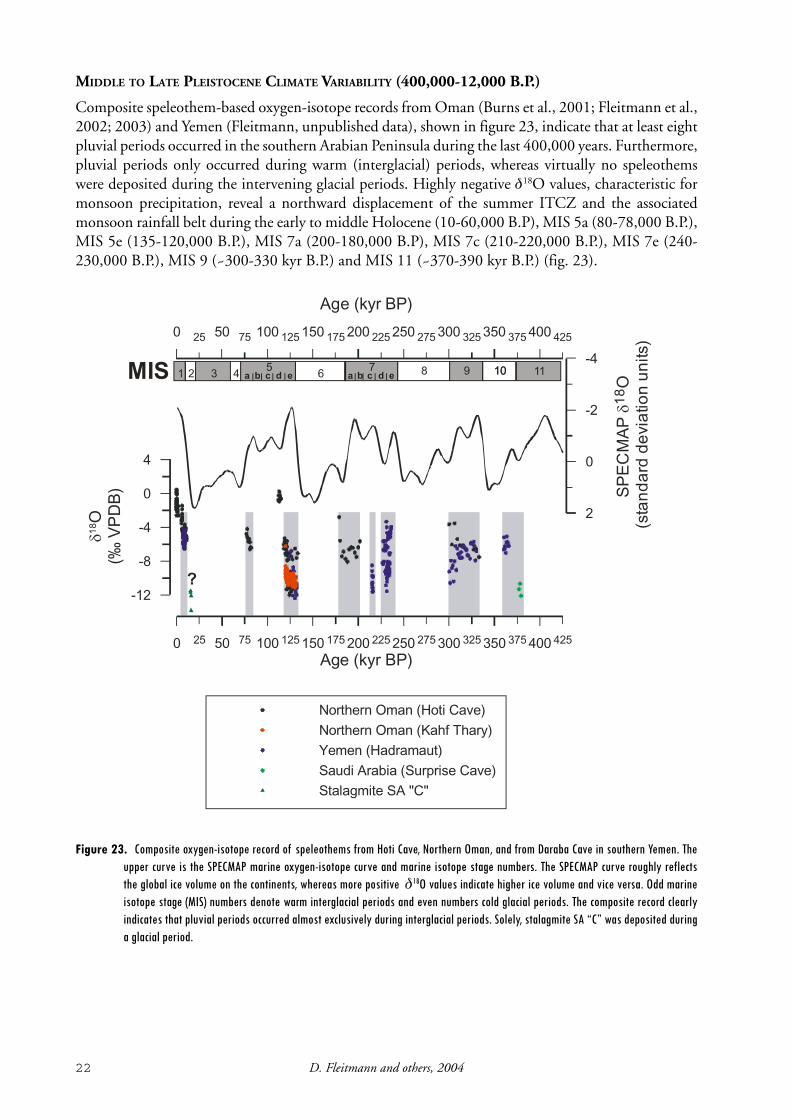
MIDDLE TO LATE PLEISTOCENE CLIMATE VARIABILITY (400,000-12,000 B.P.)
Composite speleothem-based oxygen-isotope records from Oman (Burns et al., 2001; Fleitmann et al., 2002; 2003) and Yemen (Fleitmann, unpublished data), shown in figure 23, indicate that at least eight pluvial periods occurred in the southern Arabian Peninsula during the last 400,000 years. Furthermore, pluvial periods only occurred during warm (interglacial) periods, whereas virtually no speleothems were deposited during the intervening glacial periods. Highly negative δ18O values, characteristic for monsoon precipitation, reveal a northward displacement of the summer ITCZ and the associated monsoon rainfall belt during the early to middle Holocene (10-60,000 B.P), MIS 5a (80-78,000 B.P.), MIS 5e (135-120,000 B.P.), MIS 7a (200-180,000 B.P), MIS 7c (210-220,000 B.P.), MIS 7e (240-230,000 B.P.), MIS 9 (~300-330 kyr B.P.) and MIS 11 (~370-390 kyr B.P.) (fig. 23).
Figure 23. Composite oxygen-isotope record of speleothems from Hoti Cave, Northern Oman, and from Daraba Cave in southern Yemen. The upper curve is the SPECMAP marine oxygen-isotope curve and marine isotope stage numbers. The SPECMAP curve roughly reflects the global ice volume on the continents, whereas more positive δ18O values indicate higher ice volume and vice versa. Odd marine isotope stage (MIS) numbers denote warm interglacial periods and even numbers cold glacial periods. The composite record clearly indicates that pluvial periods occurred almost exclusively during interglacial periods. Solely, stalagmite SA “C” was deposited during a glacial period.
0 50 100 150 200 250 300 350 40025 75 125 175 225 275 325 375 425
Age (kyr BP)
2
0
-2
-4
SP
EC
MA
P1
8O
(sta
ndar
dde
viat
ion
units
)0 50 100 150 200 250 300 350 40025 75 125 175 225 275 325 375 425
Age (kyr BP)
-12
-8
-4
0
4
18O
(‰V
PD
B)
Northern Oman (Hoti Cave)Northern Oman (Kahf Thary)Yemen (Hadramaut)Saudi Arabia (Surprise Cave)Stalagmite SA "C"
?
1 2 3 4 5a c a eced db b6 8 9 107 10 11MIS
23The Speleothem record of climate change in Saudi Arabia
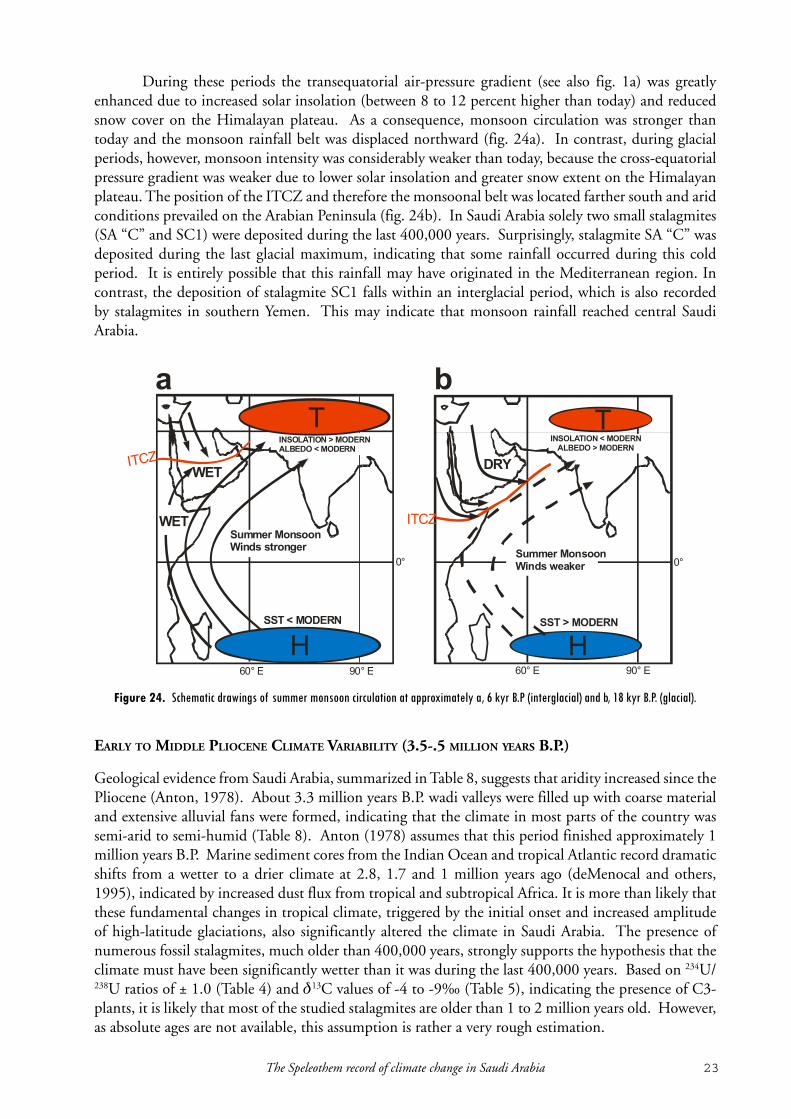
During these periods the transequatorial air-pressure gradient (see also fig. 1a) was greatly enhanced due to increased solar insolation (between 8 to 12 percent higher than today) and reduced snow cover on the Himalayan plateau. As a consequence, monsoon circulation was stronger than today and the monsoon rainfall belt was displaced northward (fig. 24a). In contrast, during glacial periods, however, monsoon intensity was considerably weaker than today, because the cross-equatorial pressure gradient was weaker due to lower solar insolation and greater snow extent on the Himalayan plateau. The position of the ITCZ and therefore the monsoonal belt was located farther south and arid conditions prevailed on the Arabian Peninsula (fig. 24b). In Saudi Arabia solely two small stalagmites (SA “C” and SC1) were deposited during the last 400,000 years. Surprisingly, stalagmite SA “C” was deposited during the last glacial maximum, indicating that some rainfall occurred during this cold period. It is entirely possible that this rainfall may have originated in the Mediterranean region. In contrast, the deposition of stalagmite SC1 falls within an interglacial period, which is also recorded by stalagmites in southern Yemen. This may indicate that monsoon rainfall reached central Saudi Arabia.
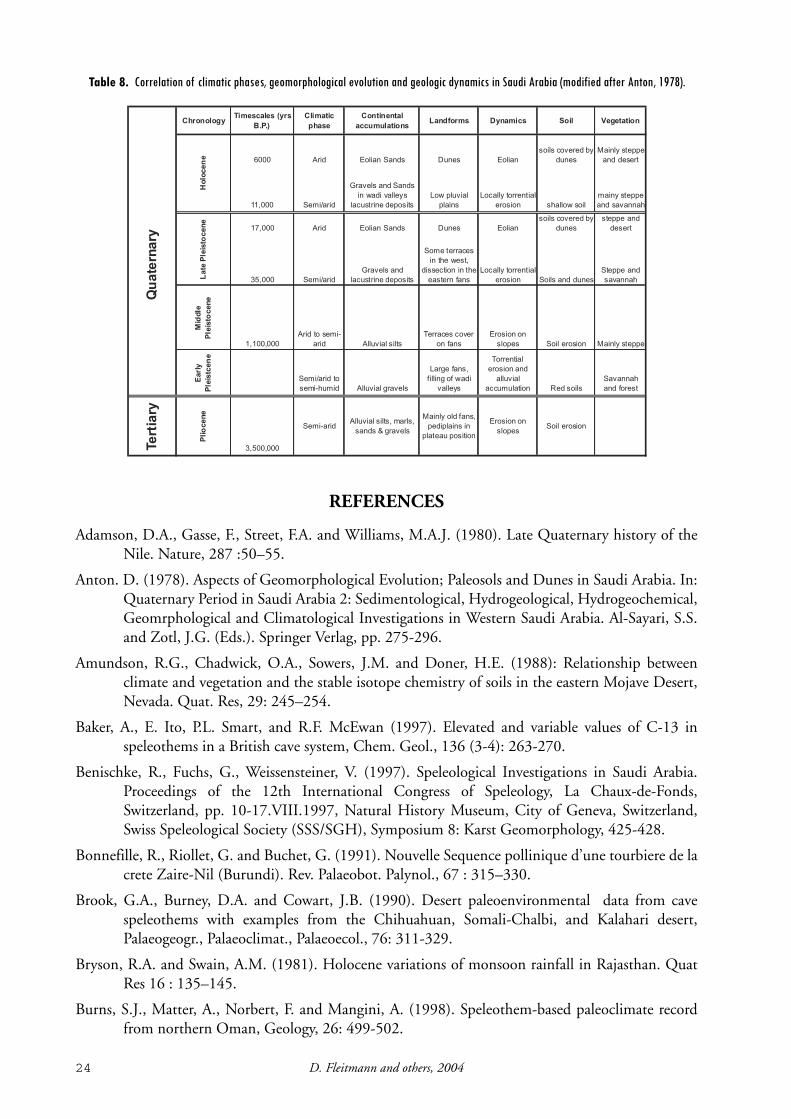
EARLY TO MIDDLE PLIOCENE CLIMATE VARIABILITY (3.5-.5 MILLION YEARS B.P.)
Geological evidence from Saudi Arabia, summarized in Table 8, suggests that aridity increased since the Pliocene (Anton, 1978). About 3.3 million years B.P. wadi valleys were filled up with coarse material and extensive alluvial fans were formed, indicating that the climate in most parts of the country was semi-arid to semi-humid (Table 8). Anton (1978) assumes that this period finished approximately 1 million years B.P. Marine sediment cores from the Indian Ocean and tropical Atlantic record dramatic shifts from a wetter to a drier climate at 2.8, 1.7 and 1 million years ago (deMenocal and others, 1995), indicated by increased dust flux from tropical and subtropical Africa. It is more than likely that these fundamental changes in tropical climate, triggered by the initial onset and increased amplitude of high-latitude glaciations, also significantly altered the climate in Saudi Arabia. The presence of numerous fossil stalagmites, much older than 400,000 years, strongly supports the hypothesis that the climate must have been significantly wetter than it was during the last 400,000 years. Based on 234U/238U ratios of ± 1.0 (Table 4) and δ13C values of -4 to -9‰ (Table 5), indicating the presence of C3-plants, it is likely that most of the studied stalagmites are older than 1 to 2 million years old. However, as absolute ages are not available, this assumption is rather a very rough estimation.
DRY
H60° E 90° E
0°
SST > MODERN
T
Summer MonsoonWinds weaker
INSOLATION < MODERNALBEDO > MODERN
ITCZ
60° E 90° E
0°
Summer MonsoonWinds stronger
SST < MODERN
T
WET
H
WET
INSOLATION > MODERNALBEDO < MODERN
ITCZ
a b
Figure 24. Schematic drawings of summer monsoon circulation at approximately a, 6 kyr B.P (interglacial) and b, 18 kyr B.P. (glacial).
24 D. Fleitmann and others, 2004
REFERENCES
Adamson, D.A., Gasse, F., Street, F.A. and Williams, M.A.J. (1980). Late Quaternary history of the Nile. Nature, 287 :50–55.
Anton. D. (1978). Aspects of Geomorphological Evolution; Paleosols and Dunes in Saudi Arabia. In: Quaternary Period in Saudi Arabia 2: Sedimentological, Hydrogeological, Hydrogeochemical, Geomrphological and Climatological Investigations in Western Saudi Arabia. Al-Sayari, S.S. and Zotl, J.G. (Eds.). Springer Verlag, pp. 275-296.
Amundson, R.G., Chadwick, O.A., Sowers, J.M. and Doner, H.E. (1988): Relationship between climate and vegetation and the stable isotope chemistry of soils in the eastern Mojave Desert, Nevada. Quat. Res, 29: 245–254.
Baker, A., E. Ito, P.L. Smart, and R.F. McEwan (1997). Elevated and variable values of C-13 in speleothems in a British cave system, Chem. Geol., 136 (3-4): 263-270.
Benischke, R., Fuchs, G., Weissensteiner, V. (1997). Speleological Investigations in Saudi Arabia. Proceedings of the 12th International Congress of Speleology, La Chaux-de-Fonds, Switzerland, pp. 10-17.VIII.1997, Natural History Museum, City of Geneva, Switzerland, Swiss Speleological Society (SSS/SGH), Symposium 8: Karst Geomorphology, 425-428.
Bonnefille, R., Riollet, G. and Buchet, G. (1991). Nouvelle Sequence pollinique d’une tourbiere de la crete Zaire-Nil (Burundi). Rev. Palaeobot. Palynol., 67 : 315–330.
Brook, G.A., Burney, D.A. and Cowart, J.B. (1990). Desert paleoenvironmental data from cave speleothems with examples from the Chihuahuan, Somali-Chalbi, and Kalahari desert, Palaeogeogr., Palaeoclimat., Palaeoecol., 76: 311-329.
Bryson, R.A. and Swain, A.M. (1981). Holocene variations of monsoon rainfall in Rajasthan. Quat Res 16 : 135–145.
Burns, S.J., Matter, A., Norbert, F. and Mangini, A. (1998). Speleothem-based paleoclimate record from northern Oman, Geology, 26: 499-502.
ChronologyTimescales (yrs
B.P.)Climatic phase
Continental accumulations
Landforms Dynamics Soil Vegetation
6000 Arid Eolian Sands Dunes Eoliansoils covered by
dunesMainly steppe
and desert
11,000 Semi/arid
Gravels and Sands in wadi valleys
lacustrine depositsLow pluvial
plains Locally torrential
erosion shallow soilmainy steppe and savannah
17,000 Arid Eolian Sands Dunes Eoliansoils covered by
dunessteppe and
desert
35,000 Semi/aridGravels and
lacustrine deposits
Some terraces in the west,
dissection in the eastern fans
Locally torrential erosion Soils and dunes
Steppe and savannah
Mid
dle
Ple
isto
cene
1,100,000Arid to semi-
arid Alluvial siltsTerraces cover
on fansErosion on
slopes Soil erosion Mainly steppe
Ear
ly
Ple
istc
ene
Semi/arid to semi-humid Alluvial gravels
Large fans, filling of wadi
valleys
Torrential erosion and
alluvial accumulation Red soils
Savannah and forest
Tert
iary
Plio
cene
3,500,000
Semi-aridAlluvial silts, marls,
sands & gravels
Mainly old fans, pediplains in
plateau position
Erosion on slopes
Soil erosion
Hol
ocen
eL
ate
Ple
isto
cene
Qu
ater
nary
Table 8. Correlation of climatic phases, geomorphological evolution and geologic dynamics in Saudi Arabia (modified after Anton, 1978).
25The Speleothem record of climate change in Saudi Arabia
Burns, S.J., Fleitmann, D., Matter, A. Neff, U. and Mangini, A. (2001). Speleothem evidence from Oman for continental pluvial events during interglacial periods, Geology, 29: 623-626.
Burns, S.J., Fleitmann, D., Mudelsee, M., Neff, U., Matter, A. and A. Mangini (2002). A 780-year annually resolved record of Indian Ocean monsoon precipitation from a speleothem from south Oman, Journal of Geophysical Research-Atmospheres, 107 (D20), art. no.-4434.
Cerling, T.E. and Quade, J. (1993). Stable carbon and oxygen isotopes in soil carbonates. In: Swart, P.P., Lohmann, K.C., McKenzie, J. and Savin, S., (Eds.), Climate change in continental isotopic records. Geophysical Monograph, 78: 217–231.
Cheng, H., Edwards, R.L., Hoff, J., Gallup, C.D., Richards, D.A. and Asmerom, Y. (2000). The half-lives of uranium-234 and thorium-230, Chem. Geol., 169: 17-33.
Clark, I.D. and Fontes, J. (1990). Paleoclimatic reconstruction in northern Oman based on carbonates from hyperalkaline groundwaters. Quat. Res., 33 :320–336
Clark, I.D. and Fritz, P.E. (Eds.) (1997). Environmental Isotopes in Hydrogeology, 1st Edition, CRC press LLC, New York, 311 pp.
Craig, H. (1961). Isotopic variations in meteoric waters. Science, 133: 1702-1703.
deMenocal, P. (1995). Plio-Pleistocene African climate, Science, 270, 53-59.
Enzel, Y., Ely, L.L., Mishra, S., Ramesh, R., Amit, R., Lazar, B., Rajaguru, S.N., Baker, V.R. and Sandler, A. (1999). High-resolution Holocene environmental changes in the Thar desert, Northwestern India, Science, 284: 125-128.
Fang, J. (1991). Lake evolution during the past 30,000 years in China, and its implications for environmental change. Quat. Res., 36: 37–60.
Fleitmann and others 2001
Fleitmann, D., Burns, S.J., Mudelsee, M., Neff, U., Kramers, J., Mangini, A. and Matter, A. (2003a). Holocene forcing of the Indian monsoon recorded in a stalagmite from Southern Oman, Science, 300, 1737-1739.
Fleitmann, D., Burns, S.J., Neff, U. Mangini, A. and Matter, A. (2003b). Changing moisture sources over the last 330,000 years in Northern Oman from fluid-inclusion evidence in speleothems, Quat. Res., 60: 223-232.
Fleitmann, D., Burns, S. J., Neff, U., Mudelsee, M., Mangini, A., Matter, A. (2004). Paleoclimatic interpretation of high-resolution oxygen isotope profiles derived from annually laminated speleothems from Southern Oman. Quat. Sci. Rev., (in press).
Friedman, I. and O’Neil, J.R. (1977). Compilation of stable isotope factors of geochemical interest. In: M. Fleischner (Ed.), Data of Geochemistry, U.S. Geological Survey Professional Paper 440-KK, 6th ed., U.S.G.S., Reston VA.
Gasse, F. and Street, F.A. (1978). Late Quaternary lake-level fluctuations and environments of the northern Rift Valley and Afar region (Ethiopia and Djibouti). Palaeogeogr. Palaeoclim. Palaeoecol., 24: 279–325.
Gasse, F., Ledee, V., Massault, M. and Fontes, J. (1989). Water-level fluctuations of Lake Tanganyika in phase with oceanic changes during the last glaciation and deglaciation. Nature, 342: 57–59.
Gasse, F., Arnold, M., Fontes, J. C., Fort, M., Gibert, E., Huc, A., Li, B. Y., Li, Y. F., Lju, Q., Melieres, F., Vancampo, E., Wang, F. B., and Zhang, Q. S. (1991). A 13,000-Year Climate Record from Western Tibet. Nature, 353: 742-745.
Gillespie, R., Street-Perrott, F.A. and Switsur, R. (1983) Post-glacial arid episodes in Ethiopia have implications for climate prediction. Nature, 306: 680–683.
26 D. Fleitmann and others, 2004
Glennie, K.W. and Singhvi, A. K. (2002). Event stratigraphy, paleoenvironment and chronology of SE Arabian deserts, Quat. Sci. Rev., 21: 853-869.
Gupta, A.K., Anderson, D.M. and Overpeck, J.T. (2003). Abrupt changes in the Asian southwest monsoon during the Holocene and their links to the North Atlantic Ocean. Nature, 421: 354-357.
Haberyan, K.A. (1987) Fossil diatoms and the paleolimnology of Lake Rukwa, Tanzania. Freshwater Biol., 17: 429–436.
Haberyan, K.A. and Hecky, R.E. (1987). The late Pleistocene and Holocene stratigraphy and paleolimnology of Lakes Kivu and Tanganyika. Palaeogeog. Palaeoclim. Palaeoecol., 61: 169–197.
Hendy, C.H. and Wilson, A.T. (1968). Palaeoclimatic data from speleothems. Nature, 219: 48-51.
Hendy, C.H. (1971). The isotopic geochemistry of speleothems, I: The calculation of the effects of different modes of formation on the isotopic composition of speleothems and their applicability as palaeoclimatic indicators. Geochimica et Cosmochimica Acta, 35: 801-824.
Hötzl, H., Job., C., Moser, H., Rauert, W., Stichler, W., Zötl, J.G. (1980). Isotope methods as a tool for Quaternary studies in Saudi Arabia. In: Arid Zone Hydrology: Investigations with Isotope Techniques, Proceedings of an IAEA Advisory Group Meeting, November 1978, Vienna: 215-235.
Hötzl, H., Wohnlich, S., Zötl, J.G. & Benischke R. 1993. Verkarstung und Grundwasser im As Summan Plateau (Saudi Arabien), [Karstification and Groundwater in the As Summan Plateau (Saudi Arabia),] Steirische Beiträge Zur Hydrogeologie, 44: 5-157
International Atomic Energy Agency (1992). Statistical treatment of data on environmental isotopes in precipitation: IAEA, Vienna, IAEA Technical Reports Series, no. 331, 781 p.
Ivanovich, M. and Harmon, R.S. (1993). Uranium Series Disequilibrium. Applications to Environmental Problems. Oxford, Clarendon Press, 541 pp..
Jaffey, A.H., Flynn, K.F., Glendenin, L.E., Bently, W.C., Essling, A.M. (1971). Precision measurements of half-lives and specific activities of 235U and 238U. Physical Review Letters, C 4, 1889–1906.
Jung, S.J.A., Davies, G.R., Ganssen G. and Kroon, D. (2002). Decadal-centennial scale monsoon variations in the Arabian Sea during the Early Holocene. Geochemistry Geophysics Geosystems, 3, art. no.-1060.
Kröpelin, S. and Soulie-Marsche, I. (1991). Charophyte remains from Wadi Hower as evidence for deep Mid-Holocene freshwater lakes in the Eastern Sahara of Northwest Sudan. Quat. Res., 36: 210–223.
Laurent, D. (1992). Atlas of Industrial Minerals, Saudi Arabian Directorate General of Mineral Resources, Jeddah.
Lézine, A.M., Saliege, J.F., Robert, C., Wertz, F. and Inizan, M.L. (1998). Holocene lakes from Ramlat as-Sab’atayn (Yemen) illustrate the impact of monsoon activity in Southern Arabia, Quat. Res., 50: 290-299.
McClure, H.A. (1976) Radiocarbon chronology of late Quaternary lakes in the Arabian Desert. Nature, 263: 755–756.
Neff, U., Burns, S.J., Mangini, A., Mudelsee, M., Fleitmann, D. and Matter A. (2001). Strong coherence between solar variability and the monsoon in Oman between 9 and 6 kyr ago, Nature, 411: 290-293.

27The Speleothem record of climate change in Saudi Arabia
Nicholson, S.E. (2000). The nature of rainfall variability over Africa on time scales of decades to millennia. Global and Planetary Change, 26: 137-158.
O’Neil, J.R., Clayton, R.N. and Mayeda, T.K. (1969): Oxygen isotope fractionation of divalent metal carbonates. J. Chem. Phys., 30: 5547–5558.
Overpeck, J., Anderson, D., Trumbore, S. and Prell, W. (1996). The southwest Indian Monsoon over the last 18,000 years, Climate Dynamics, 12: 213-325.
Owen, R.B., Barthelme, J.W., Renaut, R.W. and Vincens, A. (1982). Palaeolimnology and archaeology of Holocene deposits northeast of Lake Turkana, Kenya. Nature, 298: 523–529.
Pachur, H. and Hoelzmann, P. (1991). Paleoclimatic implications of late Quaternary lacustrine sediments in western Nubia, Sudan. Quat. Res., 36: 257–276.
Pachur, H.J. and Kröpelin, S. (1987). Wadi Howar: paleoclimatic evidence from an extinct river system in the southeastern Sahara. Science, 237: 298–300.
Pint, J. (2001) Master list of GPS coordinates for Saudi Arabia caves (updated to January 2004): Saudi Geological Survey Confidential Data File SGS-CDF-2001-1, pp. 1-16.
Pint, J.J., Al-Shanti, M.A., Al-Juaid, A.J., and Al-Amoudi, S.A., 2002. Preliminary survey for caves suitable for tourism in the Kingdom of Saudi Arabia: As Sulb plateau – Kahf al Rutuwbah and B32 cave: Saudi Geological Survey Open-File Report SGS-OF-2002-10, 28 p., 43 figs.
Raymo, M.E., Oppo D.W. and Curry W. (1997). The mid-Pleistocene climate transition: A deep sea carbon isotopic perspective. Paleoceanography, 12: 546-559.
Ritchie, J.C., Eyles, C.H. and Haynes, C.V. (1985). Sediment and pollen evidence for an early to mid-Holocene humid period in the eastern Sahara. Nature, 314: 352–355.
Ritchie, J.C. and Haynes, C.V. (1987). Holocene vegetation zonation in the eastern Sahara. Nature, 330: 645–647.
Ritchie, J.C. (1994). Holocene pollen spectra from Oyo, northwestern Sudan: problems of interpretation in a hyperarid environment. The Holocene, 4: 9–15.
Schyfsma, E. (1978a). Climate. In: Quaternary Period in Saudi Arabia 1: Sedimentological, Hydrogeological, Hydrogeochemical, Geomrphological and Climatological Investigations in Central and Eastern Saudi Arabia. Al-Sayari, S.S. and Zötl, J.G. (Eds.). Springer Verlag, pp. 31-44.
Schyfsma, E. (1978b). As Sulb Plateau, General Geology, In: Al-Sayari, S.S., and Zötl, J.G., (eds.): Quaternary Period in Saudi Arabia: 1978 Springer-Verlag, New York, p. 163.
Al-Shanti, M.A., Pint, J.J., Al-Juaid, A.J., and Al-Amoudi, S.A., 2003, Preliminary survey for caves in the Habakah region of the Kingdom of Saudi Arabia: Saudi Geological Survey Open-File Report SGS-OF-2003-3, 32 p., 43 figs.
Siegenthaler, U. (1979). Stable hydrogen and oxygen isotopes in the water cycle. In: Lectures in Isotope Geology. Jäger, E. and Hunziker, J.C. (Eds.). Springer-Verlag, Berlin, Germany, pp. 264-273.
Singh, G., Wasson, R.J. and Agrawal, D.P. (1990). Vegetational and seasonal climatic changes since the last full glacial in the Thar Desert, northwestern India. Rev. Palaeobot. Palynol., 64: 351–358.
Sirocko, R.C., Sarnthein, H., Erlenkeuser, H., Lange, H., Arnold, M. and Duplessy, J.-C. (1993). Century-scale events in monsoonal climate over the past 24,000 years, Nature, 364: 322-364.
Stager, J.C. (1988). Environmental changes at Lake Cheshi, Zambia since 40,000 Years BP. Quat. Res., 29: 54–65
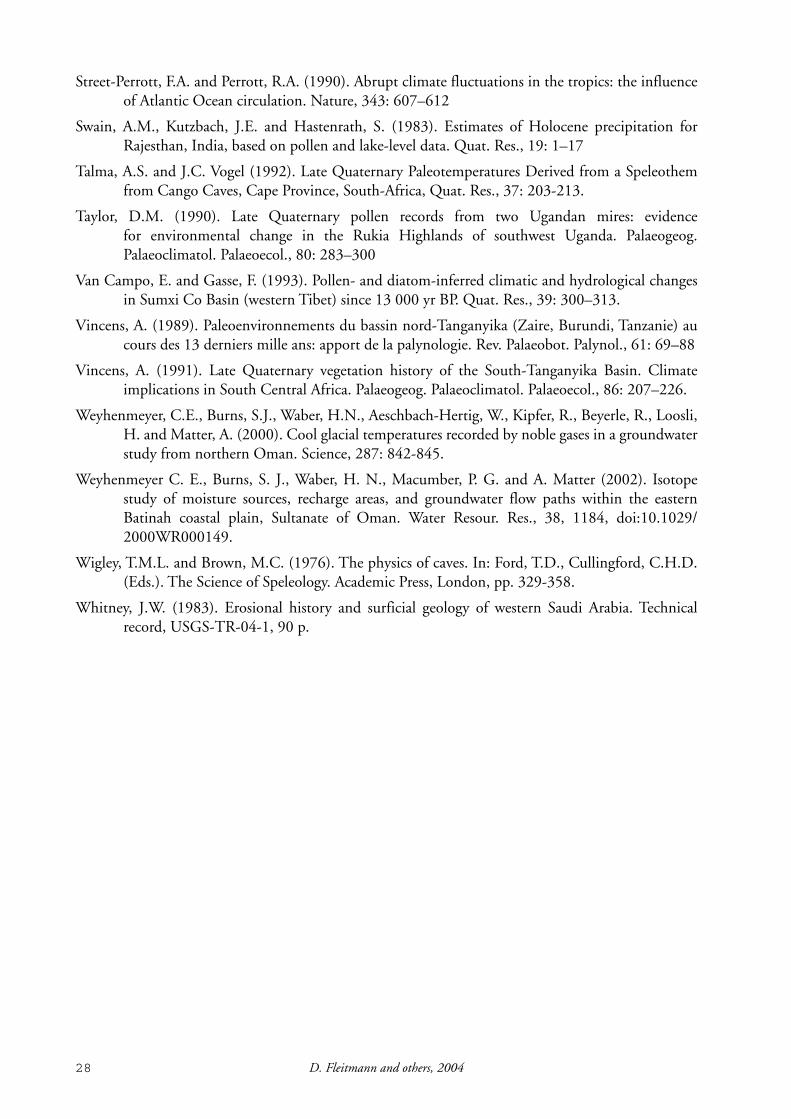
28 D. Fleitmann and others, 2004
Street-Perrott, F.A. and Perrott, R.A. (1990). Abrupt climate fluctuations in the tropics: the influence of Atlantic Ocean circulation. Nature, 343: 607–612
Swain, A.M., Kutzbach, J.E. and Hastenrath, S. (1983). Estimates of Holocene precipitation for Rajesthan, India, based on pollen and lake-level data. Quat. Res., 19: 1–17
Talma, A.S. and J.C. Vogel (1992). Late Quaternary Paleotemperatures Derived from a Speleothem from Cango Caves, Cape Province, South-Africa, Quat. Res., 37: 203-213.
Taylor, D.M. (1990). Late Quaternary pollen records from two Ugandan mires: evidence for environmental change in the Rukia Highlands of southwest Uganda. Palaeogeog. Palaeoclimatol. Palaeoecol., 80: 283–300
Van Campo, E. and Gasse, F. (1993). Pollen- and diatom-inferred climatic and hydrological changes in Sumxi Co Basin (western Tibet) since 13 000 yr BP. Quat. Res., 39: 300–313.
Vincens, A. (1989). Paleoenvironnements du bassin nord-Tanganyika (Zaire, Burundi, Tanzanie) au cours des 13 derniers mille ans: apport de la palynologie. Rev. Palaeobot. Palynol., 61: 69–88
Vincens, A. (1991). Late Quaternary vegetation history of the South-Tanganyika Basin. Climate implications in South Central Africa. Palaeogeog. Palaeoclimatol. Palaeoecol., 86: 207–226.
Weyhenmeyer, C.E., Burns, S.J., Waber, H.N., Aeschbach-Hertig, W., Kipfer, R., Beyerle, R., Loosli, H. and Matter, A. (2000). Cool glacial temperatures recorded by noble gases in a groundwater study from northern Oman. Science, 287: 842-845.
Weyhenmeyer C. E., Burns, S. J., Waber, H. N., Macumber, P. G. and A. Matter (2002). Isotope study of moisture sources, recharge areas, and groundwater flow paths within the eastern Batinah coastal plain, Sultanate of Oman. Water Resour. Res., 38, 1184, doi:10.1029/2000WR000149.
Wigley, T.M.L. and Brown, M.C. (1976). The physics of caves. In: Ford, T.D., Cullingford, C.H.D. (Eds.). The Science of Speleology. Academic Press, London, pp. 329-358.
Whitney, J.W. (1983). Erosional history and surficial geology of western Saudi Arabia. Technical record, USGS-TR-04-1, 90 p.

29The Speleothem record of climate change in Saudi Arabia
APPENDIX 1
Provenance of Speleothems Collected in Saudi Arabia

30 D. Fleitmann and others, 2004

31The Speleothem record of climate change in Saudi Arabia
SURPRISE CAVE (DAHL ALMOFAJA’AH)
Surprise Cave is situated approximately 200 km NNE of Riyadh in the As Sulb Plateau, which is part of the Summan, a bedrock plateau stretching east and west from the Dahna to the Gulf and north and south from the border of Kuwait to well inside the Rub Al Khali (fig. A1). The As Sulb region is approximately located between latitude 25°19’N to 26° 41’ N and longitude 47°15’E to 48° 30’ E. and geologically encompasses the Umm er Radhuma Formation (Paleocene-Early Eocene) and a younger, unnamed Miocene-Pliocene unit of calcareous clastic rocks (Schyfsma, 1978). The Umm-er-Radhuma formation is composed of light-colored, fine-grained and arenitic limestones as well as dolomites containing chert. Benischke and others (1997) reports that lithologic, sedimentologic and
Figure A1. Map showing major limestone outcrops of Saudi Arabia with caves used for speleothem sampling indicated.

32 D. Fleitmann and others, 2004
thin-section investigations show a strongly recrystallized texture, dolomitization and partly complete decalcification within the marl-like layers of this formation, favoring the possibilities of karstification or erosion. Surprise Cave lies partly in the Umm er Radhuma Formation and partly in the Miocene clastic sediments which consist of calcareous sandstone and marl, and limestone. Because these sediments are well cemented by calcium carbonate, they lend themselves to the development of caves.
The latitude and longitude of Surprise Cave are given in Pint, J., (2001) and a map of the cave is shown in figure A2. Two entrances to this cave have been found so far. Entrance One is a vertical shaft less than 1 m wide and 14 meters deep. Entrance Two is a horizontal opening in the wall of a gully located 75m SW of Entrance One. The opening of Entrance Two leads SW through a passage less than one meter high to two holes overlooking a floor 3 m below. Most of the cave is horizontal, covering over 650 meters of surveyed passages that vary in size from 0.5m in diameter to 6m high by 15m wide. The temperature of the cave, taken at Station S6, was measured at 25 degrees and the humidity at 80 percent. No radon gas was detected. Speleothems in this cave include calcite stalactites, stalagmites, draperies and flowstone as well as a variety of gypsum formations. A small number of stalactites are dripping and growing, but no growing stalagmites could be found.
Stalagmites SC1, SC2 and SC3 were originally located between stations S7 and S8. They were detached using hammer and chisel in October of 2001 (fig. A3) and removed from the cave via Entrance Two (figs. A4 and A5).
0 10 20
METERS
F
E
D
C
B
A
R5
R4
R3
R2
R1
S1,S2
S3
S4,S5
S6 S7 S8
S9
S10
L
S14
S13S12
S11
1
2
3
44
56
7
8
9
10
11 12
13
14
15 16
17
18
19
20
21 22
23
24
25
2627
28
29
30
7A
7B
N
0.5
6
4
0.6
2
2
?
SURPRISECAVE
SHAWIAH, SAUDI ARABIA
ENTRANCEONE
ENTRANCETWO
GYPSUMNEEDLES
FEATHERED COLUMN
LARS’ LAIR
THEDANCING
WALL
JAWS
FALLENGLORY
FALLEN SPLENDOR
THECHANDELIER
THEDRAGON’S
MOUTH
THESCORPION’S
TAIL
BUBBLEWRAP
CRYSTALROOM
?
?
?
?
?
?
?
?
?
?
?
?
?
?
?
?
Tape, Distoand Compass
Surveyby
Lars Bjurstr mSusy PintJohn Pint
Arlene FossPhil Darby
Greg GregoryMarc Lamontagne
Lise RousselMahmoud Al-Shanti
Abdulrahman Al-JuaidSaid Al-Amoudi
Ahmed Banakher
1416-1423 H.1995-2002 G.
Map by J.J. Pint and A.J. Al-Juaid
ö
?
THESLOT
Figure A2. Map of Surprise/Al Mofaja’ah Cave.
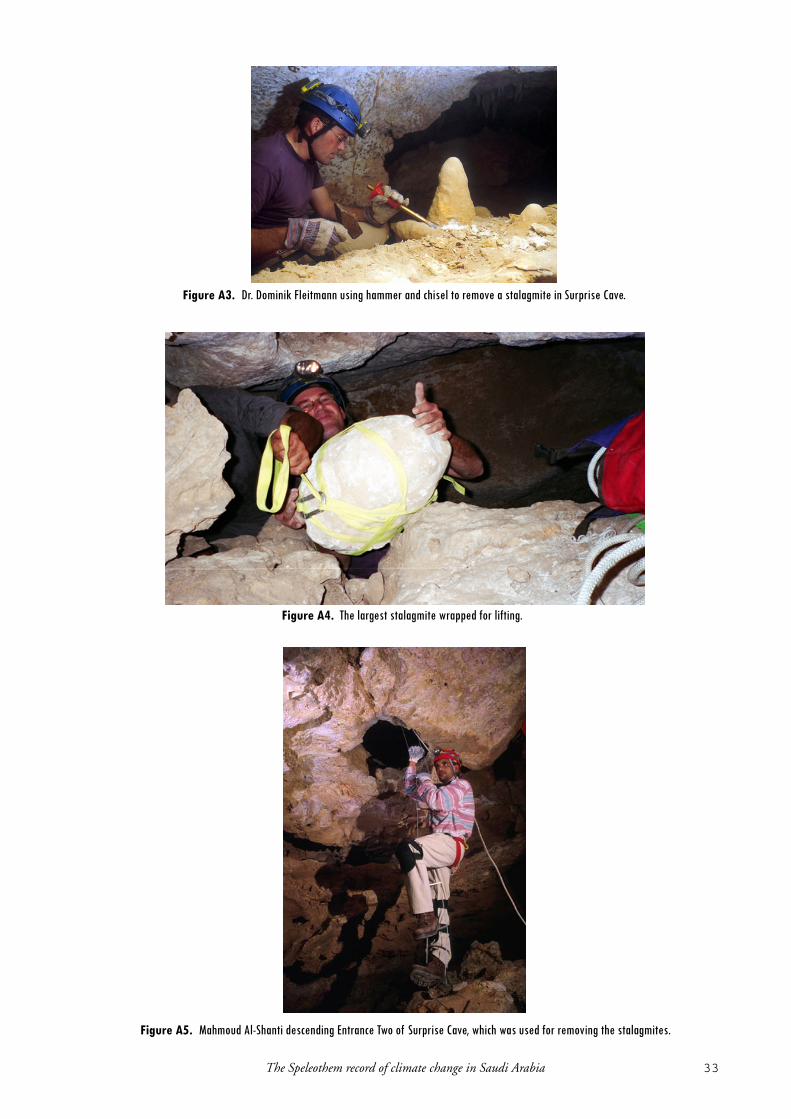
33The Speleothem record of climate change in Saudi Arabia
Figure A3. Dr. Dominik Fleitmann using hammer and chisel to remove a stalagmite in Surprise Cave.
Figure A4. The largest stalagmite wrapped for lifting.
Figure A5. Mahmoud Al-Shanti descending Entrance Two of Surprise Cave, which was used for removing the stalagmites.
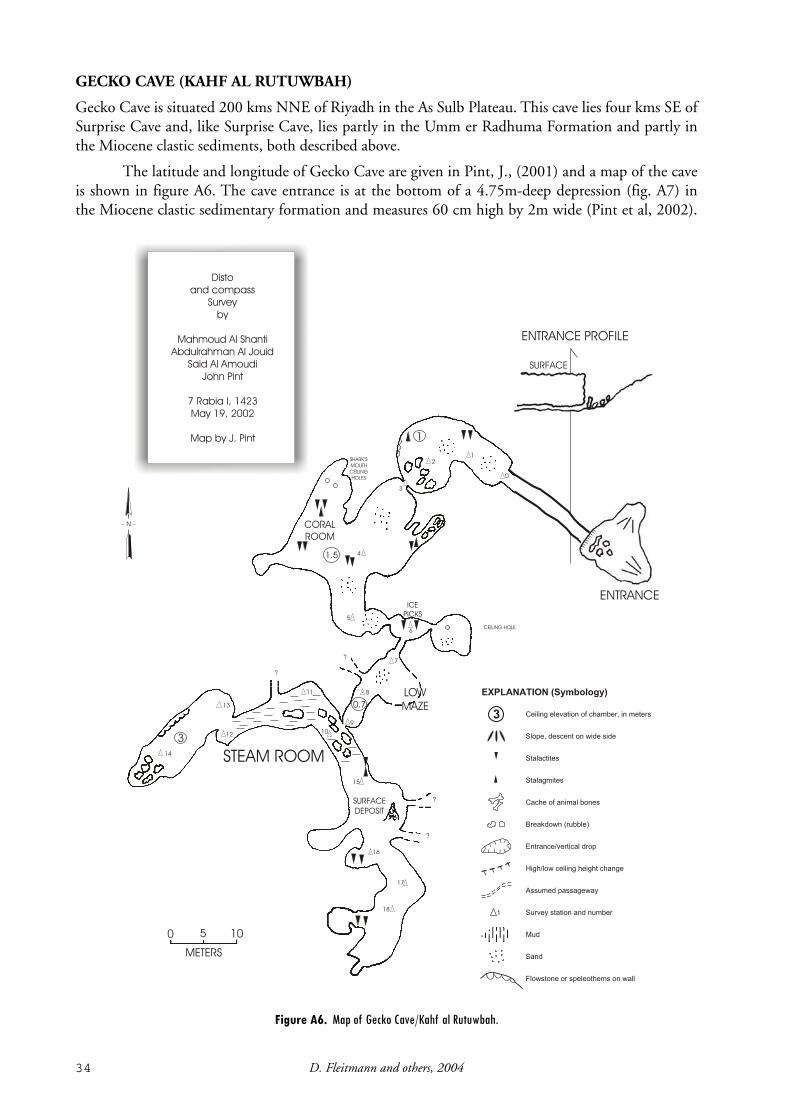
34 D. Fleitmann and others, 2004
GECKO CAVE (KAHF AL RUTUWBAH)
Gecko Cave is situated 200 kms NNE of Riyadh in the As Sulb Plateau. This cave lies four kms SE of Surprise Cave and, like Surprise Cave, lies partly in the Umm er Radhuma Formation and partly in the Miocene clastic sediments, both described above.
The latitude and longitude of Gecko Cave are given in Pint, J., (2001) and a map of the cave is shown in figure A6. The cave entrance is at the bottom of a 4.75m-deep depression (fig. A7) in the Miocene clastic sedimentary formation and measures 60 cm high by 2m wide (Pint et al, 2002).
N
Disto
and compass
Survey
by
Mahmoud Al Shanti
Abdulrahman Al Jouid
Said Al Amoudi
John Pint
7 Rabia I, 1423
May 19, 2002
Map by J. Pint
18
17
16
15
10
9
11
12
13
14
8
7
6
5
4
3
21
0
?
?
?
?
0 5 10
METERS
3
1.5
0.7
1
SURFACE
DEPOSIT
STEAM ROOM
LOW
MAZE
ICE
PICKS
CORAL
ROOM
SHARK’S
MOUTH
CEILING
HOLES
CEILING HOLE
SURFACE
ENTRANCE PROFILE
ENTRANCE
3
I III II
I
I I II I
EXPLANATION (Symbology)
Ceiling elevation of chamber, in meters
Slope, descent on wide side
Stalactites
Stalagmites
Cache of animal bones
Breakdown (rubble)
Entrance/vertical drop
High/low ceiling height change
Assumed passageway
Survey station and number
Mud
Sand
Flowstone or speleothems on wall
1
Figure A6. Map of Gecko Cave/Kahf al Rutuwbah.
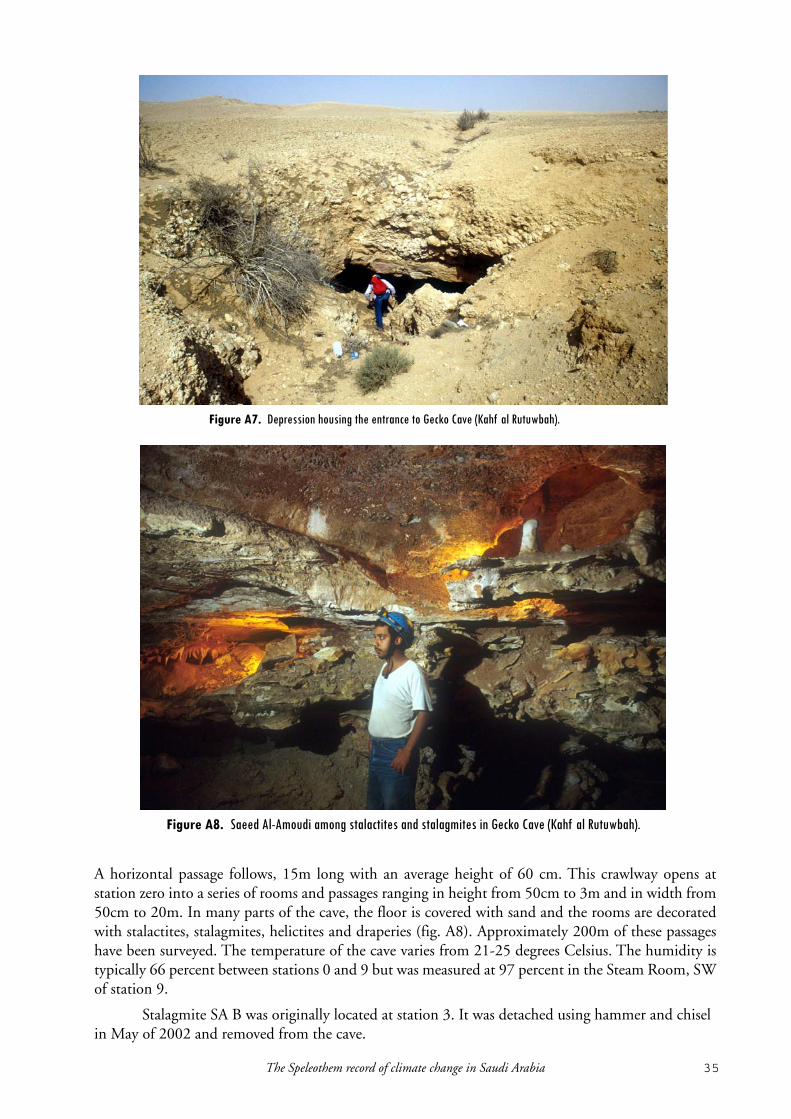
35The Speleothem record of climate change in Saudi Arabia
A horizontal passage follows, 15m long with an average height of 60 cm. This crawlway opens at station zero into a series of rooms and passages ranging in height from 50cm to 3m and in width from 50cm to 20m. In many parts of the cave, the floor is covered with sand and the rooms are decorated with stalactites, stalagmites, helictites and draperies (fig. A8). Approximately 200m of these passages have been surveyed. The temperature of the cave varies from 21-25 degrees Celsius. The humidity is typically 66 percent between stations 0 and 9 but was measured at 97 percent in the Steam Room, SW of station 9.
Stalagmite SA B was originally located at station 3. It was detached using hammer and chisel in May of 2002 and removed from the cave.
Figure A8. Saeed Al-Amoudi among stalactites and stalagmites in Gecko Cave (Kahf al Rutuwbah).
Figure A7. Depression housing the entrance to Gecko Cave (Kahf al Rutuwbah).

36 D. Fleitmann and others, 2004
B32 CAVE
B32 Cave is situated 200 kms NNE of Riyadh in the As Sulb Plateau. This cave lies 1.2 kms SE of Surprise Cave and, like Surprise Cave, lies partly in the Umm er Radhuma Formation and partly in the Miocene clastic sediments, both described above.
The latitude and longitude of B32 Cave are given in Pint, J., (2001) and a map of the cave is shown in figure A9. The cave entrance is at the bottom of a 6m-deep depression (fig. A10) in the Miocene clastic sedimentary formation and measures 1m wide and 70cm high. 95m of passages and rooms were surveyed by SGS (Pint et al, 2002). However, unexplored openings to the west and references to this cave in Verkarstrung und Grundwasser im As Summan Plateau (Saudi Arabien) (Hötzl and others, 1993, p. 101) suggest that the cave is much longer. This cave has walls and a ceiling of
N
Distoand compass
Surveyby
John Pintand
Said Al-Amoudi
9 Rabia I, 1423May 21, 2002
Map by J. Pint
0
1
2
3
4
5
6
7
8
9
10
11
3.8
5
5.4
METERS
0 5 10
?
?
?
AS SULB PLATEAU
SAUDI ARABIA
ENTRANCE
Figure A9. Map of B32 Cave.

37The Speleothem record of climate change in Saudi Arabia
sandy limestone with patches of secondary gypsum. It has speleothems including stalactites, stalagmites (fig. A11), draperies, and helictites. The floor is covered with a great deal of friable breakdown, some pieces measuring up to 6m in length. The temperature was measured at 21oC and the humidity at 70 percent on May 21, 2002.
Stalagmites SA C and SA D were found near station 10 in the northernmost room explored. They were removed from the cave in May of 2002.
Figure A11. Typical speleothems found in B32 Cave.
Figure A10. Abdulrahman Al-Juaid at the Six-meter-deep depression leading to the entrance to B32 Cave.
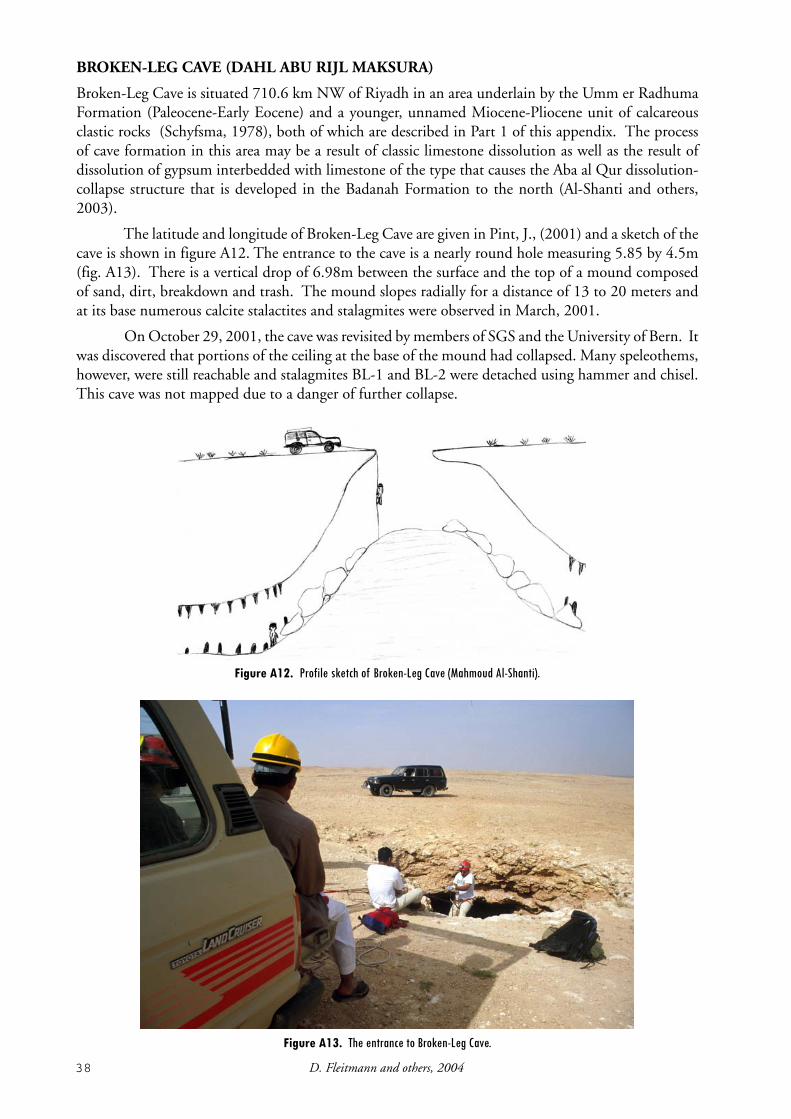
38 D. Fleitmann and others, 2004
BROKEN-LEG CAVE (DAHL ABU RIJL MAKSURA)
Broken-Leg Cave is situated 710.6 km NW of Riyadh in an area underlain by the Umm er Radhuma Formation (Paleocene-Early Eocene) and a younger, unnamed Miocene-Pliocene unit of calcareous clastic rocks (Schyfsma, 1978), both of which are described in Part 1 of this appendix. The process of cave formation in this area may be a result of classic limestone dissolution as well as the result of dissolution of gypsum interbedded with limestone of the type that causes the Aba al Qur dissolution-collapse structure that is developed in the Badanah Formation to the north (Al-Shanti and others, 2003).
The latitude and longitude of Broken-Leg Cave are given in Pint, J., (2001) and a sketch of the cave is shown in figure A12. The entrance to the cave is a nearly round hole measuring 5.85 by 4.5m (fig. A13). There is a vertical drop of 6.98m between the surface and the top of a mound composed of sand, dirt, breakdown and trash. The mound slopes radially for a distance of 13 to 20 meters and at its base numerous calcite stalactites and stalagmites were observed in March, 2001.
On October 29, 2001, the cave was revisited by members of SGS and the University of Bern. It was discovered that portions of the ceiling at the base of the mound had collapsed. Many speleothems, however, were still reachable and stalagmites BL-1 and BL-2 were detached using hammer and chisel. This cave was not mapped due to a danger of further collapse.
Figure A13. The entrance to Broken-Leg Cave.
Figure A12. Profile sketch of Broken-Leg Cave (Mahmoud Al-Shanti).

39The Speleothem record of climate change in Saudi Arabia
STAR CAVE (KAHF AL NAJMAH)
Star Cave is situated 76 km NW of Broken-Leg Cave in the Aruma formation. This formation is comprised of white, crystalline and nodular limestone typical of an open-platform domain. The thickness of the sequence is 125m and its age is Late Cretaceous. At the top, the formation becomes clayey and then dolomitic (Laurent, 1992).
The latitude and longitude of Star Cave are given in Pint, J., (2001) and a map of the cave is shown in figure A14. Two entrances to this cave are found in a 6.22 m diameter depression. Entrance One is 2.84 m wide and 0.78 high (fig. A15). Entrance Two is 3.76 wide and 2.57 high. The first room of the cave is 32.5 m long, and 11 m wide with an average height of one meter. At the south end of this room there is a pitch whose depth could not be determined. An air current of 15 kph was measured at this point, indicating that spacious passages may lie below.
This cave has stalactites, stalagmites and columns. The stalagmites chosen for sampling were located at the SW end of the first room, concealed beneath large slabs of breakdown. On October 29, 2001, five of these stalagmites were detached using hammer and chisel and removed from the cave (fig. A16).
Figure A14. Map of Star Cave (Kahf al Rutuwbah).
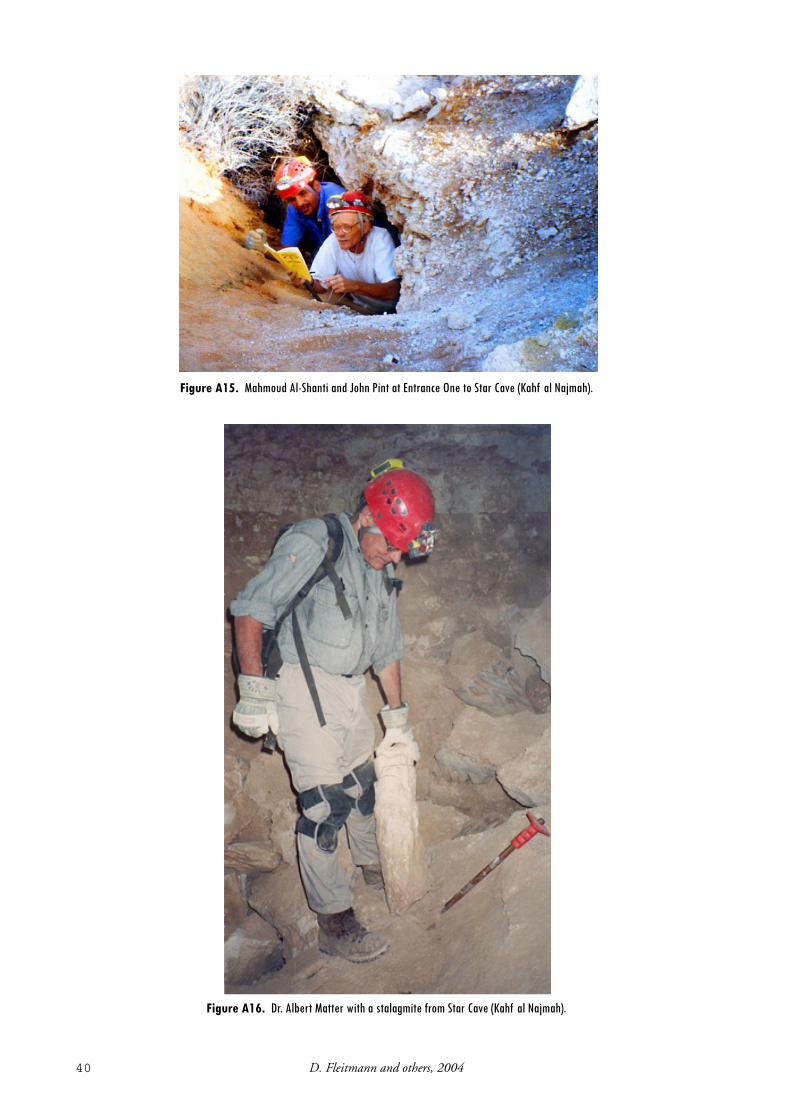
40 D. Fleitmann and others, 2004
Figure A15. Mahmoud Al-Shanti and John Pint at Entrance One to Star Cave (Kahf al Najmah).
Figure A16. Dr. Albert Matter with a stalagmite from Star Cave (Kahf al Najmah).