The spatial and temporal ‘cost’ of volcanic eruptions ...
13
RESEARCH ARTICLE The spatial and temporal ‘cost’ of volcanic eruptions: assessing economic impact, business inoperability, and spatial distribution of risk in the Auckland region, New Zealand Garry W. McDonald 1 & Nicola J. Smith 1 & Joon-hwan Kim 1 & Shane J. Cronin 2,3 & Jon N. Proctor 2 Received: 18 May 2016 /Accepted: 22 May 2017 /Published online: 6 June 2017 # Springer-Verlag Berlin Heidelberg 2017 Abstract Volcanic risk assessment has historically concen- trated on quantifying the frequency, magnitude, and potential diversity of physical processes of eruptions and their conse- quent impacts on life and property. A realistic socio-economic assessment of volcanic impact must however take into ac- count dynamic properties of businesses and extend beyond only measuring direct infrastructure/property loss. The inoperability input-output model, heralded as one of the 10 most important accomplishments in risk analysis over the last 30 years (Kujawaski Syst Eng. 9:281–295, 2006), has become prominent over the last decade in the economic impact assess- ment of business disruptions. We develop a dynamic inoperability input-output model to assess the economic im- pacts of a hypothetical volcanic event occurring at each of 7270 unique spatial locations throughout the Auckland Volcanic Field, New Zealand. This field of at least 53 volca- noes underlies the country’ s largest urban area, the Auckland region, which is home to 1.4 million people and responsible for 35.3% (NZ$ 2014 81.2 billion) of the nation’s GDP (Statistics New Zealand 2015). We apply volcanic event char- acteristics for a small-medium-scale volcanic eruption scenar- io and assess the economic impacts of an ‘average’ eruption in the Auckland region. Economic losses are quantified both with, and without, business mitigation and intervention re- sponses in place. We combine this information with a recent spatial hazard probability map (Bebbington and Cronin Bull Volcanol. 73(1):55–72, 2011) to produce novel spatial eco- nomic activity ‘at risk’ maps. Our approach demonstrates how business inoperability losses sit alongside potential life and property damage assessment in enhancing our under- standing of volcanic risk mitigation. Keywords Risk . Economics . Impact . Visualisation Introduction Economic consequences of volcanic eruptions extend well beyond the value of infrastructure directly damaged or destroyed, yet these factors often dominate the assessment of impact and risk. The standard risk formulation of hazard mul- tiplied by value is easiest to calculate when the ‘value’ term describes loss-of-life and physical assets, i.e. costs of build- ings, roads, land, and so on. The wider economic impacts beyond the eruption physical footprint are less tangible, but no less significant. In this paper, a method is described by which wider economic consequences and impacts are evalu- ated for a volcanic eruption scenario in an urban environment. In several parts of the world, volcanoes in urban areas pose immense potential economic consequences, especially when the exact location of volcanic hazard is unknown, e.g. Campi Flegrei (Italy), Mexico City (Mexico), or Managua (Nicaragua). This study integrates a multi-timescale economic analysis with the spatial variability of economic activities and volcanic vent opening probability to demonstrate a powerful new risk assess- ment tool. A construct of this type is needed in order to evaluate the efficacy of potential mitigation actions in reducing negative Editorial responsibility: L. Sandri * Garry W. McDonald [email protected] 1 Market Economics Limited, PO Box 331297, Takapuna, Auckland 0740, New Zealand 2 Institute of Agriculture and Environment, Massey University, Private Bag 11222, Palmerston North 4410, New Zealand 3 School of Environment, University of Auckland, Private Bag 92019, Auckland 1142, New Zealand Bull Volcanol (2017) 79: 48 DOI 10.1007/s00445-017-1133-9
Transcript of The spatial and temporal ‘cost’ of volcanic eruptions ...
RESEARCH ARTICLE
The spatial and temporal ‘cost’ of volcanic eruptions:assessing economic impact, business inoperability, and spatialdistribution of risk in the Auckland region, New Zealand
Garry W. McDonald1& Nicola J. Smith1
& Joon-hwan Kim1& Shane J. Cronin2,3
&
Jon N. Proctor2
Received: 18 May 2016 /Accepted: 22 May 2017 /Published online: 6 June 2017# Springer-Verlag Berlin Heidelberg 2017
Abstract Volcanic risk assessment has historically concen-trated on quantifying the frequency, magnitude, and potentialdiversity of physical processes of eruptions and their conse-quent impacts on life and property. A realistic socio-economicassessment of volcanic impact must however take into ac-count dynamic properties of businesses and extend beyondonly measuring direct infrastructure/property loss. Theinoperability input-output model, heralded as one of the 10most important accomplishments in risk analysis over the last30 years (Kujawaski Syst Eng. 9:281–295, 2006), has becomeprominent over the last decade in the economic impact assess-ment of business disruptions. We develop a dynamicinoperability input-output model to assess the economic im-pacts of a hypothetical volcanic event occurring at each of7270 unique spatial locations throughout the AucklandVolcanic Field, New Zealand. This field of at least 53 volca-noes underlies the country’s largest urban area, the Aucklandregion, which is home to 1.4 million people and responsiblefor 35.3% (NZ$201481.2 billion) of the nation’s GDP(Statistics New Zealand 2015). We apply volcanic event char-acteristics for a small-medium-scale volcanic eruption scenar-io and assess the economic impacts of an ‘average’ eruption inthe Auckland region. Economic losses are quantified both
with, and without, business mitigation and intervention re-sponses in place. We combine this information with a recentspatial hazard probability map (Bebbington and Cronin BullVolcanol. 73(1):55–72, 2011) to produce novel spatial eco-nomic activity ‘at risk’ maps. Our approach demonstrateshow business inoperability losses sit alongside potential lifeand property damage assessment in enhancing our under-standing of volcanic risk mitigation.
Keywords Risk . Economics . Impact . Visualisation
Introduction
Economic consequences of volcanic eruptions extend wellbeyond the value of infrastructure directly damaged ordestroyed, yet these factors often dominate the assessment ofimpact and risk. The standard risk formulation of hazard mul-tiplied by value is easiest to calculate when the ‘value’ termdescribes loss-of-life and physical assets, i.e. costs of build-ings, roads, land, and so on. The wider economic impactsbeyond the eruption physical footprint are less tangible, butno less significant. In this paper, a method is described bywhich wider economic consequences and impacts are evalu-ated for a volcanic eruption scenario in an urban environment.In several parts of the world, volcanoes in urban areas poseimmense potential economic consequences, especially whenthe exact location of volcanic hazard is unknown, e.g. CampiFlegrei (Italy), Mexico City (Mexico), or Managua (Nicaragua).This study integrates a multi-timescale economic analysis withthe spatial variability of economic activities and volcanic ventopening probability to demonstrate a powerful new risk assess-ment tool. A construct of this type is needed in order to evaluatethe efficacy of potential mitigation actions in reducing negative
Editorial responsibility: L. Sandri
* Garry W. [email protected]
1 Market Economics Limited, PO Box 331297,Takapuna, Auckland 0740, New Zealand
2 Institute of Agriculture and Environment, Massey University, PrivateBag 11222, Palmerston North 4410, New Zealand
3 School of Environment, University of Auckland, Private Bag 92019,Auckland 1142, New Zealand
Bull Volcanol (2017) 79: 48DOI 10.1007/s00445-017-1133-9
economic consequences and promoting recovery and adaptivebehaviour, e.g. in areas that take up displaced economic activity.
The Auckland region, New Zealand’s most populous region,is located squarely on the Auckland Volcanic Field (AVF), anintraplate field with a ~250,000 year history of sporadic, distrib-uted, low-volume, alkali basalt eruptions, many producingmaarsand explosion craters (Kermode 1992; Kereszturi et al. 2014).Approximately 1.4 million people live in the region, just overone third of New Zealand’s population. Over the last 15 years,theAuckland region’s population has grown at an annual averagerate of 2.2% per annum and is projected to reach upwards of 2.6million people by 2050. Auckland’s rapid urban expansionplaces an increasing need to plan and govern for volcanic risk,driven in part by recent legislative changes. There are now strongobligations on local government (in this case Auckland Council)to undertake strategic regional planning, including a spatial planfor sequenced growth and infrastructure provision, and an evi-dential base to support decision-making. Recent amendments tothe Local Government Act 2002 also require Auckland Councilto develop a resilient infrastructure strategy that includes identi-fying and managing risks relating to natural hazards, along withappropriate financial provision for those risks.
Consistent with other studies on the effects of natural haz-ards on the economy and functioning of society (Rose 2004),the ‘indirect effects’ (flow on impacts through supply chains)of a volcanic event are likely to impact the Auckland regionsignificantly. This is particularly due to the cascading effectsthrough value chains that exist within the regional economyand the pivotal role that Auckland plays in the wider NewZealand economy. Cascading impacts are evaluated in thiswork using a dynamic inoperability input-output model(DIIM) that evaluates business disruption losses broughtabout by an eruption within the AVF.
Spatial variability of potential economic consequences is ahighly important consideration, in part due to the concentra-tions of different economic activities in different urban sectors(e.g. industrial areas, financial districts vs. dominantly subur-ban sites). Furthermore, in volcanic fields, spatial variabilityof eruption likelihood is considerable (Conner and Conway2000; Valentine and Gregg 2008).
In this paper, we demonstrate how multiple DIIM runs atvarying eruption locations, combined with a spatial hazardprobability map for the AVF (Bebbington and Cronin 2011),creates a novel map of economic activity ‘at risk’ in theAuckland isthmus. Section 2 provides some background onInoperability Input-Output Modelling (IIM) along with a fullmathematical specification of the DIIM used in this study.Using this specification, Section 3 creates a DIIM for theAVF. The steps involved are as follows: firstly, we provide abrief description of the AVF and the hypothetical Ruaumokoeruption scenario for which the business inoperability eco-nomic impact assessment occurs. Secondly, we describe theunderlying datasets and multi-regional input-output (MRIO)
framework upon which the DIIM is constructed. Thirdly, weoutline the process followed to generate the businessinoperability curves by economic sector. Finally, we providedetails on the process followed to generate spatial maps ofeconomic activity at risk which summarise the businessinoperability losses across the Auckland isthmus. Section 4discusses the key findings of the study, including showcasingthe at risk maps (covering 7270 spatial locations) with, andwithout, business mitigations and intervention responses.Section 5 critiques the usefulness of the DIIM including iden-tifying the key strengths and weaknesses, whilst Section 6provides concluding remarks.
The dynamic inoperability input-output model
Background
Haimes and Jiang (2001) originally developed the IIM, withsubsequent refinement by Santos and Haimes (2004). It ex-tends conventional input-output (IO) analysis, a tool common-ly utilised for assessing economic impact associated with dis-ruption events. The IIM is considered to be one of the 10 mostimportant accomplishments in risk analysis over the last30 years (Kujawaski 2006). In broad terms, the IIM tracksthe likely cascading effects of sector inoperability across aset of directly, and indirectly (i.e. through supply chain link-ages), affected sectors that make up an economy (Santos et al.2009). Classification of the sectors of economies depends onthe analytical framework and the data available, but may breakan economy down into, say, 50 or more component sectors.1
Applications to date have either focused specifically on infra-structure sectors, and the interdependencies among these, ormore broadly on interdependencies among industries definedgenerally as economic sectors. The latter set of applications ismore closely aligned to traditional IO analysis.
Haimes et al. (2005a, b) extended the IIM to take intoaccount the pathway of recovery of sectors initially impactedby a disruptive event, hence formulating the DIIM. More re-cent attention was focused on understanding and formulatingmodels to describe the timing of inoperability and recovery fordirectly impacted sectors. For example, Barker and Santos(2010) explore the role played by inventories in delayingand/or muting disruption following events. Although thiswork has been in the context of disaster analysis, a specificfocus on the impacts of an actual or hypothetical volcanicevent has yet to be undertaken. The key features in which avolcanic event often differs from other natural hazard eventsare the potential warning period is long enough to carry outsome degree of mitigation, the duration of the event can vary
1 A group of businesses of a similar type which when aggregated create a‘sector’.
48 Page 2 of 13 Bull Volcanol (2017) 79: 48
from hours to years, and the landscape, hydrology, soil, andgeological resources may be irrevocably changed. This is alsothe first application of the DIIM for spatial mapping of theeconomic activity at risk.
Specification of a dynamic inoperability input-outputmodel
The DIIM is a derivative of an IO model of an economy(Leontief 1951a, b). Traditional IO analysis, as created byNobel Laureate Wassily Leontief, draws on a technicalcoefficients matrix to estimate the extent to which chang-es in the level of production of one particular sector, or agroup of sectors, directly impact on other sectors throughsupply chain interconnections. For example, if the de-mand for products of a car manufacturing firm were toreduce, an IO model can be used to calculate the conse-quential impacts on firms normally responsible for pro-viding inputs to the car manufacturer, such as automobileparts and metal product manufacturers, and, in turn, thefirms responsible for supplying inputs to those firms. TheIO model traces this ‘infinite’ round of effects to estimatethe total ‘direct’ and ‘indirect’ effects associated with adisruption event. A key problem however with applyingtraditional IO analysis directly to disruption events is thatthere is potential for double counting of impacts. Thisoccurs essentially because firms directly impacted by thedisaster may also be included within the calculated indi-rect impact supply chains of other firms directly affected,e.g. a vegetable market gardener may be both directlyimpacted (through loss of crops), but also indirectly im-pacted (through loss of associated processing facilities).To avoid this issue, the DIIM essentially breaks the periodof analysis into small time steps and assumes that directimpacts experienced during one particular time step createan indirect impact in the subsequent time step.
In mathematical terms, the DIIM used in this paper is for-mulated as:
qi t þ 1ð Þ ¼ qi tð Þ þ kii c*i tð Þ−qi tð Þ þ ∑n
j¼1a*ijq j tð Þ
" #; ð1Þ
where qi(t) is the total inoperability of sector i at time t,expressed as a ratio of unrealised economic production withrespect to the ‘as-planned’ production level of that sector. Thevalue qi(t) = 0 indicates the sector is fully operational, whilst avalue qi(t) = 1 indicates completely inoperable. The coeffi-cient aij
* is taken from a normalised Leontief interdependencymatrix describing the degree of coupling between sectors, andci*(t) is the normalised demand perturbation of sector i at time
t, expressed in terms of relative degraded final demand. Kii isthe sectoral recovery coefficient. The recovery coefficients are
calculated from the estimated production inoperability directlyexperienced by each sector:
kii tð Þ ¼ 1−pi tð Þ
pi t−1ð Þ� �
� 1
1−a*ii
� �; ð2Þ
where pi(t) is the production inoperability experienced by sec-tor i at the end of time t, expressed as a ratio of unrealisedproduction with respect to the ‘as-planned’ production level ofthe sector.2 As with total inoperability, pi(t) = 0 indicates thesector is producing fully, whilst a value pi(t) = 1 indicates noproduction. Production inoperability is similar to totalinoperability; it however describes only inoperability directlyimpacting on the sector due to a physical disruption in thatprocess.
A dynamic inoperability model for the Aucklandvolcanic field
The Auckland volcanic field and the Ruaumoko eruptionscenario
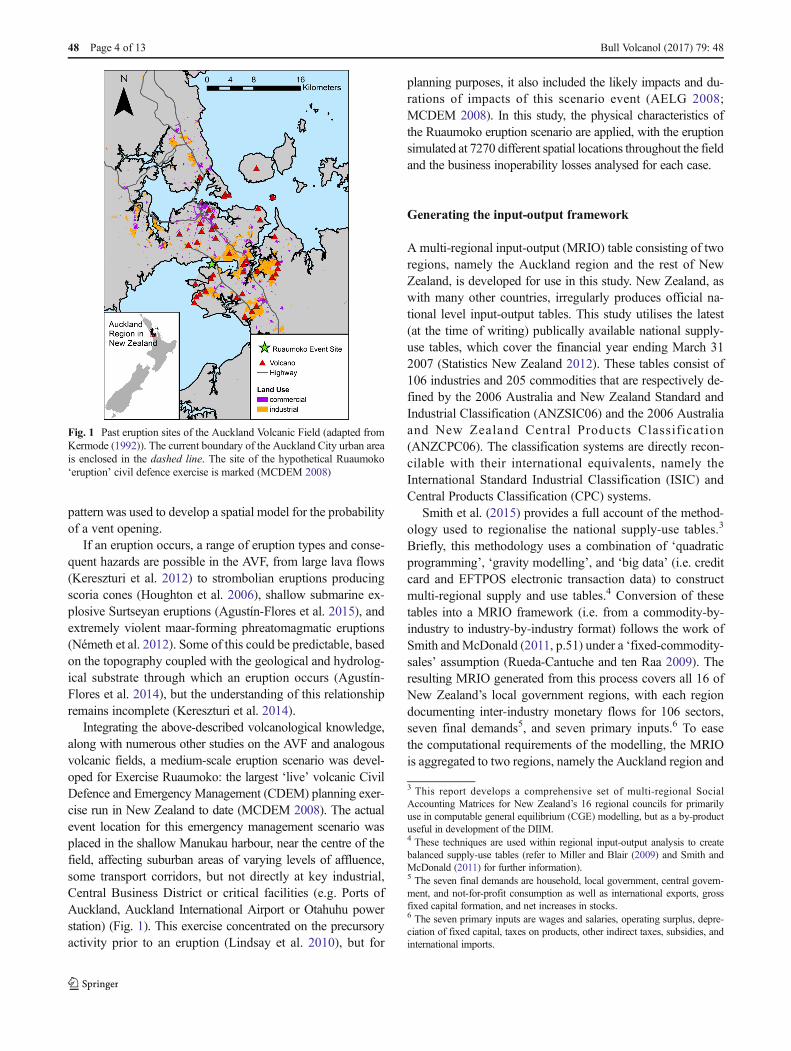
The Auckland Volcanic Field (AVF) covers an area of approxi-mately 360 km2, centred on the Auckland isthmus, including theManukau and Waitematā harbours (Spörli and Eastwood 1997)(Fig. 1). The AVF is a monogenetic intraplate volcanic field,located around 450 km from the plate boundary responsible forvolcanism in the Taupo Volcanic Zone to the southeast. Theearliest known volcanism was around ~250,000 years ago, withthe latest ~500 years ago at Rangitoto (Lindsay et al. 2011).Rangitoto, the youngest and largest of the volcanoes, showsevidence for potentially repeated volcanism (Shane et al. 2013),something not seen at the other ~52 volcanoes so far. The landarea of the AVF, which is a subset of the wider Auckland region,is heavily populated, with over 1 million people living on areaswith a calculable probability of a future eruption (Bebbingtonand Cronin 2011).
The temporal eruptive frequency of the AVF is highly var-iable with ‘flare-ups’ of high-frequency eruptions noted withboth paleomagnetic (Cassidy and Locke 2010) andtephrochronology evidence (Molloy et al. 2009). The spatialrecurrence of volcanism was found to be independent of thetemporal sequence by Bebbington and Cronin (2011) whodeveloped separate spatial and temporal hazard forecasts.Despite having no specific forecast of the next eruptionlocation in the field, the Bebbington and Cronin (2011) modelshowed a strong spatial structure evident in the locations ofpast eruptive vents in the AVF. This southeast-north west
2 The coefficient aii* is a diagonal element of the normalised Leontief interde-
pendency matrix and represents the degree of within-sector economic interde-pendence for each sector i.
Bull Volcanol (2017) 79: 48 Page 3 of 13 48
pattern was used to develop a spatial model for the probabilityof a vent opening.
If an eruption occurs, a range of eruption types and conse-quent hazards are possible in the AVF, from large lava flows(Kereszturi et al. 2012) to strombolian eruptions producingscoria cones (Houghton et al. 2006), shallow submarine ex-plosive Surtseyan eruptions (Agustín-Flores et al. 2015), andextremely violent maar-forming phreatomagmatic eruptions(Németh et al. 2012). Some of this could be predictable, basedon the topography coupled with the geological and hydrolog-ical substrate through which an eruption occurs (Agustín-Flores et al. 2014), but the understanding of this relationshipremains incomplete (Kereszturi et al. 2014).
Integrating the above-described volcanological knowledge,along with numerous other studies on the AVF and analogousvolcanic fields, a medium-scale eruption scenario was devel-oped for Exercise Ruaumoko: the largest ‘live’ volcanic CivilDefence and Emergency Management (CDEM) planning exer-cise run in New Zealand to date (MCDEM 2008). The actualevent location for this emergency management scenario wasplaced in the shallow Manukau harbour, near the centre of thefield, affecting suburban areas of varying levels of affluence,some transport corridors, but not directly at key industrial,Central Business District or critical facilities (e.g. Ports ofAuckland, Auckland International Airport or Otahuhu powerstation) (Fig. 1). This exercise concentrated on the precursoryactivity prior to an eruption (Lindsay et al. 2010), but for
planning purposes, it also included the likely impacts and du-rations of impacts of this scenario event (AELG 2008;MCDEM 2008). In this study, the physical characteristics ofthe Ruaumoko eruption scenario are applied, with the eruptionsimulated at 7270 different spatial locations throughout the fieldand the business inoperability losses analysed for each case.
Generating the input-output framework
Amulti-regional input-output (MRIO) table consisting of tworegions, namely the Auckland region and the rest of NewZealand, is developed for use in this study. New Zealand, aswith many other countries, irregularly produces official na-tional level input-output tables. This study utilises the latest(at the time of writing) publically available national supply-use tables, which cover the financial year ending March 312007 (Statistics New Zealand 2012). These tables consist of106 industries and 205 commodities that are respectively de-fined by the 2006 Australia and New Zealand Standard andIndustrial Classification (ANZSIC06) and the 2006 Australiaand New Zealand Central Products Classification(ANZCPC06). The classification systems are directly recon-cilable with their international equivalents, namely theInternational Standard Industrial Classification (ISIC) andCentral Products Classification (CPC) systems.
Smith et al. (2015) provides a full account of the method-ology used to regionalise the national supply-use tables.3
Briefly, this methodology uses a combination of ‘quadraticprogramming’, ‘gravity modelling’, and ‘big data’ (i.e. creditcard and EFTPOS electronic transaction data) to constructmulti-regional supply and use tables.4 Conversion of thesetables into a MRIO framework (i.e. from a commodity-by-industry to industry-by-industry format) follows the work ofSmith andMcDonald (2011, p.51) under a ‘fixed-commodity-sales’ assumption (Rueda-Cantuche and ten Raa 2009). Theresulting MRIO generated from this process covers all 16 ofNew Zealand’s local government regions, with each regiondocumenting inter-industry monetary flows for 106 sectors,seven final demands5, and seven primary inputs.6 To easethe computational requirements of the modelling, the MRIOis aggregated to two regions, namely the Auckland region and
3 This report develops a comprehensive set of multi-regional SocialAccounting Matrices for New Zealand’s 16 regional councils for primarilyuse in computable general equilibrium (CGE) modelling, but as a by-productuseful in development of the DIIM.4 These techniques are used within regional input-output analysis to createbalanced supply-use tables (refer to Miller and Blair (2009) and Smith andMcDonald (2011) for further information).5 The seven final demands are household, local government, central govern-ment, and not-for-profit consumption as well as international exports, grossfixed capital formation, and net increases in stocks.6 The seven primary inputs are wages and salaries, operating surplus, depre-ciation of fixed capital, taxes on products, other indirect taxes, subsidies, andinternational imports.
Fig. 1 Past eruption sites of the Auckland Volcanic Field (adapted fromKermode (1992)). The current boundary of the Auckland City urban areais enclosed in the dashed line. The site of the hypothetical Ruaumoko‘eruption’ civil defence exercise is marked (MCDEM 2008)
48 Page 4 of 13 Bull Volcanol (2017) 79: 48
the rest of New Zealand, and the number of sectors was ag-gregated from 106 to 48.
Generating production inoperability curves
The key purpose of Exercise Ruaumoko was to test NewZealand’s all-of-nation arrangements to responding to a majordisaster resulting from a volcanic eruption in the Auckland re-gion (MCDEM 2008). The exercise occurred duringMarch 2008 and focused primarily on simulating the lead-up toa volcanic eruption. An additional focus was to develop a betterunderstanding of the likely economic impacts of a major emer-gency in the Auckland region and to explore techniques andprocesses by which Auckland businesses might minimise thoseimpacts. As part of the preliminary work for the Exercise (under-taken between October 2007 and February 2008), members ofthe project team engaged with a sample of Auckland’s businesscommunity (the ‘Business Group’) to ascertain their views on thelikely impacts of such an event on their businesses and sectors(refer to Shearer and McDonald (2008) for full details). TheBusiness Group also outlined plausible mitigating responses orinterventions they, and the wider community, could undertake tominimise the economic impacts resulting from an eruption event,including minimising the time taken to recover following a vol-canic event. Inoperability curves were created for three scenarios:a business-as-usual counterfactual and a Ruaumoko scenarioevent ‘with’ and ‘without’ business mitigations or responses in-corporated (Shearer and McDonald 2008).
Participants representing the following business types or orga-nisations were involved in workshops and surveying: construc-tion, small to medium enterprises, tourism, lifelines (water, tele-communications, energy, gas and so on), manufacturing, banking,insurance, land development, fast-moving consumer goods, andgovernment agencies. During a series of workshops, representa-tives were:
& Presented with the background information for theRuaumoko eruption scenario, including the likely physicalconsequences of a medium-magnitude eruption event inthe Auckland region;
& Requested to provide feedback about the likely impacts ontheir businesses, suppliers, and other economic sectors;
& Requested to describe possible mitigating responses orinterventions to minimise impacts, including minimisingthe time for recovery; and
& Requested to complete a survey questionnaire seeking de-tailed information on business location, timing, and relo-cation options. This was supplemented by questions onbusiness continuity planning (BCP).
The Ruaumoko eruption scenario was separated into fivedistinct time periods, pre-event, event, immediate, short term,and medium term. The ‘pre-event’ period was defined as the
10 days immediately prior to the volcanic event, during whichthe ‘warning signs’ of a volcanic event were likely to be ex-perienced. During this period, people were expected to evac-uate. Next, the ‘event’ was defined as a 30-day period, duringwhich volcanic activity takes place. It was anticipated thatalmost all economic activity within a 7-km radius of the vol-canowould cease, as residents were evacuated, and businessesclosed. The ‘immediate’ period was defined as the 14 daysimmediately after cessation of volcanic activity. During thisperiod, economic activity was anticipated to be negligible-to-low in most sectors due to the preceding large-scale destruc-tion and the fear of further volcanic activity. This period wasfollowed by the ‘short-term’ period, encompassing the next128 days. Many directly impacted businesses would be able totake actions to recommence operations during this period,whether at their usual place of business, or at another location.The final time period for the single-year analysis was definedas the ‘medium-term’ period. Most businesses were assumedto gradually re-establish themselves during this period.
To assist in the analysis of impacts in Exercise Ruaumoko,the site near to the eruption separates into three broad damagezones based on the typical magnitudes and processes derivedfrom geological studies. This initial work, based primarily onHoughton et al. (2006), has been updated to incorporate morerecent studies undertaken by Kereszturi et al. (2012), Némethet al. (2012) and Agustín-Flores et al. (2014, 2015), whichseparates sites near the eruption into four different damagezones (see Table 1). These zones are the devastation zone(0–3-km radius from the event site), a further evacuation zone(3–5-km radius), and moderate and low damage zones (5–7-and 7-km+ radius, respectively). Buildings, infrastructure, andother manufactured capital are expected to suffer significantdestruction necessitating permanent relocation of many busi-nesses within the 0–3-km zone. Similarly, damage within the3–5-km zone is anticipated to necessitate almost all businessesto relocate permanently. Despite potentially serious damage,repair and recovery is anticipated within the 5–7-km zone,avoiding permanent relocation of businesses.
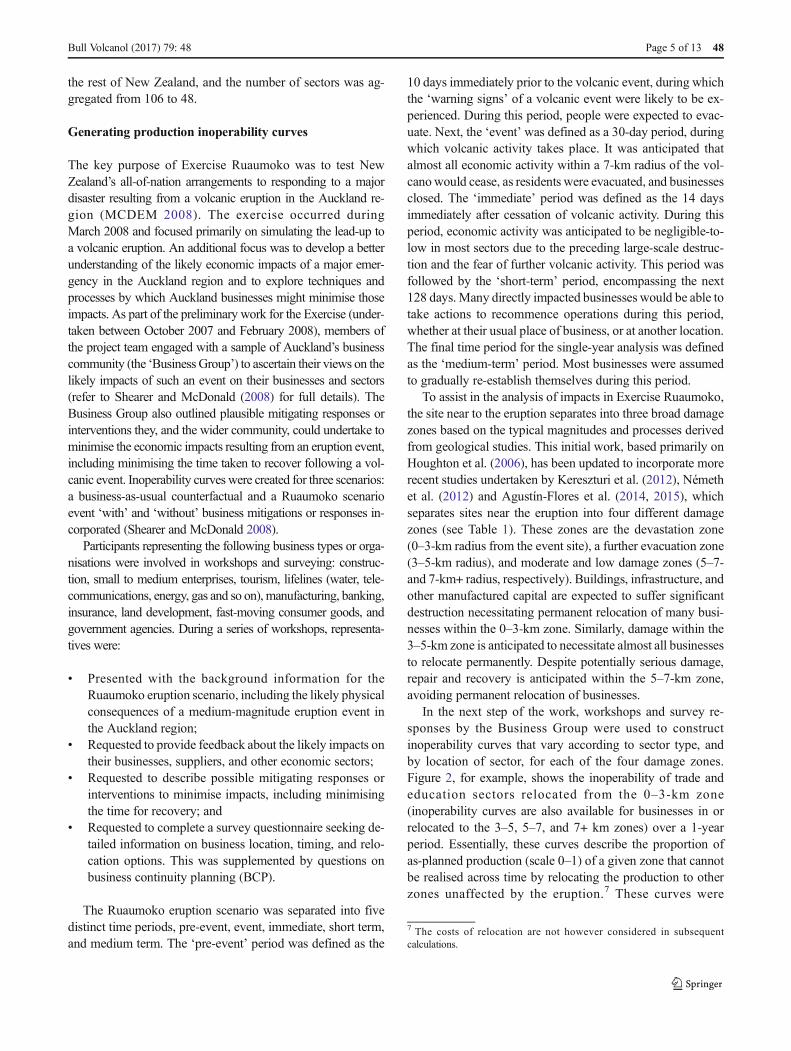
In the next step of the work, workshops and survey re-sponses by the Business Group were used to constructinoperability curves that vary according to sector type, andby location of sector, for each of the four damage zones.Figure 2, for example, shows the inoperability of trade andeducation sectors relocated from the 0–3-km zone(inoperability curves are also available for businesses in orrelocated to the 3–5, 5–7, and 7+ km zones) over a 1-yearperiod. Essentially, these curves describe the proportion ofas-planned production (scale 0–1) of a given zone that cannotbe realised across time by relocating the production to otherzones unaffected by the eruption.7 These curves were
7 The costs of relocation are not however considered in subsequentcalculations.
Bull Volcanol (2017) 79: 48 Page 5 of 13 48
constructed for a full 1-year event sequence. Workshops andsurveys undertaken within Exercise Ruaumoko constituted a‘pilot study’, but provide the best current information sourcefor likely business inoperability during an Auckland volcanicevent.
Generation of economic activity at risk spatial maps
A particularly novel output of this approach was the genera-tion of spatial maps of the economic activity at risk that ac-count for not only the differences in economic consequencesof an event depending on its location, but also the likelihoodof an event occurring at any particular location. In short, foursteps are required to generate these maps.
Step 1: Distribute regional output by spatial location
The MRIO describes sector production at the regional lev-el. Using the MRIO, we estimate the likely spatial distributionof economic production across the region. The best economicindicator available for these purposes, at a fine spatial resolu-tion, is employment data produced annually by Statistics NewZealand (SNZ) at a meshblock level. A meshblock is thesmallest geographical unit for which statistical data is collect-ed by SNZ. It varies in size depending on population, withrural meshblocks generally having a population of approxi-mately 60 people, whilst urban meshblocks are roughly thesize of a city block of approximately 110 people. The employ-ment data, defined by the ANZSIC06 at a 6-digit level, dis-tinguishes 500+ different economic activities and aligns to theInternational Standard Industrial Classification (ISIC).Official employment data is recorded by EmploymentCounts (a head count of all salary and wage earners for areference period), but was adjusted to produce a ModifiedEmployment Count (MEC) which included working proprie-tors, i.e. individuals who pay themselves a salary or wage.8
For each of the 500+ economic activities, gross output9 perMEC was considered to be spatially invariant. Gross outputestimates for the 500+ economic activities were, in turn, ag-gregated to the 48 DIIM sectors.
Step 2: Estimate production inoperability
In this paper, we assume that a volcanic eruption couldpotentially occur at any location (meshblock) within theAVF. For a hypothetical eruption at each meshblock, thefour damage zones were overlain, consistent with the AVF
Table 1 Spatial distribution oflikely Impacts of a Volcanic Eventin Auckland, based on anintegration of geological studiesfor a variety of past eruption types(integrated from: Houghton et al.2006; Kereszturi et al. 2012;Németh et al. 2012; Agustín-Flores et al. 2014, 2015)
Damage Zone
0–3 km 3–5 km 5–7 km 7+ km
Pre-event Earthquakes Earthquakes
Uplift Uplift
Ground deformation Ground deformation
Event Ashfall Ashfall Ashfall Ashfall
Lava flows Lava flows Lava flows Lava flows (less severe)
Fires Fires Fires Fires
Toxic gases Toxic gases
Eruptions
Explosions
Base surge
0.00
0.25
0.50
0.75
1.00
0 100 200 300
Time after the eruption warning (days)
Inop
erab
ility
(0
= fu
lly o
pera
tiona
l) Education
Trade
Fig. 2 Inoperability curves for the Trade and Education Industriesrelocated from the 0–3-km volcanic impacts zone in the AucklandVolcanic Field
8 The Auckland region is dominated by small businesses, with >95% of peo-ple working in businesses with <5 employees. Thus, it is necessary to accountfor not only employees but also working proprietors when generating esti-mates of total employment.9 Gross output is a monetary measure of the total transactions occurring withina sector.
48 Page 6 of 13 Bull Volcanol (2017) 79: 48
Ruaumoko eruption scenario. Using the available esti-mates of economic production (gross output) by location,and the inoperability curves described in Section 3.3 de-veloped, it was then possible to estimate total productioninoperability by economic sector for an eruption event ineach location (meshblock).
Step 3: Estimate total inoperability
All up, production inoperability results were generatedfor 7270 different eruption locations (meshblocks). Eachset of DIIM results by meshblock was, in turn, fed intothe DIIM to generate estimates of total economic impactfor the Auckland region and the rest of New Zealand.
Step 4: ‘Normalise’ results according to hazard probability
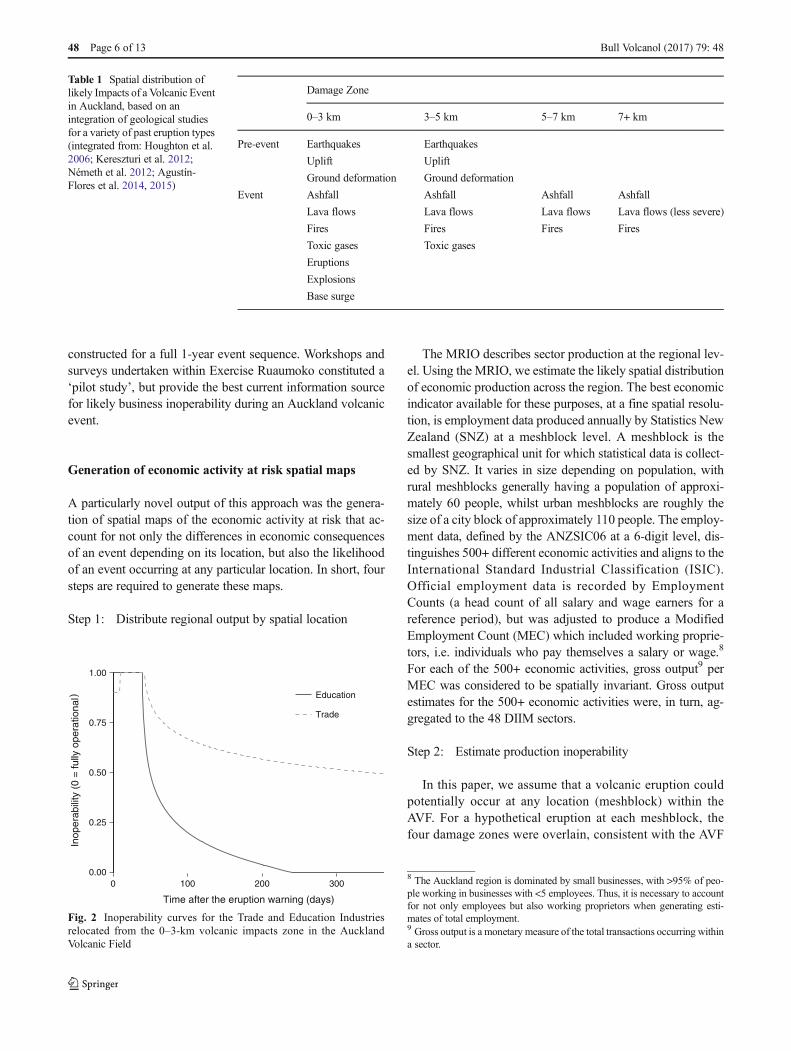
The final stage of the analysis involved multiplying theestimated total inoperability losses calculated for eacheruption location (meshblock) by the relative probabilityof a vent opening at that location. For this purpose, thespatial probability of a volcanic vent opening data for theAVF (Fig. 3) from Bebbington and Cronin (2011) is ap-plied. Of course, alternative volcanic probability maps, asthey become available, permit easy updating of the work.
Results and discussion
This section provides a summary of the major results obtainedby applying the DIIM framework to the Exercise Ruaumokoeruption scenario. This assessment focuses solely on the busi-ness inoperability losses over the first year following theevent. As noted above, our study focuses on a single eruptionevent and includes a pre-event warning period characterisedby seismic activity. Additionally, our findings account only forbusiness inoperability losses and, thus, do not take account ofthe plethora of other potential economic impacts felt followinga volcanic eruption, including inter alia loss of life, propertydamage, critical infrastructure interdependencies, and tourismlosses.
Business inoperability losses
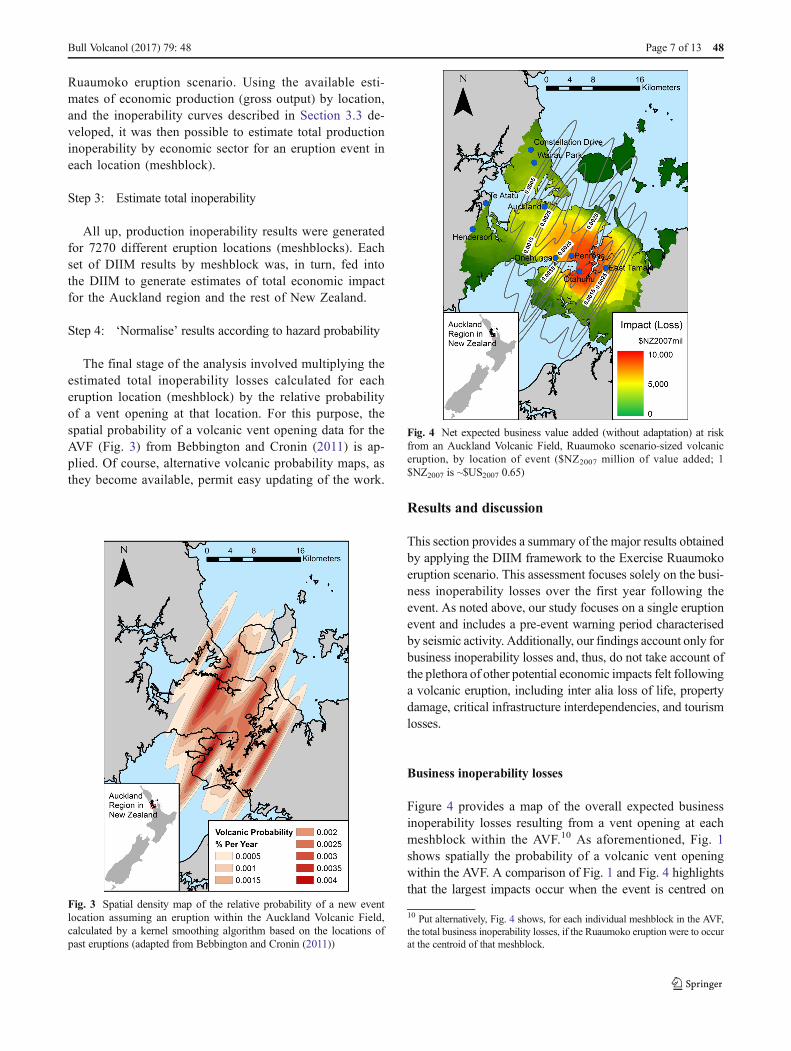
Figure 4 provides a map of the overall expected businessinoperability losses resulting from a vent opening at eachmeshblock within the AVF.10 As aforementioned, Fig. 1shows spatially the probability of a volcanic vent openingwithin the AVF. A comparison of Fig. 1 and Fig. 4 highlightsthat the largest impacts occur when the event is centred on
Fig. 3 Spatial density map of the relative probability of a new eventlocation assuming an eruption within the Auckland Volcanic Field,calculated by a kernel smoothing algorithm based on the locations ofpast eruptions (adapted from Bebbington and Cronin (2011))
Fig. 4 Net expected business value added (without adaptation) at riskfrom an Auckland Volcanic Field, Ruaumoko scenario-sized volcaniceruption, by location of event ($NZ2007 million of value added; 1$NZ2007 is ~$US2007 0.65)
10 Put alternatively, Fig. 4 shows, for each individual meshblock in the AVF,the total business inoperability losses, if the Ruaumoko eruption were to occurat the centroid of that meshblock.
Bull Volcanol (2017) 79: 48 Page 7 of 13 48
meshblocks not located within the central business district(CBD), but rather on meshblocks situated near establishedindustrial areas, e.g. Penrose, Onehunga, Otahuhu, and EastTamaki. It is important to note again that these results includeonly business inoperability and, thus, do not include directeconomic losses due to damage of assets, where the CBDwould likely dominate any property value assessment.
Applying the DIIM across all meshblocks in the AVF, themaximum inoperability loss experienced over the 1-year studyperiod, was around $NZ2007 10.8 billion ($US2007 7.0 bil-lion)11 or just on one quarter of the 2007 Auckland regiongross value added.12 By comparison, the average inoperabilityloss over the same period across all meshblocks is estimated tobe $NZ2007 4.6 billion ($US2007 3.0 billion).13 This analysisand the Ruaumoko Business Group responses illustrate thatmanufacturing businesses are particularly vulnerable to a vol-canic event, due to their limited ability to adapt and the longtimeframes required for relocation of plant and labour to re-sume production activities. Added to this are the high level ofinterconnections between manufacturing businesses and otheractivities within the regional economy. Furthermore,manufacturing industries’ plants and machinery are often de-signed to operate at 70% or above of their normal productionrate (Exercise Ruaumoko Business Group, personalcommunication, 2008), with lower production rates generallynot possible or are very difficult to achieve.
Economic activity at risk without business mitigationsand adaptations
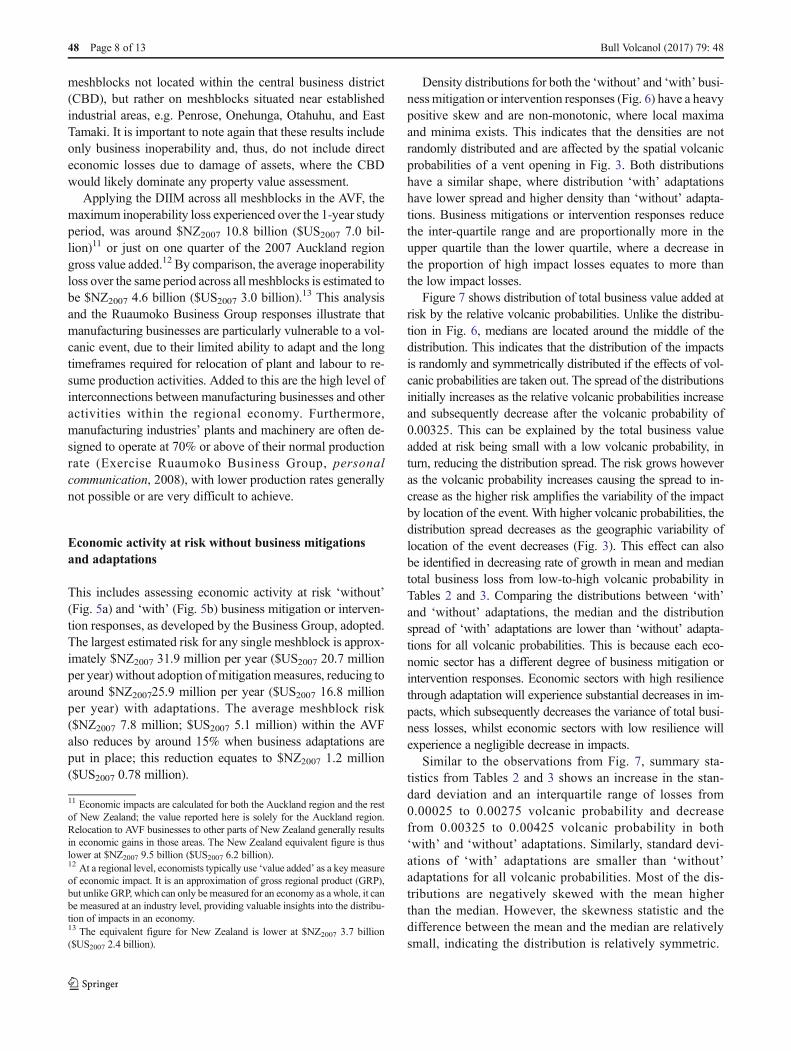
This includes assessing economic activity at risk ‘without’(Fig. 5a) and ‘with’ (Fig. 5b) business mitigation or interven-tion responses, as developed by the Business Group, adopted.The largest estimated risk for any single meshblock is approx-imately $NZ2007 31.9 million per year ($US2007 20.7 millionper year) without adoption ofmitigationmeasures, reducing toaround $NZ200725.9 million per year ($US2007 16.8 millionper year) with adaptations. The average meshblock risk($NZ2007 7.8 million; $US2007 5.1 million) within the AVFalso reduces by around 15% when business adaptations areput in place; this reduction equates to $NZ2007 1.2 million($US2007 0.78 million).
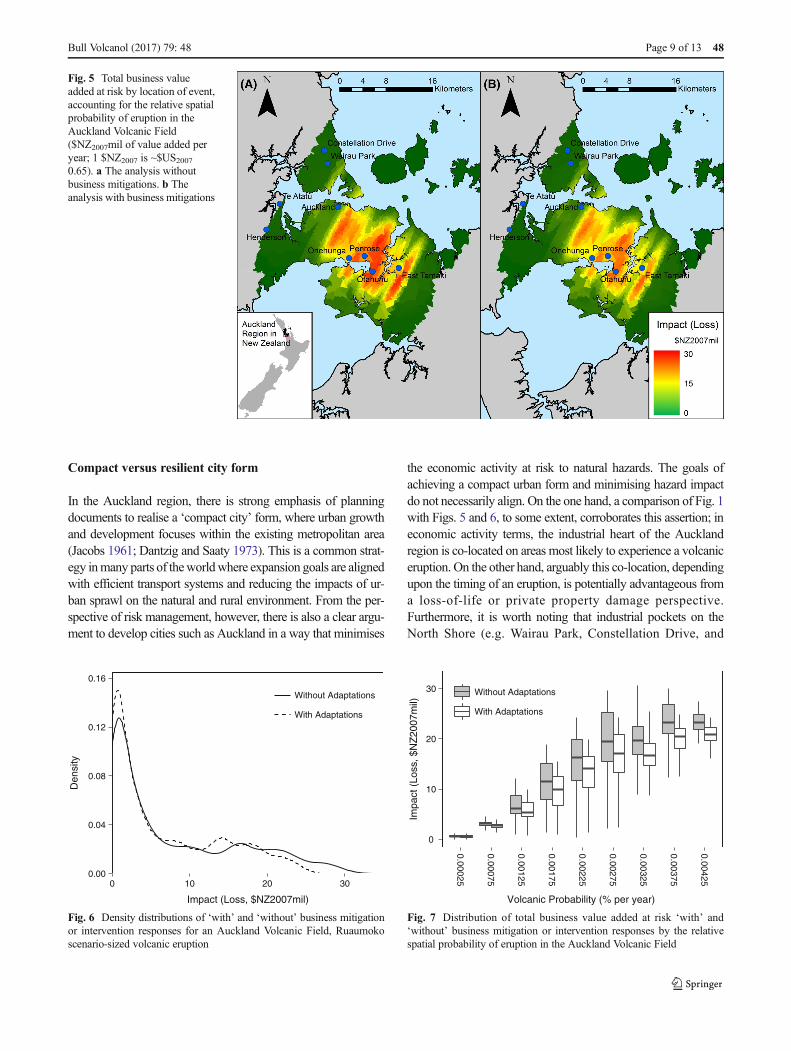
Density distributions for both the ‘without’ and ‘with’ busi-ness mitigation or intervention responses (Fig. 6) have a heavypositive skew and are non-monotonic, where local maximaand minima exists. This indicates that the densities are notrandomly distributed and are affected by the spatial volcanicprobabilities of a vent opening in Fig. 3. Both distributionshave a similar shape, where distribution ‘with’ adaptationshave lower spread and higher density than ‘without’ adapta-tions. Business mitigations or intervention responses reducethe inter-quartile range and are proportionally more in theupper quartile than the lower quartile, where a decrease inthe proportion of high impact losses equates to more thanthe low impact losses.
Figure 7 shows distribution of total business value added atrisk by the relative volcanic probabilities. Unlike the distribu-tion in Fig. 6, medians are located around the middle of thedistribution. This indicates that the distribution of the impactsis randomly and symmetrically distributed if the effects of vol-canic probabilities are taken out. The spread of the distributionsinitially increases as the relative volcanic probabilities increaseand subsequently decrease after the volcanic probability of0.00325. This can be explained by the total business valueadded at risk being small with a low volcanic probability, inturn, reducing the distribution spread. The risk grows howeveras the volcanic probability increases causing the spread to in-crease as the higher risk amplifies the variability of the impactby location of the event. With higher volcanic probabilities, thedistribution spread decreases as the geographic variability oflocation of the event decreases (Fig. 3). This effect can alsobe identified in decreasing rate of growth in mean and mediantotal business loss from low-to-high volcanic probability inTables 2 and 3. Comparing the distributions between ‘with’and ‘without’ adaptations, the median and the distributionspread of ‘with’ adaptations are lower than ‘without’ adapta-tions for all volcanic probabilities. This is because each eco-nomic sector has a different degree of business mitigation orintervention responses. Economic sectors with high resiliencethrough adaptation will experience substantial decreases in im-pacts, which subsequently decreases the variance of total busi-ness losses, whilst economic sectors with low resilience willexperience a negligible decrease in impacts.
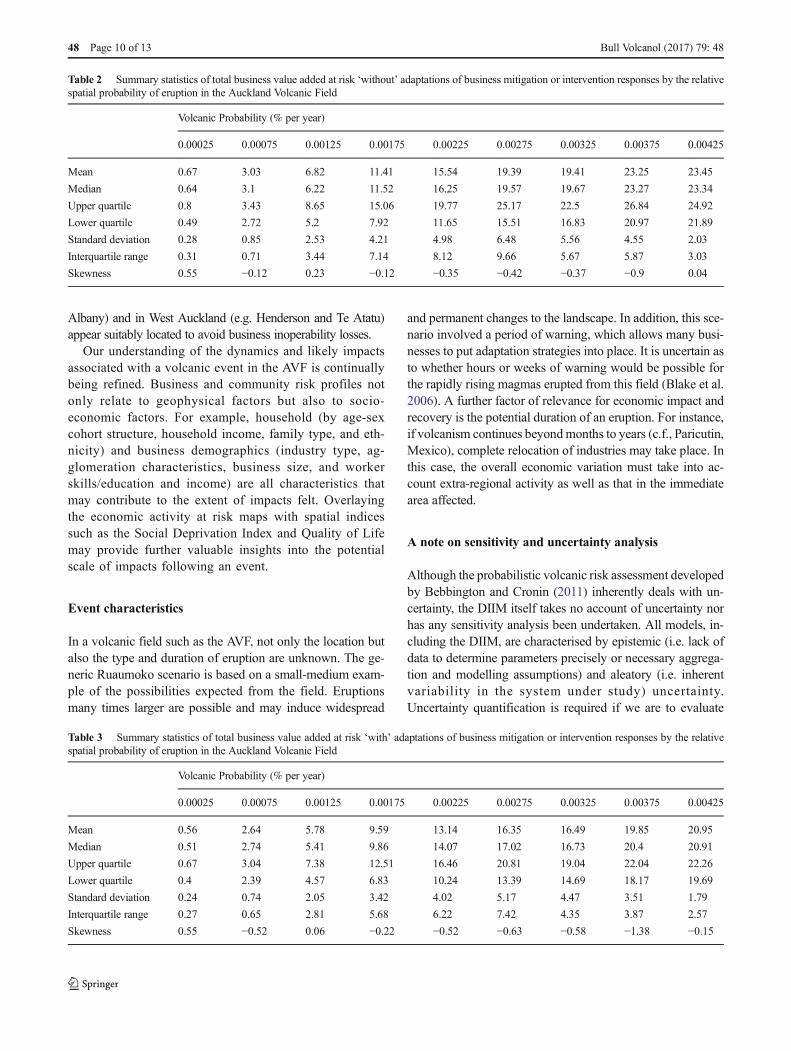
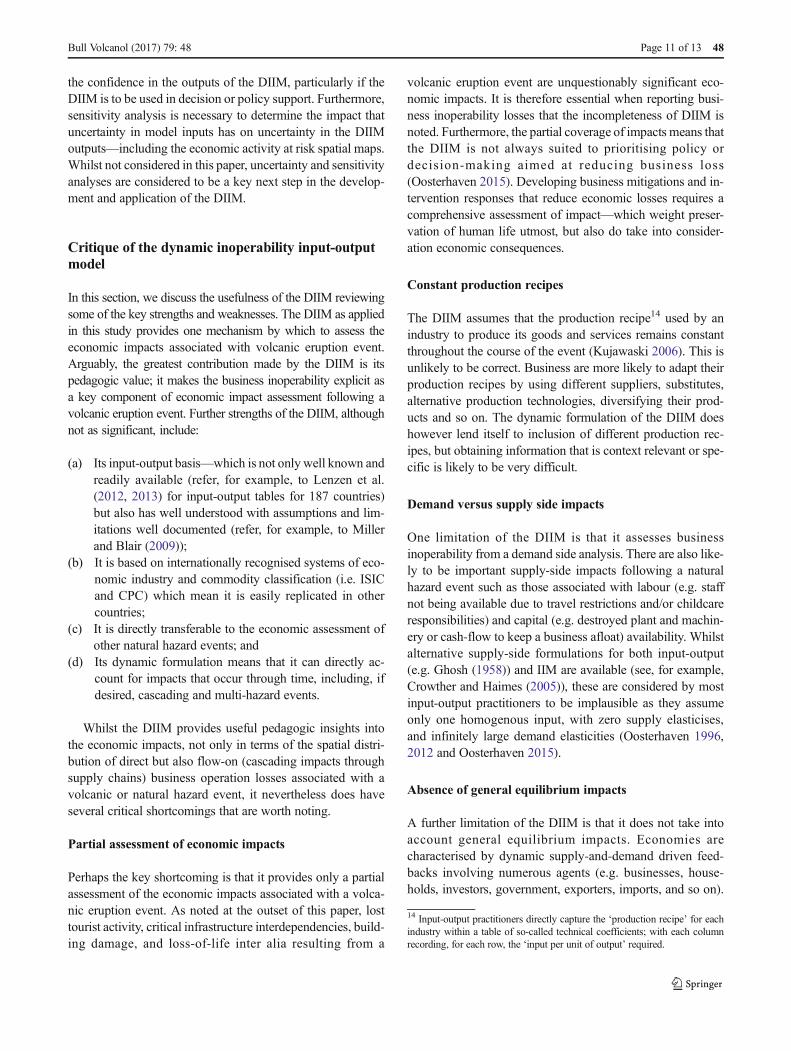
Similar to the observations from Fig. 7, summary sta-tistics from Tables 2 and 3 shows an increase in the stan-dard deviation and an interquartile range of losses from0.00025 to 0.00275 volcanic probability and decreasefrom 0.00325 to 0.00425 volcanic probability in both‘with’ and ‘without’ adaptations. Similarly, standard devi-ations of ‘with’ adaptations are smaller than ‘without’adaptations for all volcanic probabilities. Most of the dis-tributions are negatively skewed with the mean higherthan the median. However, the skewness statistic and thedifference between the mean and the median are relativelysmall, indicating the distribution is relatively symmetric.
11 Economic impacts are calculated for both the Auckland region and the restof New Zealand; the value reported here is solely for the Auckland region.Relocation to AVF businesses to other parts of New Zealand generally resultsin economic gains in those areas. The New Zealand equivalent figure is thuslower at $NZ2007 9.5 billion ($US2007 6.2 billion).12 At a regional level, economists typically use ‘value added’ as a key measureof economic impact. It is an approximation of gross regional product (GRP),but unlike GRP, which can only be measured for an economy as a whole, it canbe measured at an industry level, providing valuable insights into the distribu-tion of impacts in an economy.13 The equivalent figure for New Zealand is lower at $NZ2007 3.7 billion($US2007 2.4 billion).
48 Page 8 of 13 Bull Volcanol (2017) 79: 48
Compact versus resilient city form
In the Auckland region, there is strong emphasis of planningdocuments to realise a ‘compact city’ form, where urban growthand development focuses within the existing metropolitan area(Jacobs 1961; Dantzig and Saaty 1973). This is a common strat-egy inmany parts of theworldwhere expansion goals are alignedwith efficient transport systems and reducing the impacts of ur-ban sprawl on the natural and rural environment. From the per-spective of risk management, however, there is also a clear argu-ment to develop cities such as Auckland in a way that minimises
the economic activity at risk to natural hazards. The goals ofachieving a compact urban form and minimising hazard impactdo not necessarily align. On the one hand, a comparison of Fig. 1with Figs. 5 and 6, to some extent, corroborates this assertion; ineconomic activity terms, the industrial heart of the Aucklandregion is co-located on areas most likely to experience a volcaniceruption. On the other hand, arguably this co-location, dependingupon the timing of an eruption, is potentially advantageous froma loss-of-life or private property damage perspective.Furthermore, it is worth noting that industrial pockets on theNorth Shore (e.g. Wairau Park, Constellation Drive, and
Fig. 5 Total business valueadded at risk by location of event,accounting for the relative spatialprobability of eruption in theAuckland Volcanic Field($NZ2007mil of value added peryear; 1 $NZ2007 is ~$US20070.65). a The analysis withoutbusiness mitigations. b Theanalysis with business mitigations
0
10
20
30
0.00025
0.00075
0.00125
0.00175
0.00225
0.00275
0.00325
0.00375
0.00425
Volcanic Probability (% per year)
Impa
ct (
Loss
, $N
Z20
07m
il)
Without Adaptations
With Adaptations
Fig. 7 Distribution of total business value added at risk ‘with’ and‘without’ business mitigation or intervention responses by the relativespatial probability of eruption in the Auckland Volcanic Field
0.00
0.04
0.08
0.12
0.16
0 10 20 30
Impact (Loss, $NZ2007mil)
Den
sity
Without Adaptations
With Adaptations
Fig. 6 Density distributions of ‘with’ and ‘without’ business mitigationor intervention responses for an Auckland Volcanic Field, Ruaumokoscenario-sized volcanic eruption
Bull Volcanol (2017) 79: 48 Page 9 of 13 48
Albany) and in West Auckland (e.g. Henderson and Te Atatu)appear suitably located to avoid business inoperability losses.
Our understanding of the dynamics and likely impactsassociated with a volcanic event in the AVF is continuallybeing refined. Business and community risk profiles notonly relate to geophysical factors but also to socio-economic factors. For example, household (by age-sexcohort structure, household income, family type, and eth-nicity) and business demographics (industry type, ag-glomeration characteristics, business size, and workerskills/education and income) are all characteristics thatmay contribute to the extent of impacts felt. Overlayingthe economic activity at risk maps with spatial indicessuch as the Social Deprivation Index and Quality of Lifemay provide further valuable insights into the potentialscale of impacts following an event.
Event characteristics
In a volcanic field such as the AVF, not only the location butalso the type and duration of eruption are unknown. The ge-neric Ruaumoko scenario is based on a small-medium exam-ple of the possibilities expected from the field. Eruptionsmany times larger are possible and may induce widespread
and permanent changes to the landscape. In addition, this sce-nario involved a period of warning, which allows many busi-nesses to put adaptation strategies into place. It is uncertain asto whether hours or weeks of warning would be possible forthe rapidly rising magmas erupted from this field (Blake et al.2006). A further factor of relevance for economic impact andrecovery is the potential duration of an eruption. For instance,if volcanism continues beyondmonths to years (c.f., Paricutin,Mexico), complete relocation of industries may take place. Inthis case, the overall economic variation must take into ac-count extra-regional activity as well as that in the immediatearea affected.
A note on sensitivity and uncertainty analysis
Although the probabilistic volcanic risk assessment developedby Bebbington and Cronin (2011) inherently deals with un-certainty, the DIIM itself takes no account of uncertainty norhas any sensitivity analysis been undertaken. All models, in-cluding the DIIM, are characterised by epistemic (i.e. lack ofdata to determine parameters precisely or necessary aggrega-tion and modelling assumptions) and aleatory (i.e. inherentvariability in the system under study) uncertainty.Uncertainty quantification is required if we are to evaluate
Table 2 Summary statistics of total business value added at risk ‘without’ adaptations of business mitigation or intervention responses by the relativespatial probability of eruption in the Auckland Volcanic Field
Volcanic Probability (% per year)
0.00025 0.00075 0.00125 0.00175 0.00225 0.00275 0.00325 0.00375 0.00425
Mean 0.67 3.03 6.82 11.41 15.54 19.39 19.41 23.25 23.45
Median 0.64 3.1 6.22 11.52 16.25 19.57 19.67 23.27 23.34
Upper quartile 0.8 3.43 8.65 15.06 19.77 25.17 22.5 26.84 24.92
Lower quartile 0.49 2.72 5.2 7.92 11.65 15.51 16.83 20.97 21.89
Standard deviation 0.28 0.85 2.53 4.21 4.98 6.48 5.56 4.55 2.03
Interquartile range 0.31 0.71 3.44 7.14 8.12 9.66 5.67 5.87 3.03
Skewness 0.55 −0.12 0.23 −0.12 −0.35 −0.42 −0.37 −0.9 0.04
Table 3 Summary statistics of total business value added at risk ‘with’ adaptations of business mitigation or intervention responses by the relativespatial probability of eruption in the Auckland Volcanic Field
Volcanic Probability (% per year)
0.00025 0.00075 0.00125 0.00175 0.00225 0.00275 0.00325 0.00375 0.00425
Mean 0.56 2.64 5.78 9.59 13.14 16.35 16.49 19.85 20.95
Median 0.51 2.74 5.41 9.86 14.07 17.02 16.73 20.4 20.91
Upper quartile 0.67 3.04 7.38 12.51 16.46 20.81 19.04 22.04 22.26
Lower quartile 0.4 2.39 4.57 6.83 10.24 13.39 14.69 18.17 19.69
Standard deviation 0.24 0.74 2.05 3.42 4.02 5.17 4.47 3.51 1.79
Interquartile range 0.27 0.65 2.81 5.68 6.22 7.42 4.35 3.87 2.57
Skewness 0.55 −0.52 0.06 −0.22 −0.52 −0.63 −0.58 −1.38 −0.15
48 Page 10 of 13 Bull Volcanol (2017) 79: 48
the confidence in the outputs of the DIIM, particularly if theDIIM is to be used in decision or policy support. Furthermore,sensitivity analysis is necessary to determine the impact thatuncertainty in model inputs has on uncertainty in the DIIMoutputs—including the economic activity at risk spatial maps.Whilst not considered in this paper, uncertainty and sensitivityanalyses are considered to be a key next step in the develop-ment and application of the DIIM.
Critique of the dynamic inoperability input-outputmodel
In this section, we discuss the usefulness of the DIIM reviewingsome of the key strengths and weaknesses. The DIIM as appliedin this study provides one mechanism by which to assess theeconomic impacts associated with volcanic eruption event.Arguably, the greatest contribution made by the DIIM is itspedagogic value; it makes the business inoperability explicit asa key component of economic impact assessment following avolcanic eruption event. Further strengths of the DIIM, althoughnot as significant, include:
(a) Its input-output basis—which is not only well known andreadily available (refer, for example, to Lenzen et al.(2012, 2013) for input-output tables for 187 countries)but also has well understood with assumptions and lim-itations well documented (refer, for example, to Millerand Blair (2009));
(b) It is based on internationally recognised systems of eco-nomic industry and commodity classification (i.e. ISICand CPC) which mean it is easily replicated in othercountries;
(c) It is directly transferable to the economic assessment ofother natural hazard events; and
(d) Its dynamic formulation means that it can directly ac-count for impacts that occur through time, including, ifdesired, cascading and multi-hazard events.
Whilst the DIIM provides useful pedagogic insights intothe economic impacts, not only in terms of the spatial distri-bution of direct but also flow-on (cascading impacts throughsupply chains) business operation losses associated with avolcanic or natural hazard event, it nevertheless does haveseveral critical shortcomings that are worth noting.
Partial assessment of economic impacts
Perhaps the key shortcoming is that it provides only a partialassessment of the economic impacts associated with a volca-nic eruption event. As noted at the outset of this paper, losttourist activity, critical infrastructure interdependencies, build-ing damage, and loss-of-life inter alia resulting from a
volcanic eruption event are unquestionably significant eco-nomic impacts. It is therefore essential when reporting busi-ness inoperability losses that the incompleteness of DIIM isnoted. Furthermore, the partial coverage of impacts means thatthe DIIM is not always suited to prioritising policy ordecision-making aimed at reducing business loss(Oosterhaven 2015). Developing business mitigations and in-tervention responses that reduce economic losses requires acomprehensive assessment of impact—which weight preser-vation of human life utmost, but also do take into consider-ation economic consequences.
Constant production recipes
The DIIM assumes that the production recipe14 used by anindustry to produce its goods and services remains constantthroughout the course of the event (Kujawaski 2006). This isunlikely to be correct. Business are more likely to adapt theirproduction recipes by using different suppliers, substitutes,alternative production technologies, diversifying their prod-ucts and so on. The dynamic formulation of the DIIM doeshowever lend itself to inclusion of different production rec-ipes, but obtaining information that is context relevant or spe-cific is likely to be very difficult.
Demand versus supply side impacts
One limitation of the DIIM is that it assesses businessinoperability from a demand side analysis. There are also like-ly to be important supply-side impacts following a naturalhazard event such as those associated with labour (e.g. staffnot being available due to travel restrictions and/or childcareresponsibilities) and capital (e.g. destroyed plant and machin-ery or cash-flow to keep a business afloat) availability. Whilstalternative supply-side formulations for both input-output(e.g. Ghosh (1958)) and IIM are available (see, for example,Crowther and Haimes (2005)), these are considered by mostinput-output practitioners to be implausible as they assumeonly one homogenous input, with zero supply elasticises,and infinitely large demand elasticities (Oosterhaven 1996,2012 and Oosterhaven 2015).
Absence of general equilibrium impacts
A further limitation of the DIIM is that it does not take intoaccount general equilibrium impacts. Economies arecharacterised by dynamic supply-and-demand driven feed-backs involving numerous agents (e.g. businesses, house-holds, investors, government, exporters, imports, and so on).
14 Input-output practitioners directly capture the ‘production recipe’ for eachindustry within a table of so-called technical coefficients; with each columnrecording, for each row, the ‘input per unit of output’ required.
Bull Volcanol (2017) 79: 48 Page 11 of 13 48
In general equilibrium theory, households seek to maximisetheir utility within their budgetary constraints, whilst busi-nesses seek to maximise profit subject to their productiontechnologies (Hosoe et al. 2010). Markets, in turn, seek toequilibrate supply and demand through pricing mechanismswhich enable the above desires to be achieved. As notedabove, the DIIM only considers the demand side of this dy-namic and as such tends to overestimate the economic impactsas supply-side dynamics are overlooked or omitted.
Conclusions
In many urban areas of the world, where volcanoes are co-located with human settlement, the challenges are similar tothose outlined above. The results of this initial research illus-trate the value of having business activities dispersed, ratherthan concentrated, in helping to reduce volcanic risk. In somecases, this may not lead to the most efficient land configura-tion from an asset management, natural resource, and/or trans-port perspective. Land use planning is unavoidably complexand controversial, with the need to tackle these and othertrade-offs. Presently, there is little information availablethrough which planners and other decision makers can evenbegin to take volcanic risk into account in decisions. TheDIIM economic activity at risk maps produced in this studyconstitutes a novel application of the DIIM that supports spa-tial planning in volcanic risk-affected areas.
The DIIM is particularly useful as a pedagogic tool as that itenables assessment of economic activity at risk, extending cur-rent risk assessment from simply loss-of-life and property dam-age estimation, i.e. provides a ‘functional’ lens to damage.Furthermore, the novel at risk maps readily enable planningand policy practitioners to visualise these risks spatially. Finally,there are significant opportunities to build on the DIIM by ex-tending it to incorporate a wider range of impacts includingsupply-side (i.e. labour, capital and resource availability), generalequilibrium impacts (i.e. price dynamics including and factorsubstitution/transformation) and multi-hazard assessment (e.g.combining impacts of, say, seismic, volcanic and fire hazards).With these additions, it is our feeling that the DIIMwill prove aninvaluable addition to the risk assessment toolkit.
Acknowledgements The authors would like to acknowledge theEconomics of Resilience Infrastructure research team for their feedbackon drafts of this paper. The authors are indebted to the Foundation ofResearch, Science and Technology (FRST) and the Ministry ofBusiness, Innovation and Employment (MBIE) for financial assistanceas respectively covered by contract numbers (MAUX0808) and(C05X1205). Finally, the authors would like to thank the anonymousreferees for their valuable comments.
References
AELG (Auckland Engineering Lifelines Group), (2008). ExerciseRuaumoko, Lifelines Sector Notes, a report prepared for theAuckland Engineering Lifelines Group and National EngineeringLifelines Committee. Auckland Engineering Lifelines GroupNational Engineering Lifelines Committee. http://www.civildefence.govt.nz/assets/Uploads/publications/Ruaumoko-lifeline-sector-notes.pdf
Agustín-Flores J, Németh K, Cronin SJ, Lindsay JM, Kerestzuri G, BrandBD, Smith IE (2014) Phreatomagmatic eruptions through unconsol-idated coastal plain sequences, Maungataketake, Auckland VolcanicField (New Zealand). J Volcanol Geotherm Res 276:46–63
Agustín-Flores J, Németh K, Cronin SJ, Lindsay JM, Kereszturi G (2015)The construction of the North Head (Maungauika) tuff cone: a prod-uct of Surtseyan volcanism, rare in the Auckland Volcanic Field,New Zealand. Bull Volcanol 77(2):1–17. doi:10.1007/s00445-014-0892-9
Barker K, Santos JR (2010) Measuring the efficacy of inventory with adynamic input-output model. Int J Prod Econ 126:130–143
Bebbington MS, Cronin SJ (2011) Spatio-temporal hazard estimation inthe Auckland volcanic field, New Zealand, with a new event-ordermodel. Bull Volcanol 73(1):55–72
Blake, S., Smith, I., Wilson, C., & Leonard, G., (2006). Lead times andprecursors of eruptions in the Auckland Volcanic Field, NewZealand: indications from historical analogues and theoreticalmodelling. Consultancy Report 2006/34, GNS Science, LowerHutt, New Zealand.
Cassidy J, Locke C (2010) The Auckland volcanic field, New Zealand:geophysical evidence for structural and spatio-temporal relation-ships. J Volcanol Geotherm Res 176:407–418
Conner CB, Conway FM (2000) Basaltic volcanic fields. In: SigurdssonH, Houghton BF, McNutt SR, Rymer H, Stix J, Ballard RD (eds)Encyclopaedia of volcanoes. Academic, San Diego, CA, pp 331–343
Crowther KG, Haimes YY (2005) Application of the inoperability input-output model (IIM) for systemic risk assessment andmanagement ofinterdependent infrastructures. Syst Eng 8(4):323–341
Dantzig GB, Saaty TL (1973) Compact city: a plan for a liveable urbanenvironment. W. H. Freeman and Co., San Francisco
Ghosh A (1958) Input-output approach in an allocation system. Economica25:58–64
Haimes YY, Horowitz BM, Lambert JH, Santos JR, Lian C, Crowther K(2005a) Inoperability input-output model for interdependent infra-structure sectors. I: Theory and Methodology. J Infrastruct Syst 11:67–69
Haimes YY, Horowitz BM, Lambert JH, Santos JR, Crowther K, Lian C(2005b) Inoperability input-output model for interdependent infra-structure sectors, II: case studies. J Infrastruct Syst 11:80–92
Haimes YY, Jiang P (2001) Leontief-based model of risk in complexinter-connected infrastructures. ASCE J Infrastruct Syst 7(1):1–12
Houghton BF, Bonadonna C, Gregg CE, Johnston DM, Cousins WJ,Cole JW, Del Carlo P (2006) Proximal tephra hazards: recent erup-tion studies applied to volcanic risk in the Auckland volcanic field,New Zealand. J Volcanol Geotherm Res 155(1–2):138–149
Hosoe N, Gasawa K, Hashimoto H (2010) Textbook of computable gen-eral equilibriummodelling: programming and simulations. PalgraveMacmillan, New York
Jacobs J (1961) The death and life of great American cities. RandomHouse, New York
Kereszturi G, Procter JN, Cronin SJ, Németh K, Bebbington M,Lindsay J (2012) LiDAR-based quantification of lava flow sus-ceptibility in the City of Auckland (New Zealand). RemoteSens Environ 125:198–213
48 Page 12 of 13 Bull Volcanol (2017) 79: 48
Kereszturi G, Németh K, Cronin SJ, Procter J, Agustín-Flores J (2014)Influences on the variability of eruption sequences and style transi-tions in the Auckland Volcanic Field, New Zealand. J VolcanolGeotherm Res 286:101–115
Kermode, L.O., (1992). Geology of the Auckland urban area. Scale 1:50000. Institute of Geological and Nuclear Sciences Geological Map2. 1 sheet + 63p. GNS Science, Lower Hutt, New Zealand.
Kujawaski E (2006) Multi-period model for disruptive events in interde-pendent systems. Syst Eng 9:281–295
Leontief W (1951a) Input-output economics. Sci Am 185:15–21LeontiefW (1951b) The structure of the American economy, 1919–1939,
2nd edn. Oxford University Press, New YorkLenzen M, Kanemoto K, Moran D, Geschke A (2012) Mapping the
structure of the world economy. Environ Sci Technol 46(15):8374–8381
Lenzen M, Moran D, Kanemoto K, Geschke A (2013) Building Eora: aglobal multi-region input-output database at high country and sectorresolution. Econ Syst Res 25(1):20–49
Lindsay JM, Marzocchi W, Jolly G, Constantinescu R, Selva J,Sandri L (2010) Towards real-time eruption forecasting in theAuckland Volcanic Field: application of BET_EF during theNew Zealand National Disaster Exercise ‘Ruaumoko’. BullVolcanol 72:185–204
Lindsay JM, Leonard GS, Smid ER, Hayward BW (2011) Age of theAuckland volcanic field: a review of existing data. N Z J GeolGeophys 54:379–401
MCDEM (Ministry of Civil Defence and Emergency Management)(2008) Exercise Ruaumoko '08: Final Exercise Report. AucklandCivil Defence and Emergency Management, Auckland
Miller RE, Blair PD (2009) Input-output analysis: foundations and exten-sions, 2nd edn. Cambridge University Press, Cambridge
Molloy C, Shane P, Augustinus P (2009) Eruption recurrence rates in abasaltic volcanic field based on tephra layers in maar sediments:implications for hazards in the Auckland volcanic field. GSA Bull121:1666–1677
Németh K, Cronin SJ, Smith IEM, Agustín-Flores J (2012) Amplifiedhazard of small-volume monogenetic eruptions due to environmen-tal controls, Orakei Basin, Auckland Volcanic Field, New Zealand.Bull Volcanol 74:2121–2137. doi:10.1007/s00445-012-0653-6
Oosterhaven J (1996) Leontief versus Ghoshian price and quantitymodels. South Econ J 62(3):750–759
Oosterhaven J (2012) Adding supply-driven consumption makes theGhosh model even more implausible. Econ Syst Res 24(1):101–111
Oosterhaven, J., (2015). On the Doubtful Usability of the Inoperability IOModel. Research report 15008-EEF. Groningen, The Netherlands;Faculty of Economics and Business, University of Groningen.
Rueda-Cantuche JM, ten Raa T (2009) The choice of model in the con-struction of industry coefficients matrices. Econ Syst Res 21:363–376
Rose A (2004) Economic principles, issues and research priorities inhazard loss estimation. In: Okuyama Y, Chang S (eds) Modelingspatial and economic impacts of disasters. Springer-Verlag, Berlin
Santos JR, Haimes YY (2004) Modeling the demand reduction input-output inoperability due to terrorism of interconnected infrastruc-tures. Risk Anal 24(6):1437–1451
Santos JR, Osri MJ, Bond EJ (2009) Pandemic recovery analysis usingthe dynamic inoperability input-output model. Risk Anal 29:1743–1758
Shane P, Gehrels M, Zawalna-Geer A, Augustinus P, Lindsay J, ChaillouI (2013) Longevity of a small shield volcano revealed by crypto-tephra studies (Rangitoto volcano, New Zealand): change in erup-tive behavior of a basaltic field. J Volcanol Geotherm Res 257:174–183
Shearer C, McDonald G (2008) Exercise Ruaumoko—report of the eco-nomic workgroup: assessment of the impacts of a volcanic eruptionon the Auckland economy. Shearer Consulting Ltd and MarketEconomics Ltd, Auckland
Smith NJ, McDonald GW (2011) Estimation of symmetric input-outputtables: an extension to Bohlin and Widell. Econ Syst Res 23(1):49–72
Smith, N.J., Zhang, Y., Cardwell, R.J., McDonald, G.W., Kim, J.H., &Murray, C.F., (2015). Development of a Regional Social AccountingFramework for New Zealand, ERI Research Report 2015/01, 64p.
Spörli KB, Eastwood VR (1997) Elliptical boundary of an intraplatevolcanic field, Auckland, New Zealand. J Volcanol Geotherm Res79:169–179
Statistics New Zealand (2012) Using national accounts input-output ta-bles. Statistics New Zealand, Wellington
Statistics New Zealand, (2015). Regional Gross Domestic Product: Yearended March 2014. http://www.stats.govt.nz/browse_for_stats/economic_indicators/NationalAccounts/RegionalGDP_HOTPYeMar14.aspx
Valentine GA, Gregg TKP (2008) Continental basaltic volcanoes – pro-cesses and problems. J Volcanol Geotherm Res 177:857–873
Bull Volcanol (2017) 79: 48 Page 13 of 13 48