South Carolina Regional Transmission Planning Stakeholder ...

DRI•WEFA Inc.
The South Carolina Challenge: Regional Economic Analysis
Prepared for: The Palmetto Institute
September 16, 2002

DRI•WEFA Inc.
TABLE OF CONTENTS
I. SUMMARY AND STRATEGIC IMPLICATIONS.................................................................. 1 I.1. STRUCTURE OF THIS REPORT...................................................................................................... 1 I.2. INDUSTRY CLUSTERS.................................................................................................................. 1 I.3. ECONOMIC STRUCTURE IMPLICATIONS....................................................................................... 3 I.4. ECONOMIC FOUNDATIONS .......................................................................................................... 4
II. THE PALMETTO STATE CHALLENGE................................................................................ 6 II.1. OVERVIEW.................................................................................................................................. 6 II.2. INDUSTRY CLUSTERS.................................................................................................................. 6 II.3. CLUSTER ANALYSIS IN ECONOMIC DEVELOPMENT..................................................................... 8 II.4. SYSTEM OF INNOVATION ............................................................................................................ 9
III. REGIONAL ECONOMIC OVERVIEW ................................................................................. 12 III.1. SUMMARY ................................................................................................................................ 12 III.2. GROSS STATE OUTPUT.............................................................................................................. 12 III.3. INDUSTRIAL COMPOSITION ....................................................................................................... 14 III.4. EMPLOYMENT/UNEMPLOYMENT .............................................................................................. 16 III.5. WAGES ..................................................................................................................................... 18 III.6. LABOR FORCE PARTICIPATION.................................................................................................. 20 III.7. DEMOGRAPHICS........................................................................................................................ 21 III.8. TAX REVENUES ........................................................................................................................ 24
IV. SOUTH CAROLINA’S INDUSTRY CLUSTERS................................................................... 26 IV.1. CLUSTER METHODOLOGY......................................................................................................... 26 IV.2. SOUTH CAROLINA’S CLUSTERS AND SEGMENTATION ANALYSIS .............................................. 27 IV.3. CLUSTER STRATEGIES............................................................................................................... 32
IV.3.1. Star Clusters.......................................................................................................................... 32 IV.3.2. Opportunity Clusters............................................................................................................. 33 IV.3.3. Cash Cow Clusters................................................................................................................ 33 IV.3.4. Challenge Clusters................................................................................................................ 34
IV.4. SEED CLUSTERS........................................................................................................................ 35 IV.5. CLUSTER REGIONAL COMPARISON ........................................................................................... 38
V. ECONOMIC FOUNDATIONS................................................................................................. 42 V.1. SUMMARY ................................................................................................................................ 42 V.2. LABOR FORCE SKILLS............................................................................................................... 42 V.3. INFRASTRUCTURE..................................................................................................................... 50 V.4. TECHNOLOGY ........................................................................................................................... 54
V.4.1. Special Focus: South Carolina Technology Assets............................................................... 57 V.5. INVESTMENT CAPITAL .............................................................................................................. 61 V.6. GENERAL BUSINESS CLIMATE .................................................................................................. 63 V.7. QUALITY OF LIFE ...................................................................................................................... 66
APPENDIX 1 – CLUSTER COMPOSITION TABLE.......................................................................... 67
APPENDIX 2 – SOUTH CAROLINA’S TECHNOLOGY ASSETS ................................................... 71
APPENDIX 3 – DETAILED QUALITY OF LIFE INDICATORS...................................................... 72
APPENDIX 4 - EXAMPLE OF CLUSTER DEVELOPMENT IN CONNECTICUT ....................... 76
GLOSSARY OF TERMS........................................................................................................................... 77

DRI•WEFA Inc. 1
Summary and Strategic Implications
I.1. Structure of This Report The purpose of this study is to provide a fresh integrated review of where South Carolina is today, the characteristics of its “portfolio” of industry clusters, and the current condition of the state’s economic foundations – its workforce, regulatory environment, infrastructure, and technology assets.
A study like this is not meant to be an end in itself. It is meant to simply serve as a base of shared information to stimulate positive, collaborative action-oriented discussions among the people, businesses, and political leaders of South Carolina. Each action or step taken as a result of these discussions may seem individually modest, but taken together they will move the state more rapidly along a path to a higher standard of living.
The study is organized into four core chapters:
�� Chapter II provides an introduction to the basic framework of the study with a focus on cluster-based economic development thinking and the role of innovation.
�� Chapter III provides an objective review of South Carolina’s position in the country based on an analysis of economic data and DRI•WEFA’s forecasts over the next few years.
�� Chapter IV identifies and characterizes South Carolina’s industry clusters.
�� Chapter V provides an assessment of the state’s economic foundations.
This section is designed to emphasize the purpose of the study which is to provide information and analysis to stimulate collaborative action among all the relevant players in South Carolina. The most important findings of the study in each area are discussed along with the consequent implications and some recommended strategic directions.
I.2. Industry Clusters This study has identified a portfolio of industry clusters in South Carolina that collectively make up 30% of the state’s economy. These are comprised of a group of established industry clusters as well as a group of emerging or potential “seed clusters.” The seed clusters are further segmented into two categories. Commercially-based seed clusters are those that have a measurable level of private sector commercial activity within South Carolina. Technology-based seed clusters are those that are based on the existence of associated technology assets with the state. These technology assets generally consist of public and private R&D establishments.

DRI•WEFA Inc. 2
Table 1 South Carolina’s Clusters
Established Clusters Commercially-based Seed Clusters
Technology-based Seed Clusters
Apparel Components & Sub-Assemblies Food & Agriculture Forestry, Wood, and Paper Machinery & Fab. Metals Materials Professional Services Textiles Tourism Transportation Equipment Transportation Services
Advanced Materials Software, Hardware, & Internet
Nanotechnology (materials & electronic) Environmental Science Horticulture & Related Defense & Related Pharmaceuticals
There is some evidence of naturally formed clusters in South Carolina. However, these clusters are overwhelming concentrated in slow-growing industries. With a few exceptions, there is little evidence that the companies and economic foundation providers within these clusters have established a vision of themselves as being part of a cluster community dedicated to fostering growth and overcoming barriers within their industry cluster. In addition, of the seed clusters identified in this study, only two of them have strong commercial operations, while the remaining five are currently only based on existing technology assets identified in the state.
As it now stands, South Carolina cannot compete vigorously in the new, knowledge-based economy with this mix of industries and this quality of economic foundations. A two-pronged approach, designed to improve foundations, especially education, and to diversify South Carolina’s industries, needs to be fostered. One of the best ways to do this is to establish cluster initiatives that will drive their industry forward.
Recommendation: Establish Cluster Working Groups
♦ South Carolina needs to take a deliberate approach to clustering. Clustering is the act of pro-actively accelerating the process of creating institutions that provide needed economic infrastructure and strengthening linkages between networks of firms and these institutions. The first step is to establish collaborative cluster group that includes both significant public and private collaboration and academic representation. These working groups can identify common problems and barriers to industry growth, cooperate on initiatives of mutual interest, identify expansion, attraction and retention goals, and establish linkages within and among clusters.
Recommendation: Develop Cluster Strategies
♦ After each cluster working group is formed, they need to begin a process of strategic discussions. These sessions should identify cluster components, evaluate the market and technology trends for the cluster, define the target or niche markets (agree on a vision), benchmark best practices, and put these together to develop a cluster

DRI•WEFA Inc. 3
strategy; initiatives, select champions, and write “business plans” that outline concrete action initiatives they will champion.
Recommendation: Capitalize on State R&D
♦ South Carolina needs to capitalize on the intellectual research being performed in the state. One seed cluster (advanced materials) already exhibits strong and growing linkages between corporate research and development and commercialization. The challenge remains for South Carolina to further develop linkages between its technology assets and both the existing and seed clusters within South Carolina. Areas to encourage are material science, biochemistry, and environmental science/engineering. These R&D specialties are related to most of the existing clusters within South Carolina. Focusing on three R&D areas provides diversification in research, while allowing a focussed path for resources.
Recommendation: Foster Connectivity
♦ South Carolina needs to foster connectivity between clusters to drive economic performance. Old economy linkages may foster new economy links. For example, industrial manufacturing may help support the development of an environmental technologies cluster, together with the technology assets in the state, which can link back to other manufacturing industries such as wood and paper products as well as the specialized services cluster.
I.3. Economic Structure Implications The economic overview chapter of this study points to a state that, while it is growing, has been unable to close the gap with many of its neighbors or other leading growth states. South Carolina’s current position is based on a set of mature or declining industry clusters like basic materials, textiles, and automotive assembly and a relative advantage in labor costs and taxation.
Key indicators such as gross state product and average hourly earnings highlight the state's relatively weak performance. In addition, it is clear that the state is already a low tax haven – ranked 45th of all the states in terms of per capita state tax revenue and 33rd in terms of state taxes as a share of personal income.
South Carolina’s low labor force participation rate is of particular concern and is a key factor behind the state’s low rankings in terms of per capita gross domestic product. This is a problem in its own right in that getting more people to work will mean higher incomes. In addition, it is an indicator of the relatively underdeveloped nature of the state’s work force. Compounding this dynamic is a reduced supply of 25 to 34 year olds, both in absolute terms and in relation to growth of this demographic cohort in the rest of the country. Competition for investment dollars is increasingly being based on access to a high-quality skilled and flexible labor force. The development of more vibrant industry clusters will be built on a foundation of improvements in the quantity and quality of the available work force.
Recommendation: Increase Skilled Labor Pool
♦ A low labor force participation rate and shrinking young demographic cohort are pressuring the skilled labor availability. Focus on initiatives to increase the labor force participation rate, mainly via improvements in education with a focus on

DRI•WEFA Inc. 4
remedial and continuing education. Take advantage of general migration trends to market South Carolina as a destination for young professionals, emphasizing the good quality of life and relatively low taxes.
I.4. Economic Foundations The following points summarize the assessment of South Carolina’s economic foundations:
Labor Force Skills—South Carolina’s educational system lags behind its benchmark states in terms of quality, availability of high-quality research-centered institutions, and access to financial support. There is evidence that South Carolina is already taking steps to improve the inputs in its educational system, however, the results of these changes will take many years to materialize.
Access to Capital—Investment capital is caught in a negative cycle in South Carolina. A dearth of good investment opportunities in the state has stunted the growth of venture capital businesses. In turn, as a result of limited investment funding, businesses with good opportunities for investment have difficulty accessing the necessary capital. Business formation in South Carolina appears stagnant.
Technology—R&D funding and activity is low in the state, in terms of both government sponsored and corporate initiatives.
Infrastructure—Several of South Carolina’s infrastructure indicators provide positive support to its overall development. For example, in terms of geographical proximity, South Carolina is well positioned for the market place. The state, however, is at a disadvantage as its information technology infrastructure is less adequate than the benchmark states.
General Business Climate—The cost of doing business in South Carolina is favorable—operating costs are relatively low.
Quality of Life—On average, South Carolina rates well in terms of “quality of life”. The low cost of living relative to average earnings is a key positive contributor to the state’s quality of life.
The most important finding of the study is that South Carolina’s educational system lags behind its benchmark states in terms of quality and access to financial support. While South Carolina has already begun to improve some long-term issues, it will also need to address a skilled labor shortage in the short-term.
Recommendation: Pursue Excellence in Education
Long-Term Goals ♦ Mandatory course work at primary/elementary level -- strive to improve verbal,
math, and science skills foundation. ♦ Set up remedial sessions whereby top-scoring students help others for extracurricular
credits. ♦ Consolidate institutions of higher learning and improve quality and standards of
colleges and universities.

DRI•WEFA Inc. 5
♦ Transform some colleges or universities to focus on vocational or technical training that specifically correlate to the industry clusters and workforce requirements needed within the state.
♦ Coordinate higher education priorities at a state level. Establish industry partnerships between colleges and universities. Target key R&D areas that link to industry clusters in the state.
Short-Term Goals ♦ Encourage labor-force training. ♦ Develop a more comprehensive endowed-chair program to attract top academics to
teach at colleges and universities.
Growing pains are a fact of life in the New Economy. At some point, every entrepreneur needs flexible financial support. Business formation has been limited in South Carolina, and investment capital disbursements are low. Low total lending, however, may just be a reflection of the dearth of company start-ups.
Recommendation: Market the Availability of Financing
♦ Ensure that entrepreneurs are aware of the financing and venture capital options available in South Carolina.
♦ Establish a Small Business Investment Corporation (SBIC) within South Carolina. ♦ Offer one year tax holidays or discounts to new small businesses in their first year of
establishment. ♦ Consider outreach to retiree population as a source of financing.
Incorporating technological innovation into the local economy is not done in a vacuum. A state’s technological base is what the New Economy is built on. R&D funding and activity is low in South Carolina, in terms of both government sponsored and corporate initiatives.
Recommendation: Encourage Corporate R&D
♦ Offer tax incentives to companies for R&D conducted in the state, and raise the reward if R&D is conducted in the state in conjunction with a local university.
Well-maintained infrastructure is key for economic development. Several of South Carolina’s infrastructure indicators provide positive support to its overall development. For example, in terms of geographical proximity, South Carolina is well positioned for the market place. The state, however, is at a disadvantage as its IT infrastructure is less adequate than the benchmark states.
Recommendation: Focus on Key Infrastructure Needs
♦ Improve public transportation from rural areas to major urban centers. ♦ Invest in IT/communication infrastructure.
The New Economy is built on human capital, raising the importance of a region’s quality of place. Human resource departments must recognize, and deal with, the role quality of life plays in all career decisions. On average, South Carolina rates well in terms of “quality of life”. The low cost of living relative to average earnings and climate are key positive contributors to the state’s quality of life.

DRI•WEFA Inc. 6
Recommendation: Diversify and Market South Carolina’s Quality of Life
♦ South Carolina can market its quality of life as a major incentive for recruiting businesses and encouraging expansions. The work force of a company stands to benefit from South Carolina’s amenities.
♦ In tandem with possible tourism cluster initiatives, focus on broadening the array of cultural and recreational opportunities in the state. Such opportunities are an important quality of life dimension, especially for knowledge workers.
II. The Palmetto State Challenge
II.1. Overview South Carolina’s current position in the global and national economy is based on a set of mature or declining industry clusters like basic materials, textiles, and automotive assembly and a relative advantage in labor costs and taxation. It is time for the state to move to the next level of development. The positive force behind this message is that the people of the state are ready and the benefits will be a higher quality of life. The negative impetus is that a wide range of regions around the world are ready to start competing even more vigorously for South Carolina’s market position. This could ultimately mean a decline in South Carolina’s relative quality of life.
South Carolina needs to start emulating the performance of other successful states and regions around the country rather than adopting a backward looking defense of the state’s current competitive position. While it is up to the people and businesses of the state to figure out exactly how to do this, there is an evolving economic development framework that can provide some guidance. Part of this framework involves the development of stronger industry clusters and the associated networks that connect businesses with one another as well as sources of technology, governments, and social, cultural, and educational institutions. Another key element of the framework is the development of a more vigorous system of innovation in the state.
II.2. Industry Clusters A cluster is a grouping of leading firms, suppliers and the economic infrastructure that supports them. These three elements can work together which, in turn, makes each individually stronger. These groups of similar businesses are important to a regional economy because, unlike single companies or plants, together they create more jobs and are better able to adapt to market changes over time. The “clustering effect” happens when many similar firms and their suppliers locate near each other in and around a region. This clustering results in the growth of a specialized set of capabilities—skills, technologies, business services—that is more than the sum of its parts.

DRI•WEFA Inc. 7
Figure 1 Cluster Dynamics Contribute to Regional Goals
Working togetherWorking together
HumanResources Technology Investment
CapitalBusinessClimate
Infrastructure
Economic Infrastructure
Network ofSupplier Firms
Firms supplying inputs, raw materials,parts, components and services.
LeadingFirmsKey firms
exporting goods andservices out of the region.
REGIONAL GOALS
Prosperous Industries Rising Real Incomes More Quality Jobs
Industry clusters are more about day-to-day relationships among companies that attract them to an area, than they are about any one firm. Cluster companies often compete against each other, at the same time they share many similar inputs, such as workforce skills, the region’s technology infrastructure, marketing services, or transportation.
Clusters play a key role in making a regional economy more dynamic and adaptable. A strong economic infrastructure creates a more dynamic economy and attracts investment. Each element of the virtuous cycle supports the other elements. Further strengthening South Carolina’s economic infrastructure and clusters will lead to a stronger virtuous cycle in South Carolina.
Figure 2 Virtuous Cycle of Cluster Development
Dynamic Clusters
Higher IncomesMore Exports
More Jobs
StrongEconomic
Infrastructure
Investment
An adaptive economic region has many clusters. Like an investment portfolio, a range of clusters provides economic diversity for people who live in the region. A targeted development

DRI•WEFA Inc. 8
strategy aimed at building on what currently exists in the region could help develop greater diversity and stronger linkages of companies to their cluster and the region.
II.3. Cluster Analysis in Economic Development Cluster analysis is considered a “best practice” tool in formulating economic development strategies. The approach was first developed in the early 1990s, and was popularized by Michael Porter in the book The Competitive Advantage of Nations. Research and experience has taught economic development academics and institutions that companies located within a cluster are more competitive than if they exist independently. Moreover, the existence of a cluster in an area is rapidly becoming one of the key factors in company location decisions. Short term incentives such as tax rebates or low-cost facilities are no longer the only criteria a company will consider. Instead, the existence of a cluster – which means that a company will have access to the capital, appropriate education institutions, existence of a talent pool, infrastructure, and proximity to buyers and sellers – are much more important to a company’s success in the long term. Thus, a region becomes the most competitive if it has the clusters that produce and attract more competitive companies. Competitiveness thus become one key measure of a region’s ability to generate higher output – for example, growth, income, revenues – from a given increase in investment.
But how does a region obtain a cluster? While clusters can develop naturally, they can also be aided by specific development strategies. Natural clusters include the automotive cluster in Detroit, the entertainment industry in Hollywood, and the information technology industry in Silicon Valley. Understanding the benefits of a concentration of similar industries has prompted other regions to encourage cluster development. The development of the Research Triangle cluster in North Carolina is credited as being a direct result of an economic development program. The laser optics cluster in Arizona is an example of a cluster that began naturally, but was enhanced through strategic planning. An agglomeration of professionals and research programs had already begun in Arizona, but there were limited linkages when the cluster was first identified. The Arizona Strategic Plan for Economic Development helped identify weaknesses in the cluster and develop specific strategies to improve the cluster1. Intervention can foster cluster growth by eliminating restricting barriers and providing a strategy for successful growth.
On the other side, clusters can also disappear over time if they do not maintain their competitive advantage. For example, an outflow of entertainment and media companies from Hollywood in recent years, due to crime, poor neighborhood quality, and deteriorating physical infrastructure, is concerning many within the cluster. A cluster working group has now been formed to include both government and businesses in efforts to address these problems and retain the cluster’s competitiveness.
The beneficial effects of industry clusters in regional economic development has attracted national attention. In December 2001, the National Clusters of Innovation Conference was held in Washington D.C., to present the findings of a two year study on the ability of regional clusters to act as catalysts for mobilizing competitiveness and innovation. The conference was co-sponsored by the Council on Competitiveness and the National Governors Association. The Council of Competitiveness is chaired by executives from leading companies and academic institutions, including MIT, Harvard University, BellSouth, and Merck & Company. The National Governors Association is dedicated to developing and disseminating information about
1 “The Lustre of Clusters”, Plants Sites and Parks, February /March 1998.

DRI•WEFA Inc. 9
best practices in governance and state policy challenges. The report published by the Council on Competitiveness, U.S. Competitiveness 2001, examines economic growth in the U.S. over the past decade and assesses the factors behind it, evaluates the strengths and weaknesses of key components of the economy (similar to this study’s “economic foundations”), and details several innovation policy priorities. One of these priorities is that the U.S. needs to strengthen regional clusters of innovation to remain competitive in a global setting.
Cluster policies have been used in European industrial policy for many years. The approach is also gaining momentum in the United States. States that have used cluster analysis as a key component of formulating economic development strategy include:
Arizona California Colorado Connecticut Florida Georgia Iowa Louisiana
Massachusetts Minnesota Mississippi Missouri New Mexico New York North Dakota North Carolina Oregon Pennsylvania Tennessee Virginia Utah
Beyond the U.S., cluster analysis is driving the formation of cluster groups in countries across the globe, from Sri Lanka to Mexico, from Australia to Canada, from Singapore to Germany.
II.4. System of Innovation Technology is important in any industry. This role is clear in traditional “high technology” sectors such as electronics, but in agricultural, natural resource and other manufacturing industries, technology is also a critical success factor. Technology can be brought to bear at all points along the “economic value chain”. Figure 3 illustrates this point for the wood products sector. The introduction of new processes into existing productive activities is a primary form of innovation.
Figure 3 Wood Products Economic Value Chain
automatedwarehousing
JIT
logisticsnetworking
telecommunications
EDI
process control/engineering
electronicengineering
instrumentation
woodproperties
wood composite
laser cutting
factoryautomation
temperature &humidity control
design
pulp papertechnology
mouldingtechnology
wood chemistry
wood properties
drying protection
Assembly &Production
R&D MarketingDesign Distribution
Value Added per employeealong the value chain
For a long time, the prevailing perception of the innovation process was that of a linear progression from the research and development (R&D) lab to commercialization. Also, it was regarded primarily as an intra-organizational, rather than an inter-institutional phenomenon.

DRI•WEFA Inc. 10
Research now leaves no doubt that successful innovation arises from interactions among a variety of actors such as competing firms, research institutes, and above all, suppliers and customers.
The linear model of innovation has been used to explain the links between R&D and economic performance. The linear model has three principal variants referred to as science-push, technology-pull and market-pull. It is so highly abstract that it does not really explain the complexities of innovation in a real world. Yet it still informs many policy discussions.
There are numerous flaws with all variants of the linear model. They are all highly stylised and thus do not accurately reflect the way real labs or businesses operate. They focus almost exclusively on the R&D process, thus excluding most of the social, organizational, and financial factors upon which most innovation and economic growth are based. They artificially separate the process of knowledge creation into a series of hermetically sealed activities — basic and applied research, experimental development, design, etc. — that few in research or business would recognize. They have also, at least implicitly, separated scientists, engineers, accountants and marketers and, in so doing, have assumed that each possesses a clear set of discrete, non-transferable and inflexible skills.
Innovation is increasingly seen as the output of inter-organizational networks. For economic policy makers, the main level of analysis for understanding the innovative process is the national level, in which all actors can be seen as part of an economy-wide network.
The system of innovation model emphasizes the interdependence of the different actors in the innovation process and the feedback mechanisms involved. The model is useful as a guide for policy makers in calculating the total impact of decisions on the growth potential of the economy.
For a long time, the principal emphasis in technology policy has been on fostering the generation of knowledge, rather than on its distribution, accessibility, and application. The distinction between these models is of paramount importance for a state like South Carolina that has a path to raise standards of living through technology.
A number of broad characteristics become prominent with the adoption of this approach:
�� Firms are the principal sites for the creation of wealth and cannot be viewed in isolation, but as part of a network of public and private sector institutions whose activities and interactions initiate, import, modify and diffuse new technologies.
�� Linkages (both formal and informal) and the flow of intellectual resources among institutions are important.
�� Learning is a key economic activity.
�� The management and organization of a region’s technology infrastructure is a key determinant of its successful contribution to economic growth.
This model asserts that a region’s economy is more than the simple sum of its firms’ activities, but is rather the result of synergies that arise from the interactions among economic actors in a region. A system of innovation can be considered important because of its distributive power; that is, the system’s ability to distribute existing knowledge for recombination.

DRI•WEFA Inc. 11

DRI•WEFA Inc. 12
III. Regional Economic Overview
III.1. Summary The businesses and people of South Carolina are challenged to map a more defined path through a period of difficult transition to a more prosperous future. An objective review of key economic indicators, such as output per capita, employment, industrial composition, demographics, and annual average wages reveals this challenge.
The data point to a state that continues to move forward but has been unable to close the gap with many of its neighbors or other leading growth states. South Carolina has an urgent need to chart a more defined course. Key indicators such as gross state product and average hourly earnings highlight the state's relatively weak performance.
The data also show the signs of strength that make this challenge less of a pure leap of faith and more a matter of just starting a more deliberate set of incremental steps. Some trends are already working in South Carolina's favor. The main challenges facing South Carolina are how to capitalize on existing strengths to break away from its industrial legacy and re-deploy its resources.
III.2. Gross State Output A key measure of a state’s standard of living is real gross state product (GSP) per capita. This indicator measures the total amount of value-added produced in the state per state resident. South Carolina's real GSP per capita is 20% below the U.S. average and also trails many of its neighbors. Of the states that have been selected as relevant benchmarks, Alabama is the only one whose real GSP per capita lagged the U.S. average by more than South Carolina2. (See Figure 4)
Figure 4 Real Gross State Product per Capita
2002
0
5,000
10,000
15,000
20,000
25,000
30,000
35,000
40,000
Alabam
a
Arizona
Colorado
Georgia
North Caro
lina
Virginia
South Carolin
aU.S.A.
$96
(cha
in w
eigh
ted)
Source: DRI•WEFA Inc.
2 The concepts discussed throughout this document are all analyzed at the state level. Within South Carolina, as in many states, there is great variability around the average state levels and growth rates. This is especially evident when comparing rural regions with urban regions. Many other studies, including Strategic Plan for Economic Development in South Carolina, have examined these differences in detail. Therefore, this report focuses on state-level data to develop a clear picture of the trends of the whole state vis-à-vis other states and the US average.

DRI•WEFA Inc. 13
Furthermore, real GSP growth in South Carolina lagged the U.S. average for all but one year between 1997 and 2002. Consequently, the gap between South Carolina and the rest of the country, in terms of growth in the value of state production, has widened in recent years.
Over the next few years, the gap in growth rates will stabilize. To a large degree, DRI•WEFA’s forecast of real GSP growth is a reflection of the sectoral composition of South Carolina compared to the rest of the U.S. (discussed in more detail below). Manufacturing industries, after years of crushing losses, will enjoy a recovery in growth in the next few years. Meanwhile, sectors such as high-technology industries, who were among the growth leaders at the end of the last decade, will experience a pause in growth and then a gradual recovery over the next five years. The first factor will provide a boost to South Carolina’s economic growth, due to the manufacturing sector’s large share in South Carolina relative to the national average. The second factor will tend to depress U.S. average growth rates more than South Carolina’s, since the state has a lower concentration of high-technology industries than the national average. (See Figure 5) Combined, these two factors lead to the narrowing of the gap in growth rates over the next five years.
While this is a positive development, it does not translate into an improvement in the relative levels of GSP per capita. In 2007, DRI•WEFA forecasts that South Carolina will remain in nearly the same relative position, with a GSP per capita that is 21% below the U.S. average. In addition, the conditions that have led to the improvement in the GSP growth gap are not sustainable. A recovery in many of the high growth industries, particularly high-tech industries, is expected by the end of the forecast period, while long term growth in manufacturing is uncertain. Indeed, as seen in Figure 5, even by 2006 and 2007, the gap between South Carolina’s real GSP growth and the U.S. rate begins to widen again.
Figure 5 Real Gross State Product
Annual Growth
0
1
2
3
4
5
6
1997 1998 1999 2000 2001 2002 2003 2004 2005 2006 2007
Ann
ual G
row
th (%
)
South Carolina U.S.A.
Source: DRI•WEFA Inc.
Similar trends are observed when comparing South Carolina with its benchmark states. Between 1997 and 2002, South Carolina's real GSP grew by 3.4% annually. This was considerably slower than the U.S. average of 3.9% per year and all but one of the comparison states: Alabama. Looking ahead, DRI•WEFA forecasts that growth will moderate in the U.S. to an average of 3.0% growth per year. The range of growth rates across benchmark states will narrow, in large part due to the national trends discussed earlier. DRI•WEFA believes that some states, such as Colorado, will experience a much slower recovery in growth compared to their exceptional

DRI•WEFA Inc. 14
growth of the 1990s. South Carolina’s forecast growth rate will continue to lag that of the U.S. average and most of the benchmark states. (See Figure 6)
Figure 6 Real Gross State ProductAverage Annual Growth
0 1 2 3 4 5 6
Alabama
Arizona
Colorado
Georgia
North Carolina
Virginia
South Carolina
U.S.A.
Average Annual Growth (%)
1997-2002 2002-2007
Source: DRI•WEFA Inc.
III.3. Industrial Composition Gross state product data draws the picture of the aggregate output of the state. More detailed statistics can shed light on what the main determinants are behind these aggregate output figures. One perspective that can do this is the industrial composition in an economy. Industrial composition examines gross state product from the point of view of the channels of production within a region, through which the combined factors of production (land, labor, capital and technology) operate.
Understanding South Carolina's economic composition goes a long way towards understanding its historical performance, not to mention its growth potential. Naturally, every state should strive to expand its activities in the fast growing industries while phasing out activities in the stagnant industrial segments. Transferring resources from low growth industries to high growth industries is the best way to guarantee future prosperity. With this end in mind, the first step is to see how the composition of South Carolina's economy differs from the U.S. average.
The biggest differences in economic composition between South Carolina and the U.S. economy are found in four segments: manufacturing, government, services and FIRE (finance, insurance and real estate). The manufacturing and government sectors are "over-represented" in South Carolina relative to the nation as a whole. Conversely, the services and FIRE sectors are "under-represented" in South Carolina. Whether this turns out to be a good thing for South Carolina or a bad thing depends on the future growth of these sectors. (See Figure 7)

DRI•WEFA Inc. 15
Figure 7 Economic Composition
Share of Real GSP in 2002
9.1
6.7
6.4
7.5
18.1
17.0
14.2
19.5
11.8
13.9
14.6
11.4
11.9
16.9
19.8
15.1
8.8
9.3
9.6
8.3
23.9
20.3
18.1
22.6
16.4
15.9
17.4
15.7
0 20 40 60 80 100
Best Practice States
Neighbor States
South Carolina
U.S.A.
Share of Real GSP (%)
Extraction/Construction FIREGovernment ManufactureTransport/Comm/Utility ServicesTrade
Source: DRI•WEFA Inc.
Neighbor States: Virginia, North Carolina, Georgia & Alabama Best Practice States: Arizona & Colorado
Unfortunately for South Carolina, the two sectors with the slowest growth between 1997 and 2002, manufacturing and government, are over-represented in the state's economy. To make matters worse, the two sectors with the widest under-representation in South Carolina, services and FIRE, grew at a much faster rate than the national average. This type of industry analysis is a first step towards understanding why South Carolina trails the U.S. in real GDP per capita growth. (See Figure 8) Over the forecast period, DRI•WEFA believes that the nation will experience a short-term cyclical rebound in manufacturing. While this will indeed benefit South Carolina as long as this cycle lasts, growth in manufacturing is expected to still lag far behind growth in the services industry.
Figure 8 U.S.A. Real Gross Domestic Product by Industry
Average Annual Growth
0 1 2 3 4 5 6 7
Extraction/Construction
FIRE
Govt
Manufacturing
Transport/Comm/Util
Services
Trade
Total GDP
Average Annual Growth (%)
1997-2002 2002-2007
Source: DRI•WEFA Inc.

DRI•WEFA Inc. 16
III.4. Employment/Unemployment Another way to disaggregate the total output of a state is to examine its factors of production. The labor force is one of the most important contributors to South Carolina’s economic growth. South Carolina's employment growth has been positive over the past five years, but a little inconsistent. This is due in part to the relatively small size of South Carolina's employed workforce. South Carolina accounts for 1.4% of total employment in the US; the smallest share among all of the benchmark states. The relatively small size of South Carolina's labor force amplifies the impact of the normal flow of business expansions or closures in any state. Figure 9 illustrates the greater volatility of employment growth in South Carolina as compared to the US.
Figure 9 Employment
Annual Growth
-2
-1
0
1
2
3
4
1997 1998 1999 2000 2001 2002 2003 2004 2005 2006 2007
Ann
ual G
row
th (%
)
South Carolina U.S.A.
Source: DRI•WEFA Inc.
Employment grew by 1.3% annually in South Carolina, compared to 1.5% across the entire US, between 1997 and 2002. This employment growth gap widens dramatically when South Carolina is compared to the two fastest growing states in the group: Arizona and Colorado. Here the historical employment growth gap widens to over 1 percentage point. Alabama is the weakest state in the group, with historical employment growth well below that of South Carolina.
Recent employment growth in South Carolina has been disappointing compared to the 1990s. The Strategic Plan for Economic Development found that South Carolina actually outpaced the U.S. in terms of employment growth between 1990 and 1998: 1.8% for South Carolina vs. 1.2% for the nation. However, the situation was reversed over the 1997-2002 period with employment growth in the state lagging the national average: 0.7% for South Carolina vs. 1.0% for the nation.
South Carolina's employment growth relative to the benchmark states has also slipped a little since the 1990s. The Strategic Plan found that employment growth was approximately 1.8% per year for both South Carolina and the average of the eight comparison states (Georgia, Florida, North Carolina, Tennessee, Virginia, Alabama, Mississippi and Kentucky) between 1990 and 1998. In contrast, employment growth in South Carolina lagged the average of the six comparison states used in this report during the 1997-2002 period: 0.7% for South Carolina vs. 1.3% for the benchmark states (Georgia, North Carolina, Virginia, Alabama, Colorado and Arizona).
Looking ahead, DRI•WEFA forecasts that employment growth in South Carolina will slightly outpace the U.S. average, with growth of 1.6% per year between 2002 and 2007, compared to U.S. growth of 1.3% per year. The service sector in South Carolina has a been the most

DRI•WEFA Inc. 17
consistent source of employment gains in over the past five years, taking a breather only in 2001; this will continue to be the source of nearly two-thirds of employment gains in the state. DRI•WEFA expects a slight boost above normal in service sector employment gains in 2003 and 2004 in South Carolina, which will give the state a slight advantage compared to the U.S. growth rate over the forecast period. Benchmark states will experience employment gains much more in line with the national average, with Arizona, Georgia, and Colorado leading in employment growth. (See Figure 10)
Figure 10 Employment
Average Annual Growth
0.0 0.5 1.0 1.5 2.0 2.5 3.0
Alabama
Arizona
Colorado
Georgia
North Carolina
Virginia
South Carolina
U.S.A.
Average Annual Growth (%)
1997-2002 2002-2007
Source: DRI•WEFA Inc.
Figure 11 Unemployment Rate
0.0
1.0
2.0
3.0
4.0
5.0
6.0
1997 1998 1999 2000 2001 2002 2003 2004 2005 2006 2007
Une
mpl
oym
ent R
ate
(%)
South Carolina U.S.A.
Source: DRI•WEFA Inc.
In terms of joblessness, South Carolina's unemployment rate equaled the national average over the past five years. Few people would point to an unemployment rate of 4.6% as sign of weakness. However, the unemployment rate was lower than the national average in all of the benchmark states, except for Alabama, over the same period. In other words, South Carolina might not be living up to its full potential. Turning our attention to the future, DRI•WEFA believes that South Carolina's unemployment rate will creep up to 5.2%, marginally below the
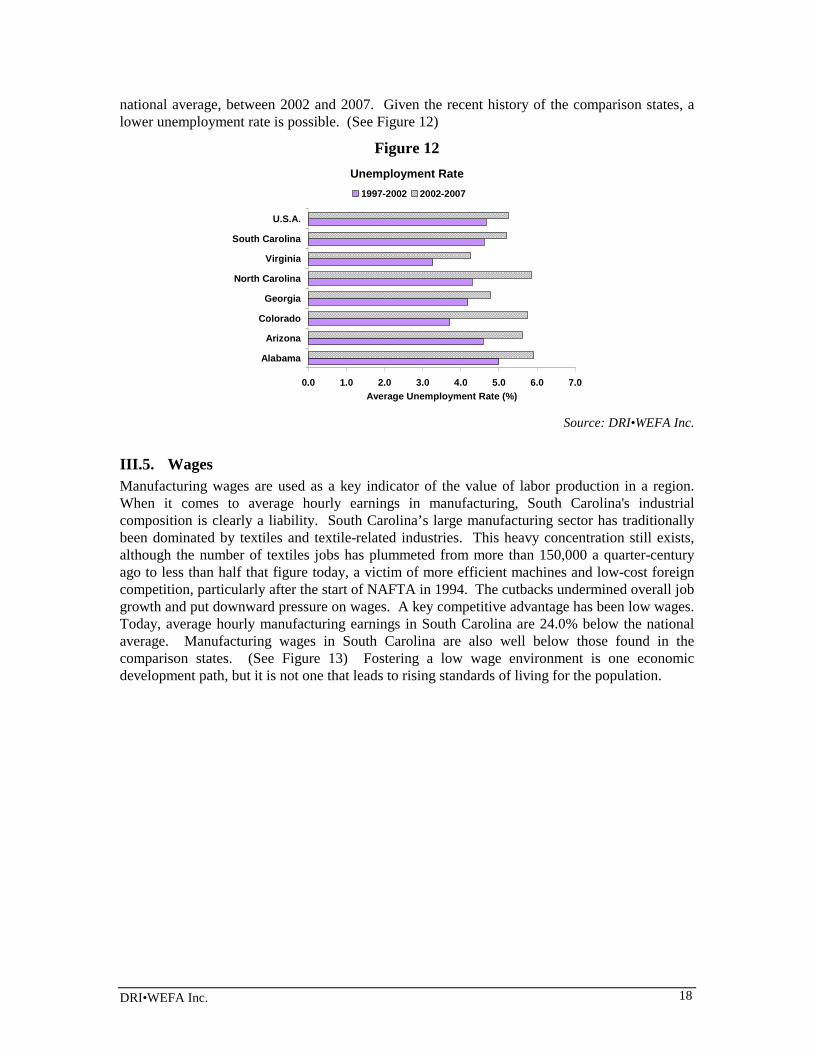
DRI•WEFA Inc. 18
national average, between 2002 and 2007. Given the recent history of the comparison states, a lower unemployment rate is possible. (See Figure 12)
Figure 12 Unemployment Rate
0.0 1.0 2.0 3.0 4.0 5.0 6.0 7.0
Alabama
Arizona
Colorado
Georgia
North Carolina
Virginia
South Carolina
U.S.A.
Average Unemployment Rate (%)
1997-2002 2002-2007
Source: DRI•WEFA Inc.
III.5. Wages Manufacturing wages are used as a key indicator of the value of labor production in a region. When it comes to average hourly earnings in manufacturing, South Carolina's industrial composition is clearly a liability. South Carolina’s large manufacturing sector has traditionally been dominated by textiles and textile-related industries. This heavy concentration still exists, although the number of textiles jobs has plummeted from more than 150,000 a quarter-century ago to less than half that figure today, a victim of more efficient machines and low-cost foreign competition, particularly after the start of NAFTA in 1994. The cutbacks undermined overall job growth and put downward pressure on wages. A key competitive advantage has been low wages. Today, average hourly manufacturing earnings in South Carolina are 24.0% below the national average. Manufacturing wages in South Carolina are also well below those found in the comparison states. (See Figure 13) Fostering a low wage environment is one economic development path, but it is not one that leads to rising standards of living for the population.

DRI•WEFA Inc. 19
Figure 13 Average Hourly Earnings in Manufacturing
2002
0.002.004.006.008.00
10.0012.0014.0016.0018.00
Alab
ama
Ariz
ona
Colorad
o
Geo
rgia
North
Carolin
a
Virg
inia
South Caro
lina
U.S.A.
Ave
rage
Hou
rly E
arni
ngs
($)
Source: DRI•WEFA Inc.
Unfortunately manufacturing earnings in South Carolina are also growing slower than the rest of the nation. Between 1997 and 2002, average hourly earnings grew by 2.8% annually at the national level, compared to 2.2% for South Carolina. The growth gap was even wider relative to the benchmark states. Even Alabama recorded stronger earnings growth than South Carolina (albeit marginally). According to DRI•WEFA’s forecasts, there will be a moderately higher growth rate in manufacturing earnings in South Carolina over the next five years, as the state has attracted some higher-paying manufacturing sectors such as auto plants. However, with similar strategies being pursued in neighboring states, South Carolina will be in much the same relative position five years from now. (See Figure 14)
Figure 14 Average Hourly Earnings in Manufacturing
Average Annual Growth
0.0 1.0 2.0 3.0 4.0 5.0
Alabama
Arizona
Colorado
Georgia
North Carolina
Virginia
South Carolina
U.S.A.
Average Annual Growth (%)
1997-2002 2002-2007
Source: DRI•WEFA Inc.
The Strategic Plan for Economic Development in South Carolina (SPED) pointed out that South Carolina's manufacturing sector is undergoing a significant transformation. Lower wage jobs in the textiles, apparel, food processing, wood and furniture industries are being lost. Higher wage jobs are being created in the chemicals, industrial machinery, transportation equipment, paper and primary metals industries. This is a promising sign, but we are still waiting for hard

DRI•WEFA Inc. 20
evidence of faster wage growth - the associated disruption in the labor market has kept aggregate wage gains in check.
III.6. Labor Force Participation A labor force participation rate is the measure of the utilization rate of the potential pool of labor in a region. Using the Bureau of Labor Statistics definition, it is measured as the percentage of the civilian non-institutionalized population aged 16 and over that are employed or actively seeking employment. A low participation rate can indicate a limitation on the rate at which GSP can grow, since there is a small utilization of labor. A low participation rate will also tend to reduce GSP per capita, since the output of a fewer amount of workers must be used to support a higher amount of non-workers.
Changes in the labor force participation rate are also important. A falling participation rate means that people who could be working are leaving the workforce. This will cause the unemployment rate to fall, not through the creation of new jobs but rather through a reduction of the workforce. The question becomes, why are people dropping out of the workforce? A declining participation rate is a good sign if people are choosing to go into early retirement because they can afford to do so. But a declining participation rate can also mean that people are being forced into early retirement unwillingly. Or worse, it could also mean that people with perhaps marginal or redundant skills are too discouraged to look for work and are simply abandoning the workforce.
South Carolina's labor force participation rate has remained relatively steady since the early 1990s — that is, until recently. The participation rate stayed in an average range of 66 - 67%, dipping below during troughs in the business cycle in 1994 and 1996. Since 1999, however, the participation rate has fallen sharply, reaching a low of 63.5% in 2001 that has not been seen in over a decade. (See Figure 15)
The recent decline is worth closer examination. The gradual erosion of the state's traditional manufacturing base has undoubtedly forced many workers into retirement or otherwise out of the labor force against their will. Moreover, weak educational attainment across the state might reflect a certain nervousness about future employment opportunities. Only those who see a long-term payoff to education are willing to commit to years of study. Indeed, low basic education attainment may also contribute to the low labor force participation rate. According to the National Center for Education Statistics, South Carolina’s high school graduation rate dropped from 61% in 1990 to 51% in 2000. Without basic skills needed for employment, many younger adults may simply be dropping out of the labor force. While the drop in these graduation rates does not prove that the discouraged worker problem exists, it does raise a red flag.

DRI•WEFA Inc. 21
Figure 15 Labor Force Participation Rate
60%
61%
62%
63%
64%
65%
66%
67%
68%
69%
1997 1998 1999 2000 2001 2002 2003 2004 2005 2006 2007
Part
icip
atio
n R
ate
(%)
South Carolina USA
Source: DRI•WEFA Inc.; Bureau of Labor Statistics
Indeed, South Carolina’s participation rate has lagged the national average and several of the benchmark states over the last five years. In particular, the growing gap between South Carolina’s participation rate and the national average over the last three years is a cause for concern. South Carolina will be hard pressed to close the GDP per capita gap mentioned earlier if its labor force participation rate continues to lag the national average. Unfortunately, DRI•WEFA expects the gap between South Carolina's participation rate and the rest of the country to widen over the next five years. (See Figure 15 and Figure 16)
Figure 16 Average Labor Force Participation Rate
58% 60% 62% 64% 66% 68% 70% 72% 74%
Alabama
Arizona
Colorado
Georgia
North Carolina
Virginia
South Carolina
USA
Participation Rate (%)
1997-02 2002-07
III.7. Demographics The labor force in a state is determined by the interaction between its population and its labor force participation rate. Having examined the participation rate, the next link is to examine population growth. Population grows both through natural means as well as through migration. At its most fundamental level, employment growth is constrained by the amount of population growth in a region. At the same time, a labor force must also support those segments of the population that are (in aggregate) not part of the labor force – those under 15 or those over 65.

DRI•WEFA Inc. 22
A key issue for South Carolina is the interaction between demographic trends and human resource requirements. The baby boom generation is disproportionately large relative to the entire population. Right now they are fully engaged in the workforce and in the most economically productive years of their lives. But the baby boom generation is also closing in on retirement. People have been surging into the 45-54 age cohort and, more recently, the 55-64 age cohort. It is this latter cohort that will see increasing rates of retirement. This potential impending exodus from the workplace will make labor productivity gains all the more important for states looking to improve their standards of living over the next 10 years. Fewer workers will have to produce more in order to improve the overall standard of living. Real GDP growth will depend more than ever on labor productivity gains. (See Figure 17)
Figure 17 Population Growth by Age CohortAverage Annual Rate 1997-2002
-1.0
0.0
1.0
2.0
3.0
4.0
0 - 4 5 - 14 15 - 24 25 - 34 35 - 44 45 - 54 55 - 64 65 +Age Cohort
Ann
ual G
row
th R
ate
(%)
South Carolina U.S.A.
Total Population:South CarolinaU.S.A
Source: DRI•WEFA Inc.
Having a motivated, highly skilled local workforce has always been a competitive advantage. This makes the 25-to-44 years of age cohort particularly important. At the lower end of this range are the recent graduates from college and university, while at the upper end are the young entrepreneurs. South Carolina will need a steady supply of both if it hopes to transform its economy. Unfortunately, DRI•WEFA expects that the 25-to-44 years of age cohort will be growing slower than the total population, both in South Carolina and across the nation. This will heighten the competition for exactly the type of human resources that South Carolina needs: young, well-educated professionals and entrepreneurs. Recruiting from out of state to fill any local human resource gaps will be an uphill battle. (See Figure 18)

DRI•WEFA Inc. 23
Figure 18 Population Growth by Age CohortAverage Annual Rate 2002-2007
-1.0
0.0
1.0
2.0
3.0
4.0
0 - 4 5 - 14 15 - 24 25 - 34 35 - 44 45 - 54 55 - 64 65 +Age Cohort
Ann
ual G
row
th R
ate
(%)
South Carolina U.S.A.
Total Population:South CarolinaU.S.A
Source: DRI•WEFA Inc.
But there is one demographic trend that South Carolina can use to its advantage. The postwar flow of domestic migration from the Northeast and Midwest to the Sun Belt was the dominant regional trend of the last half of the 20th century. U.S. Census results for 2001 show that the Sun Belt states of Florida, Arizona, Georgia, Texas and Nevada led domestic in-migration. When it comes to domestic recruiting, this trend is working in South Carolina's favor. Attracting more of these skilled southbound migrants to South Carolina would definitely help ease the state's human resource challenge. (See Figure 19)
The importance of migration to the state was pointed out in The Strategic Plan for Economic Development in South Carolina. According to the report, domestic and international in-migration produced 44% of South Carolina's population gains in the 1990s. Moreover, a disproportionate share of the state's in-migrants were of working age. This supports the position that South Carolina could ease any human resource challenges by tapping into the ongoing migration to the Sun Belt.
The relative importance of in-migration is shown below (See Figure 19). Examining the ratio of new arrivals to existing residents in a given year gives a sense of how large an impact in-migration is having on a particular region. On average, in-migrants accounted for 0.5% of the total U.S. population between 1997 and 2002. In South Carolina, in-migrants had a slightly bigger impact over the same period, accounting for 0.8% of the state's population in any given year. Nevertheless, this impact is small compared to many of the other Sun Belt states. Clearly, South Carolina has a great deal of scope to increase its gains from people moving to the Sun Belt.

DRI•WEFA Inc. 24
Figure 19 Net Annual Migration as Percent of
Current Local Population
-0.5 0.0 0.5 1.0 1.5 2.0 2.5
Alabama
Arizona
Colorado
Georgia
North Carolina
Virginia
South Carolina
U.S.A.
Percent of Local Population
1997-2002 2002-2007
Source: DRI•WEFA Inc.
III.8. Tax Revenues Tax revenues are in a sense both an input and an output of the economy. As most taxes rise with increasing prosperity (through higher personal and corporate income taxes, sales taxes, property taxes), tax revenues are partly determined by the economic health of a region. On the other side of the equation, government spending from these tax revenues should spur economic growth.
South Carolina’s tax revenues are relatively low. In 2001, state taxes in South Carolina averaged $1,513 per person, which ranked 45th in the nation. (See Table 2) Of course, this is partly due to the fact that personal income is lower in South Carolina. When tax revenues are taken as a share of personal income in the state, South Carolina ranked 33rd. Taken another way, while South Carolina’s personal income was 18% below the national average, per capita taxes were 30% below the national average.
South Carolina’s tax burden changes slightly when both state and local taxes are considered. In this case, South Carolina’s ranking of taxes as a share of personal income rises slightly to 29th, indicating that it is slightly less competitive when both state and local taxes are considered. This is especially true when compared to North Carolina, whose rank of tax burden as a share of personal income falls from 23rd for state taxes to 32nd for state and local taxes.

DRI•WEFA Inc. 25
Table 2 State Tax Revenues, 2001
Per Capita State Tax
Revenue ($)
Rank State Taxes as Share (%) of Personal
Income
Rank State & Local Taxes as
Share (%) of Personal Income
Rank
North Carolina 1,909 22 7.2 23 9.8 32 Arizona 1,593 42 6.5 30 10.0 28 South Carolina 1,513 45 6.4 33 9.9 29 Georgia 1,714 35 6.3 34 10.1 25 Alabama 1,426 46 6.1 40 8.9 47 Virginia 1,745 33 5.7 44 9.3 41 Colorado 1,713 36 5.4 46 9.1 44 U.S. Total 1,968 6.7 10.1
Source: U.S. Census Bureau, through Federation of Tax Administrators and Tax Foundation
DRI•WEFA Inc. 26
IV. South Carolina’s Industry Clusters This chapter presents DRI•WEFA’s analysis of South Carolina’s portfolio of industry clusters. The analysis presented assumes an understanding of the analytical framework presented in Chapter II. The chapter starts with a description of the methodology used to identify the state’s clusters, proceeds to a description of the clusters identified, and then presents a way of segmenting the state’s cluster portfolio to guide the development of appropriate development strategies.
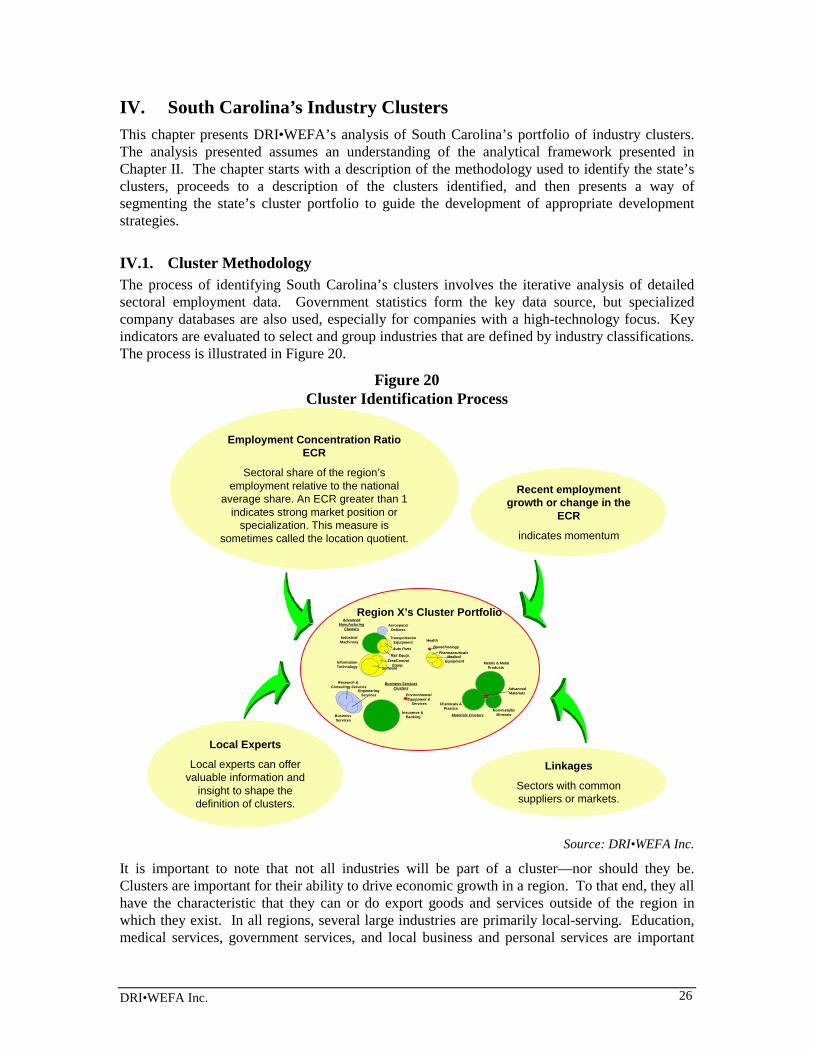
IV.1. Cluster Methodology The process of identifying South Carolina’s clusters involves the iterative analysis of detailed sectoral employment data. Government statistics form the key data source, but specialized company databases are also used, especially for companies with a high-technology focus. Key indicators are evaluated to select and group industries that are defined by industry classifications. The process is illustrated in Figure 20.
Figure 20 Cluster Identification Process
Recent employmentgrowth or change in the
ECR
indicates momentum
AdvancedManufacturing
Clusters
Materials Clusters
Chemicals &Plastics
Metals & MetalProducts
Pharmaceuticals
Health
Medical Equipment
Biotechnology
Non-metallicMinerals
Aerospace/Defense
IndustrialMachinery
TransportationEquipment
InformationTechnology Software
Rail Equip.
Auto Parts
Test/ControlEquip.
AdvancedMaterials
Business ServicesClusters
Insurance & BankingBusiness
Services
Research & Consulting Services
EngineeringServices Environmental
Equipment & Services
Region X’s Cluster Portfolio
Local Experts
Local experts can offervaluable information and
insight to shape thedefinition of clusters.
Employment Concentration RatioECR
Sectoral share of the region’semployment relative to the national
average share. An ECR greater than 1indicates strong market position or
specialization. This measure issometimes called the location quotient.
Linkages
Sectors with commonsuppliers or markets.
Source: DRI•WEFA Inc.
It is important to note that not all industries will be part of a cluster—nor should they be. Clusters are important for their ability to drive economic growth in a region. To that end, they all have the characteristic that they can or do export goods and services outside of the region in which they exist. In all regions, several large industries are primarily local-serving. Education, medical services, government services, and local business and personal services are important

DRI•WEFA Inc. 27
industries, and are often some of the largest employers in a region. However, their focus is usually centered around serving the local population and economy. These industries are therefore more a product of the local economic growth than a cause of it. This is not to say that local-serving industries are not important — indeed, they incorporate some of the most vital services in an area. Nevertheless, the strategies for their development are not the same as cluster strategies. Some of these industries are important in their role as economic foundations, underpinning the basic regional infrastructures that clusters must have in order to develop vibrantly. These foundational industries are discussed in Chapter V.
As can be seen in Figure 21, South Carolina’s cluster portfolio represents about 30% of employment in the state. While this may seem a low share, it actually falls within the normal range of other regions that DRI•WEFA has analyzed.
Figure 21
South Carolina Employment, 2002
Non-Cluster Industries
70%
Cluster Industries
30%
Source: DRI•WEFA Inc.
It is important to note that industry clusters may not fit neatly into political jurisdictions. While some of South Carolina’s clusters may range across the state, others may be concentrated in certain regions of the state. Some clusters may even cross state lines, drawing on resources and markets from neighboring regions outside the state. As stakeholders in a cluster draw together to determine strategic directions for each cluster in the context of South Carolina’s environment, they must take into account the effect of regional issues.
IV.2. South Carolina’s Clusters and Segmentation Analysis Using the methodology described above, analysis reveals that there are 11 established clusters within South Carolina. The size, employment concentration ratio (ECR), and relative growth rates of these clusters are summarized in Table 3. The employment concentration ratio is the share of regional employment due to one sector relative to that sector’s share of national employment; it measures if an industry is more concentrated in a region than it is on a national average. Additional detail on the composition of South Carolina’s clusters is provided in Appendix 1.

DRI•WEFA Inc. 28
Table 3 South Carolina’s Portfolio of Established Clusters
Cluster Names SC Emp. 2002
Employment Concentration
Ratio 2002
SC Emp. Growth 2002-07
U.S. Emp. Growth 2002-07
SC Sales 2002
($Millions)
SC Sales Growth 2002-07
U.S. Sales Growth 2002-07
Apparel 13,925 195.5 - 7.9 - 1.1 1,889.8 - 5.0 0.5 Components & Sub-Assemblies 21,736 119.3 0.5 0.3 6,586.5 13.1 7.5 Food & Agriculture 61,047 75.1 - 0.1 0.2 6,296.4 3.1 3.6 Forestry, Wood, and Paper 34,096 151.3 0.1 - 0.2 8,839.0 4.5 4.0 Machinery & Fab. Metals 47,868 116.5 1.5 0.0 8,546.6 6.9 3.7 Materials 52,414 202.7 0.0 - 0.3 15,645.7 3.8 3.6 Professional Services 40,866 70.6 3.0 2.6 5,134.3 7.1 7.2 Textiles 62,198 1,011.6 - 2.4 - 1.9 9,867.4 - 0.2 0.8 Tourism 218,530 119.6 2.9 1.6 10,070.1 7.0 6.7 Transportation Equipment 24,783 171.6 1.5 - 0.2 9,357.7 6.4 3.3 Transportation Services 48,038 127.0 2.8 1.9 7,475.7 7.1 5.7 Total Cluster 625,566 126.3 1.3 1.1 89,720.8 5.5 4.9 Total All Industries 2,055,083 100.0 1.3 1.1 312,955.1 5.4 5.7
Source: DRI•WEFA Inc.
Economic development strategy formulation can be strengthened by an understanding of the market position of South Carolina’s clusters. One useful means of differentiation is to segment clusters and sectors according to the South Carolina’s competitive market position and the dynamism of their markets. (See Figure 22) This analysis identifies South Carolina’s “Star”, “Cash Cow”, “Opportunity”, and “Challenge” clusters. Understanding the region’s strengths relative to the growth prospects for specific clusters can foster constructive discussion and debate. Figure 23 then uses the framework illustrated in Figure 22 to segment South Carolina’s portfolio of established clusters. Figure 24 provides some additional context for the reader by listing the major companies that are in each cluster.

DRI•WEFA Inc. 29
Figure 22: Cluster Segmentation Analytic Framework
-
20
40
60
80
100
120
140
160
180
200
-2.0% 0.0% 2.0% 4.0% 6.0% 8.0% 10.0%Forecast US Average Annual Growth
Sales 2002-2007
2002
Em
ploy
men
t Con
cent
ratio
n R
atio Stars:
Strong Position in a Dynamic Market
Opportunities:Weaker Position
in a Dynamic Market
Challenges:Weaker Position
in a Slow GrowingMarket
Cash Cows: Strong Position
in a Slow GrowingMarket
Market Position Indicator
Market Dynamism Indicator
Source: DRI•WEFA Inc.

DRI•WEFA Inc. 30
Figure 23: South Carolina’s Established Cluster Portfolio
Apparel
Components & Sub-Assemblies
Transportation Equipment
Forestry, Wood, & Paper
Professional Services
Machinery & Fabricated
Metals
Transportation Services
Materials
Food & Agriculture
Tourism
0
50
100
150
200
250
0 1 2 3 4 5 6 7 8 9U.S. Sales Growth, 2002-2007
Empl
oym
ent C
once
ntra
tion
Rat
io
(US
Ave
rage
=100
)Textiles: 0.8; 328 StarsCash Cows
Challenge Opportunties
Size of Bubble = Level of Employment in 2002Arrows indicate Change in ECR from 1997-2002
Source: DRI•WEFA Inc.

DRI•WEFA Inc. 31
Figure 24: Major Companies within Clusters
Textiles
Prof.Srv.
Trans.Srvs.Trans. Eqt.
Forestry,Wood &Paper
Tourism
Components &Sub-Assemblies
Apparel
Machinery &Fab. Metals
Materials
Gold KistNestle USAAmick ProcessingPerdue Farms
KEMET Corp.AVX Corp.Square DCutler HammerHitachiRockwell AutomationBose Corporation
Springs IndustriesSantee Print Works
International PaperGeorgia PacificSonoco ProductsCompanyWestvacoBowater IncorporatedKimberly-Clark Corp.
Esab Group Inc.Electrolux HomeProductsGeneral ElectricTorringtonConbracoHoneywellCooper Industries
Michelin North AmericaSealed Air Corp.SonocoNucorAlcoaAdvanced GlassfiberNan Ya Plastics Corp.Bayer
Blue Cross/Blue ShieldComputer SciencesCorporationJacobs EngineeringGroupRockwell InternationalCorp. (RockwellAutomation)Blackbaud Inc.
MillikenSprings Industries Inc.Westpoint Stevens Inc.Alice ManufacturingMohawk CarpetMount Vernon MillsGreenwood MillsHoneywell
Michelin North America IncRobert Bosch CorpBMW Manufacturing CorpFederal MogulFreightliner Custom ChassisHonda
Wal-Mart Stores IncStandard CorporationSoutheastern Freight Lines IncOvernite TransportationCompany
Food & Ag.
Burroughs & ChapinWild Dunes ResortCharleston Place HotelKiawah Island GolfTennis Resort
Source: OneSource Inc, South Carolina Department of Commerce

DRI•WEFA Inc. 32
IV.3. Cluster Strategies Developing economic development strategies depends on understanding the market position of South Carolina’s clusters and carefully differentiating the strategies according to the characteristics of the cluster. Segmentation analysis is a procedure pioneered by DRI•WEFA. This section describes and develops implications from the segmentation chart presented in Figure 23.
IV.3.1. Star Clusters Clusters located in the upper right-hand quadrant, “Stars”, represent the most important area of focus for South Carolina. These clusters represent businesses in which South Carolina has some capability, but also ones that will experience above-average growth over the next decade. Clusters in this quadrant have been competitive in markets that continue to hold good future prospects. The state should continue to emphasize these clusters as key sectors for development.
The clusters in this quadrant require strategies that focus on adding new companies and industries that expand the economic value chain in the state (see Figure 3). Building the economic value chain means expanding, attracting and forming new enterprises that provide services from a base in the region that would otherwise be provided by businesses elsewhere. Because of the growth in these clusters, group-recruitment and enterprise formation should be easier than in the other parts of the portfolio. The key for this strategy is understanding markets and using information strategically to help businesses take advantage of opportunities. While strategic investments in physical infrastructure may enhance the performance of these clusters, the true function of investment is to enable other clusters to exploit the advantages that these clusters provide.
Although it is one of the smaller clusters, Components & Sub-Assemblies is highly productive. While employment levels are expected to remain quite even over the next five, years, sales growth will be among the fastest in the clusters. While this cluster has the most obvious potential, it may be weak in terms of the cohesiveness and linkages that are necessary to foster long-term growth in a cluster. Indications are that there are limited linkages between the two main companies in the cluster (AVX and Kemet), mainly due to being located at almost opposite ends of the state and serving different markets. Of the two, Kemet appears to be more anchored in the region with evidence of developing linkages to suppliers and economic foundation partners. Many of the principal companies within this cluster, and indeed within most of South Carolina’s clusters, are branch locations of large national and international firms. Cluster development strategies that seek to connect these company establishments within the framework of South Carolina’s clusters must recognize this and target the local management, to deepen their interest in locating within South Carolina.
Centered on the high-quality services of the port of Charleston, the Transportation Services cluster is expanding to serve as a warehousing and distribution center for the region. Wal-Mart’s significant warehousing and logistics operations are considered an important player in the cluster. While the national market for this cluster is growing at an average rate, South Carolinian companies are expanding at a more rapid pace.
The largest cluster in the state is Tourism. There is no doubt that tourism plays a large role in the economy, but government data may exaggerate employment, since many industries do not distinguish between whether they are local-serving and tourist serving. A recent study estimates that direct employment in Tourism industries was 121,700 in 2001, or 6.1% of total state
DRI•WEFA Inc. 33
employment.3 Despite recent setbacks, the cluster continues to exhibit strong growth trends over the next five years.
As can be seen in the detailed compositional data for the cluster provided in Appendix 1, there is evidence that the strength of the tourism cluster is heavily based on resort related tourism. Low employment concentration ratios in museums, art galleries, theaters, zoos, and botanical gardens indicate opportunities to further develop the more culturally-oriented tourism segment. Such development would also support initiatives to improve the cultural aspects of quality of life which are especially important to knowledge workers.
IV.3.2. Opportunity Clusters “Opportunities” clusters are those in the lower right-hand quadrant of Figure 23. These clusters are facing above-average national demand growth, but have not yet achieved significant mass in the region. For clusters in this quadrant, the objective is to strengthen the relevant economic foundations in South Carolina.
Clusters in this quadrant would benefit from a recruitment and enterprise formation process that would harness existing demand, leading to the creation of new jobs in the region. South Carolina must find ways to create advantages that will enable it to attract new enterprises in these clusters. These advantages take the form of a prepared workforce in growing skills categories, attractive locations, and technically competent suppliers. Further efforts to support start-ups of these industries should be undertaken emphasizing business plans, marketing, and partnerships with established providers in the region. Incubators can provide valuable support to these new enterprises. This part of South Carolina’s portfolio is where it should work to understand market opportunities and to promote itself aggressively.
Only one cluster, the Professional Services cluster, falls within this category. It is comprised of firms specializing in providing professional services–engineering, research, accounting, or management functions. The cluster may be able to draw upon the skills and resources of professional service staff who are located in other industry clusters or educational institutions in the state. This is a key area in which to build development as it can spur growth in other clusters in the state, because firms in this cluster also have a potentially important role as value-added suppliers in addition to being exporters of their services outside the state.
IV.3.3. Cash Cow Clusters The clusters in the upper left-hand quadrant of Figure 23 are the state’s “Cash Cows”. These clusters are the basis of South Carolina’s historical strengths but they are facing slow growing markets. Although these clusters have strong capabilities in the state, the low market attractiveness means that they can either maintain the status-quo, downsize, or transform their focus into new markets. This transformation to new markets will be a successful strategy only if it is based on collaborative action by participants in the cluster, enabling them to collectively refocus their attention on growing markets.
These clusters are assets in a region’s portfolio and require a great deal of investment to achieve a desired level of growth. There has long been extensive employment and specialization in these clusters, but they have had difficulties in competing with other regions and face uncertain global markets. These clusters, of all those in South Carolina’s portfolio, are in the greatest need of undertaking collaborative cluster initiatives that will help them understand market requirements, 3 World Travel & Tourism Council, “South Carolina: The Impact of Travel and Tourism on Jobs and the Economy", 2001.

DRI•WEFA Inc. 34
improve production capabilities, enhance worker productivity, and innovate in marketing and distribution.
Two of the most traditional clusters in South Carolina are the Apparel cluster and the Textile cluster. These fulfill all the classic descriptions of a “cash cow” industry cluster. They are highly concentrated in South Carolina compared to the rest of the nation – Textiles has an employment concentration ratio of more than 1000, and consequently off the scale in the chart in Figure 23. Both have also faced significant declines in sales and employment in recent years. Across the U.S., textiles and apparel companies are shutting their doors and moving to lower-wage countries. This trend is expected to continue over the next five years. Yet, while these clusters are expected to continue their rationalization trends, they represent some of the most cohesive cluster communities, in terms of shared resources, skills, methods of productions, markets, and problems. Strategic collaboration within these clusters may offer the most scope for transforming their identities and characteristics.
One of the most diverse and promising clusters in South Carolina is the Materials cluster. With an employment concentration ratio of 203, it has the second highest concentration ratio of the state’s clusters, and certain industries within the cluster are even more strongly concentrated. The chemicals, plastics, glass, and rubber industries within the cluster already display tight linkages to other clusters in South Carolina and are creating a froth of seed companies.
South Carolina has also benefited from the “New Southern Motown” trend with its Transportation Equipment cluster. The strength of this cluster is not just limited to motor vehicles, but is exhibited in its strong linkages to upstream industries, such as engines and rubber tires. While cluster sales in South Carolina will grow rapidly, the national market is growing more slowly than average.
Another industrial cluster, Machinery & Fabricated Metal Products, exhibits a moderate employment concentration ratio within South Carolina, but is especially strong in industrial machinery. South Carolinian firms are positioned to reap growth at faster rates than the U.S. average. Formulating cluster strategies, especially to promote linkages to other clusters within the state, could accelerate this growth process. In particular, strategies that incorporate linking companies to more advanced manufacturing technologies could help foster niches with “star” potential.
Meanwhile, another primary product cluster, Forestry, Wood, and Paper, is a well integrated cluster, with strong linkages existing along the economic value chain--from forestry to wood products to paper and paperboard. The cluster has a respectable employment concentration ratio of 150, but the national market for these products is growing slowly. Again the question is how to identify and foster faster growing niche development opportunities to help the cluster transform into a more dynamic part of South Carolina’s cluster portfolio.
IV.3.4. Challenge Clusters In the lower left-hand quadrant are the “Challenge” clusters. While these clusters have some strength within South Carolina, they are not a dominant capability compared to other regions. In addition, the traditional markets for these clusters are growing much more slowly than average. Here, the strategic focus should be on catching opportunities that might emerge in the state, such as “spin-offs” from existing companies, or a special case where a firm has “discovered” the region and wants to locate here. Within these clusters, expensive marketing and recruitment programs will not pay off.

DRI•WEFA Inc. 35
One of the larger clusters in terms of size, Food and Agriculture faces slow market growth across the nation. Moreover, the cluster does not exhibit a strong employment concentration ratio in South Carolina compared to the rest of the nation, except for some specialties such as meat products.
IV.4. Seed Clusters The above analysis has focused on “established” clusters within South Carolina. In addition, DRI•WEFA has also identified seven “seed” clusters in South Carolina. Two of these are seed clusters with commercial activities, and five of these clusters are defined primarily on the basis of the existence of “technology assets” within the state. The commercialized seed clusters (see Table 4) are high technology clusters that exhibit company strength and may have strong foundations in South Carolina’s corporate research units. Although they are very small in terms of employment, relative to traditional clusters, they are firmly focused on using advanced technology to develop their products and services. While the tendency may be to equate computers or biotechnology with “high-technology”, in reality, the “New Economy” is driven not so much by new industries as by industries functioning in fundamentally different ways. Not only does this change the dynamics of growth for industries, but it can tap into completely new markets.
The other major category of seed clusters are those that are based on technology assets that exist within the state. Both government and corporate R&D facilities show a concentration in certain research and development areas, some of which are cross-cutting across many industries. The technology asset seed clusters are presented in Table 5.
As with existing clusters, there are other high-technology industries present in South Carolina that are not part of a seed cluster. These industries have not yet demonstrated sufficient critical mass, in terms of employment, number of firms, or linkages to other industries, to be accurately defined as a cluster.
Table 4 Commercial Seed Cluster Employment, 2002
Advanced Materials 10,510 Software, Hardware, & Internet 4,479
Source: CorpTech Inc.
Table 5 Technology Asset-Based Seed Clusters
(Number of R&D Facilities, 2002) Defense & Related R&D 1 Nanotechnology/Electronics 2 Environmental Science 7 Horticulture & Related R&D 4 Nanotechnology/Material Science* 10 Pharmaceuticals 1
*part of the Advanced Materials seed cluster Source: Rand; Company websites; Nexis.com
The Advanced Materials seed cluster contains nearly 50 companies. Like the established Materials cluster, it is very diverse. Companies in the seed cluster produce everything from

DRI•WEFA Inc. 36
advanced textile composites to polyolefin products, specialized chemical compounds & products, and ceramic composite products. The companies show strong linkages to other clusters in the state, both in supplying traditional industries with their advanced technology, and drawing on the skills and resources of the existing clusters to blaze new markets. While total employment in this seed cluster may still be small, the seed cluster is well positioned for growth. There are at least 10 major corporate R&D facilities focusing on various aspects of advanced materials, including the application of these techniques at a nanoscopic level.
Compared to most clusters in South Carolina, the Software, Hardware, & Internet cluster is rather small and somewhat underdeveloped. Most of the firms within this cluster are providing basic Internet or other computer services. There is a very small amount of hardware manufacturing; and some firms that have found niche markets with more targeted software and Internet services. As is typical of this type of cluster, it has a large number of very small firms. There are over 100 firms in this seed cluster in South Carolina, but 80% of these have under 30 employees.
Figure 25: Major Companies within Commercial Seed Clusters
Software,Hardware,& Internet
AdvancedMaterials
Hexcel Corp.BBA NonwovensAtotechCeramTec NorthAmericaZeus IndustrialProducts
Blackbaud Inc.Companion Technologies Corp.SCT Global EnergyComputer DynamicsJobscope Corp.
Source: CorpTech.Inc.
The seed clusters are by and large too small today to significantly influence the South Carolina economy over the short-term, in terms of employment or incomes. But if the linkages between the seed clusters and the existing clusters can be enhanced, these seed industries can become the “engines of growth” for the traditional clusters. Similarly, seed clusters can spur each other onwards through their own linkages. The result can be the swift development of rich clusters, which focus in many directions but are loosely connected to their larger cluster formation. Figure 26 illustrates one potential vision of how this dynamic could unfold in South Carolina.

DRI•WEFA Inc. 37
Figure 26: Future Cluster Transformation From Established & Seed Clusters
Current ClustersCurrent Clusters Future PossibleFuture PossibleSeed ClustersSeed Clusters
Advanced Materials
Apparel
CompositesTextiles
Materials Biochemicals
Nano-Materials
Pharmaceuticals
Biomedical Materials
AdvancedManufacturing
Machinery Robotics
“Smart” CarsTrans. Eqt.
Components Next Generation Components
Nanotechnologies
Environmental Tech.
Advanced Instrumentation
Wood & PaperProducts
Forestry, Wood &Paper Environmental Technologies
Wood FurnitureSpecialty Paper
SpecializedServicesProfessional Srv. Software
Systems Design Engineering
Environmental Consultants
A.I. Design
AdvancedTransportation
Services
Transportation Srv. Intermodal TransportationPort Security Technologies
Logistics
Diverse TourismTourism
Resort
Hunting & Game
“Natural”Cultural
Agri-Food & HorticultureFood & Ag.Environmental Technologies
Specialized Food Products
Biotechnologies
ClustersClustersFutureFuture
Source: DRI•WEFA Inc.

DRI•WEFA Inc. 38
IV.5. Cluster Regional Comparison Comparing cluster structure and performance with other regions is a valuable diagnostic tool. The position of competing regions can provide benchmarks that help stimulate economic development strategy formulation. The strength of a cluster within a given region can be indicated by its size, its employment concentration ratio within a region, or by the rate at which it is growing. DRI•WEFA has combined these measurements to create a Cluster Power Index (all growth forecasts referred to below are from DRI•WEFA). While these three types of indicators are commonly used to evaluate a cluster, the weighted combination of these indicators to create a single index that ranks cluster strength throughout the U.S. is unique to DRI•WEFA.
With the clusters defined as they exist in South Carolina, every state in the United States has been measured using this index. This reveals the biggest competitors to South Carolina in each of its clusters. Figure 27 reports the top five competitors for South Carolina in each of its clusters. It is interesting to note that, except in the traditional clusters of textiles and apparel, very few of South Carolina’s immediate neighbors are competitors to its clusters. This is both an opportunity and a challenge. Within the southeast region, South Carolina can position itself as a specialty in these clusters. However, the local clusters will also have to work harder to develop their own linkages, when there are few other local centers to tie into.
Among South Carolina’s Star clusters, the Tourism cluster exhibits the most strength compared to its competitors. South Carolina ranked 5th in the Cluster Power Index. With the heavy weighting of the tourism industry in Nevada’s economy, as well as its rapid growth, that state earns first rank. The large tourism sector in California and Florida put them also in the top tier. While both of the next two states, Colorado and South Carolina, do not have either the largest tourism sectors or the highest concentration of tourism in the state economy, they do have significantly-sized tourism markets that will experience very rapid growth over the next five years.
The Components & Sub-Assemblies cluster turns up in some unexpected places. All of the top five states except California have a small cluster size, but these clusters are quite concentrated in their state’s employment and are experiencing rapid growth. Of course, the sheer size of this industry cluster in California leads it to a substantial competitive position. South Carolina ranks rather low in Cluster Power in this cluster, with a ranking of only 23rd in the nation. While this cluster holds much promise for the future, it is also the one that has the most intense competition. Cluster participants must be mindful of the competition when designing strategies for this cluster. South Carolina’s Transportation Cluster is centered around its water transportation services, but it also includes warehousing and trucking and courier services. The combination of these industries shifts the competitor mix. South Carolina ranks fifth in the nation in terms of the employment concentration ratio of its water transportation industry. In a broader cluster, however, it ranks 15th. The size and concentration of trucking and courier industries in competitor states give them a higher Cluster Power Index. Hence, Tennessee, supported by the Federal Express hub, ranks first in this Cluster Power.
The Opportunity cluster of Professional Services reveals a few surprises as well. Large markets such as California and Washington DC top the list, but New York state is only 5th, with the surprising states of Florida and Nevada preceding it. While not at the top of any one scale, Florida’s cluster is reasonably large, reasonably concentrated, and growing at an above average pace. Hitting all three criteria lands it in 3rd place. Although quite small, the spectacular growth of Nevada’s Professional Services cluster also pulls it into the top tier of Cluster Power Index. South Carolina ranks relatively low in this sector, with a rank of 30.
South Carolina is relatively competitive among all its Cash Cow clusters, ranking in the top 15 states in six out of seven of the clusters. Both the Apparel and Textiles cluster face their greatest competition

DRI•WEFA Inc. 39
among neighboring states. The Machinery & Fabricated Metals cluster, Transportation Equipment cluster, and Materials cluster are largely dominated by the industrial heavyweights of Michigan, Ohio, and Indiana. Other competitors are also making their mark. Oregon is a new entry to the Transportation Equipment cluster, showing dramatic growth over the next few years, according to DRI•WEFA forecasts. Kentucky is also among the top five, giving further evidence of the migrating Motown effect. South Carolina has its lowest competitive position in the Forestry, Wood & Paper cluster.
Benchmark competitors for South Carolina’s sole Challenge cluster, Food and Agriculture, underscore the market position of this cluster in South Carolina. All of the top five states in this cluster exhibit a dominance in employment concentration and/or size. In comparison, South Carolina ranks 40th in the nation in terms of the competitiveness of its cluster.

DRI•WEFA Inc. 40
Figure 27: Top Five Benchmark States for South Carolina’s Clusters
Apparel Cluster Index Rank Machinery Cluster Index Rank Tourism Cluster Index RankCalifornia 100.0 1 Michigan 100.0 1 Nevada 100.0 1New York 77.9 2 Ohio 95.3 2 California 71.3 2Alabama 70.0 3 Wisconsin 86.2 3 Florida 67.3 3Mississippi 60.1 4 California 79.9 4 Colorado 61.7 4Kentucky 58.8 5 Illinois 78.9 5 South Carolina 58.2 5South Carolina 52.0 12 South Carolina 58.4 14 South Carolina 58.2 5
Components Cluster Index Rank Materials Cluster Index Rank Trans. Eqt. Cluster Index RankVermont 100.0 1 Ohio 100.0 1 Michigan 100.0 1Idaho 94.4 2 Indiana 98.9 2 Indiana 60.3 2California 88.8 3 Pennsylvania 87.5 3 Oregon 54.3 3Oregon 87.3 4 Michigan 71.3 4 Ohio 48.2 4New Hampshire 82.1 5 Texas 68.6 5 Kentucky 46.2 5South Carolina 47.5 23 South Carolina 62.2 8 South Carolina 34.8 8
Food & Ag Cluster Index Rank Prof. Srv. Cluster Index Rank Trans. Srv. Cluster Index RankCalifornia 100.0 1 California 100.0 1 Tennessee 100.0 1North Dakota 94.2 2 Washington DC 96.0 2 California 89.6 2Idaho 89.1 3 Florida 94.2 3 Texas 89.3 3Iowa 88.8 4 Nevada 86.8 4 Illinois 78.7 4South Dakota 85.2 5 New York 80.8 5 Arkansas 75.1 5South Carolina 33.3 40 South Carolina 37.8 30 South Carolina 61.4 15
Forestry Cluster Index Rank Textiles Cluster Index RankNorth Carolina 100.0 1 North Carolina 100.0 1Mississippi 99.3 2 Georgia 95.7 2Oregon 96.9 3 South Carolina 93.4 3Wisconsin 93.3 4 Alabama 67.1 4California 90.3 5 Virginia 42.9 5South Carolina 65.0 17 South Carolina 93.4 3
Source: DRI•WEFA Inc.

DRI•WEFA Inc. 41
Figure 28: Map of Cluster Competitors
4
1
First tier (1-3)
Second tier (4-5)
1 Apparel2 Components & Sub-Assemblies3 Food & Agriculture4 Forestry, Wood & Paper5 Machinery & Fabricated Metals6 Materials7 Professional Services8 Textiles9 Tourism10 Transportation Equipment11 Transportation Services
1
1
2
2
2
3
3
3
4
66
5
5
9
6
10 7
8
8
85
6
8
8
7
3
6
5
7
4
3
22
1
4
1
11
9
9
1010
11
11
5
7
7
9
10
11
10
11
9
4
Source: DRI•WEFA Inc.

DRI•WEFA Inc. 42
V. Economic Foundations
V.1. Summary To assess South Carolina’s economic competitiveness – its ability to generate higher economic output from a given increase in investment – the state’s six economic foundations were examined and measured against the benchmark states. These foundations are labor force skills (education), access to capital, technology, infrastructure, general business climate, and quality of life. The following points summarize the assessment of South Carolina’s economic foundations:
Labor Force Skills—South Carolina’s educational system lags behind its benchmark states in terms of quality, availability of high-quality research-centered institutions, and access to financial support. To its benefit, there is evidence that South Carolina is already taking steps to try to improve its educational system.
Access to Capital— Investment capital is caught in a negative cycle in South Carolina. A dearth of good investment opportunities in the state has stunted the growth of venture capital businesses. In turn, as a result of limited investment funding, businesses with good opportunities for investment have difficulty accessing the necessary capital. Business formation in South Carolina appears stagnant.
Technology—R&D funding and activity is low in the state, in terms of both government sponsored and corporate initiatives.
Infrastructure—Several of South Carolina’s infrastructure indicators provide positive support to its overall development. For example, in terms of geographical proximity, South Carolina is well positioned for the market place. The state, however, is at a disadvantage as its IT infrastructure is less adequate than the benchmark states.
General Business Climate—The cost of doing business in South Carolina is favorable—operating costs are relatively low.
Quality of Life—On average, South Carolina rates well in terms of “quality of life”. The low cost of living relative to average earnings is a key positive contributor to the state’s quality of life.
V.2. Labor Force Skills The growth of knowledge-based industries and their increasing role in cultivating a vibrant economy has made the availability of skilled, professional labor the crux of economic foundations. The availability of good schools locally, especially institutions of higher learning, is an important factor in producing readily employable labor, especially with today’s emphasis on knowledge-based industries. Solid elementary and high school education is extremely important as this determines the number of students progressing to higher education. Providing students with a solid base in science and math can also encourage higher enrollment in courses such as computer science and engineering, and boost the state’s skilled labor pool to fuel the growth of high-tech industries.
Since there are no national standards to measure worker quality, educational attainment is used as a yardstick to measure labor force preparedness and quality. Most jobs (semi-skilled, sub-professional) require at least high school certification, while higher level jobs (skilled, professional, technical, and managerial) generally call for at least an associate’s degree or a bachelor’s degree. According to the 1999 Strategic Plan for Economic Development in South

DRI•WEFA Inc. 43
Carolina, South Carolina has the largest share of urban area adults without a high school diploma among the nine southern states4. It also had the smallest share of urban area adults with some post-secondary training, or with a bachelor’s degree, or with an advanced degree. Consequently, South Carolina’s urban work force is over-represented in manufacturing occupations and under-represented in professional and technical occupations. The caveat is that these data, at the metropolitan area level, are from the 1990 Decennial Population Census.
More recent state level data, although not at the same level of detail, is available from Census 2000. Currently, 78.7% of South Carolina’s adult population have high school diplomas and 22.9% have at least a bachelor’s degree. Compared to its neighbors, South Carolina is on par in terms of semi-skilled labor preparedness, but lagging in skilled and professional labor force preparedness. Relative to both best practice states and the national average, however, South Carolina is lagging in both categories.
Figure 29 Education Attainment, 1999
81.6
84.5
78.5
78.7
25.1
27.9
24.2
22.9
0 10 20 30 40 50 60 70 80 90
US National
Benchmark States
Neighbor States
South Carolina
High School Grad College/Post Grad Neighbor States: Alabama, Georgia, North Carolina, & Virginia
Best Practice States: Arizona & Colorado Source: Census Bureau
According to the Measuring Up 2000 survey, a national survey conducted by the National Center for Public Policy and Higher Education, students in South Carolina are generally a little worse off than their national counterparts. The percentage of 8th graders scoring at or above “Proficient” level on national assessment exams are low -- 14% in math, 22% in reading, and 15% in writing. Particularly worrisome is that South Carolina has one of the largest groups of 8th graders that do not even have a grasp on basic math. Of South Carolina’s 8th graders, 45% were assessed to have less than basic understanding of math. Among the neighboring and best practice states, only Alabama is worse off in this aspect -- 48% of 8th graders do not have an understanding of rudimentary math. Although Georgia also has 45% of its 8th graders deemed to be “below basic”, the state has a larger share of students tested to be at and above “Proficient” than South Carolina.
4 Virginia, Georgia, Kentucky, Mississippi, Tennessee, North Carolina, South Carolina, Alabama, and Florida.

DRI•WEFA Inc. 44
Figure 30
8th Graders Math Proficiency, 2000
0%
10%
20%
30%
40%
50%
60%
70%
80%
90%
100%
Perc
enta
ge o
f stu
dent
s w
ithin
eac
h m
aths
ach
ieve
men
tle
vel r
ange
for G
rade
8 p
ublic
sch
ools
, 200
0
Alabama SouthCarolina
Georgia Arizona U.S. Virginia NorthCarolina
Below Basic At Basic At Proficient At Advanced Source: National Center for Public Policy and Higher Education
In fact, proficiency in science is worse than proficiency in reading and writing and the gap worsens as the grade level progresses. According to the Strategic Plan for Economic Development in South Carolina, in urban school systems, 20% of all third grade students, versus 23% of eighth graders, are more proficient in reading and writing. In rural systems, 24% of third graders, versus 26% of eighth graders, are more proficient in reading and writing. Moreover, the share of students proficient in science declines sharply from the third to the eighth grade -- 67% to 46% in urban areas and 58% down to 37% in rural areas.
While SAT scores may be an imperfect measure of scholastic achievement, they do provide another comparable measure to assess the relative ability of those who take the test. The average score of students taking the Scholastic Assessment Test (SAT) is still lower for South Carolina than most other states. Not only is the Math score lower than average, but so is the Verbal score. Alabama has higher SAT scores basically because only the cream of the crop - a meager 9% - took the test. In South Carolina, 57% of students took the SAT, which is higher than the national average of 45%. As a result of the lower scores, fewer students in South Carolina are able to enter the better colleges.

DRI•WEFA Inc. 45
Table 6 SAT Test Scores, 2001
Math Verbal Percent of Graduates Taking SAT 2001
Alabama 554 559 9 Colorado 542 539 31 Arizona 525 523 34 U.S. 514 506 45 Virginia 501 510 68 North Carolina 499 493 65 Georgia 489 491 63 South Carolina 488 486 57
Source: American School Board Journal
When top-notch higher education facilities are available within the state, a larger number of local students could enroll in these institutions of higher learning. Not only would tuition be more affordable to residents of the state, but the geographic proximity would also be an attractive factor. South Carolina has only 16 campuses of technical institutes and 4 regional two-year campuses in the state, by far the fewest number among the nine southern states. However, enrollment rates at these institutions are relatively much higher, ranking fourth out of the nine southern states, according to the 1999 Strategic Plan for Economic Development in South Carolina. Thus, although the absolute number of two-year and technical institutions may be small, they appear to be effectively utilized in terms of enrollment. While more attention is traditionally focused on four-year university programs, shorter programs such as these institutions can have a strong role in preparing a labor force with needed skills as well.
In terms of four-year institutions, South Carolina does indeed have a large number of post-secondary institutions. However, South Carolina, along with Alabama and Arizona, does not have any first-tier undergraduate national universities or liberal arts colleges. It is host to only three national second-tier institutions of higher education -- Clemson, Furman, and Wofford. In contrast, Virginia has three national first-tier higher education institutions (i.e. University of Virginia, William & Marry, Washington & Lee) and four second-tier universities and colleges (i.e. Virginia Tech, Hollins, Randolph Macon Women’s College, and Sweet Briar). North Carolina has four first-tiers (Duke, UNC, Wake Forest, and Davidson) and one second-tier (NCS). Georgia has two first-tiers -- Emory and Georgia Tech -- and three second-tiers -- University of Georgia, Agnes Scott, and Spelman.Of course, other factors beyond accessibility are just as critical, if not more. For example, affordability of higher education and the quality of fundamental learning are very important to cultivating a student population that have both the intellectual preparedness as well as the financial ability to obtain post secondary school education.
The Measuring Up 2000 survey scored South Carolina’s education system relatively poorly in three areas -- the quality of education (“Preparation”), higher education enrollment (“Participation”), and affordability. Among its neighboring states, only Georgia scored worse in these three categories. These three categories are probably the most important among the survey’s five categories in cultivating a strong, readily employable labor force. A very low proportion of 11th and 12th graders perform well on college entrance exams and, consequently, a very low percentage of South Carolina’s high school students go on to college immediately after high school. Moreover, only a fair proportion of young adults (18 to 24 age cohort) are enrolled in college-level education or training and a very low percentage of working-age adults (25 to 44 age cohort) enroll in post-high school education or training. Part of this could be due to the

DRI•WEFA Inc. 46
inability of a rather large group of South Carolinians to finance higher education. Furthermore, even after financial aid, South Carolina’s education system requires families to devote a relatively large share of family income to attend its public two- and four-year colleges, which serve approximately 83% of the students in the state. Private institutions, which account for 17% of enrollment, are even more expensive and beyond the reach of many families. In addition, investment in financial aid for low-income families is low.
North Carolina, which scored high marks for an affordable education system, also makes relatively little investment in financial aid. However, not only is a higher percentage of federal Pell Grant aid allocated to low-income families, but state college tuition in North Carolina is approximately 45% less than in South Carolina. As a result, tuition at the lowest priced colleges only take up 6% of the poorest families’ income in North Carolina whereas in South Carolina, it would require about 12% of income.

DRI•WEFA Inc. 47
Figure 31 State Education System Report Card, 2000
Alabama Arizona Colorado Georgia North Carolina SouthCarolina
Virginia
Preparation Participation Affordability Completion Benefits
F
D
C
B
A
PreparationHow adequately are students in each state being prepared for education and trainingbeyond high school?ParticipationDo state residents have sufficient opportunities to enroll in education and trainingbeyond high school?AffordabilityHow affordable is higher education for students and their families?CompletionDo students make progress toward and complete their certificate and degrees in atimely manner?BenefitsWhat benefits does the state receive as a result of having a highly educated population?
Source: The National Center for Public Policy and Higher Education
The accessibility of institutions, enrollment and graduation rates, and performance levels of post-secondary institutions in South Carolina are related to another key economic issue – research and development (discussed more fully in V.4 Technology). R&D is a necessary ingredient in building up the technology base in a state, and linking it with key industrial and cluster developments. The education system is one of the pillars of promoting R&D. More comprehensive endowed-chair programs could attract more top academics to South Carolina’s colleges and universities, bringing their R&D skills with them. Setting higher education priorities at a state level, and encouraging industry partnerships to colleges and universities would also contribute to R&D activities. The greater link between R&D within higher education and industry may have the additional benefit of improving the motivation and performance of students participating in the R&D programs.
In terms of the distribution of education resources, South Carolina is making a concerted effort to improve its education system in the hope of cultivating a skilled labor force that would nurture the development of a dynamic economy. The 1999 survey by Education Week revealed that South Carolina had inadequate resources allocated toward education. Since then, the state has been pouring financial resources into its education system. Aid awarded by state grant programs in fiscal year 1999 totaled some $89 million, with need-based and non-need-based aid accounting

DRI•WEFA Inc. 48
for 37% and 63%, respectively5. More scholarship initiatives have also been drafted early this year, in the hope of further boosting the state’s higher education enrollment.
After adjusting for regional cost differentials, South Carolina spent an average of $7,275 per student in 2001, more than all its neighbors as well as the national average ($7,079). This represents a 9.7% increase from the amount spent in 2000, placing South Carolina among the top states in expanding education expenditures. The national average rate of increase was 3.9%. Furthermore, 41.6% of education expenditures were devoted to teachers, compared to the national average of 33.4%. Among its regional counterparts and best practice states, only Alabama devoted a higher percentage of education expenditures to teachers6. However, it is important to note again, that these figures are state averages. Actual funding per student ranges from $2000 to $10,000 in individual school districts across the state. There is currently significant public discussion about this issue, but there are no plans in place yet to address this situation.
Figure 32
Education Spending and Allocation
$2,000
$4,000
$6,000
$8,000
SouthCarolina
Virginia Georgia Alabama NorthCarolina
Colorado Arizona
Educ
atio
n sp
endi
ng p
er s
tude
nt, a
djus
ted
for r
egio
nal c
ost
diffe
renc
es (2
001)
0%
10%
20%
30%
40%
50%
60%
Perc
enta
ge o
f edu
catio
n ex
pend
iture
s de
vote
d to
teac
hers
(2
000)
Education spending per student Percentage devoted to teachers
U.S. Average$7,079 per student
33.4% devoted to teachers
Source: Education Week
On average, South Carolina is able to pay its teachers relatively well, compared to most other states. It is very much on par with its neighbors, as well as most of the nation, in terms of teacher compensation. Relative to the best practice states of Arizona and Colorado, South Carolina is well ahead in this aspect; 63% of its secondary school teachers in South Carolina hold degrees in the subjects they teach and the state fully supports ongoing professional development and training for the teaching population. Approximately 64.8% of teachers in the neighboring states hold degrees in the subjects they teach. Nonetheless, teaching is still among the lowest paid professions and South Carolina does not have policies encouraging pay for performance for teachers.
5 Source: Change, March 1, 2002 6 The Deputy Superintendent of Education in South Carolina reports that per pupil expenditure for FY2001 was $6,990, and that the proportion of this spent on classroom teachers was 59%.

DRI•WEFA Inc. 49
Figure 33 Average Annual Salaries for Teachers, 2000
$0 $10,000 $20,000 $30,000 $40,000 $50,000
Benchmark States
Neighbor states
US Average
South Carolina
Adjusted for cost of living differentials, 2000
Average Starting Salary Average Salary Source: Education Week
Given the financial resources, the state average of the student-teacher ratio has improved considerably since the mid-1990s. In this respect, South Carolina is on rather solid standing relative to its counterparts and most of the nation. The number of students per teacher was 16.2 in 1995-1996, and this ratio is estimated to be 14.6 in 2000-2001 period. Virginia is the only neighboring state that has a better ratio than South Carolina.
Figure 34 Student-Teacher Ratio
0 5 10 15 20 25
Arizona
Colorado
North Carolina
Georgia
Alabama
South Carolina
Virginia
Student/Teacher Ratio
1995-1996 2000-2001
2000-2001 US Average
1995-1996US Average
Better Worse
Source: American School Board Journal
The following table shows that South Carolina has, to a certain degree, seen the fruit of its efforts to improve its education system. Proficiency scores for Math, Science, and Reading have improved since the previous survey. However, despite the increase in grant aid, equity of resource allocation is still very much a problem that the state would need to address. The new additions to grant aid are mostly, if not all, merit-based aid, which, historically, benefit students from middle- to high-income families more than students from low-income families.

DRI•WEFA Inc. 50
Table 7 South Carolina Elementary & Secondary Education Report Card
Measure 1999 Quality Counts Survey
2002 Quality Counts Survey
Percent of Students Scoring At or Above Proficient Math
4th Grade 12% 18% 8th Grade 14% 21%
Science 8th Grade 17% 20%
Reading 4th Grade 20% 22%
Standards & Assessments B B+ Resources
Adequacy C+ B- Equity B C
Source: Education Week
V.3. Infrastructure Infrastructure provides support to the growth of businesses. One of the basic elements of infrastructure is transportation or good connectivity, which makes a place more easily accessible. Geographic proximity to a sizeable population ensures a reasonable market, both to source from and to sell to. As the Strategic Plan for Economic Development in South Carolina has indicated, South Carolina lies within 500 miles of 28% of all Americans, whereas Arizona and Alabama have smaller regional and domestic markets for their goods and services. The table below shows that, compared to its neighbors and the best practice states, the highway network in South Carolina is in good standing. If anything, there are indications the state is “over serviced” in terms of roads and highways.
Table 8 Highway Density, 2000
2000 Highway Miles
Rural Urban Total State
Interstate Non-Interstate Interstate Non-Interstate
Alabama 600 714 306 276 1,896Arizona 996 262 172 42 1,472
Colorado 767 29 184 34 1,014Georgia 807 724 437 154 2,122
North Carolina 649 823 375 201 2,048South Carolina 671 173 158 107 1,109
Virginia 731 431 387 114 1,6632000 Net Land Area (Square Miles) Miles of Highway per Square
Mile of Land State Rural Urban Percent Urban Rural Urban
Alabama 47,566 3,187 6.3 0.03 0.18Arizona 110,757 2,852 2.5 0.01 0.08
Colorado 101,942 1,787 1.7 0.01 0.12Georgia 54,384 3,667 6.3 0.03 0.16
North Carolina 45,485 3,230 6.6 0.03 0.18South Carolina 28,686 1,425 4.7 0.03 0.19
Virginia 37,118 2,480 6.3 0.03 0.20Source: Federal Highway Administration

DRI•WEFA Inc. 51
In terms of an air transportation network, the Strategic Plan for Economic Development in South Carolina used direct air service from airports in each state to twenty major U.S. business destinations7 as a measure of connectivity by air transport. At the time the report was written, South Carolina was served by approximately 124 non-stop flights to 12 of the 20 destinations. This was low relative to the other states, such as North Carolina (373 non-stop service to 20 destinations) and Georgia (485 non-stop flights to 20 destinations). This is partly because South Carolina does not have the bigger hubs that the other states have. Even though Virginia does not have a large air transportation hub, it is very close to the one in Washington, DC.
Figure 35 Air Transportation Hubs
Source: Bureau of Transportation Statistics
The other components of basic infrastructure are water and sewerage systems (see Figure 36 and Figure 37). South Carolina has, on average, adequate water and sewer infrastructure, which is generally concentrated in major cities or counties. In the rural parts of the state, coverage of adequate infrastructure is more of a concern. Compared to the rest of the nation, South Carolina’s water and waste systems fall in the “middle-of-the-road”, average-ranking category. However, with Greenville County quickly becoming a more important area for businesses and R&D activities, the sewer system in that area could encounter bottleneck issues in the foreseeable future unless it is upgraded or expanded.
7 Atlanta, Boston, Charlotte, Chicago, Cleveland, Cincinnati, Dallas, Denver, Detroit, Houston, Los Angeles, Memphis, Miami, Nashville, New York, Philadelphia, Pittsburgh, San Francisco, St. Louis, and Washington.

DRI•WEFA Inc. 52
Figure 36 Sewer Lines
Source: University of South Carolina
Figure 37
Water Lines
Source: University of South Carolina

DRI•WEFA Inc. 53
Figure 38 Population Density
As for the availability of business real estate, the Strategic Plan for Economic Development in South Carolina found that metropolitan areas in South Carolina have a proportionately larger inventory of vacant Class A office space than do urban areas within most of its neighboring states. Class A office space is designed for high quality tenants in excellent locations. High quality finish, professional management, and excellent location, are the hallmarks of such real estate. However, South Carolina has a very tight market for manufacturing space and a limited inventory of distribution space in existing buildings. Moreover, the study also found that a portion of the available space is dated—no longer suitable for most new production facilities. This suggests a lack of proper space for activities that will spur the South Carolina economy into the new millennium (e.g. R&D).
Another important infrastructure indicator is a state’s telecommunications or IT readiness, the structural cornerstone of the new economy. IT infrastructure seems to be less adequate in South Carolina than in the other benchmark states. Among the benchmark states, the share of households with Internet access is the lowest in South Carolina (32%), followed by Alabama (36%) and Arizona (43%). Colorado leads the group with 52% of households with Internet access. As for North Carolina, Virginia, and Georgia, the shares are 45%, 44%, and 43%, respectively.
High-speed lines, which are defined as lines transferring over 200 kbps in at least one direction (e.g. ADSL, coaxial cable, etc.), are a better measure of information technology infrastructure than telephone lines. It is the main mode of Internet connection for most businesses and will soon overtake dial-up services as the preferred Internet access mode for residential users. The following chart shows that, next to Alabama, South Carolina has the lowest number of high-speed lines. Even when number of households is taken into account, South Carolina is still
Less Dense More Dense

DRI•WEFA Inc. 54
lagging behind most of the benchmark states in terms of fiber density. Arizona has the most number of lines per one thousand households, followed by Georgia, Colorado, and Virginia.
Figure 39 Information Technology Infrastructure, 2000
0
50
100
150
200
250
Arizona Georgia Colorado Virginia NorthCarolina
SouthCarolina
Alabama
Num
ber o
f Lin
es, T
hous
and
50%
60%
70%
80%
90%
100%
Highspeed Lines Per thousand HouseholdsHighspeed Lines, TotalPercent of Highspeed Network Serving Residential/Small Business Users
Source: Federal Communications Commission
Another important factor that should be noted is the adequacy of the power generation and distribution system. Power outages can be extremely damaging to high-tech production, such as semiconductor manufacturing, and cost businesses a tremendous amount of money and resources. So far, South Carolina has not experienced any major power outages that are not associated with storms like Hurricane Floyd and the snowstorm in 2000.
V.4. Technology Having a strong R&D base is an essential component of economic development as it drive the growth of knowledge-based industries and requires a highly educated labor force.
Patents define the boundaries of intellectual property in a manner that can be protected and built upon. These walls of protection form a barrier to entry, allowing the patent holder to reap the high economic returns during the life of the patent and giving angel investors and other forms of venture capital reason to invest in these businesses. With the exception of Alabama, inventors in South Carolina have consistently generated fewer patents than the group of benchmark states during the period 1996-2000. This is in spite of the presence of incubators and accelerators set up to foster innovation in the state.

DRI•WEFA Inc. 55
Figure 40 Number of Patents (All Classes) Awarded, 1996-2000
0 1,000 2,000 3,000 4,000 5,000 6,000 7,000 8,000 9,000
Colorado
North Carolina
Arizona
Georgia
Virginia
South Carolina
Alabama
Number of Patents
1996 1997 1998 1999 2000
Source: United States Patent and Trademark Office
R&D, often the precursor to the most rewarding patents awarded, has been seriously lacking in South Carolina. Not only were the total R&D expenditures and number of companies undertaking R&D low, but R&D intensity in South Carolina is also the lowest among the group of benchmark states (see Figure 41).
Figure 41 R&D Profile by State, 1999
(Size of bubble = Amount of R&D)
0.0
0.5
1.0
1.5
2.0
2.5
3.0
3.5
4.0
4.5
0 200 400 600 800 1,000 1,200 1,400 1,600 1,800No. of Companies
R&
D In
tens
ity
Alabama
South Carolina
Georgia
North Carolina
Arizona
Colorado
Virginia
* R&D Intensitystate = R&D Expenditurestate/GSPstate
Source: National Science Foundation

DRI•WEFA Inc. 56
Even though federal R&D funding to South Carolina has grown over the past three decades, it is still low. In terms of federal R&D per capita, South Carolina ranks a low 45th place out of all the states. In order to improve the situation, South Carolina is participating in the National Science Foundation’s Experimental Program to Stimulate Competitive Research (EPSCoR) that was started to help states become more competitive in winning federal R&D dollars. In fiscal year 1999, the Department of Defense and the U.S. Department of Health and Human Services accounted for over 51% of all federal R&D funding in South Carolina.
Next to government and federally funded labs, colleges and universities usually receive the bulk of federal R&D funds. Three universities in South Carolina conduct the majority of research in the state, but only one -- Medical University of South Carolina (95th) -- is ranked among the top 100 universities and colleges that receive the most federal R&D funds. In stark contrast, North Carolina is home to four universities that are among the top 100 university recipients of federal R&D dollars -- Duke University (18th), University of North Carolina Chapel Hill (21st), Wake Forest (65th), and North Carolina State University (75th). As a result of its low federal R&D funding, R&D expenditure in South Carolina’s colleges and universities is the lowest among the benchmark states.
Figure 42 College & University R&D Expenditures in FY 1999
0 200 400 600 800 1,000 1,200
North Carolina
Georgia
Virginia
Colorado
Arizona
Alabama
South Carolina
Millions ($)Federal State & Local Industry Institutional Funds All Other
Source: National Science Foundation
In terms of corporate R&D, South Carolina is disadvantaged in that it does not have as many companies with deep pockets setting up their R&D facilities in the state. Milliken & Company, which operates a textile-related research facility in Spartanburg, is one of the largest R&D industrial firms in South Carolina. As a benchmark, companies like Glaxo Wellcome, IBM, Covance, Cisco Systems, and Medco Research, have established R&D facilities in the Research Triangle Park in North Carolina. Virginia, where industrial firms are the top performers of R&D, is home to research facilities of companies, such as Bell Boeing Joint Venture Program, Lockheed Martin, Raytheon Corporation, and Science Applications International Corporation. In 2000, industry funded R&D in South Carolina amounted to just about $15.5 million, putting the state at 34th place among the 50 states. In a similar fashion, the state is handicapped by having fewer advanced government or federally funded labs compared to the other states. It would be no surprise if this were largely due to the relatively small pool of science and engineering students in South Carolina.

DRI•WEFA Inc. 57
V.4.1. Special Focus: South Carolina Technology Assets The number and nature of South Carolina’s technology assets provide the mechanism for understanding a key element of the state’s technology foundations. For the purposes of this study a technology asset is any R&D establishment no matter what its source of funding is. These can be private company establishments, federal labs, or research departments or programs and universities or colleges. While the distribution of these assets across the state may superficially seem to be random, when we consider the area or type of research activity, some interesting patterns of geographic agglomeration can be observed. These points of agglomeration tend to be focused on the location of either colleges, universities, and/or major research-consuming companies.
First, we focus on federally-funded facilities (see Figure 43 for a map showing the distribution and classification of these facilities). Federal R&D research obligations and facilities provide direct, high-level impact in terms of technical jobs. Also, such large-scale and respected R&D facilities often lead to some form of technology transfer that could encourage further research by private entities that yield new technologies or products. As detailed in the earlier section, South Carolina compares rather poorly to most other states in terms of R&D and ranks low at 45th in federal R&D per capita.
Figure 43 Federal R&D Facilities
Source: Rand

DRI•WEFA Inc. 58
By far, South Carolina receives the most federal R&D dollars from the Department of Defense (DOD) and Health and Human Services (HHS). Department of Energy (DOE) is the third largest federal sponsor of R&D in South Carolina. As such, it is no surprise that the federal R&D facilities fall into three broad categories -- defense, horticulture, and environmental-related research. Of particular interest is the Savannah River Technology Center, a federally funded R&D center sponsored by DOE and operated by Westinghouse. The center focuses on developing, testing, and demonstrating equipment and techniques for processing nuclear materials; cleaning up and protecting the environment; processing and stabilizing hazardous and radioactive waste materials; decontamination and decommissioning; and minimizing the danger from nuclear proliferation8.
The Space and Naval Warfare Systems Center Charleston is a unit of DOD. It conducts R&D in areas of command, control, communications, intelligence, surveillance, reconnaissance, and navigation. Approximately 1,442 civilian personnel are employed in this unit, only a portion of whom are directly involved in R&D activities. Also located in Charleston are Center for Forested Wetlands (USDA Food Services), U.S. Vegetable Laboratory (USDA Agricultural Research Service), and Charleston Laboratory (National Oceanic & Atmospheric Administration). The Center for Forested Wetlands is on the Charleston campus of Clemson University and it conducts research to develop, quantify, and synthesize ecological information needed to sustainably manage and restore the structure, functions, and productivity of forested wetland ecosystems through research and technology transfer in the areas of ecological management. Also situated on Clemson University campus, the U.S. Vegetable Laboratory conducts research to solve national problems in vegetable crop production and protection with emphasis on the southeastern United States9.
Other federal R&D centers are the Coastal Plains Soil, Water, & Plant Research Center, South Carolina Cooperative Fish & Wildlife Research Unit, and the Cotton Quality Research Station. As shown in the following chart, these federal R&D units are located in Anderson, Greenwood, Aiken, Charleston, and Florence counties. Most of the federal R&D centers are located close to a college or university.
Next, we turn to corporate or privately-funded R&D. The distribution of these technology assets is illustrated in Figure 44. These institutions are also listed in the table provided in Appendix 2. First, it is clear that these R&D facilities are generally located in counties that have federal R&D centers, namely Florence, Charleston, Greenwood, and Anderson. Second, there is almost always a college or university, as well as a few major employers, such as Owens Corning, AVX, and General Electric, close by. Third, these locations are connected by major highways, which enables easy travel from one place to another.
In terms of areas of research, South Carolina’s privately-funded R&D falls under five broad categories -- environmental, electronics, material science, pharmaceuticals, and horticulture. Facilities engaged in environmental and horticulture R&D tend to be situated around federal R&D centers. For example, Environmental Systems Engineering and Clemson Technical Center, both delving in environmental or waste handling research, are in Anderson County, and Park Seed Company, which engages in horticulture related R&D, is located in Greenwood County. These two neighboring counties happen to be home to federal R&D centers, South Carolina Cooperative Fish & Wildlife Research Unit, and the Cotton Quality Research Station.
8 Rand 9 Rand

DRI•WEFA Inc. 59
Figure 44 Privately-Funded R&D Facilities
Source: Company websites; Nexis.com
Material science research dominates the private-sector R&D arena and most research facilities can be found in Northwestern South Carolina. These include Hoechst Research & Technology, Michelin Americas Research & Development Corporation, W.R. Grace & Co., Milliken Research Center, and Bishop Center for Engineering Ceramic Manufacturing. Similarly, we also find another group of research facilities engaged in material science R&D clustered in Charleston, South Carolina. Even though the industry affiliation of these facilities and their geographic location show no particular pattern, it is quite clear, however, that the nature of the research and knowledge involved are similar or fall in the same science discipline of material science. For example, Milliken Research Center is associated with the textile industry and it endeavors to develop state-of-the-art fabrics or materials that exhibit desirable traits such as toughness, resilience, and malleability. Michelin Americas Research & Development Corporation engages in R&D that hopes to produce a better material for automotive tires and the Tile Council of America researches possible avenues to produce better, stronger tiles. As diverse as the activities may seem, they all involve manipulating and creating new polymers.
As such, we can postulate that there is some degree of technology transfer happening in these geographic agglomerations of R&D facilities, colleges, universities, and companies. The other encouraging aspect that should be highlighted is that much of these activities involve some form

DRI•WEFA Inc. 60
of nanotechnology10 (e.g. nanoelectronics), which is the micro-science of tomorrow. It has enabled revolutionary breakthroughs in materials, pharmaceuticals, and information technology. Top private patents in the state have mostly been awarded for material science related research.
Table 9 Top 15 Private Patent Holders
PATENT HOLDER NO. OF PATENTS (1996
- 2000)
PATENT HOLDER NO. OF PATENTS (1996
- 2000)
MILLIKEN RESEARCH CORPORATION 74 CLEMSON UNIVERSITY 23
NCR CORPORATIONβ 74 ASTEN GROUP, INC. 22
W. R. GRACE & CO.-CONN. 71 UNITED STATES OF AMERICA, DEPARTMENT OF ENERGY 21
WESTVACO CORPORATION 69 SONOCO PRODUCTS COMPANY, INC. 20
MILLIKEN & COMPANY 53 KEMET ELECTRONICS CORPORATION 19
POWER TOOL HOLDERS, INC. 49 SONOCO DEVELOPMENT, INC. 19 WESTINGHOUSE AIR BRAKE COMPANY 48 HILL-ROM COMPANY, INC. 18
GENERAL ELECTRIC COMPANY 41 MEDICAL UNIVERSITY OF SOUTH CAROLINA 18
CRYOVAC, INC.* 31 WESTINGHOUSE SAVANNAH RIVER COMPANY, INC. 17
THE ESAB GROUP, INC. 31 BIC CORPORATION 15
RELIANCE ELECTRIC INDUSTRIAL COMPANY 29 HOECHST CELANESE CORPORATION 15
BAYER CORPORATION 28 SAWGRASS SYSTEMS, INC. 15 MICHELIN RECHERCHE ET TECHNIQUE 25 WANGNER SYSTEMS CORPORATION 14
BASF CORP. 28 WESTINGHOUSE ELECTRIC CORP. 14 RYOBI NORTH AMERICA, CORP. 25 ALBEMARLE CORPORATION 13
β NCR Corp. sold its West Columbia campus in August 2001. * Cryovac is a division and trademark of W.R. Grace Source: United States Patent and Technology Office
In sum, even though the current R&D scene in South Carolina seriously lags most states in the nation, there already is a small base of R&D expertise that is postured strategically to catapult the economy into the next generation.
However, there are signs that this base may be at risk. Company-sponsored R&D is typically carried out at the company’s headquarter locations. While the number of company headquarters in South Carolina (with greater than 100 employees) has grown at the same pace as the U.S. average, the number of employees within those corporate headquarters has shrunk. From 1996 to 2002, headquarter employment within South Carolina fell by 3.6%, while U.S. corporate headquarter employment rose by 18.6%. As the size of corporate offices falls within South Carolina, R&D budgets may shrink, and the number of professional and executives within the state falls as well.
10 “Nano” means 10-9, a billionth part. Nanotechnology is technology that takes things down to the molecular level and often involves manipulation of individual atoms.
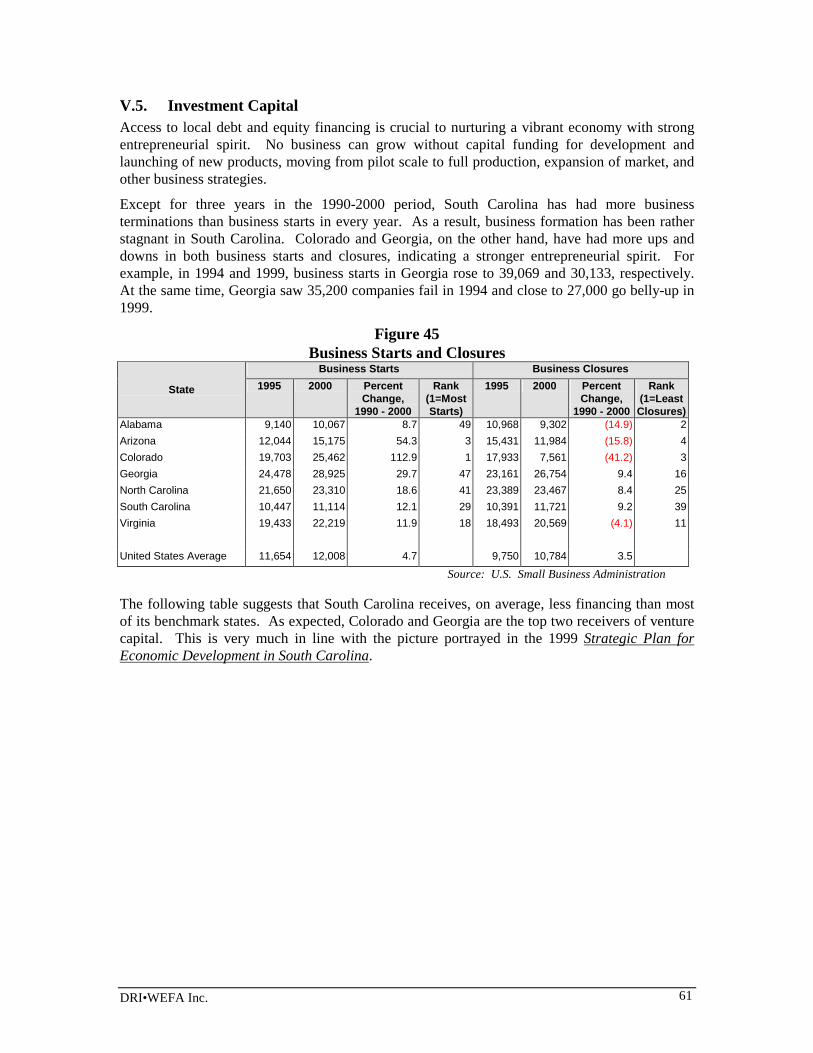
DRI•WEFA Inc. 61
V.5. Investment Capital Access to local debt and equity financing is crucial to nurturing a vibrant economy with strong entrepreneurial spirit. No business can grow without capital funding for development and launching of new products, moving from pilot scale to full production, expansion of market, and other business strategies.
Except for three years in the 1990-2000 period, South Carolina has had more business terminations than business starts in every year. As a result, business formation has been rather stagnant in South Carolina. Colorado and Georgia, on the other hand, have had more ups and downs in both business starts and closures, indicating a stronger entrepreneurial spirit. For example, in 1994 and 1999, business starts in Georgia rose to 39,069 and 30,133, respectively. At the same time, Georgia saw 35,200 companies fail in 1994 and close to 27,000 go belly-up in 1999.
Figure 45 Business Starts and Closures
Business Starts Business Closures
State 1995 2000 Percent Change,
1990 - 2000
Rank (1=Most Starts)
1995 2000 Percent Change,
1990 - 2000
Rank (1=Least Closures)
Alabama 9,140 10,067 8.7 49 10,968 9,302 (14.9) 2Arizona 12,044 15,175 54.3 3 15,431 11,984 (15.8) 4Colorado 19,703 25,462 112.9 1 17,933 7,561 (41.2) 3Georgia 24,478 28,925 29.7 47 23,161 26,754 9.4 16North Carolina 21,650 23,310 18.6 41 23,389 23,467 8.4 25South Carolina 10,447 11,114 12.1 29 10,391 11,721 9.2 39Virginia 19,433 22,219 11.9 18 18,493 20,569 (4.1) 11
United States Average 11,654 12,008 4.7 9,750 10,784 3.5
Source: U.S. Small Business Administration
The following table suggests that South Carolina receives, on average, less financing than most of its benchmark states. As expected, Colorado and Georgia are the top two receivers of venture capital. This is very much in line with the picture portrayed in the 1999 Strategic Plan for Economic Development in South Carolina.

DRI•WEFA Inc. 62
Table 10 Financing Indicators
Equity Financing State Venture Capital SBIR* Award SBICδδδδ Award
2002 Q1 (million $)
Average Size per Deal
(million $)
2001 (million $)
Average award ($)
2001 (million $)
Alabama 12.5 3.1 24.97 304,530 18.48 Arizona 77.4 12.9 20.78 216,504 50.32
Colorado 204.7 9.7 53.65 224,490 198.93 Georgia 133.3 6.1 10.84 216,821 106.88
North Carolina 64.6 4.6 11.11 188,331 92.75 South Carolina 1.2 1.2 3.79 199,313 31.20
Virginia 100.3 5.3 59.81 256,709 163.67
Debt Financing Commercial Loans
($ per non-farm worker) 1995 2000 Compound Annual Growth Rate
1990-2000 Alabama 4,572.55 12,776.84 12.8% Arizona 2,051.70 2,464.67 0.0%
Colorado 2,115.63 1,744.14 -1.2% Georgia 6,524.28 7,326.87 6.4%
North Carolina 8,600.78 49,334.69 26.0% South Carolina 1,621.52 1,569.21 -1.9%
Virginia 2,529.26 1,276.53 -10.2%
* Small Business Innovation Research δ Small Business Investment Corporations
Sources: FDIC; Venture Economic, Small Business Administration; DRI•WEFA
Venture capital is a key source of funding for higher risk projects and so are “Angel” investors. South Carolina, along with a few of its neighboring states, has tried to replicate the network of angel investors after the Silicon Valley model. However, funding from venture capital in South Carolina has been sparse. Simply setting up the pool of investment funds is a step forward but it is not the final answer. Entrepreneurs attract investors (and vice versa) and South Carolina seems to be somewhat lacking in this aspect. Projects that have higher returns associated with first mover advantage, which usually fall in areas such as high-tech, pharmaceuticals, and biochemicals, tend to be more attractive targets for private equity investors—another ramification from the relatively low level of R&D activity in the state.
The Small Business Administration’s Small Business Investment Corporations (SBICs) program is another source of capital for the small business owner. SBICs provide leverage to local lenders and investors and fill the gap between available sources of venture capital and the needs of small businesses in start-up and growth situations. Unlike its neighbors and best practice states, South Carolina does not have any SBIC set up locally. However, this is probably not the reason that South Carolina received about the lowest SBIC and SBIR awards among the Southern states. Scanning across the board, South Carolina received less of every type of funding, which seems to suggest that there are fewer ventures or businesses to fund, rather than an outright lack of local financing infrastructure.

DRI•WEFA Inc. 63
V.6. General Business Climate Factors that most often affect key business decisions are those that affect the cost of operation; these include labor costs, corporate tax burden, utility cost, and rent. According to the 2000 survey conducted by the Small Business Survival Committee, South Carolina ranks 15th most attractive to small businesses among the 50 states. The survey takes into account various taxes (e.g. corporate income tax, capital gains tax, property tax, sales tax, etc.), workers’ compensation costs, and number of bureaucrats (a proxy for red tape). As the following paragraphs will detail, South Carolina is very competitive in terms of operation costs.
In terms of labor costs, South Carolina is on very good standing. According to Expansion Management 2000, South Carolina is among the states with the lowest overall employee costs. Virginia and Georgia, which have very low unemployment insurance costs, were also listed as states with highly competitive labor costs. The table below shows that wage rates for South Carolina are much lower than the national average in all the main sectors.
Table 11 Annual Wage Rates, 2000
Manufacturing Transportation, Communications, & Public Utilities
Wholesale Trade.
Retail Trade Finance, Insurance, & Real Estate.
Services
Colorado 47,450 54,709 51,985 19,074 52,315 37,279 United States 44,778 43,643 46,740 18,432 55,556 33,666
Georgia 37,448 49,301 51,338 18,194 50,172 34,114 Virginia 37,334 48,670 50,893 17,814 46,451 38,251 Arizona 48,541 39,849 45,431 19,246 41,045 31,059
North Carolina 37,004 40,519 40,709 17,466 48,061 29,395 Alabama 33,582 38,700 37,799 15,690 37,092 28,218
South Carolina 35,158 38,546 37,860 16,329 35,702 25,454 Source: Bureau of Labor Statistics
Focusing within the group of best practice states, only Alabama has lower wage rates than South Carolina -- Manufacturing (4% lower), Wholesale Trade (0.2% lower), and Retail Trade (4% lower).

DRI•WEFA Inc. 64
Figure 46 Wage Rate Comparison (2000), South Carolina = 1.0
Manufacturing
Transportation,Communications, & Public
Utilities
Wholesale Trade.
Retail Trade
Finance, Insurance, & RealEstate.
Services
Colorado Georgia Virginia Arizona North Carolina Alabama
0.9 1.0 1.1 1.2 1.3 1.4 1.5 1.6
Source: Bureau of Labor Statistics
South Carolina also has the second lowest union membership in the United States—4.5%. North Carolina has the lowest—4.2%. Highly unionized labor can increase employment costs significantly with potential benefits and compensation negotiations, strikes, and work stoppages. In fact, the rates of unionization in our benchmark group of states are lower than the national average. Hawaii, New Jersey, and New York had the highest rate of union membership.
Table 12 Union Membership
Union Membership (Percent of Non-Farm Employees
United States 13.9Alabama 9.7Colorado 9.1Georgia 7.4Virginia 6.8Arizona 6.5South Carolina 4.5North Carolina 4.2
Source: Bureau of Labor Statistics, 1998 Survey
Compared to the findings of the Strategic Plan for Economic Development in South Carolina, South Carolina has certainly made some progress in improving its employment cost competitiveness. The 1999 study showed that wages in the major industries are generally higher in South Carolina than its neighbors. While wage rates played an important part in lowering the overall labor cost in South Carolina, South Carolina’s drive to attract company headquarters to the state could have also played a part. This strategy included a variety of incentives such as tax credits for new jobs, investment, and training.

DRI•WEFA Inc. 65
Business tax burden—direct and indirect—often eat away a tenth of a company’s income. While states like Iowa and North Dakota have different tax brackets for different levels of corporate income, most states, including South Carolina and the best practice states, impose a flat corporate tax rate. State and local government in South Carolina impose a tax burden of approximately 2.7% of the state’s gross state product (GSP), which is quite moderate relative to the benchmark states. The same holds true when state and local taxes are considered as a share of total tax collections.
Table 13 Tax Burden, 2000
State Corporate Tax Rate State & Local Taxes as Percent of GSP, 2000
State & Local Taxes as Percent of Total Tax
Collections, 2000 Alabama 6.5 2.4% 21.3% Arizona 6.968 2.8% 27.5%
Colorado 4.63 2.9% 21.3% Georgia 6 2.7% 23.3%
North Carolina 6.9 3.0% 27.5% South Carolina 5 2.7% 24.8%
Virginia 6 3.0% 21.4% Source: DRI•WEFA; Federation of Tax Administrators
In addition, other costs in South Carolina are relatively muted as well. The Strategic Plan for Economic Development in South Carolina showed that office and industrial real estate costs are very competitive in South Carolina. Only Alabama has lower priced commercial and industrial rental. Electricity costs are very modest as well. The average business facility spends about 2.4% of its operating budget on energy services. Some manufacturing processes, such as maintaining clean rooms, can consume a large amount of energy. According to the 1999 study, South Carolina’s average energy bill for a moderate load industrial user is moderately lower than the average bills for four of the best practice states. Table 14 shows that electricity prices in South Carolina are lower than most of the benchmark states for both the commercial and industrial sectors.
Table 14 Electricity Prices, 1999
1999 Electricity Prices ($/Million BTU)
State Commercial Industrial Alabama $ 19.23 $ 11.20 Arizona $ 20.93 $ 14.79 Colorado $ 16.83 $ 12.83 Georgia $ 19.75 $ 12.16 North Carolina $ 18.63 $ 13.39 South Carolina $ 18.42 $ 10.91 Virginia $ 15.84 $ 11.26
Average $ 18.52 $ 12.36 Source: Department of Energy

DRI•WEFA Inc. 66
V.7. Quality of Life As the digital age of virtual reality pushes communication to new heights of sophistication and efficiency, and regional travel gets more affordable, state borders are becoming less of a boundary to business relocation. Today, labor is more mobile than ever before. With stiff competition narrowing the differences in business climates, the quality of life is therefore becoming an increasingly important factor that influences a company's decision on where to locate its new facilities. A company that is located in a place that is deemed to be an excellent place to live would have to offer less compensation for the same employee with the same qualifications than if it were located in a less desirable area. However, this measure is largely a subjective judgement based on individual values. There is no set definition of what makes up this “quality of life” measure. So sometimes, as the 1999 Strategic Plan for Economic Development for South Carolina has noted, effective touting and selling can greatly improve a community’s reputation.
The following table provides some summary statistics of several key indicators of quality of life: cost-of-living, of which housing affordability is key; a sense of security within the area; climate; pollution; and cultural and recreational opportunities. More detailed statistics on each of these general areas are presented in Appendix 3.
Overall, South Carolina compares favorably in most quality of life indicators. Housing affordability is higher than most benchmark states, crime rates are among the lowest of the benchmark states, climate is generally warm and not too extreme, and air quality is above the national average. While South Carolina offers residents very good recreational opportunities, its cultural resource availability is slightly below the national average.
Table 15 Summary of Quality of Life Indicators, 200011
Housing Affordability
Index (Higher=More
Affordable)
Overall Crime Index
(Lower=Better)
Annual Days with
>90F
Air Quality (Higher=Better)
Arts Index
Alabama 117.8 143 39 23 7 Arizona 105.8 141 164 10 4 Colorado 101.6 93 32 56 31 Georgia 89.2 131 19 54 17 North Carolina 97.9 103 25 67 14 South Carolina 112.1 139 64 82 9 Virginia 99.2 114 41 79 18
Source “Best Places to Live” Survey, Money Magazine
11 The tables for Quality of Life indicators report data from these MSAs: Birmingham, AL; Phoenix-Mesa, AZ; Denver, CO; Atlanta, GA; Raleigh-Durham, NC; Columbia, SC; and Richmond, VA.

DRI•WEFA Inc. 67
Appendix 1 – Cluster Composition Table Figure 47: Cluster Definitions
Cluster Names SIC3 Description SC Employ
2002
SC Emp.
Growth 2002-
07
U.S. Emp.
Growth 2002-
07
SC Employ
2007
Employment
Concentration Ratio 2002
Percent Change in Emp.
Con. Ratio
1997-02
SC Sales 2002
($Millions)
SC Sales
Growth 2002-
07
U.S. Sales
Growth 2002-
07
Apparel 237 Fur Goods 26 -5.1 -1.3 20 433.7 26.6 3.3 -2.6 -0.1 Apparel 236 Girl's and Children's Outerwear 662 -7.8 -1.4 441 406.6 60.8 83.6 -5.4 -0.1 Apparel 238 Miscellaneous Apparel and
Accessories 937 -6.0 -1.2 688 294.9 -20.6 118.2 -3.5 0.1
Apparel 239 Misc. Fabricated Textile Products 6,919 -6.6 -0.3 4,920 236.7 -29.8 1,005.7 -3.5 1.8 Apparel 232 Men's and Boys' Furnishings 3,086 -10.1 -2.1 1,817 215.3 -4.0 389.9 -7.7 -0.8 Apparel 233 Women's and Misses' Outerwear 1,942 -9.8 -1.2 1,160 106.2 -16.1 244.6 -7.5 0.1 Apparel 231 Men's and Boys' Suits and Coats 248 -10.1 -2.0 146 97.8 -23.2 31.4 -7.7 -0.7 Apparel 234 Women's and Children's
Undergarments 105 -11.5 -2.6 57 53.6 -18.6 13.3 -9.2 -1.3
Apparel Total 13,925 -7.9 -1.1 9,249 195.5 -13.9 1,889.8 -5.0 0.5 Components & Sub-Assemblies 369 Misc. Electrical Equipment & Supplies 3,667 1.7 -0.3 3,981 198.7 25.0 920.5 13.6 2.7 Components & Sub-Assemblies 363 Household Appliances 2,503 -0.2 -0.8 2,474 153.8 -3.3 652.5 4.4 2.5 Components & Sub-Assemblies 361 Electric Distribution Equipment 1,491 1.0 -0.7 1,570 148.2 2.1 324.0 6.9 2.6 Components & Sub-Assemblies 364 Electric Lighting and Wiring Equipment 3,159 1.1 -0.3 3,340 143.3 6.9 622.7 7.3 3.5 Components & Sub-Assemblies 362 Electrical Industrial Apparatus 2,632 0.1 -0.2 2,649 110.1 3.6 491.1 5.4 3.6 Components & Sub-Assemblies 367 Electronic Components and
Accessories 8,284 -0.1 1.1 8,238 90.6 -7.3 3,575.7 16.4 10.9
Components & Sub-Assemblies Total
21,736 0.5 0.3 22,252 119.3 0.5 6,586.5 13.1 7.5
Food & Agriculture 497 Irrigation Systems 65 5.3 2.3 84 240.0 8.9 11.5 8.3 6.7 Food & Agriculture 201 Meat Products 10,315 1.6 0.2 11,155 141.4 2.1 2,053.1 4.0 4.0 Food & Agriculture 075 Animal Services, Ex. Veterinary 1,835 1.5 2.1 1,978 88.5 2.5 164.3 4.2 4.1 Food & Agriculture 074 Veterinary Services 3,054 2.8 2.6 3,512 84.7 4.5 200.5 12.4 2.6 Food & Agriculture 02 Agricultural Production - Livestock 20,566 -0.2 0.2 20,325 76.0 -4.2 1,220.0 2.2 2.6 Food & Agriculture 206 Sugar and Confectionery Products 922 -0.3 -0.4 906 72.3 23.2 221.5 4.4 4.9 Food & Agriculture 205 Bakery Products 2,073 -2.9 -0.2 1,787 63.6 -4.2 359.6 1.5 5.3 Food & Agriculture 01 Agricultural Production - Crops 19,248 -1.0 0.0 18,324 62.1 -8.8 1,141.8 1.4 2.5 Food & Agriculture 072 Crop Services 461 2.6 2.2 525 56.1 6.4 41.3 5.3 4.2 Food & Agriculture 203 Preserved Fruits and Vegetables 1,448 -5.1 -0.4 1,115 56.1 -13.5 361.0 0.5 5.3

DRI•WEFA Inc. 68
Cluster Names SIC3 Description SC Employ
2002
SC Emp.
Growth 2002-
07
U.S. Emp.
Growth 2002-
07
SC Employ
2007
Employment
Concentration Ratio 2002
Percent Change in Emp.
Con. Ratio
1997-02
SC Sales 2002
($Millions)
SC Sales
Growth 2002-
07
U.S. Sales
Growth 2002-
07
Food & Agriculture 092 Fish Hatcheries & Preserves 84 0.9 1.2 88 55.7 8.7 26.3 3.3 4.3 Food & Agriculture 091 Commercial Fishing 77 -1.1 0.8 73 52.2 4.4 24.1 1.3 3.9 Food & Agriculture 202 Dairy Products 964 -0.7 -0.3 929 46.3 5.2 482.8 2.7 3.7 Food & Agriculture Total 61,047 -0.1 0.2 60,717 75.1 -3.2 6,296.4 3.1 3.6 Forestry, Wood, and Paper 085 Forestry Services 1,433 2.6 2.5 1,631 331.4 0.1 449.3 5.1 5.6 Forestry, Wood, and Paper 263 Paperboard Mills 2,135 -4.3 -1.1 1,712 289.4 -6.0 940.9 1.6 4.5 Forestry, Wood, and Paper 241 Logging 2,939 -1.2 -0.9 2,765 254.5 -8.9 913.8 4.0 3.9 Forestry, Wood, and Paper 262 Paper Mills 3,157 -0.6 -2.2 3,062 228.2 8.7 1,390.0 5.5 3.4 Forestry, Wood, and Paper 267 Misc. Converted Paper Products 7,229 1.6 0.1 7,834 207.7 9.4 2,061.9 5.9 3.6 Forestry, Wood, and Paper 249 Miscellaneous Wood Products 2,164 1.0 0.4 2,273 173.5 8.9 454.8 5.4 4.5 Forestry, Wood, and Paper 242 Sawmills and Planing Mills 3,908 0.7 -0.4 4,052 155.0 -4.0 748.5 5.4 4.3 Forestry, Wood, and Paper 265 Paperboard Containers and Boxes 4,318 -1.4 -0.5 4,018 141.0 -7.2 876.4 1.1 3.9 Forestry, Wood, and Paper 243 Millwork, Plywood & Structural
Members 3,953 1.4 -0.3 4,232 95.1 -10.1 671.9 5.9 4.3
Forestry, Wood, and Paper 244 Wood Containers 779 1.3 0.7 831 93.0 -9.8 65.0 6.2 4.9 Forestry, Wood, and Paper 251 Household Furniture 2,081 -1.9 0.2 1,886 59.1 -21.8 266.3 0.6 4.1 Forestry, Wood, and Paper Total 34,096 0.1 -0.2 34,296 151.3 -4.2 8,839.0 4.5 4.0 Machinery & Fabricated Metals 356 General Industrial Machinery 7,573 2.8 -0.3 8,691 214.9 4.4 1,310.8 9.6 4.3 Machinery & Fabricated Metals 342 Cutlery, Handtools, and Hardware 3,022 -1.1 -0.5 2,860 185.1 19.1 660.3 3.4 3.2 Machinery & Fabricated Metals 352 Farm and Garden Machinery 2,404 1.0 -0.7 2,531 181.8 -13.7 528.6 6.3 2.6 Machinery & Fabricated Metals 354 Metal Working Machinery 6,550 3.4 -0.2 7,733 170.4 12.6 1,159.8 10.1 4.2 Machinery & Fabricated Metals 349 Misc. Fabricated Metal Products 6,660 1.1 0.0 7,020 157.1 6.5 1,189.6 5.9 3.6 Machinery & Fabricated Metals 355 Special Industry Machinery 3,012 -0.7 -0.1 2,913 117.6 -14.5 489.6 7.5 5.0 Machinery & Fabricated Metals 358 Refrigeration and Service Machinery 3,279 4.0 -0.2 3,996 108.9 -3.9 600.6 8.7 2.8 Machinery & Fabricated Metals 343 Plumbing and Heating, Ex. Electric 644 0.3 0.3 654 98.0 5.7 174.8 5.1 3.6 Machinery & Fabricated Metals 359 Industrial Machinery, NEC 5,314 2.9 0.5 6,139 89.0 -7.6 629.6 9.1 4.1 Machinery & Fabricated Metals 341 Metal Cans and Shipping Containers 359 -4.6 -2.0 284 83.6 -12.3 194.8 1.5 2.6 Machinery & Fabricated Metals 344 Fabricated Structural Metal Products 4,849 -1.5 0.1 4,494 73.0 -9.8 860.3 2.0 3.5 Machinery & Fabricated Metals 346 Metal Forgings and Stampings 2,288 0.1 -0.4 2,297 69.1 12.3 492.0 5.0 3.6 Machinery & Fabricated Metals 348 Ordnance and Accessories, NEC 272 -7.8 -2.5 181 61.0 -0.8 40.0 -1.1 3.5 Machinery & Fabricated Metals 347 Metal Services, NEC 857 -0.2 0.4 850 47.4 0.4 131.0 5.5 4.2 Machinery & Fabricated Metals 345 Screw Machine Products, Bolts, Etc. 785 1.0 1.2 825 46.5 14.5 85.0 4.5 3.8

DRI•WEFA Inc. 69
Cluster Names SIC3 Description SC Employ
2002
SC Emp.
Growth 2002-
07
U.S. Emp.
Growth 2002-
07
SC Employ
2007
Employment
Concentration Ratio 2002
Percent Change in Emp.
Con. Ratio
1997-02
SC Sales 2002
($Millions)
SC Sales
Growth 2002-
07
U.S. Sales
Growth 2002-
07
Machinery & Fab. Metals Total 47,868 1.5 0.0 51,468 116.5 -1.4 8,546.6 6.9 3.7 Materials 282 Plastics Materials and Synthetics 9,878 -0.2 -0.5 9,792 545.9 -31.5 3,879.3 4.6 4.5 Materials 281 Industrial Inorganic Chemicals 5,134 -4.9 -0.4 3,991 486.0 -47.2 2,671.7 -0.2 4.4 Materials 305 Hose & Belting & Gaskets & Packing 2,830 2.5 0.2 3,209 333.3 27.9 476.3 5.5 2.6 Materials 306 Fabricated Rubber Products, NEC 3,041 -1.4 -0.1 2,832 237.1 17.4 520.6 1.8 2.5 Materials 322 Glass and Glassware, Pressed or
Blown 1,715 -3.6 -1.8 1,430 206.7 -5.0 367.3 1.1 2.2
Materials 321 Flat Glass 304 -2.5 -2.8 268 184.4 16.5 64.9 2.2 0.4 Materials 333 Primary Nonferrous Metals 610 -3.3 -1.2 516 176.0 13.8 184.2 -7.8 2.8 Materials 308 Miscellaneous Plastics Products NEC 16,089 1.6 0.2 17,376 163.6 24.7 2,826.2 5.0 3.1 Materials 286 Industrial Organic Chemicals 2,676 1.3 -0.2 2,854 153.8 4.5 1,360.9 6.4 4.6 Materials 323 Products of Purchased Glass 1,409 0.6 0.2 1,455 149.1 23.8 301.3 5.5 3.4 Materials 335 Nonferrous Rolling and Drawing 3,283 0.5 -0.5 3,358 143.7 6.2 1,001.4 4.1 3.9 Materials 289 Miscellaneous Chemical Products 1,543 0.7 -0.1 1,598 118.3 -9.9 446.8 5.9 4.5 Materials 331 Blast Furnace and Basic Steel
Products 3,334 -0.4 -1.9 3,266 118.1 14.7 1,338.2 5.2 3.0
Materials 287 Agricultural Chemicals 568 -0.2 0.3 562 97.3 -31.3 206.8 0.7 2.2 Materials Total 52,414 0.0 -0.3 52,507 202.7 -9.5 15,645.7 3.8 3.6 Professional Services 871 Engineering & Architectural Services 14,636 1.4 1.2 15,716 87.5 -4.0 2,258.1 6.6 6.9 Professional Services 874 Management and Public Relations 18,390 4.2 4.0 22,610 87.0 6.6 2,037.1 7.5 7.7 Professional Services 872 Accounting, Auditing, & Bookkeeping 6,214 2.7 2.0 7,106 52.0 2.6 656.7 7.1 6.9 Professional Services 873 Research and Testing Services 1,626 3.2 2.7 1,902 20.2 3.5 182.5 6.7 6.9 Professional Services Total 40,866 3.0 2.6 47,334 70.6 2.6 5,134.3 7.1 7.2 Textiles 222 Broadwoven Fabric Mills, Manmade 16,965 -5.2 -2.2 13,022 2,038.1 0.8 2,751.8 -3.3 -0.1 Textiles 226 Textile finishing, Except Wool 11,321 -1.3 -0.9 10,611 1,915.9 19.5 1,822.6 0.6 1.3 Textiles 221 Broadwoven Fabric Mills, Cotton 9,076 -1.0 -2.1 8,627 1,719.1 8.1 1,471.1 0.9 -0.1 Textiles 224 Narrow Fabric Mills 1,793 0.6 -1.8 1,843 817.1 28.2 163.8 3.6 0.7 Textiles 228 Yarn and Thread Mills 7,602 -3.2 -2.5 6,464 779.9 -3.3 1,061.3 -1.5 0.2 Textiles 229 Miscellaneous Textile Goods 5,482 -0.2 -1.0 5,435 752.0 7.0 913.6 2.0 0.7 Textiles 225 Knitting Mills 7,600 -1.8 -2.6 6,923 526.4 40.0 1,113.4 1.7 0.2 Textiles 227 Carpets and Rugs 2,359 -1.2 -1.4 2,216 284.1 -9.1 569.8 1.0 2.5 Textiles Total 62,198 -2.4 -1.9 55,141 1,011.6 8.6 9,867.4 -0.2 0.8 Tourism 097 Hunting, Trapping, Game Prop. 231 1.2 1.4 245 217.3 -0.1 72.4 3.6 4.5

DRI•WEFA Inc. 70
Cluster Names SIC3 Description SC Employ
2002
SC Emp.
Growth 2002-
07
U.S. Emp.
Growth 2002-
07
SC Employ
2007
Employment
Concentration Ratio 2002
Percent Change in Emp.
Con. Ratio
1997-02
SC Sales 2002
($Millions)
SC Sales
Growth 2002-
07
U.S. Sales
Growth 2002-
07
Tourism 799 Misc. Amusement, Recreation Services 28,166 4.2 2.3 34,520 134.8 1.9 1,905.1 9.3 7.4 Tourism 703 Camps and Recreational Vehicle Parks 1,175 3.0 1.7 1,360 130.0 3.8 60.4 8.3 7.8 Tourism 701 Hotels and Motels 36,080 3.1 0.6 41,992 128.7 8.2 1,854.9 8.5 6.6 Tourism 581 Eating and Dining Places 146,435 2.5 1.7 166,039 118.7 4.4 5,403.1 5.2 6.3 Tourism 791 Dance Studios, Schools, and Halls 942 2.7 2.2 1,074 115.7 1.3 80.8 7.7 7.2 Tourism 841 Museums and Art Galleries 1,238 6.2 2.8 1,672 87.1 10.9 151.8 11.2 8.8 Tourism 792 Producers, Orchestra, Entertainers 2,294 4.1 2.6 2,810 65.5 -0.9 313.0 9.1 7.4 Tourism 793 Bowling Centers 886 -0.1 -1.2 882 64.8 0.7 29.0 6.1 5.0 Tourism 794 Commercial Sports 952 5.1 2.0 1,223 49.6 10.2 183.5 10.3 7.3 Tourism 842 Botanical and Zoological Gardens 131 4.7 3.1 165 36.8 -2.3 16.1 9.6 9.2 Tourism Total 218,530 2.9 1.6 251,982 119.6 4.7 10,070.1 7.0 6.7 Transportation Equipment 301 Tires and Inner Tubes 4,457 -0.3 -2.0 4,384 532.0 10.8 1,239.8 4.6 1.6 Transportation Equipment 351 Engines and Turbines 2,750 1.2 -1.5 2,926 259.8 -6.3 1,112.8 8.5 2.4 Transportation Equipment 374 Railroad Equipment 791 1.4 -0.5 846 188.7 29.4 246.8 5.7 6.2 Transportation Equipment 371 Motor Vehicles and Equipment 16,785 2.0 0.0 18,561 138.5 33.4 6,758.3 6.3 3.5 Transportation Equipment Total 24,783 1.5 -0.2 26,717 171.6 24.4 9,357.7 6.4 3.3 Transportation Services 449 Water Transportation Services 4,287 -1.1 1.5 4,048 194.7 -2.9 967.8 1.0 4.7 Transportation Services 422 Public Warehousing and Storage 4,870 3.8 3.0 5,864 139.1 2.1 742.2 8.6 7.0 Transportation Services 473 Freight Transportation Arrangement 3,316 5.3 2.3 4,283 133.5 36.7 338.7 9.7 6.7 Transportation Services 421 Trucking & Courier Services, Ex. Air 35,565 2.9 1.7 41,022 119.9 22.9 5,427.0 7.7 5.6 Transportation Services Total 48,038 2.8 1.9 55,217 127.0 19.3 7,475.7 7.1 5.7 Total Clusters 625,566 1.3 1.1 666,964 126.3 -2.8 89,720.8 5.5 4.9 Total All Industries 2,055,083 1.3 1.1 2,196,803 100.0 0.0 312,955.1 5.4 5.7
Source: DRI•WEFA Inc.

DRI•WEFA Inc. 71
Appendix 2 – South Carolina’s Technology Assets
Table 16 Corporate Research Center Specializations
Facility Area/Focus Location
Environmental Systems Engineering Environmental/Waste Handling Research Anderson County
Clemson Technical Center Environmental/Waste Handling Research Anderson County
Park Seed Co. Horticulture Greenwood Country
Milliken Research Center Material Science/Nanotechnology Spartanburg W.R. Grace & Co. Material Science/Nanotechnology Duncan Westvaco Corporation Material Science/Nanotechnology Charleston Bayer Material Science/Nanotechnology Bushy Park Michelin Americas Research & Development Corporation Material Science/Nanotechnology Spartanburg
Hoechst Research & Technology Material Science/Nanotechnology Clemson Fuji Photo & Film, Greenwood Research Laboratories Material Science/Nanotechnology Greenwood
Country Tile Council for America Material Science/Nanotechnology Anderson CountyBishop Center for Engineering Ceramic Manufacturing Material Science/Nanotechnology Anderson County
Kemet Electronics Corporation Material Science/Nanotechnology Greenville Sawgrass Systems Material Science/Nanotechnology Charleston Roche Carolina Pharmaceuticals Florence
Source: Company websites; Nexis.com
Table 17 Federal Research Center Specializations
Facility Area/Focus Location Cotton Quality Research Station Horticulture & Related R&D Clemson South Carolina Cooperative Fish and Wildlife Research Unit Environmental Science R&D Clemson
Savannah River Technology Center Environmental Science R&D Aiken Space and Naval Warfare Systems Center Defense R&D Charleston U.S. Vegetable Laboratory Horticulture & Related R&D Charleston Center for Forested Wetlands Environmental Science R&D Charleston Charleston Laboratory (National Oceanic and Atmospheric Administration) Environmental Science R&D Charleston
Coastal Plains Soil, Water, and Plant Research Center
Environmental Science R&D; Horticulture & Related R&D Florence
Source: Rand
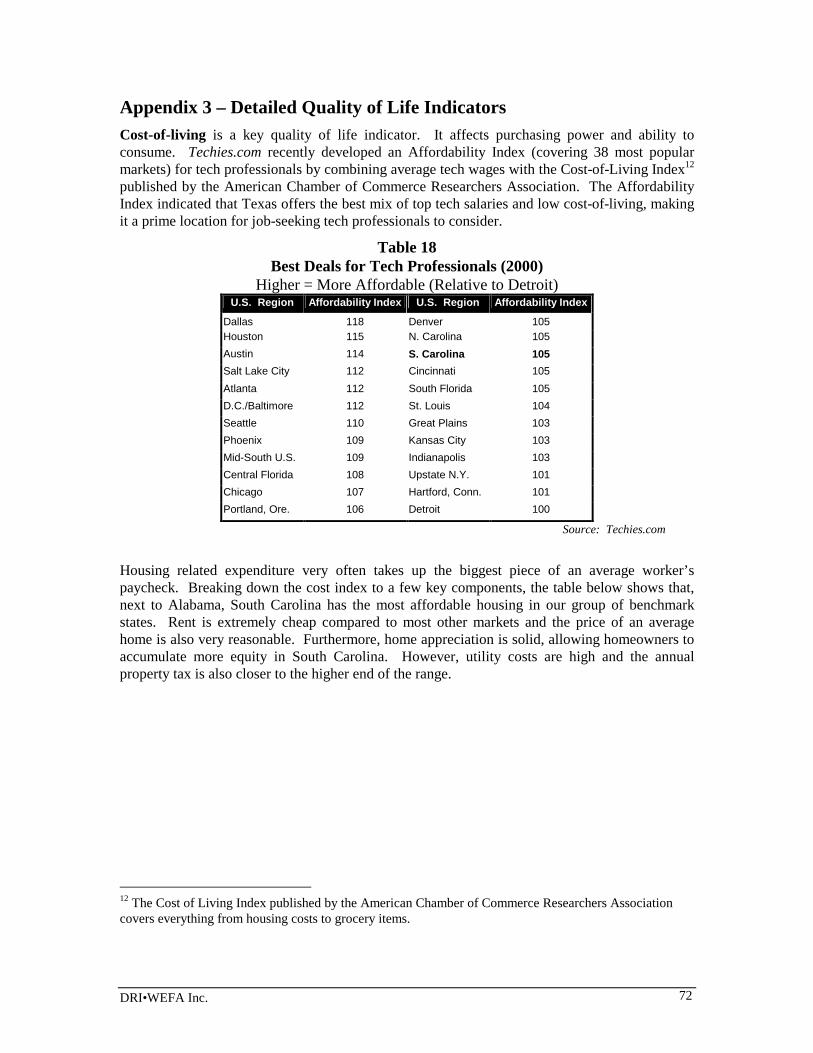
DRI•WEFA Inc. 72
Appendix 3 – Detailed Quality of Life Indicators Cost-of-living is a key quality of life indicator. It affects purchasing power and ability to consume. Techies.com recently developed an Affordability Index (covering 38 most popular markets) for tech professionals by combining average tech wages with the Cost-of-Living Index12 published by the American Chamber of Commerce Researchers Association. The Affordability Index indicated that Texas offers the best mix of top tech salaries and low cost-of-living, making it a prime location for job-seeking tech professionals to consider.
Table 18 Best Deals for Tech Professionals (2000)
Higher = More Affordable (Relative to Detroit) U.S. Region Affordability Index U.S. Region Affordability Index
Dallas 118 Denver 105 Houston 115 N. Carolina 105 Austin 114 S. Carolina 105 Salt Lake City 112 Cincinnati 105 Atlanta 112 South Florida 105 D.C./Baltimore 112 St. Louis 104 Seattle 110 Great Plains 103 Phoenix 109 Kansas City 103 Mid-South U.S. 109 Indianapolis 103 Central Florida 108 Upstate N.Y. 101 Chicago 107 Hartford, Conn. 101 Portland, Ore. 106 Detroit 100
Source: Techies.com
Housing related expenditure very often takes up the biggest piece of an average worker’s paycheck. Breaking down the cost index to a few key components, the table below shows that, next to Alabama, South Carolina has the most affordable housing in our group of benchmark states. Rent is extremely cheap compared to most other markets and the price of an average home is also very reasonable. Furthermore, home appreciation is solid, allowing homeowners to accumulate more equity in South Carolina. However, utility costs are high and the annual property tax is also closer to the higher end of the range.
12 The Cost of Living Index published by the American Chamber of Commerce Researchers Association covers everything from housing costs to grocery items.

DRI•WEFA Inc. 73
Table 19 Housing Costs – State MSAs13 (2000)
Housing Affordability* (Higher=More
Affordable)
Rent Indexββββ
Median Home Price
Annual Property Tax (Per $1000 of
Home Value)
Home Utility Cost Index
Home Appreciation
(Percent)
Alabama 117.8 68.1 128,800 7.10 101.3 7.7Arizona 105.8 84.3 127,200 9.00 106.5 8.8Colorado 101.6 101.5 170,100 8.20 85.3 8.9Georgia 89.2 114.5 126,800 16.10 97.5 9.0North Carolina 97.9 78.9 164,600 11.00 102.6 8.1South Carolina 112.1 59.8 110,500 12.70 121.2 8.7Virginia 99.2 73.8 129,100 12.00 128.2 7.7
* Based on average for group of seven benchmark states ββββDetroit, MI was chosen as the benchmark for benchmark, i.e. 1-bedroom, $1,200/month apartment = 100
Source: “Best Places to Live” Survey, Money Magazine; DRI•WEFA; Homestore.com
Apart from cost of living, a sense of security is another highly valued factor when deciding where one should locate. Although the crime rate in Columbia is higher than the national average, the city is still relatively safer than Birmingham, Alabama and Phoenix, Arizona.
Figure 48
Crime Index, 2000 (National Average=100)
Source “Best Places to Live” Survey, Money Magazine Climate and environment are factors that cannot be changed. All else equal, places that have generally good weather and an attractive natural environment have the upper hand in luring talent. South Carolina lies along the Atlantic Coastal plain. The terrain in the western part of the state is rolling hills and the eastern part of the state is mostly flat and low, with considerable wetlands. In terms of climate, South Carolina compares rather favorably with its neighbors and competitors. Although it gets a little humid, the weather is not extreme. Compared to the
13 The tables for Quality of Life indicators report data from these MSAs: Birmingham, AL; Phoenix-Mesa, AZ; Denver, CO; Atlanta, GA; Raleigh-Durham, NC; Columbia, SC; and Richmond, VA.
0
50
100
150
200
250
300
Crime Index
Alabama Arizona SouthCarolina
Georgia Virginia NorthCarlina
Colorado
Personal Crime Property Crime
Worse

DRI•WEFA Inc. 74
benchmark states, South Carolina has relatively fewer days when the temperatures are below freezing. Furthermore, it has a good amount of sunshine.
Table 20 Climate, 2000: Average Across State MSAs
Annual days with some
precipitation
Annual days with mostly sun
Annual snowfall (inches)
Annual days < 32° F
Annual days > 90° F
Average high temp in July °F
Average low temp in January °F
Alabama 118 210 1 60 39 90.3° 34.0° Arizona 34 295 0 32 164 104.8° 37.6° Colorado 88 246 60 163 32 87.4° 16.2° Georgia 116 219 2 59 19 86.5° 33.4° North Carolina 112 220 7 85 25 87.7° 30.0° South Carolina 111 223 2 60 64 92.0° 33.9° Virginia 113 210 14 85 41 88.2° 27.6°
Source “Best Places to Live” Survey, Money Magazine
In addition, South Carolina has the advantage of having relatively better air quality than most of the other states. Arizona and Alabama have the worst air quality among our group of benchmark states.
Figure 49
Air Quality Index, 2000 (Higher is Better)
Source: “Best Places to Live” Survey, Money Magazine
The 1997 Places Rated Almanac, which attempts to compare recreational and cultural aspects such as the presence of art museums and galleries, the quality of public libraries, restaurant quality, and outdoor recreation assets, found that South Carolina offers residents very good recreational opportunities but its cultural resources are below the national average.
0
20
40
60
80
100
Air Quality Index
Arizona Alabama Georgia Colorado NorthCarolina
Virginia SouthCarolina
Excellent
Terrible
National Average

DRI•WEFA Inc. 75
Compared to our benchmark states, recreational resources in South Carolina’s metropolitan areas are about the same as those in Virginia. The cultural aspect of the state is somewhat lacking, even when the comparison is just within the group of benchmark states. The “Best Places to Live” survey by Money Magazine attempts to measure this with an “Arts” Index ( see Table 21).
Table 21 Cultural Assets
Arts Index Colorado 31Virginia 18Georgia 17North Carolina 14National Average 11.5South Carolina 9Alabama 7Arizona 4
Source: “Best Places to Live” Survey, Money Magazine

DRI•WEFA Inc. 76
Appendix 4 - Example of Cluster Development in Connecticut From: Connecticut Industry Clusters: Competitive Strategies – Collaboration – Results
In 1998, Connecticut undertook a cluster-based economic development study. A task force was formed of 125 business leaders. They identified six industry clusters that are key to Connecticut’s economic competitiveness. Some of these clusters, such as Tourism, were already naturally formed and already had strong public-private partnerships associated with them. Other clusters, such as manufacturing, financial services, telecommunications and information, health care services, and high technology, developed specific cluster strategies that included launching cluster associations. The entire process was kick-started with the establishment of the Governor’s Council on Economic Competitiveness and Technology. This was comprised of CEOs from a cross-section of industries, legislative leaders, heads of key educational institutions, labor representatives, officials of industry associations and several state commissioners.
Highlights of Connecticut’s cluster initiatives include:
♦ October 1998: Launched the BioScience cluster, overseen by the Connecticut United for Research Excellence (CURE). The cluster was launched with $300,000 from state funds and $700,000 in industry contributions.
♦ July 1999: With the direction of Aerospace Components Manufacturers, launched the Aerospace cluster. The state invested $125,000 in seed funds, while industry contributed additionally.
♦ October 1999: The Software/Information Technology cluster was launched. The collaborative group is called eBizCT, an affiliate of the Connecticut Technology Council (CTC). More than $300,000 in seed money helped launch the cluster, with half funded by the state.
♦ 1999: The Metal Manufacturing cluster began with a $10,000 grant. The Metal Manufacturing Education and Training Alliance (META) recently received a $1.7 million federal workforce training grant
♦ January 2001: The Connecticut Maritime Coalition was formed and launched the Maritime cluster. The cluster was seeded with $103,000 from the state and matching private resources.
More information about each cluster and their initiatives can be found at
http://www.state.ct.us/ecd/Clusters/default.htm.

DRI•WEFA Inc. 77
Glossary of Terms benchmark states – states that serve as a point of reference for evaluating another state’s performance
benchmarking – comparing a process or level of achievement to similar entities, with the goal of discovering one’s own relative standing as well as the “best practice” entities
best practice states – states that employ some of the most effective strategies in economic development and exhibit the strongest benefits from these strategies
business climate – the cost and regulatory environment in which businesses must operate within a region
cash cow cluster – clusters that have above average concentration within a region, but face a market that is growing slower than average
challenge clusters - clusters that have below average concentration within a region, and face a market that is growing slower than average
cluster – a geographical concentration of industries that gain performance advantages through co-location. Industries may share similar workforce, input, or infrastructure needs, or may produce similar output.
Cluster Power Index – a weighted score that that is indexed to reflect the relative rank of the strength of a cluster among all 50 states. The index is composed of the size current employment in the cluster, the forecast growth of the cluster’s regional output over the next five years, and the concentration of the cluster within the region
cluster strategy – general economic development directions that a cluster should take, according to its dynamism, concentration, and internal characteristics
clustering – proactively accelerating the process of creating institutions that provide needed economic infrastructure and strengthening linkages between networks of firms and these institutions
competitiveness – the relative ability of a region to strive towards an objective in a more successful manner than its rivals; in economic terms, the relative ability of a region to generate a higher amount of output (growth, income, revenues etc.) for a given increase in investment
demographic cohort – the segment of a population that falls between a specified age range
economic foundation – the economic infrastructure, labor force skill, access to capital, technology, infrastructure, business climate, and quality of life, that supports the location, growth, and competitiveness of companies within a region
economic value chain – the entire cycle of economic activities (R&D, design, assembly and production, distribution, and marketing) that contribute to the final output of a product
employment concentration ratio (ECR) – the sectoral share of a region’s employment relative to the national average share. An ECR greater than 1 indicates a strong market position or specialization within the region. This measure is sometimes called the location quotient.
FIRE – financial, insurance, and real estate industries
gross state product (GSP) – the total amount of value-added produced in a state
gross state product (GSP) per capita – the total amount of value-added produced in a state per state resident

DRI•WEFA Inc. 78
industrial composition – the relative proportions of types of industries that exist in a region
industry cluster – see cluster
labor force participation rate - the percentage of all people aged 15 to 65 that are employed or actively seeking employment; measures the utilization rate of the potential pool of labor in a region
labor force skills – the educational attainments and technical abilities of the labor force (employees and those actively seeking employment)
linkages – the connections and common interests that unite the different actors along the value chain within a cluster, or between clusters
opportunity clusters – clusters that have a market that is growing at an above average rate but have a below average concentration within a region
proprietors’ income – the income that owners of a business or an agricultural operation receive
quality of life – the amount of positive amenities (favorable climate, access to recreational and cultural activities, low cost of living) and limited amount of detractors (crime, pollution, congestion) in a region that contribute to an individual’s perceived well-being of residence in that region
real disposable personal income per capita – the average amount of after-tax income from all sources that an individual receives
real personal income – the sum of all pre-tax income from all sources that is received by the population within a region
residence adjustment – a factor that is applied to the personal income received in a region that adjusts for income received at a place of employment other than the region of residence
seed cluster – a narrowly defined industry cluster that is much smaller than an established cluster, but shows signs of developing into a specialty within a region
segmentation analysis – the process of classifying an industry cluster according to its growth (dynamism) and concentration within a region
star clusters – clusters that have a market that is growing at an above average rate and have an above average concentration within a region
system of innovation – a model that emphasizes the interdependence of economic participants in creating innovation
technology assets – the corporate, federal, and academic research and development centers and similar facilities that generate new technologies or applications within a region
transfer payments – income maintenance payments (such as supplementary income), unemployment income, and pension and retirement income payments