The South African Forestry and Forest Products Industry 2007 Roger Godsmark Produced by Forestry...
132
The South African Forestry and The South African Forestry and Forest Products Industry 2007 Forest Products Industry 2007 Roger Godsmark Roger Godsmark Produced by Forestry South Africa, August 2008 Produced by Forestry South Africa, August 2008
-
Upload
jody-farmer -
Category
Documents
-
view
217 -
download
0
Transcript of The South African Forestry and Forest Products Industry 2007 Roger Godsmark Produced by Forestry...
The South African Forestry and Forest The South African Forestry and Forest Products Industry 2007Products Industry 2007
Roger GodsmarkRoger Godsmark
Produced by Forestry South Africa, August 2008Produced by Forestry South Africa, August 2008
Presentation OutlinePresentation Outline
IntroductionIntroduction
The importance of the Forestry IndustryThe importance of the Forestry Industry
The importance of the Forest Products IndustryThe importance of the Forest Products Industry
Industry Contribution to EmploymentIndustry Contribution to Employment
InvestmentInvestment
Industry Contribution to GDPIndustry Contribution to GDP
Industry Contribution to Foreign TradeIndustry Contribution to Foreign Trade

Section 1 Section 1 Introduction Introduction

Land Use in South AfricaLand Use in South Africa
68.6%
13.8%
9.6%
1.0%
6.9%
Grazing Arable Nature Conservation Other Forestry
Total RSA land area – 122.3 million haTotal RSA land area – 122.3 million ha
1 266 196 ha
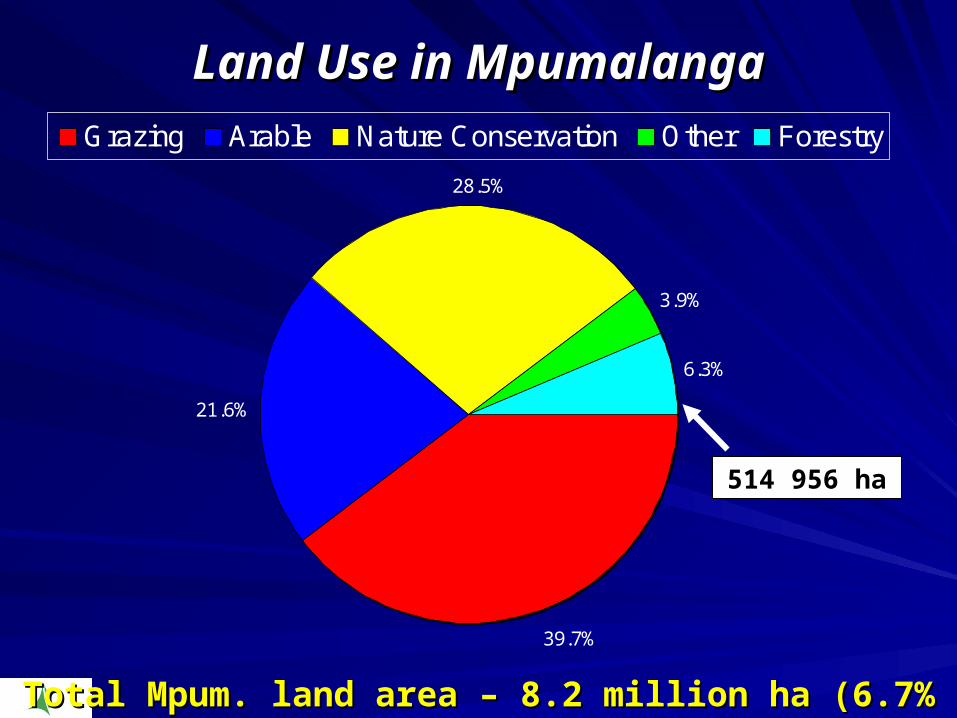
Land Use in MpumalangaLand Use in Mpumalanga
39.7%
21.6%
28.5%
6.3%
3.9%
Grazing Arable Nature Conservation Other Forestry
Total Mpum. land area – 8.2 million ha (6.7% of total)Total Mpum. land area – 8.2 million ha (6.7% of total)
514 956 ha
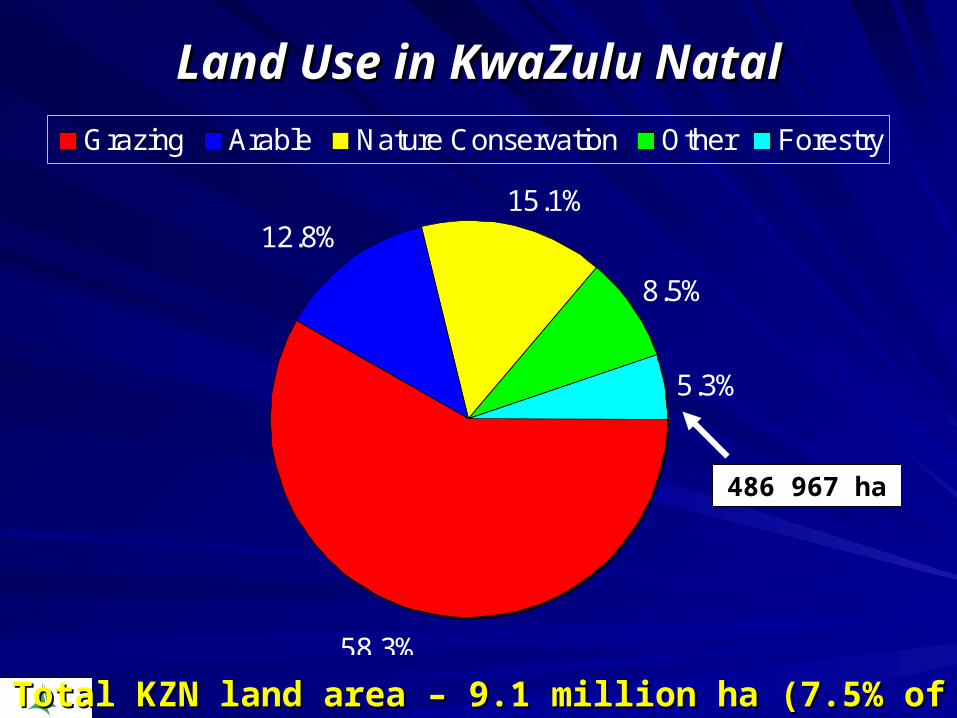
Land Use in KwaZulu NatalLand Use in KwaZulu Natal
58.3%
12.8%15.1%
5.3%
8.5%
Grazing Arable Nature Conservation Other Forestry
Total KZN land area – 9.1 million ha (7.5% of total)Total KZN land area – 9.1 million ha (7.5% of total)
486 967 ha

Land Use in the Eastern CapeLand Use in the Eastern Cape
80.0%
6.7%
3.7%
0.9%
8.7%
Grazing Arable Nature Conservation Other Forestry
Total E. Cape land area – 17.1 million ha (13.9% of total)Total E. Cape land area – 17.1 million ha (13.9% of total)
155 078 ha
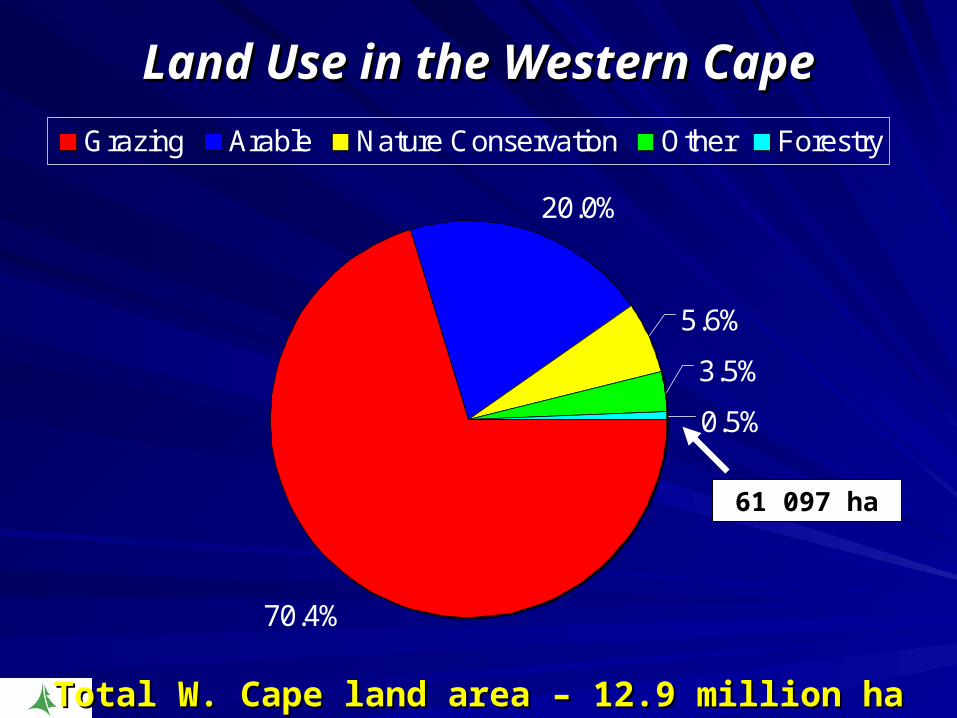
Land Use in the Western CapeLand Use in the Western Cape
70.4%
20.0%
5.6%
0.5%
3.5%
Grazing Arable Nature Conservation Other Forestry
Total W. Cape land area – 12.9 million ha (10.6% of total)Total W. Cape land area – 12.9 million ha (10.6% of total)
61 097 ha
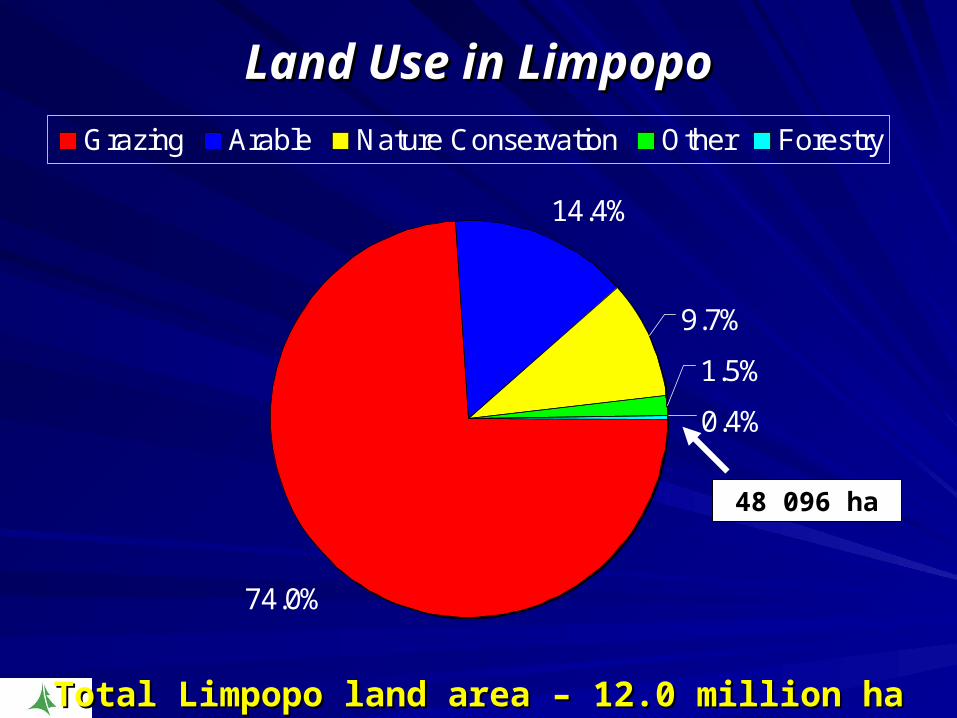
Land Use in LimpopoLand Use in Limpopo
74.0%
14.4%
9.7%
0.4%
1.5%
Grazing Arable Nature Conservation Other Forestry
Total Limpopo land area – 12.0 million ha (9.8% of total).Total Limpopo land area – 12.0 million ha (9.8% of total).
48 096 ha
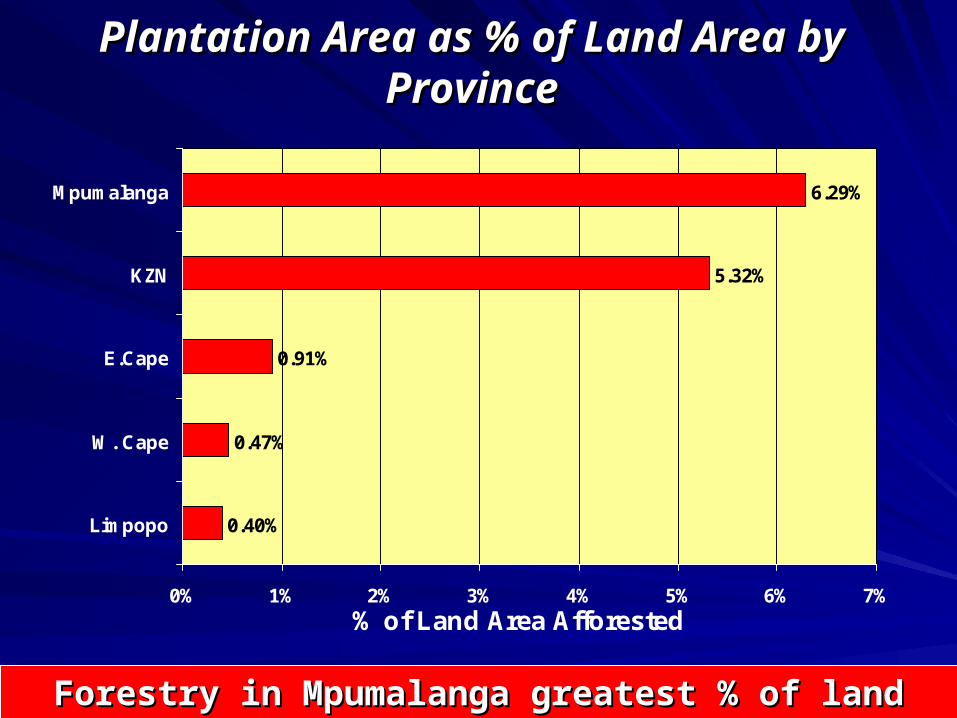
Plantation Area as % of Land Area by Plantation Area as % of Land Area by ProvinceProvince
0.40%
0.47%
0.91%
5.32%
6.29%
0% 1% 2% 3% 4% 5% 6% 7%
Limpopo
W. Cape
E.Cape
KZN
Mpumalanga
% of Land Area Afforested
Forestry in Mpumalanga greatest % of land areaForestry in Mpumalanga greatest % of land area
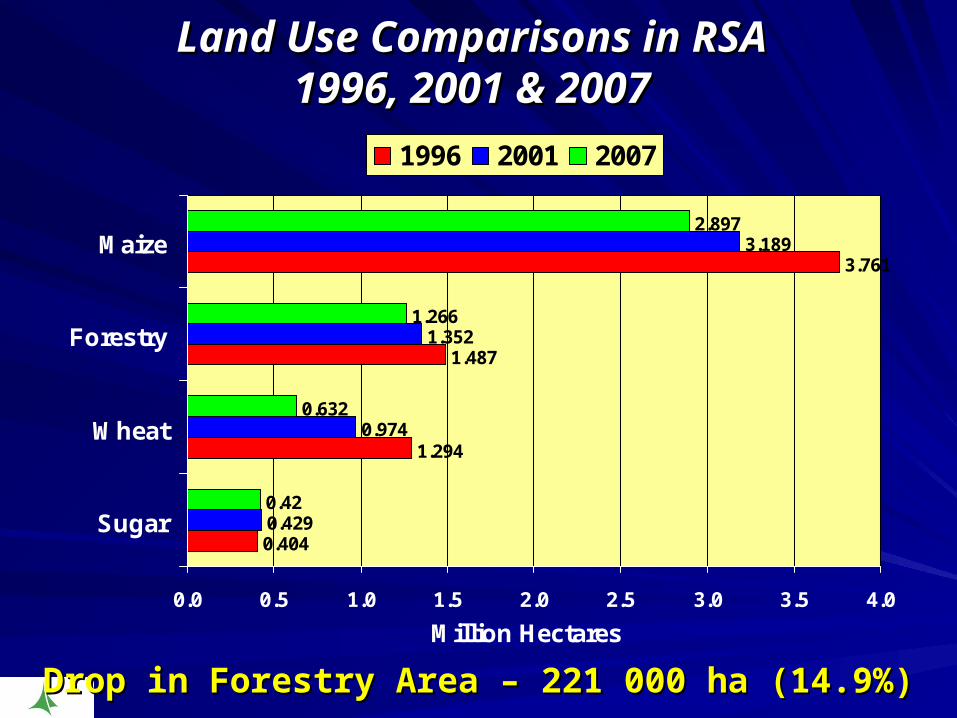
Land Use Comparisons in RSALand Use Comparisons in RSA1996, 2001 & 20071996, 2001 & 2007
0.404
1.294
1.487
3.761
0.429
0.974
1.352
3.189
0.42
1.266
2.897
0.632
0.0 0.5 1.0 1.5 2.0 2.5 3.0 3.5 4.0
Sugar
Wheat
Forestry
Maize
Million Hectares
1996 2001 2007
Drop in Forestry Area – 221 000 ha (14.9%)Drop in Forestry Area – 221 000 ha (14.9%)

Section 2Section 2The Forestry Industry The Forestry Industry
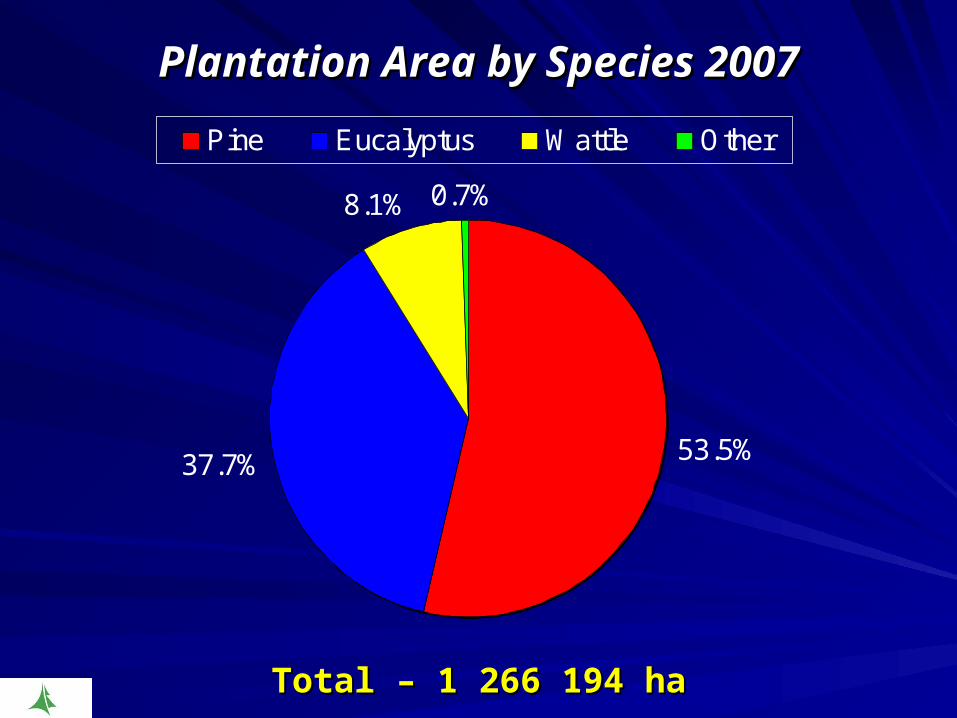
Plantation Area by Species 2007Plantation Area by Species 2007
53.5%37.7%
8.1% 0.7%
Pine Eucalyptus Wattle Other
Total – 1 266 194 haTotal – 1 266 194 ha

Plantation Area by Ownership 2007Plantation Area by Ownership 2007
48.4%
19.8%11.3%
6.9%
3.6%
10.1%
Corporate Commercial Farmers Corporate (Ex Safcol)SAFCOL State/ Municipalities Small Growers
Total – 1 266 194 haTotal – 1 266 194 ha

Plantation Area by Province 2007Plantation Area by Province 2007
3.8%
40.7%
38.5%
4.8%
12.2%
Limpopo Mpumalanga KZN E. Cape W. Cape
Total – 1 266 194 haTotal – 1 266 194 ha

Plantation Area by Province and Genera 2007Plantation Area by Province and Genera 2007
57 789
27 729
130 305
145 874
315 382
3 308
20 367
24 774
341 092
199 574
0 100 000 200 000 300 000 400 000 500 000
W. Cape
Limpopo
E.Cape
KZN
Mpumalanga
Hectares
Softwood Hardwood
Total – 677 079 ha (softwood)Total – 677 079 ha (softwood)Total – 589 115 ha (hardwood)Total – 589 115 ha (hardwood)
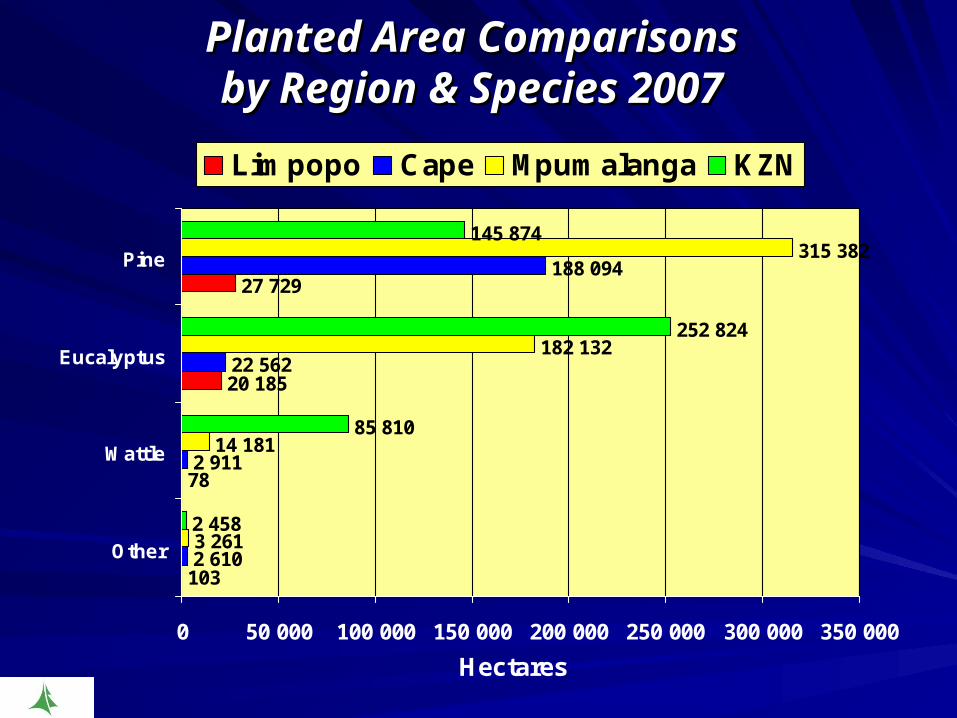
Planted Area ComparisonsPlanted Area Comparisonsby Region & Species 2007by Region & Species 2007
103
78
20 185
27 729
2 610
2 911
22 562
188 094
3 261
182 132
315 382
2 458
85 810
252 824
145 874
14 181
0 50 000 100 000 150 000 200 000 250 000 300 000 350 000
Other
Wattle
Eucalyptus
Pine
Hectares
Limpopo Cape Mpumalanga KZN

Pine Plantation Area by Region 2007Pine Plantation Area by Region 2007
46.6%
21.5%
27.8%
4.1%
Mpumalanga KZN Cape Limpopo
Total – 677 079 ha (53.5% of total)Total – 677 079 ha (53.5% of total)

Eucalyptus Plantation Area by Region 2007Eucalyptus Plantation Area by Region 2007
38.1%
52.9%
4.7% 4.2%
Mpumalanga KZN Cape Limpopo
Total – 477 703 ha (37.7% of total)Total – 477 703 ha (37.7% of total)
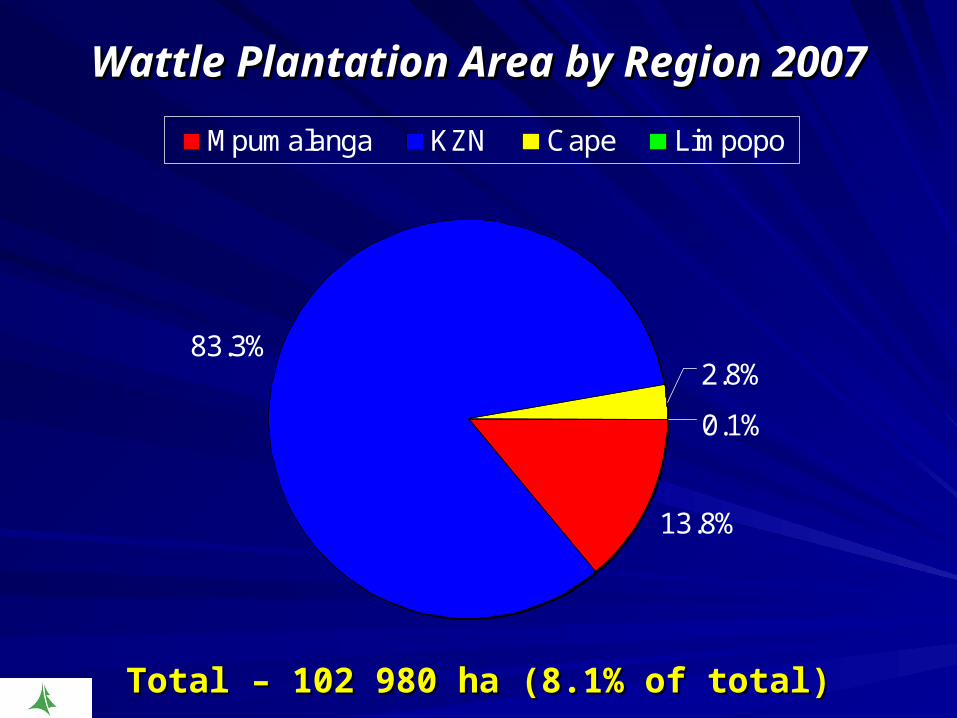
Wattle Plantation Area by Region 2007Wattle Plantation Area by Region 2007
13.8%
83.3%2.8%
0.1%
Mpumalanga KZN Cape Limpopo
Total – 102 980 ha (8.1% of total)Total – 102 980 ha (8.1% of total)

Other Hardwood Plantation Area Other Hardwood Plantation Area by Region 2007by Region 2007
38.7%
29.2%
31.0% 1.2%
Mpumalanga KZN Cape Limpopo
Total – 8 432 ha (0.7% of total)Total – 8 432 ha (0.7% of total)
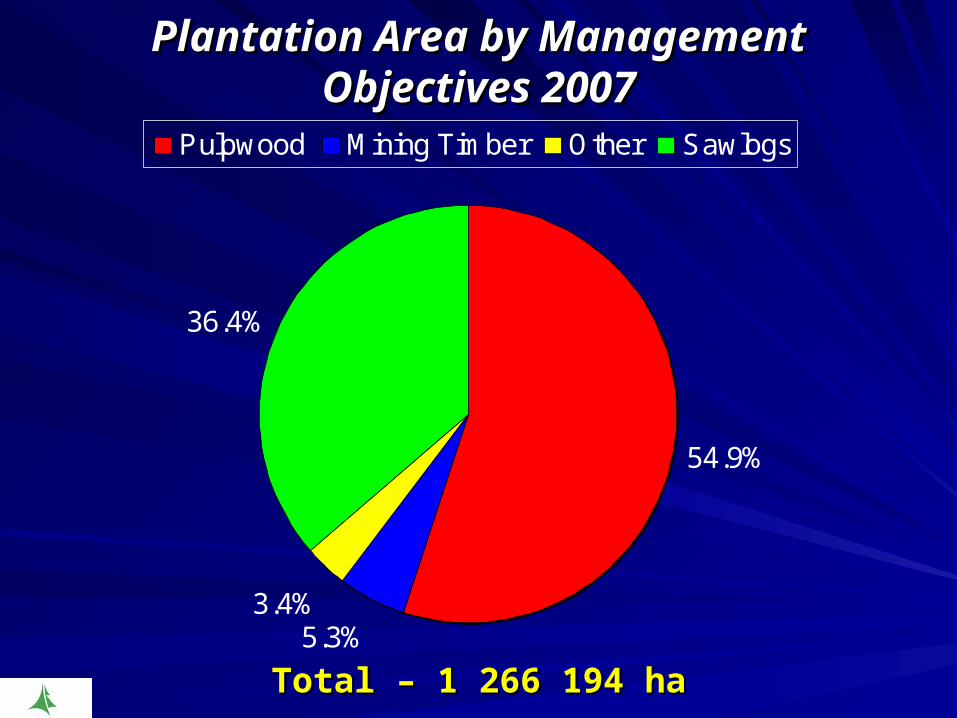
Plantation Area by Management Plantation Area by Management Objectives 2007Objectives 2007
54.9%
5.3%3.4%
36.4%
Pulpwood Mining Timber Other Sawlogs
Total – 1 266 194 haTotal – 1 266 194 ha

Softwood Plantation Area by Softwood Plantation Area by Management Objectives 2007Management Objectives 2007
68.5%
30.4%
0.9%
0.1%
Sawlogs Pulpwood Poles Other
Total – 677 079 haTotal – 677 079 ha

Hardwood Plantation Area by Hardwood Plantation Area by Management Objectives 2007Management Objectives 2007
3.4%
79.7%
3.5%
11.5%
1.9%
Sawlogs Pulpwood Poles Other Mining Timber
Total – 589 118 haTotal – 589 118 ha

Plantation Area by Province and Ownership Plantation Area by Province and Ownership 20072007
562
22 693
31 049
32 245
128 423
60 535
25 403
124 030
454 721
386 534
0 100 000 200 000 300 000 400 000 500 000 600 000
W. Cape
Limpopo
E.Cape
KZN
Mpumalanga
Hectares
Public Private
Total Private – 1 051 223 ha (83%)Total Private – 1 051 223 ha (83%)Total Public – 214 971 ha (17%)Total Public – 214 971 ha (17%)
Leased Safcol packages included in
“Private”

Percentage Plantation OwnershipPercentage Plantation Ownershipby Province 2007by Province 2007
99%93%80%
53%
75%
0%
10%
20%
30%
40%
50%
60%
70%
80%
90%
100%
Limpopo Mpumalanga E.Cape KZN W. Cape
Province
Publicly Owned Privately Owned
Total Private – 1 051 223 ha (83%)Total Private – 1 051 223 ha (83%)Total Public – 214 971 ha (17%)Total Public – 214 971 ha (17%)
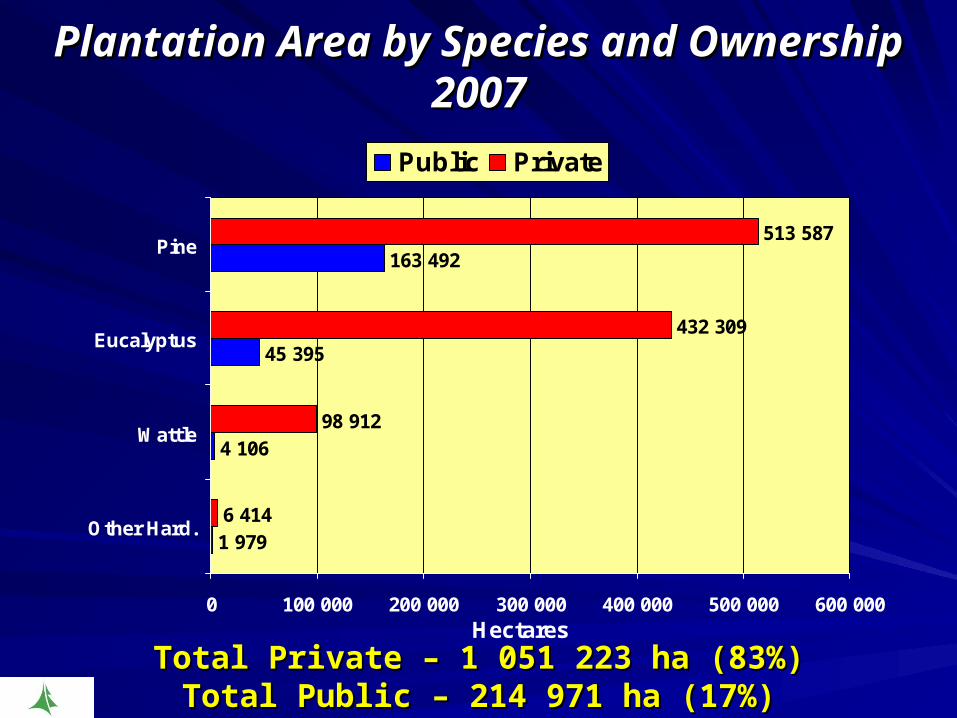
Plantation Area by Species and Ownership Plantation Area by Species and Ownership 20072007
1 979
4 106
45 395
163 492
6 414
98 912
432 309
513 587
0 100 000 200 000 300 000 400 000 500 000 600 000
Other Hard.
Wattle
Eucalyptus
Pine
Hectares
Public Private
Total Private – 1 051 223 ha (83%)Total Private – 1 051 223 ha (83%)Total Public – 214 971 ha (17%)Total Public – 214 971 ha (17%)
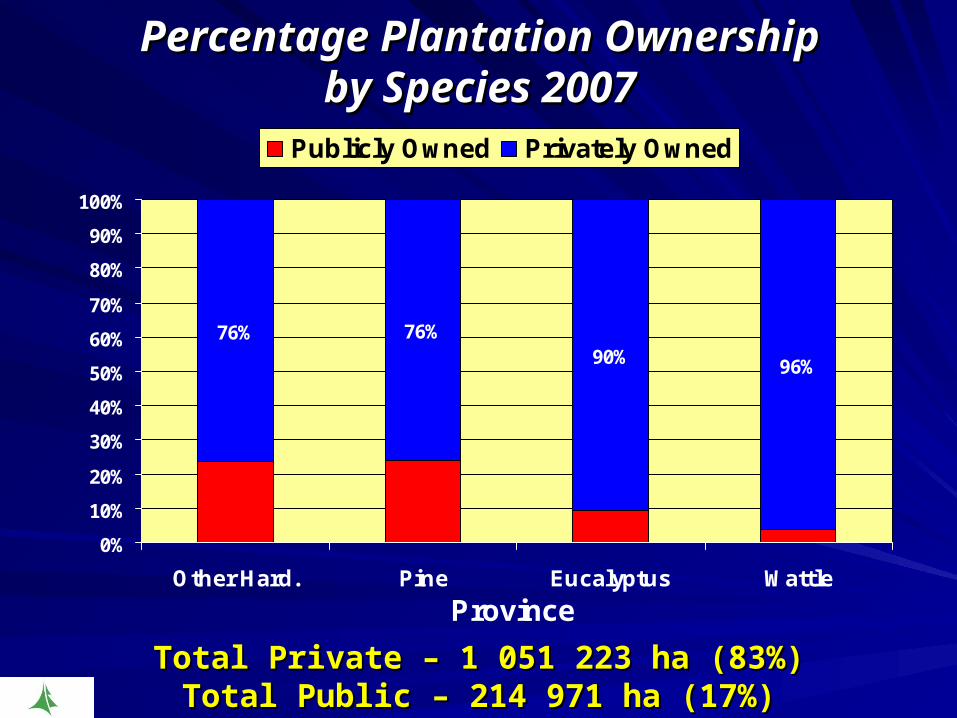
Percentage Plantation OwnershipPercentage Plantation Ownershipby Species 2007by Species 2007
96%90%76% 76%
0%
10%
20%
30%
40%
50%
60%
70%
80%
90%
100%
Other Hard. Pine Eucalyptus Wattle
Province
Publicly Owned Privately Owned
Total Private – 1 051 223 ha (83%)Total Private – 1 051 223 ha (83%)Total Public – 214 971 ha (17%)Total Public – 214 971 ha (17%)

Planted Area ComparisonsPlanted Area Comparisonsby Region & Product 2007by Region & Product 2007
25 923
2 026
146 315
41 912
7 911
4 680
35 178
327
5 733
214 187
236 862
3 835
2 649
64 782
415 701
58 174
0 100 000 200 000 300 000 400 000 500 000
Other
Mining Timber
Sawlogs
Pulpwood
Hectares
Cape Limpopo Mpumalanga KZN
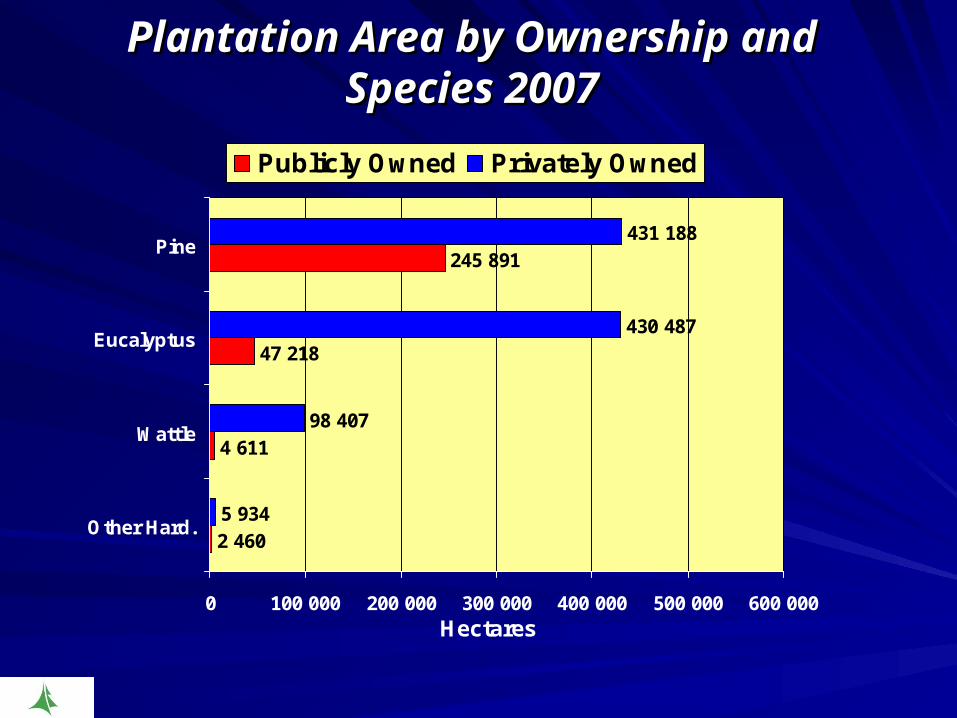
Plantation Area by Ownership and Plantation Area by Ownership and Species 2007Species 2007
2 460
4 611
47 218
245 891
5 934
98 407
430 487
431 188
0 100 000 200 000 300 000 400 000 500 000 600 000
Other Hard.
Wattle
Eucalyptus
Pine
Hectares
Publicly Owned Privately Owned
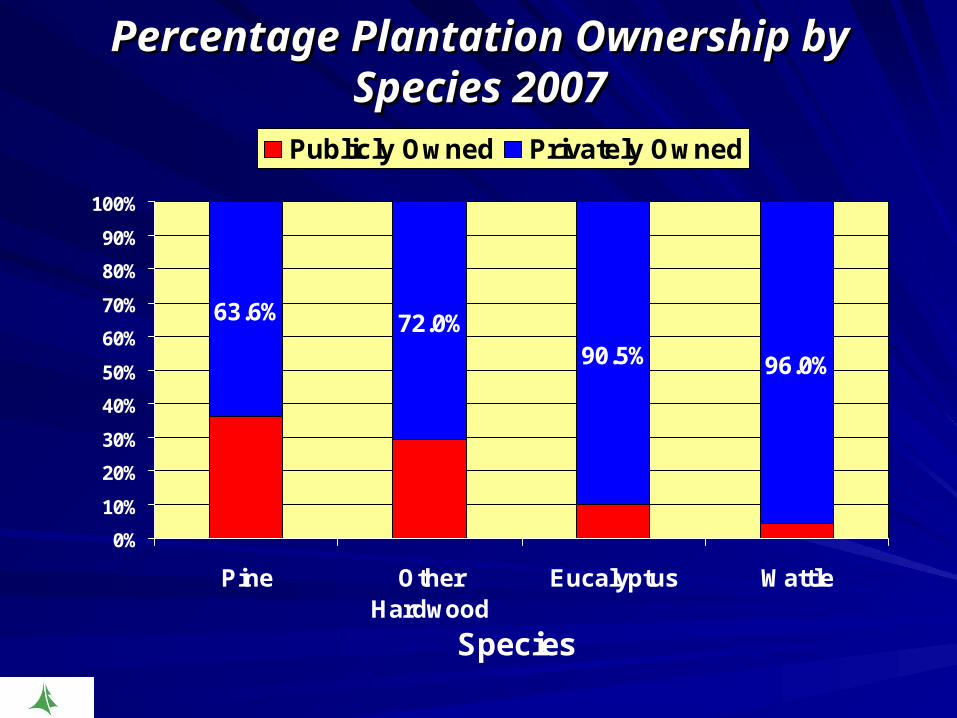
Percentage Plantation Ownership by Percentage Plantation Ownership by Species 2007Species 2007
96.0%90.5%72.0%63.6%
0%
10%
20%
30%
40%
50%
60%
70%
80%
90%
100%
Pine OtherHardwood
Eucalyptus Wattle
Species
Publicly Owned Privately Owned
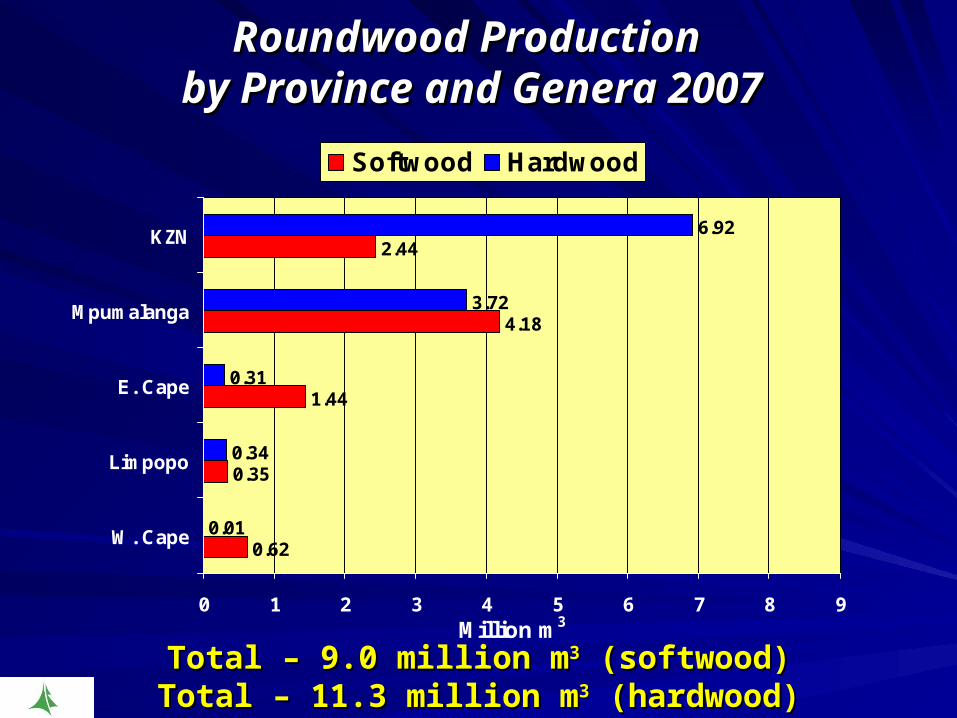
Roundwood Production Roundwood Production by Province and Genera 2007by Province and Genera 2007
0.62
0.35
1.44
4.18
2.44
0.01
0.34
0.31
3.72
6.92
0 1 2 3 4 5 6 7 8 9
W. Cape
Limpopo
E. Cape
Mpumalanga
KZN
Million m3
Softwood Hardwood
Total – 9.0 million mTotal – 9.0 million m33 (softwood) (softwood)Total – 11.3 million mTotal – 11.3 million m33 (hardwood) (hardwood)
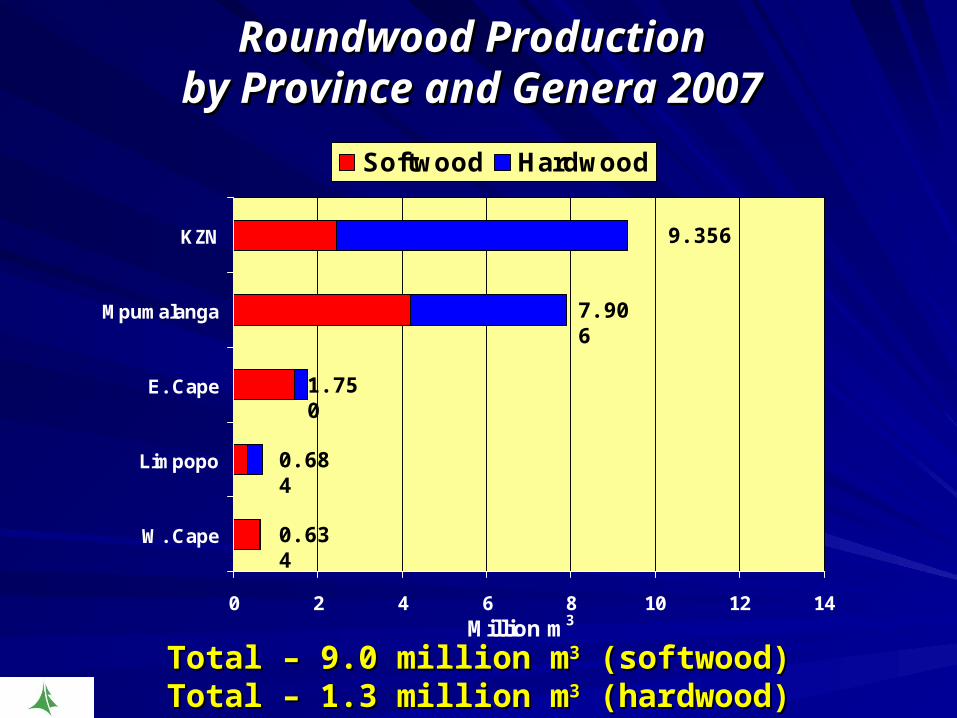
Roundwood ProductionRoundwood Productionby Province and Genera 2007by Province and Genera 2007
0 2 4 6 8 10 12 14
W. Cape
Limpopo
E. Cape
Mpumalanga
KZN
Million m3
Softwood Hardwood
0.634
0.684
1.750
7.906
9.356
Total – 9.0 million mTotal – 9.0 million m33 (softwood) (softwood)Total – 1.3 million mTotal – 1.3 million m33 (hardwood) (hardwood)

Total Roundwood Production ex Total Roundwood Production ex Plantations by Province 2007Plantations by Province 2007
46.0%
38.9%
8.6%
3.1%
3.4%
KZN Mpumalanga E. Cape Limpopo W. Cape
Total – 20.3 million mTotal – 20.3 million m33 or 17.8 million tons or 17.8 million tons
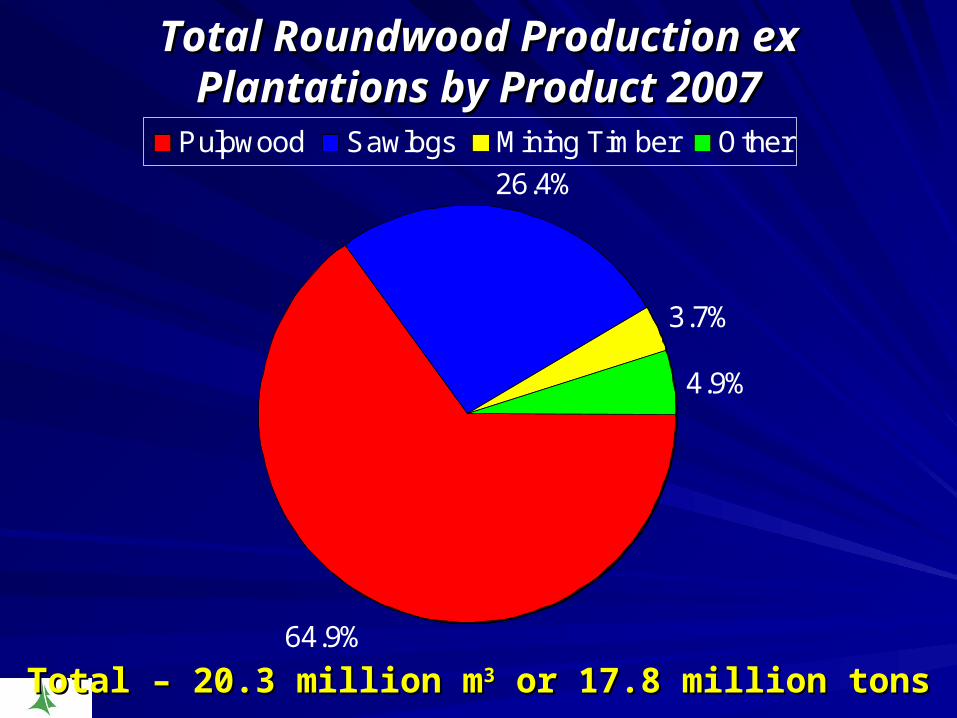
Total Roundwood Production ex Total Roundwood Production ex Plantations by Product 2007Plantations by Product 2007
64.9%
26.4%
3.7%
4.9%
Pulpwood Sawlogs Mining Timber Other
Total – 20.3 million mTotal – 20.3 million m33 or 17.8 million tons or 17.8 million tons
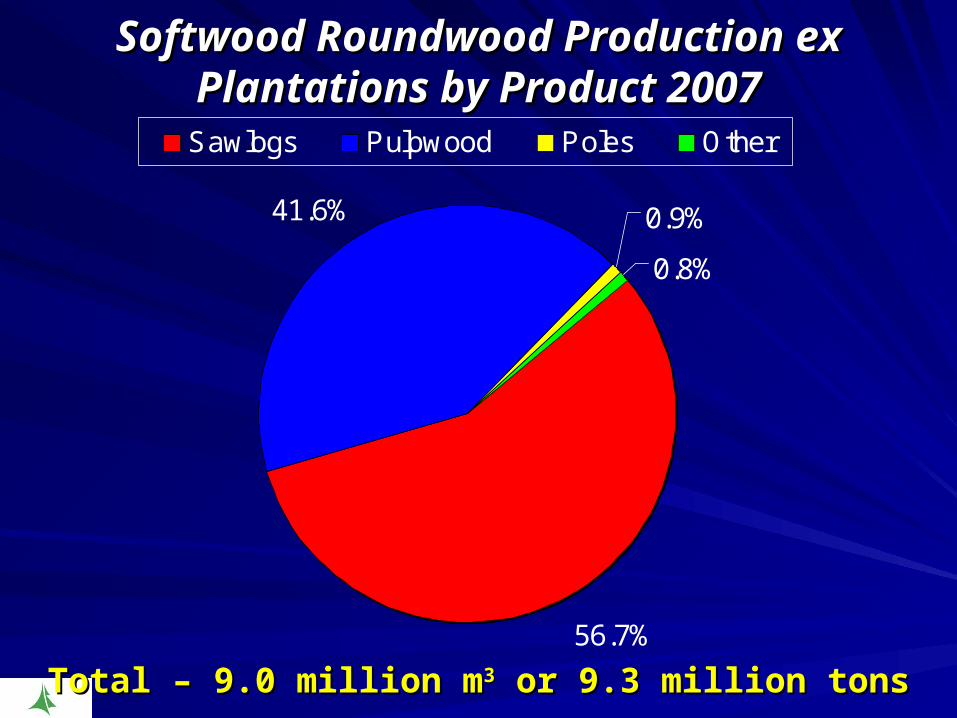
Softwood Roundwood Production ex Softwood Roundwood Production ex Plantations by Product 2007Plantations by Product 2007
56.7%
41.6% 0.9%
0.8%
Sawlogs Pulpwood Poles Other
Total – 9.0 million mTotal – 9.0 million m33 or 9.3 million tons or 9.3 million tons
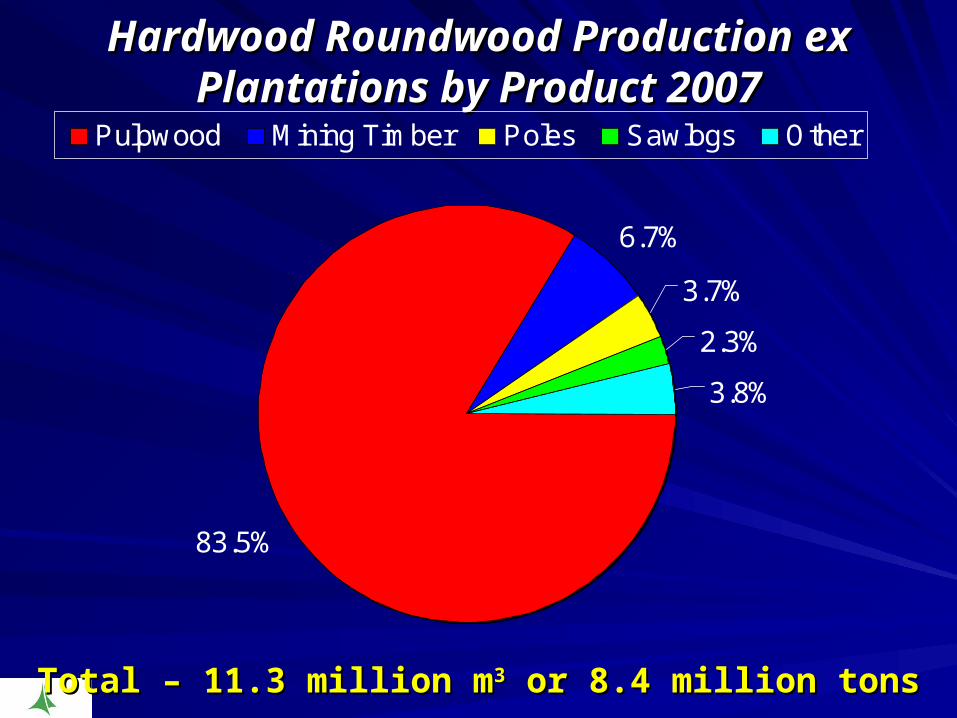
Hardwood Roundwood Production ex Hardwood Roundwood Production ex Plantations by Product 2007Plantations by Product 2007
83.5%
6.7%
3.7%
3.8%
2.3%
Pulpwood Mining Timber Poles Sawlogs Other
Total – 11.3 million mTotal – 11.3 million m33 or 8.4 million tons or 8.4 million tons
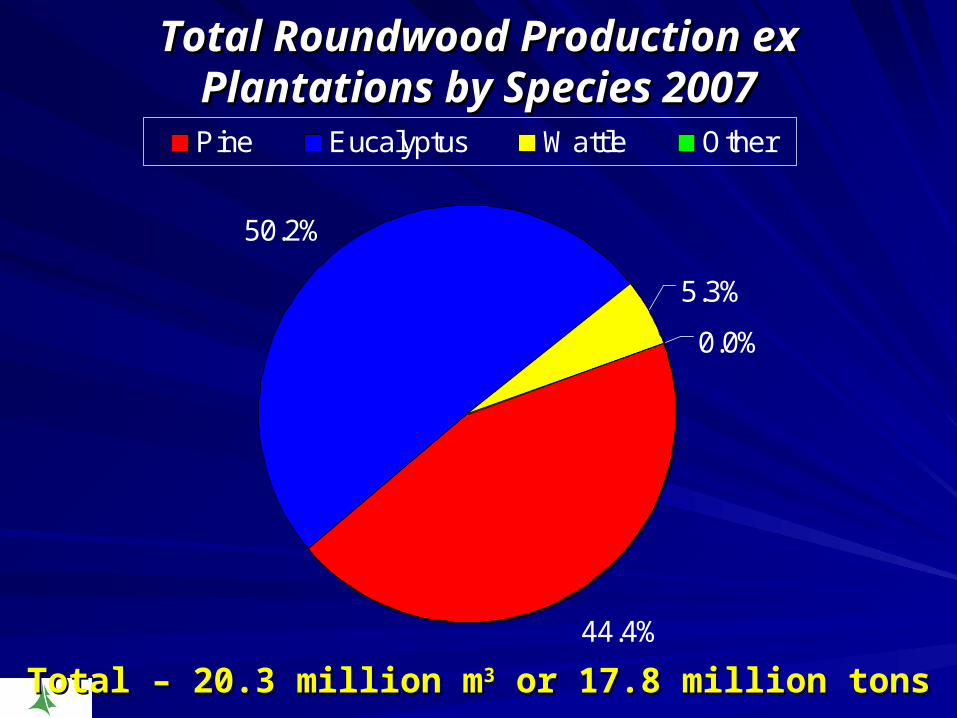
Total Roundwood Production ex Total Roundwood Production ex Plantations by Species 2007Plantations by Species 2007
44.4%
50.2%
5.3%
0.0%
Pine Eucalyptus Wattle Other
Total – 20.3 million mTotal – 20.3 million m33 or 17.8 million tons or 17.8 million tons

Composition of Roundwood Production Composition of Roundwood Production by Product 2007by Product 2007
0.0%22.5%24.0%
25.0%
95.3%
0%
10%
20%
30%
40%
50%
60%
70%
80%
90%
100%
Sawlogs Poles Pulpwood Other MiningTimber
Product
Softwood Hardwood

Total Roundwood Production ex Total Roundwood Production ex Plantations 1980 to 2007Plantations 1980 to 2007
10
12
14
16
18
20
22
24
1980 1984 1988 1992 1996 2000 2004
Years
Mill
ion
m3
Total increase in production over periodTotal increase in production over period : 71.1%: 71.1%Total in increase in afforested area over periodTotal in increase in afforested area over period : 9.0%: 9.0%

Roundwood Production vs. Plantation Roundwood Production vs. Plantation Area 1980 to 2007Area 1980 to 2007
90
100
110
120
130
140
150
160
170
180
190
200
1980 1984 1988 1992 1996 2000 2004
Years
1980
= 1
00Plantation Production Plantation Area
Total increase in production over periodTotal increase in production over period - 71.1%- 71.1%Total in increase in afforested area over periodTotal in increase in afforested area over period - 9.0%- 9.0%
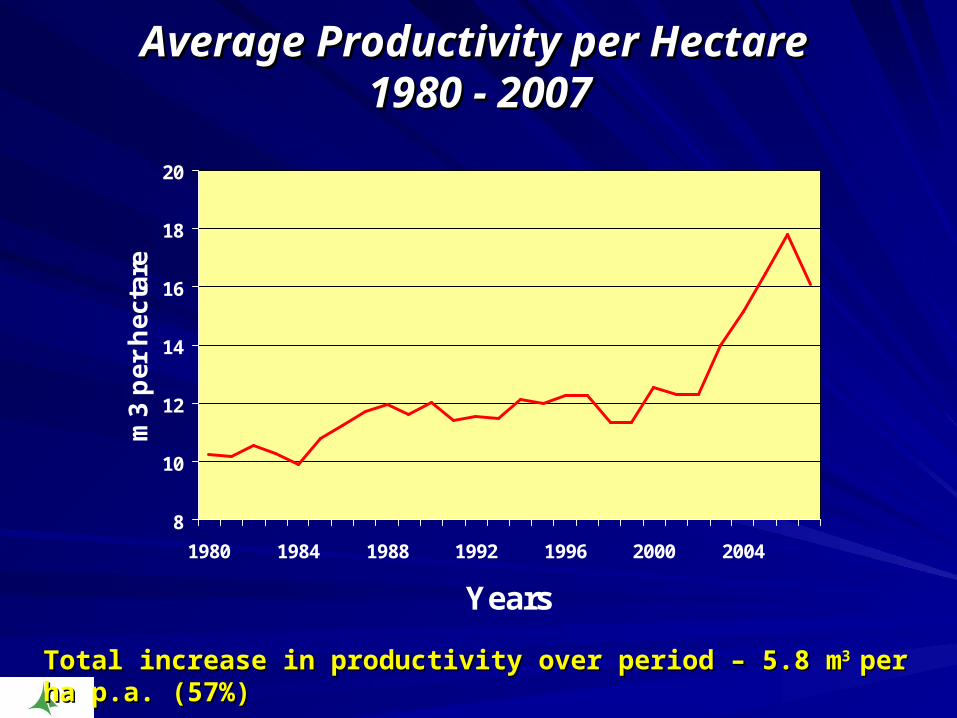
Average Productivity per Hectare Average Productivity per Hectare 1980 - 20071980 - 2007
8
10
12
14
16
18
20
1980 1984 1988 1992 1996 2000 2004
Years
m3
per
hec
tare
Total increase in productivity over period – 5.8 mTotal increase in productivity over period – 5.8 m3 3 per ha p.a. (57%)per ha p.a. (57%)
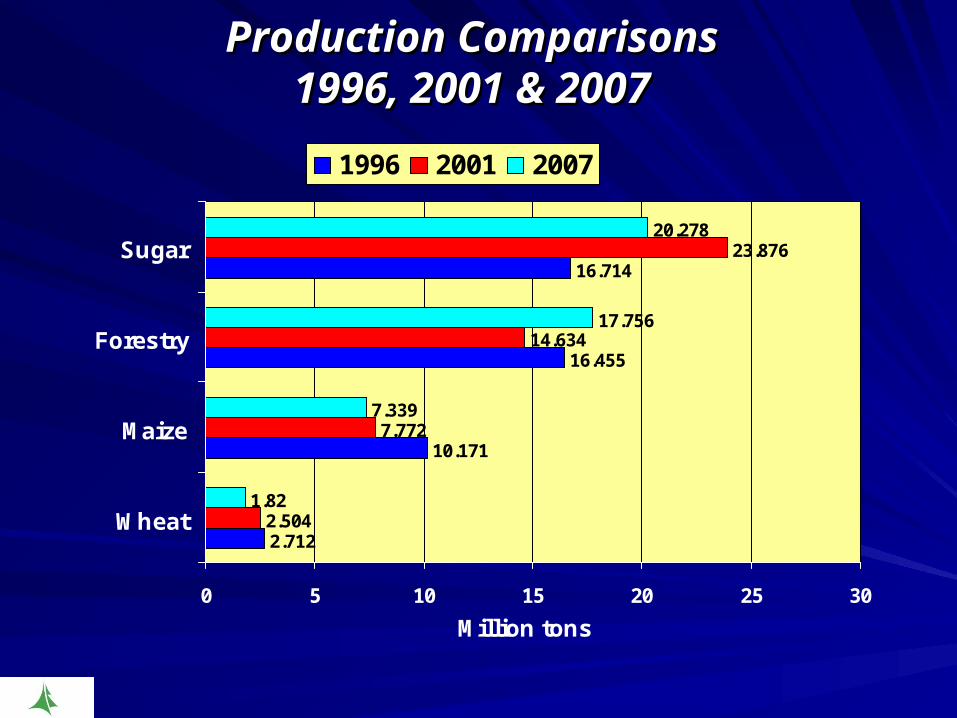
Production ComparisonsProduction Comparisons1996, 2001 & 20071996, 2001 & 2007
2.712
10.171
16.455
16.714
2.504
14.634
23.876
1.82
7.339
17.756
20.278
7.772
0 5 10 15 20 25 30
Wheat
Maize
Forestry
Sugar
Million tons
1996 2001 2007
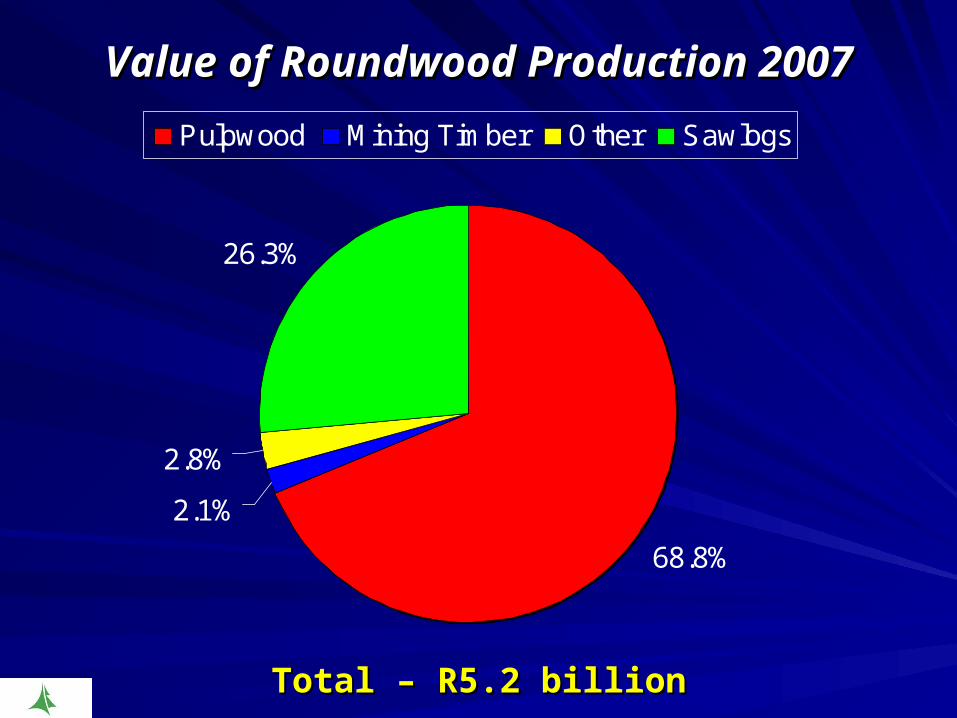
Value of Roundwood Production 2007Value of Roundwood Production 2007
68.8%
2.1%
2.8%
26.3%
Pulpwood Mining Timber Other Sawlogs
Total – R5.2 billionTotal – R5.2 billion

Value of Roundwood Production Value of Roundwood Production 1980 to 20071980 to 2007
0.0
1.0
2.0
3.0
4.0
5.0
6.0
1980 1984 1988 1992 1996 2000 2004
Years
Bill
ion
Ra
nd
(2
00
6 R
an
ds
)
Nominal Real
Nominal increase over periodNominal increase over period : R5.0 bn (3 037%): R5.0 bn (3 037%)Real increase over periodReal increase over period : R2.9 bn (129%): R2.9 bn (129%)

New Afforestation by RegionNew Afforestation by Region1980 to 20071980 to 2007
0
5
10
15
20
25
30
35
40
45
50
1980
1982
1984
1986
1988
1990
1992
1994
1996
1998
2000
2002
2004
2006
Years
Th
ou
san
d H
ecta
res
Mpum & Limp. KZN Cape Total
New afforestation over periodNew afforestation over period - 375,811 ha- 375,811 haAverage per yearAverage per year - 13,422 ha- 13,422 ha
AVERAGE

Total New Afforestation by Region Total New Afforestation by Region 1980 to 20071980 to 2007
53.7%34.0%
12.3%
KZN Mpumalanga & Limpopo E&W Cape
Total – 375 811 haTotal – 375 811 ha

New Afforestation by RegionNew Afforestation by Region10 Year Period – 1998 to 200710 Year Period – 1998 to 2007
0
1
2
3
4
5
6
7
8
1998 1999 2000 2001 2002 2003 2004 2005 2006 2007
Years
Th
ou
sa
nd
He
cta
res
Northern KZN Cape Total
New afforestation over periodNew afforestation over period - 42 010 ha - 42 010 ha Average per yearAverage per year - 4 201 ha- 4 201 ha
AVERAGE
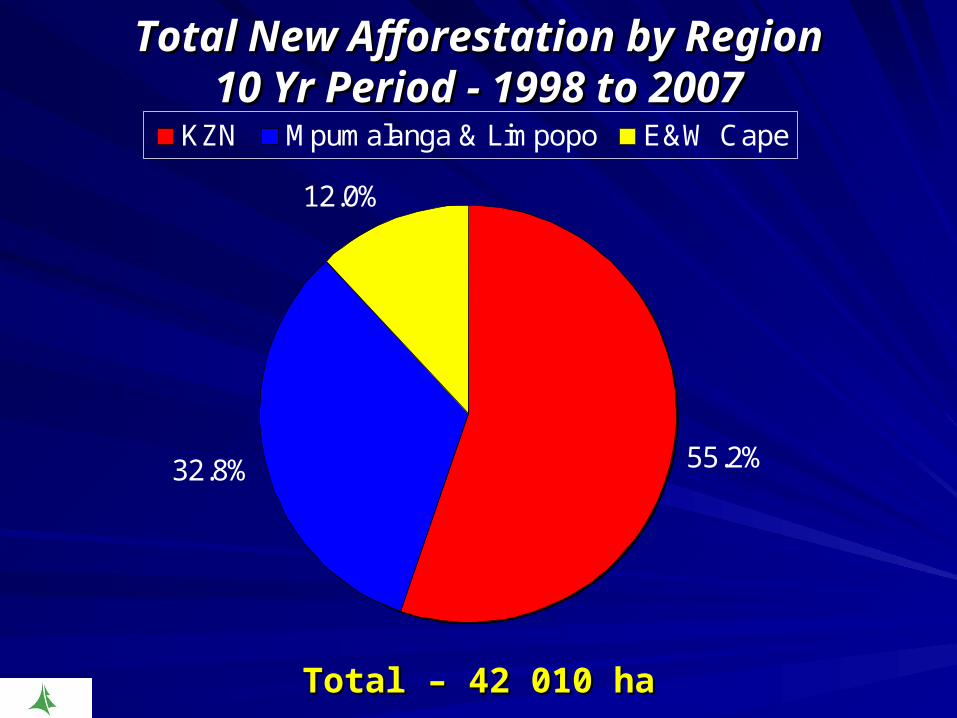
Total New Afforestation by RegionTotal New Afforestation by Region10 Yr Period - 1998 to 200710 Yr Period - 1998 to 2007
55.2%32.8%
12.0%
KZN Mpumalanga & Limpopo E&W Cape
Total – 42 010 haTotal – 42 010 ha
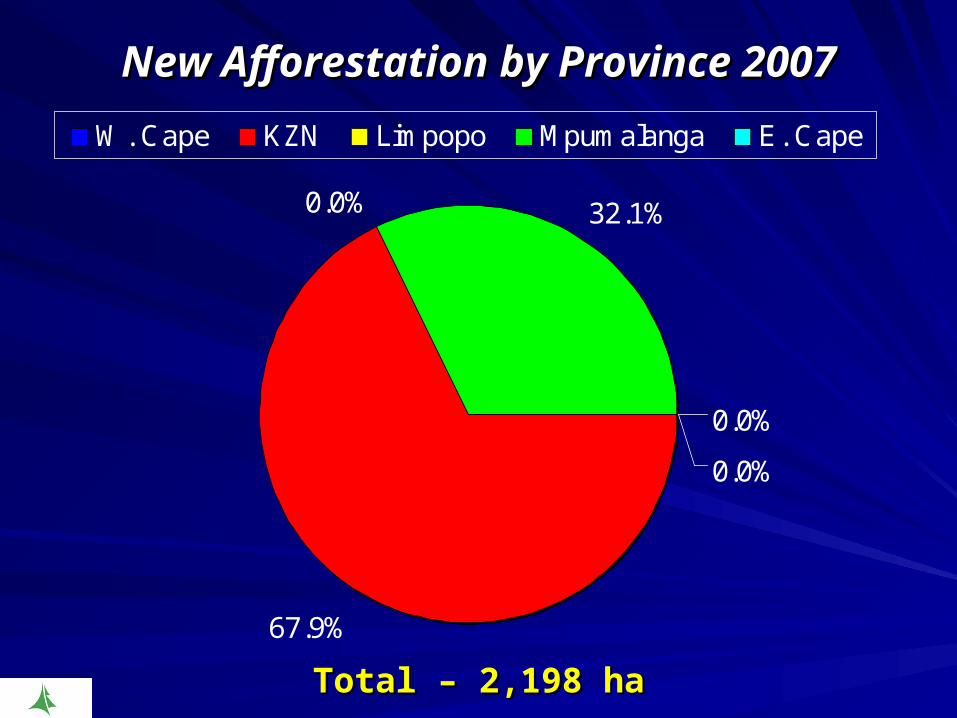
New Afforestation by Province 2007New Afforestation by Province 2007
0.0%
67.9%
0.0%
0.0%
32.1%
W. Cape KZN Limpopo Mpumalanga E. Cape
Total – 2,198 haTotal – 2,198 ha
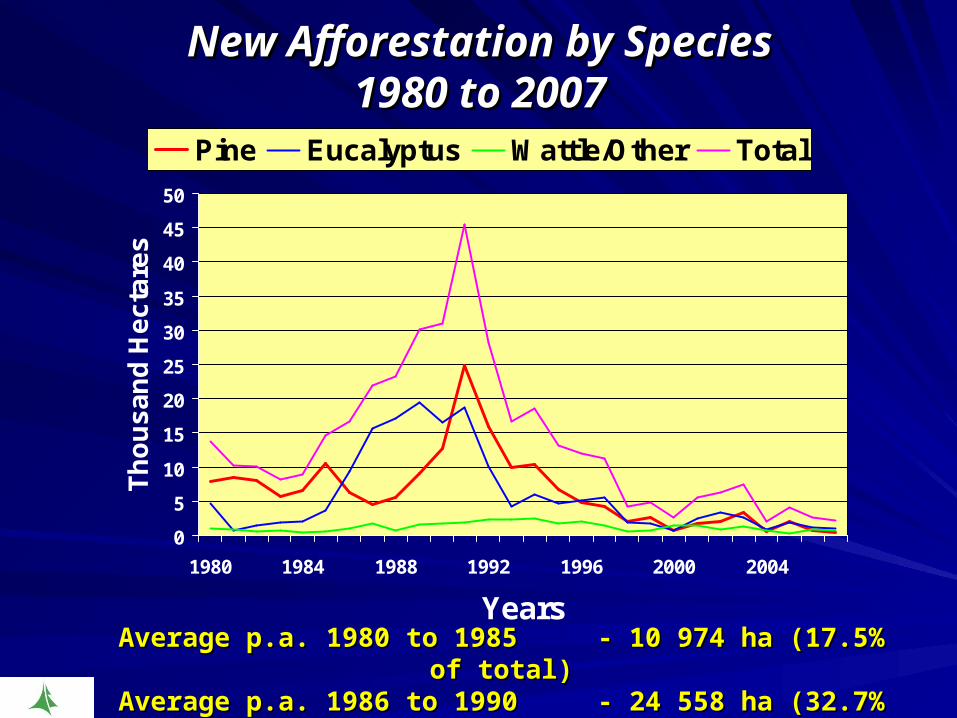
New Afforestation by SpeciesNew Afforestation by Species1980 to 20071980 to 2007
0
5
10
15
20
25
30
35
40
45
50
1980 1984 1988 1992 1996 2000 2004
Years
Th
ou
sa
nd
He
cta
res
Pine Eucalyptus Wattle/Other Total
Average p.a. 1980 to 1985Average p.a. 1980 to 1985 - 10 974 ha (17.5% of total)- 10 974 ha (17.5% of total)Average p.a. 1986 to 1990Average p.a. 1986 to 1990 - 24 558 ha (32.7% of total)- 24 558 ha (32.7% of total)
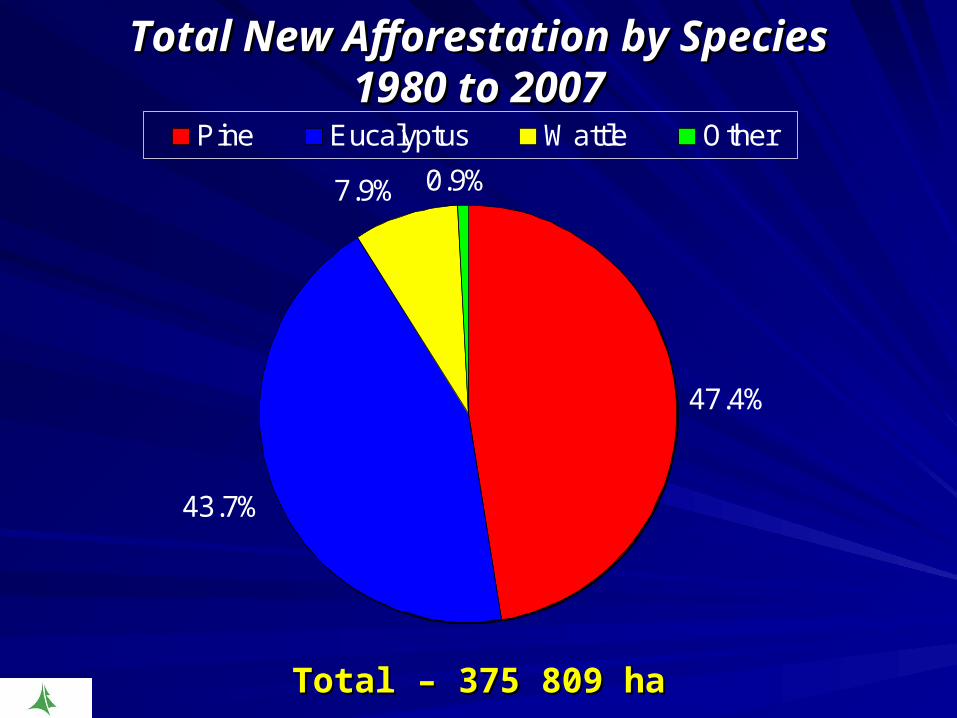
Total New Afforestation by SpeciesTotal New Afforestation by Species1980 to 20071980 to 2007
47.4%
43.7%
7.9% 0.9%Pine Eucalyptus Wattle Other
Total – 375 809 haTotal – 375 809 ha

New Afforestation by Species 2007New Afforestation by Species 2007
48.5%
19.0%
31.3%
1.2%Eucalyptus Pine Wattle Other Hardwood
Total – 2 196haTotal – 2 196ha
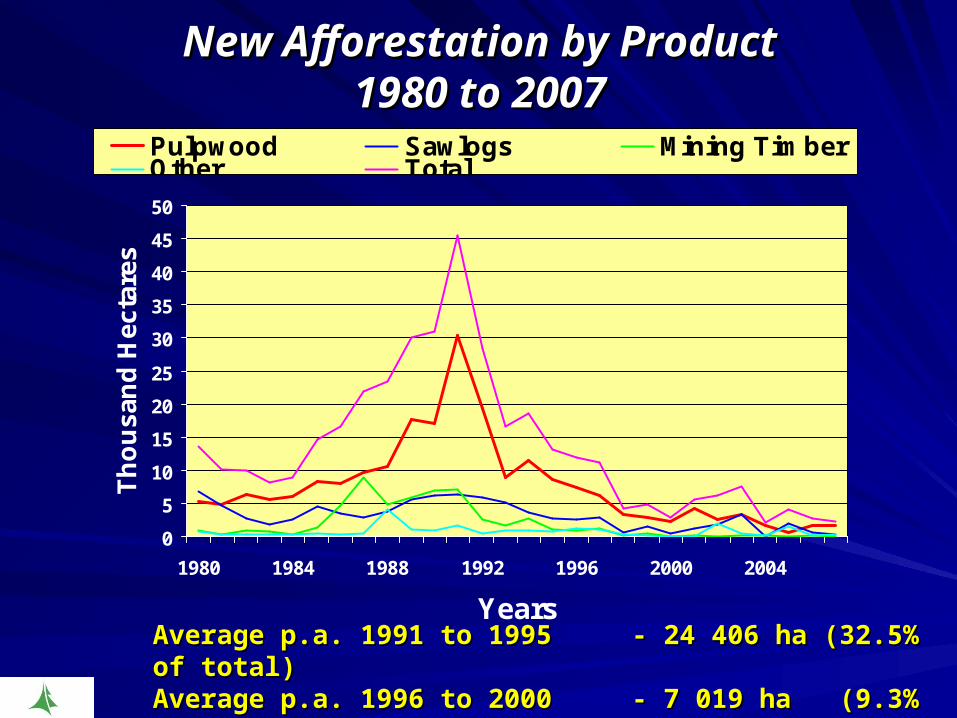
New Afforestation by ProductNew Afforestation by Product1980 to 20071980 to 2007
0
5
10
15
20
25
30
35
40
45
50
1980 1984 1988 1992 1996 2000 2004
Years
Th
ou
san
d H
ecta
res
Pulpwood Sawlogs Mining TimberOther Total
Average p.a. 1991 to 1995Average p.a. 1991 to 1995 - 24 406 ha (32.5% of total)- 24 406 ha (32.5% of total)Average p.a. 1996 to 2000Average p.a. 1996 to 2000 - 7 019 ha (9.3% of total)- 7 019 ha (9.3% of total)Average p.a. 2001 to 2007Average p.a. 2001 to 2007 - 4 293 ha (8.0% of total)- 4 293 ha (8.0% of total)

Total New Afforestation by ProductTotal New Afforestation by Product1980 to 20071980 to 2007
57.4%
22.7%
14.3%
5.6%
Pulpwood Sawlogs Mining Timber Other
Total – 375 809 haTotal – 375 809 ha
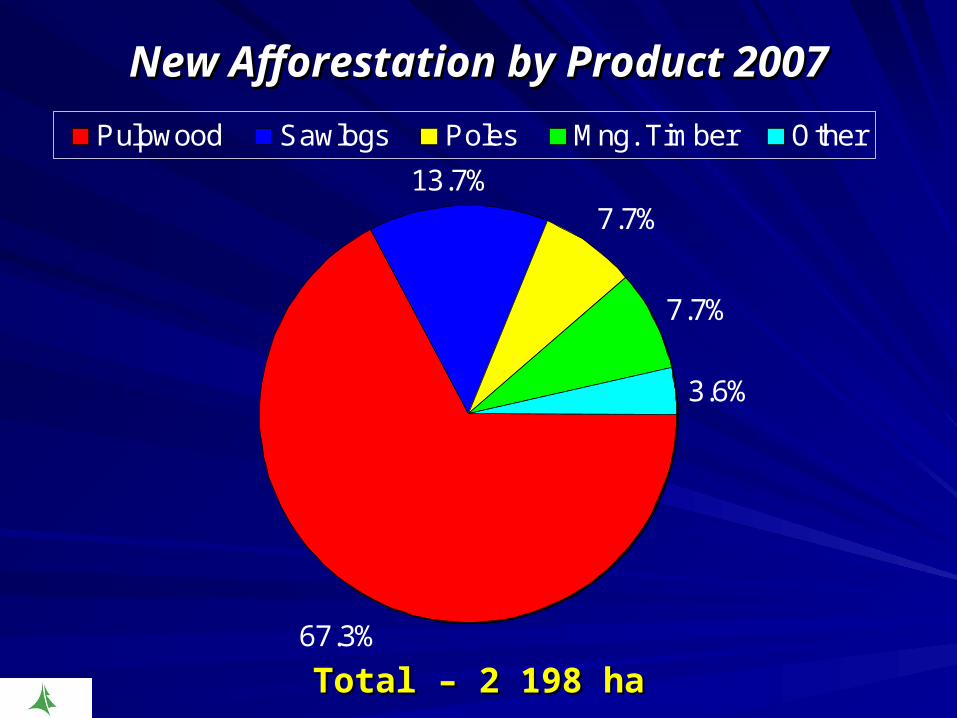
New Afforestation by Product 2007New Afforestation by Product 2007
13.7%7.7%
3.6%
67.3%
7.7%
Pulpwood Sawlogs Poles Mng. Timber Other
Total – 2 198 haTotal – 2 198 ha
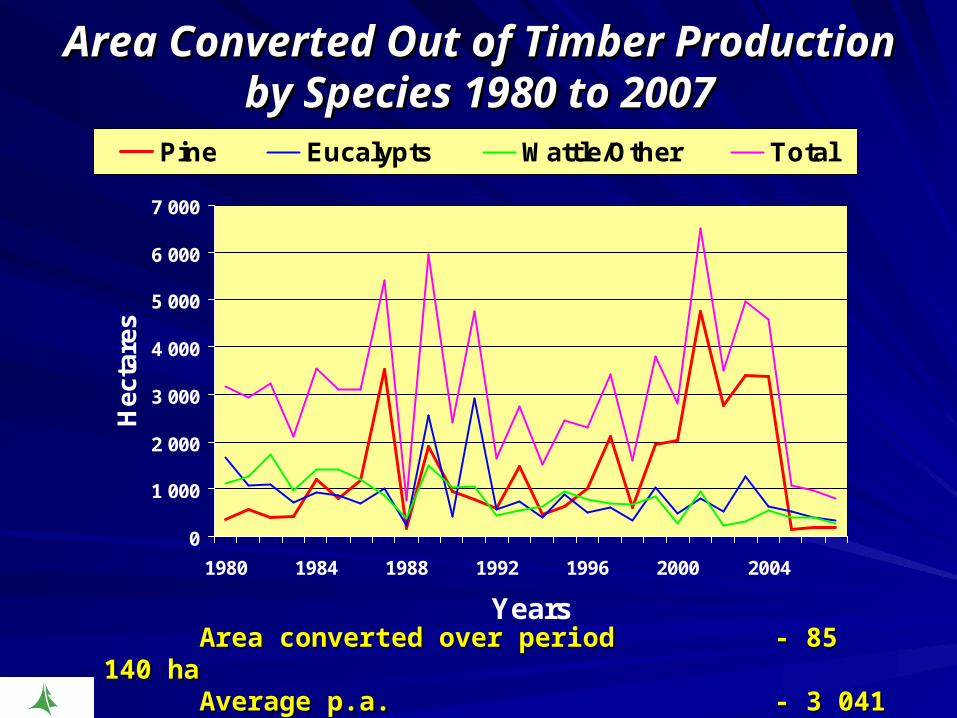
Area Converted Out of Timber Area Converted Out of Timber Production by Species 1980 to 2007Production by Species 1980 to 2007
0
1 000
2 000
3 000
4 000
5 000
6 000
7 000
1980 1984 1988 1992 1996 2000 2004
Years
Hec
tare
sPine Eucalypts Wattle/Other Total
Area converted over periodArea converted over period - 85 140 ha- 85 140 haAverage p.a. Average p.a. - 3 041 ha - 3 041 ha

Total Area Converted out of Timber Total Area Converted out of Timber Production by Species 1980 to 2007Production by Species 1980 to 2007
44.7%
28.3%
24.3%
2.6%
Pine Eucalypts Wattle Other
Total – 85 140 haTotal – 85 140 ha

Total Area Converted out of Timber Total Area Converted out of Timber Production by Species 2007Production by Species 2007
24.6%
42.0%
31.4%
2.0%
Pine Eucalypts Wattle Other Hardwood
Total – 793 haTotal – 793 ha
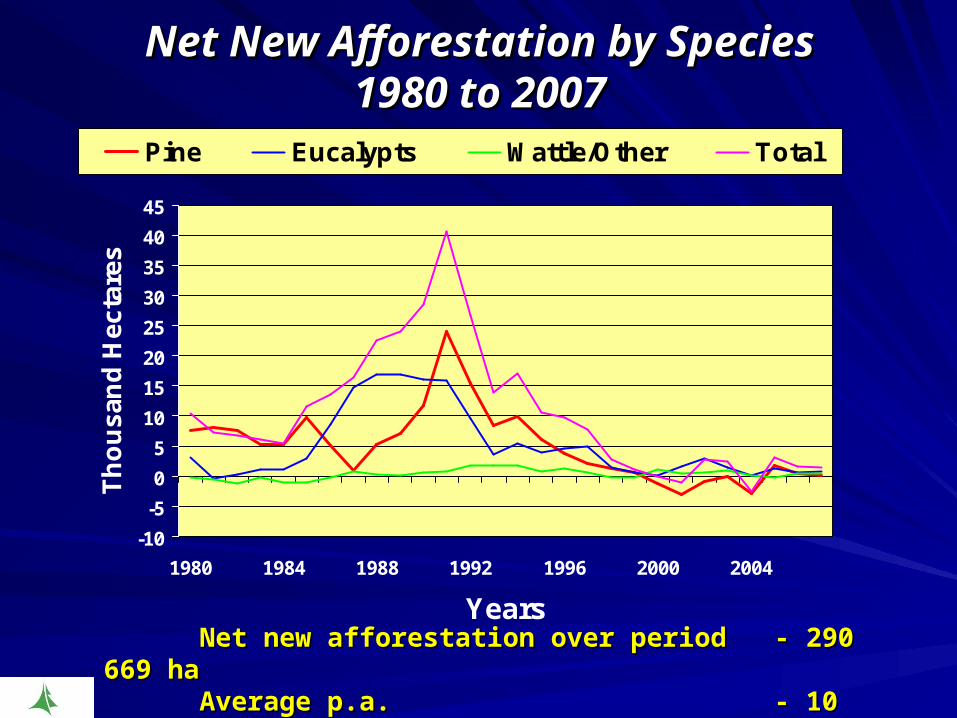
Net New Afforestation by SpeciesNet New Afforestation by Species1980 to 20071980 to 2007
-10
-5
0
5
10
15
20
25
30
35
40
45
1980 1984 1988 1992 1996 2000 2004
Years
Th
ou
san
d H
ecta
res
Pine Eucalypts Wattle/Other Total
Net new afforestation over periodNet new afforestation over period - 290 669 ha- 290 669 haAverage p.a. Average p.a. - 10 766 ha - 10 766 ha
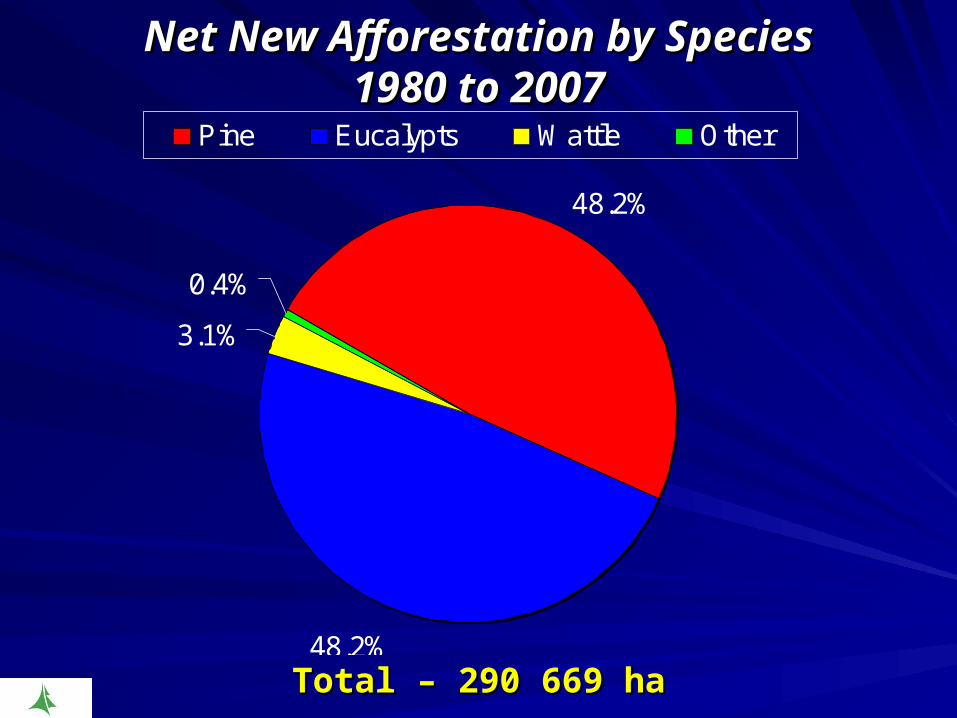
Net New Afforestation by SpeciesNet New Afforestation by Species1980 to 20071980 to 2007
48.2%
48.2%
3.1%
0.4%
Pine Eucalypts Wattle Other
Total – 290 669 haTotal – 290 669 ha
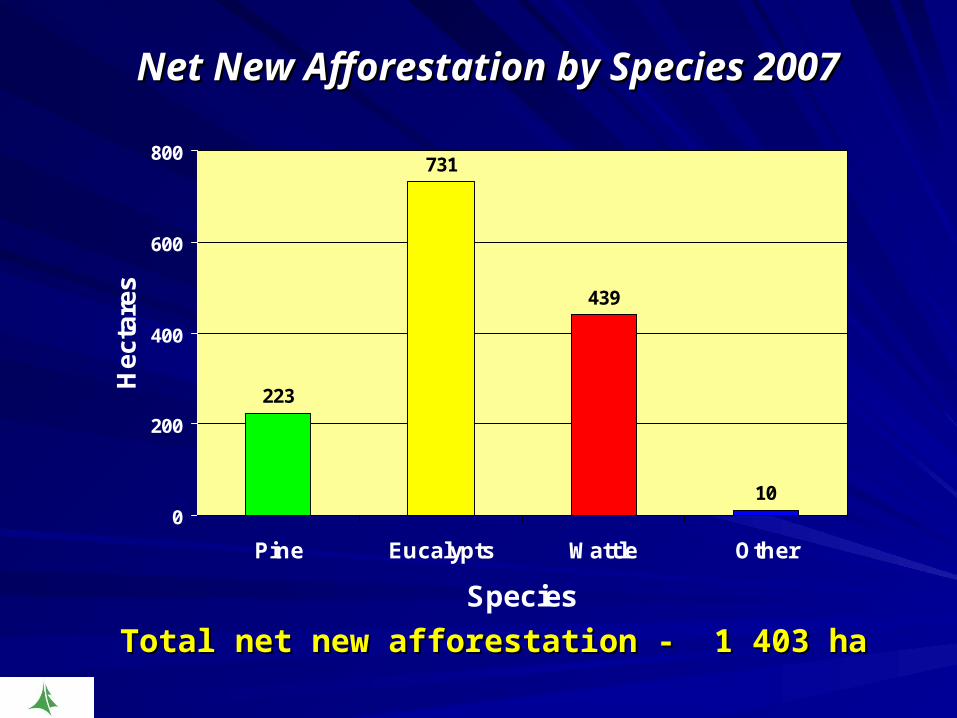
Net New Afforestation by Species 2007Net New Afforestation by Species 2007
223
731
439
100
200
400
600
800
Pine Eucalypts Wattle Other
Species
Hec
tare
s
Total net new afforestation - 1 403 haTotal net new afforestation - 1 403 ha

Area Converted Out of Timber Area Converted Out of Timber Production by Region 1980 to 2007Production by Region 1980 to 2007
0
1 000
2 000
3 000
4 000
5 000
6 000
7 000
1980 1984 1988 1992 1996 2000 2004
Years
Hec
tare
s
North KZN South Total
Area converted over periodArea converted over period - 85 140 ha- 85 140 haAverage p.a. Average p.a. - 3 041 ha - 3 041 ha
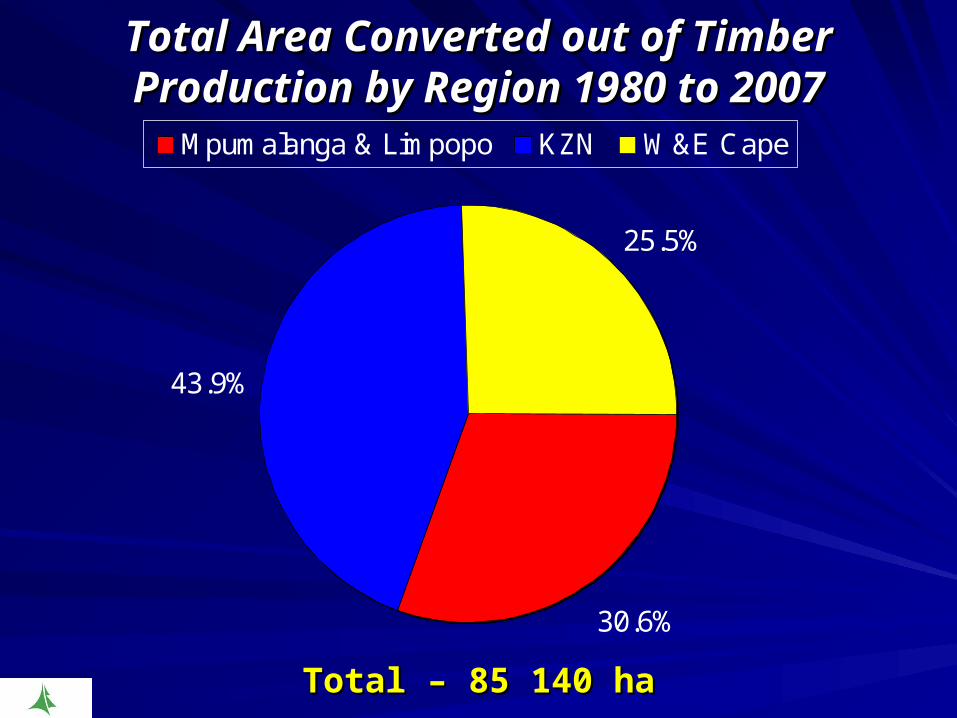
Total Area Converted out of Timber Total Area Converted out of Timber Production by Region 1980 to 2007Production by Region 1980 to 2007
30.6%
43.9%
25.5%
Mpumalanga & Limpopo KZN W&E Cape
Total – 85 140 haTotal – 85 140 ha

Net New Afforestation by RegionNet New Afforestation by Region1980 to 20071980 to 2007
-10
-5
0
5
10
15
20
25
30
35
40
45
1980 1984 1988 1992 1996 2000 2004
Years
Th
ou
san
d H
ecta
res
North KZN South Total
Net new afforestation over periodNet new afforestation over period - 290 669 ha- 290 669 haAverage p.a. Average p.a. - 10 766 ha - 10 766 ha
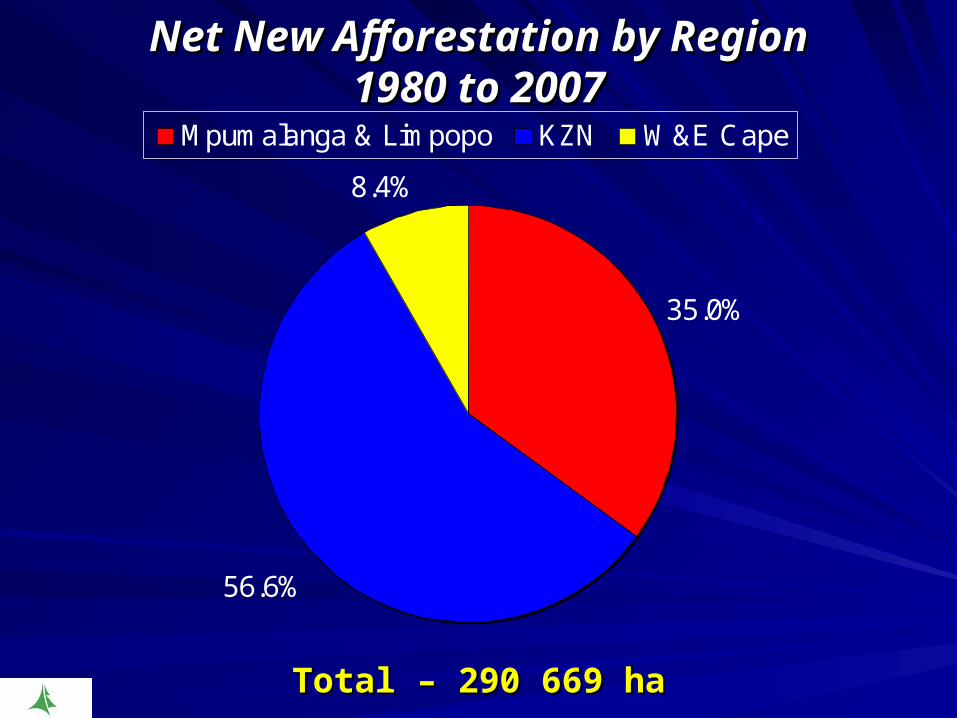
Net New Afforestation by RegionNet New Afforestation by Region1980 to 20071980 to 2007
35.0%
56.6%
8.4%
Mpumalanga & Limpopo KZN W&E Cape
Total – 290 669 haTotal – 290 669 ha

Conversion of Plantations out of Production & to Conversion of Plantations out of Production & to Other Species 1980 to 2007Other Species 1980 to 2007
-20
-15
-10
-5
0
5
10
15
1980 1984 1988 1992 1996 2000 2004
Years
Th
ou
san
d H
ecta
res
Pine Eucalyptus Wattle/Other Total
Net loss to production area over periodNet loss to production area over period - 85 140 ha- 85 140 haAverage p.a. Average p.a. - 3 041 ha - 3 041 ha

Total Area Converted out of Production & to Total Area Converted out of Production & to Other Species 1980 to 2007Other Species 1980 to 2007
-55 765
15 320
-47 195
2 500
-60 000
-50 000
-40 000
-30 000
-20 000
-10 000
0
10 000
20 000
30 000
Pine Eucalypts Wattle Other
Species
Hec
tare
s
Net loss to production area over periodNet loss to production area over period - 85 140 ha- 85 140 haAverage p.a. Average p.a. - 3 041 ha - 3 041 ha

Area Converted out of ProductionArea Converted out of Production& to Other Species 2007& to Other Species 2007
-3 096
2 829
-363 -163
-4 000
-3 000
-2 000
-1 000
0
1 000
2 000
3 000
4 000
Pine Eucalypts Wattle Other
Species
Hec
tare
s
Net loss to production area Net loss to production area - 793 ha- 793 ha
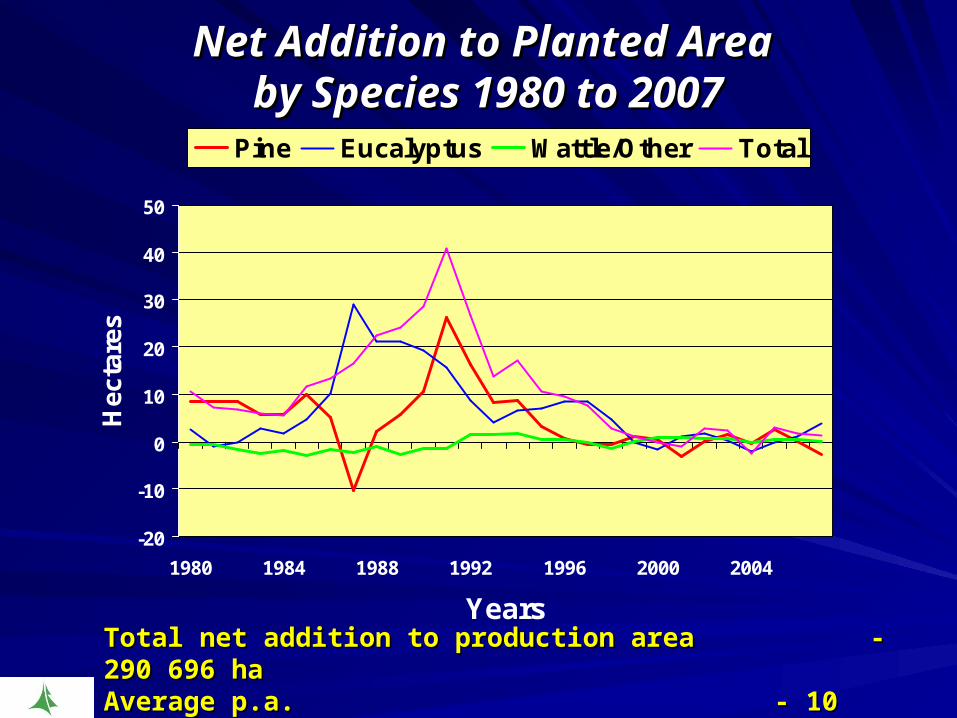
Net Addition to Planted Area Net Addition to Planted Area by Species 1980 to 2007by Species 1980 to 2007
-20
-10
0
10
20
30
40
50
1980 1984 1988 1992 1996 2000 2004
Years
Hec
tare
s
Pine Eucalyptus Wattle/Other Total
Total net addition to production areaTotal net addition to production area - 290 696 ha- 290 696 haAverage p.a. Average p.a. - 10 766 ha - 10 766 ha
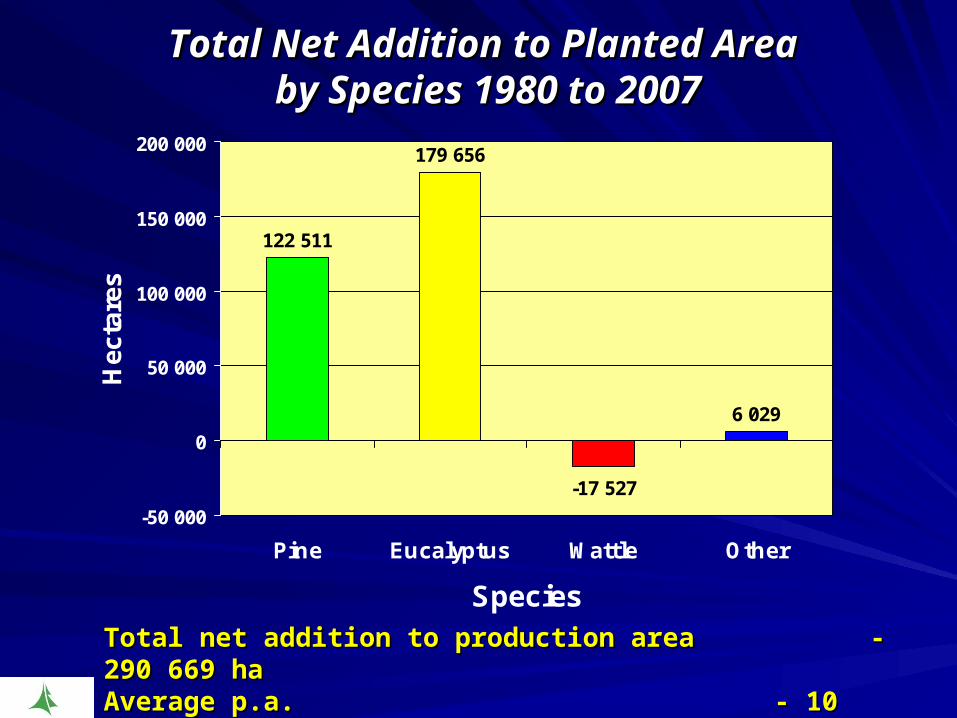
Total Net Addition to Planted Area Total Net Addition to Planted Area by Species 1980 to 2007by Species 1980 to 2007
122 511
179 656
-17 527
6 029
-50 000
0
50 000
100 000
150 000
200 000
Pine Eucalyptus Wattle Other
Species
Hec
tare
s
Total net addition to production areaTotal net addition to production area - 290 669 ha- 290 669 haAverage p.a. Average p.a. - 10 766 ha - 10 766 ha
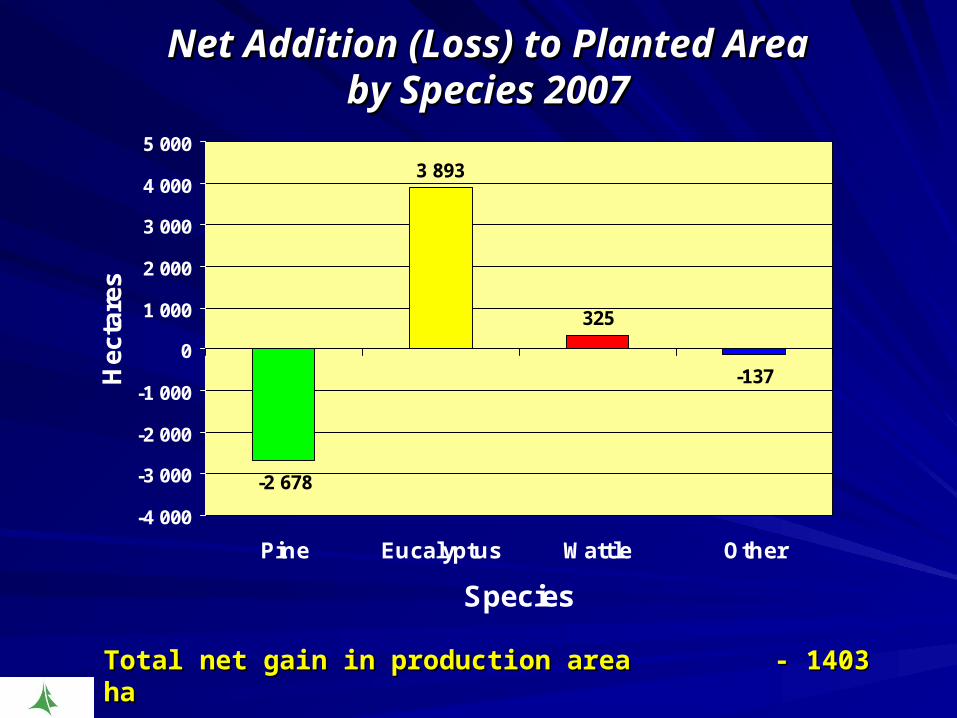
Net Addition (Loss) to Planted AreaNet Addition (Loss) to Planted Areaby Species 2007by Species 2007
-2 678
3 893
325
-137
-4 000
-3 000
-2 000
-1 000
0
1 000
2 000
3 000
4 000
5 000
Pine Eucalyptus Wattle Other
Species
Hec
tare
s
Total net gain in production areaTotal net gain in production area - 1403 ha- 1403 ha

Damage to Plantations by GeneraDamage to Plantations by Genera1980 to 20071980 to 2007
0
20
40
60
80
100
120
1980 1984 1988 1992 1996 2000 2004
Years
Th
ou
san
d H
ecta
res
Softwood Hardwood Total
Total area damaged over periodTotal area damaged over period - 830 615 ha- 830 615 haAverage p.a. Average p.a. - 29 665 ha - 29 665 ha
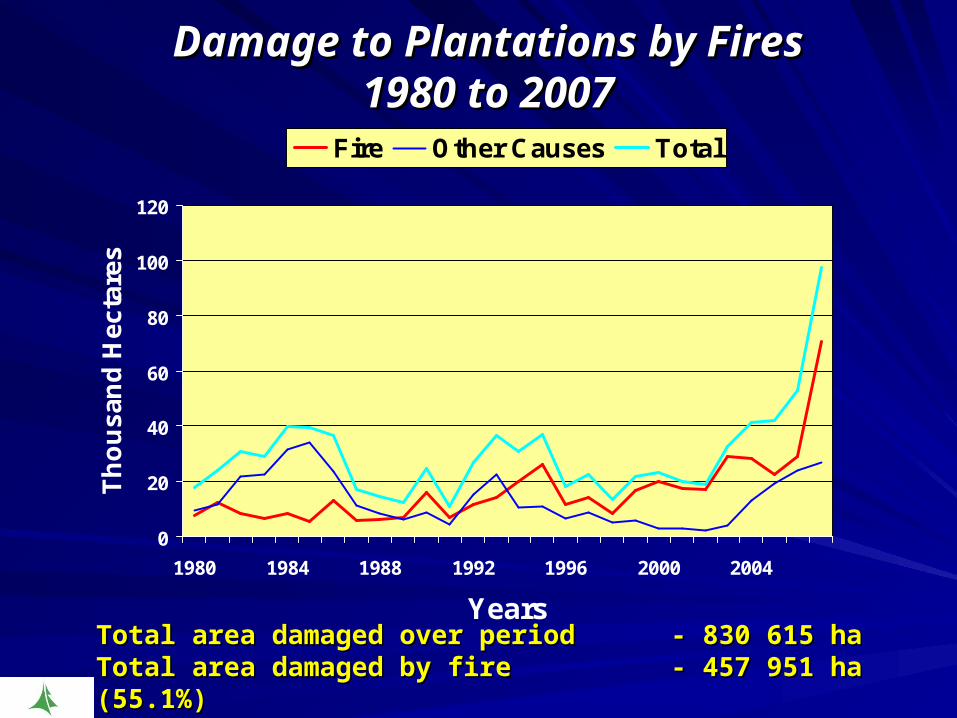
Damage to Plantations by FiresDamage to Plantations by Fires1980 to 20071980 to 2007
0
20
40
60
80
100
120
1980 1984 1988 1992 1996 2000 2004
Years
Th
ou
san
d H
ecta
res
Fire Other Causes Total
Total area damaged over periodTotal area damaged over period - 830 615 ha- 830 615 haTotal area damaged by fireTotal area damaged by fire - 457 951 ha (55.1%)- 457 951 ha (55.1%)Total area damaged by other causesTotal area damaged by other causes - 372 664 ha (44.9%)- 372 664 ha (44.9%)
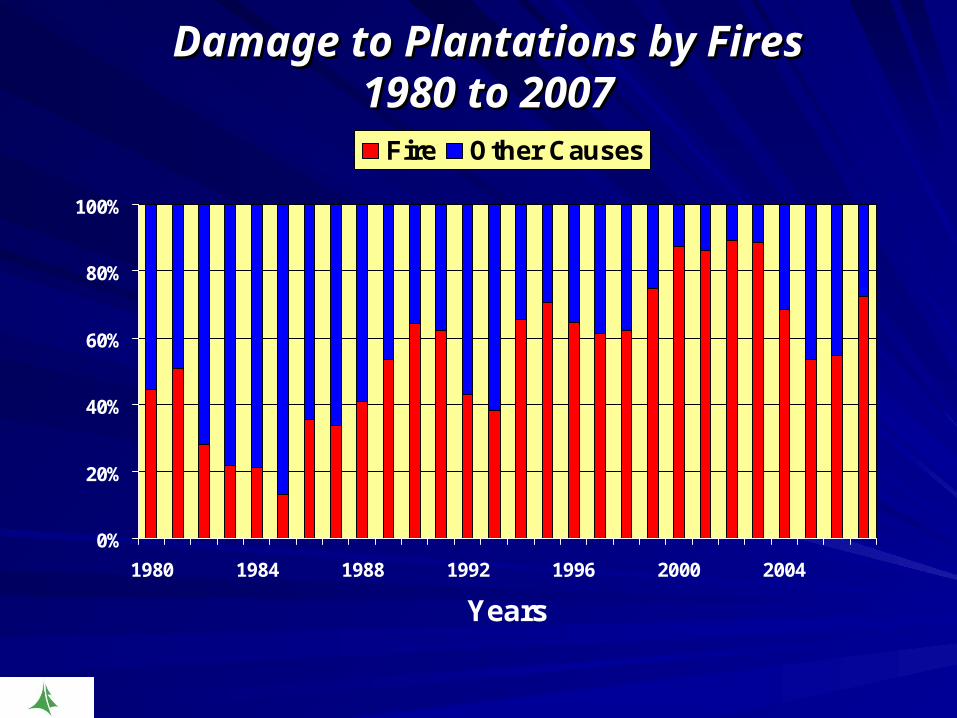
Damage to Plantations by FiresDamage to Plantations by Fires1980 to 20071980 to 2007
0%
20%
40%
60%
80%
100%
1980 1984 1988 1992 1996 2000 2004
Years
Fire Other Causes

Damage to Plantations by Genera 2007Damage to Plantations by Genera 2007
55.1%
44.9%
Softwood Hardwood
Total – 97 593 ha Total – 97 593 ha (7.7% of total planted area)(7.7% of total planted area)

Damage to Plantations by Cause 2007Damage to Plantations by Cause 2007
72.4%
27.6%
Fire Other Causes
Total – 97 593 haTotal – 97 593 ha
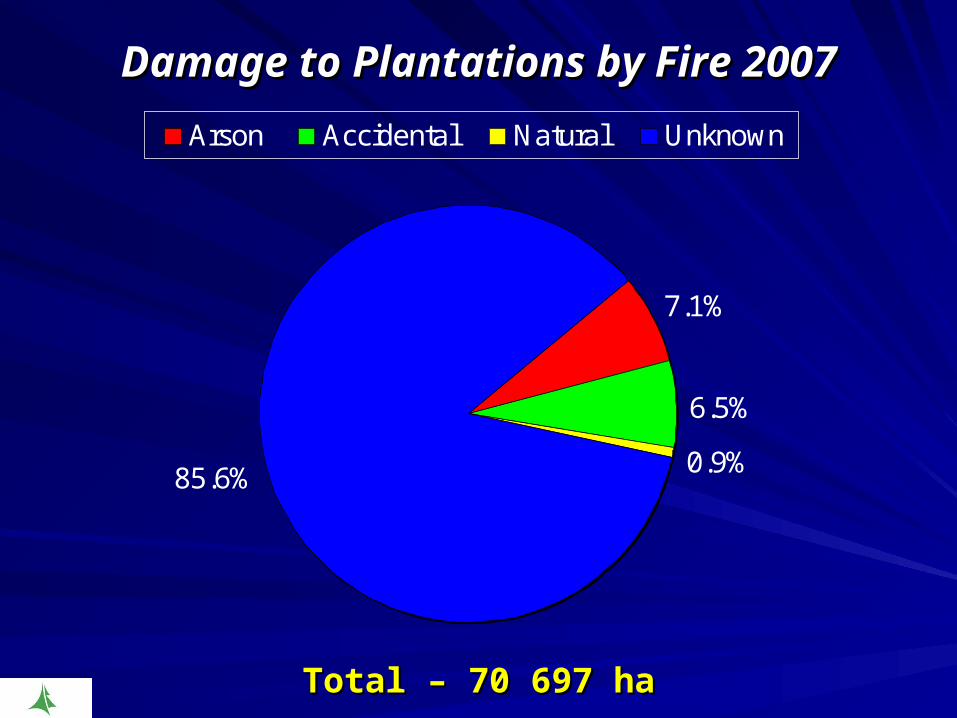
Damage to Plantations by Fire 2007Damage to Plantations by Fire 2007
7.1%
6.5%
0.9%85.6%
Arson Accidental Natural Unknown
Total – 70 697 haTotal – 70 697 ha
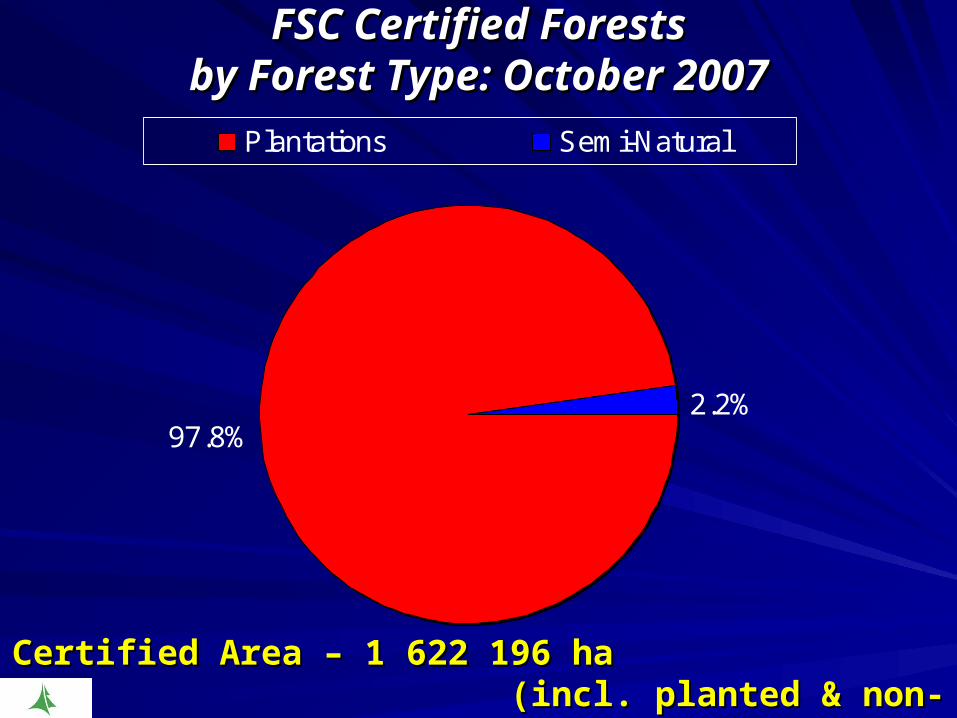
FSC Certified ForestsFSC Certified Forestsby Forest Type: October 2007by Forest Type: October 2007
97.8%2.2%
Plantations Semi-Natural
Certified Area – 1 622 196 ha Certified Area – 1 622 196 ha (incl. planted & non-planted areas)(incl. planted & non-planted areas)

FSC Certified ForestsFSC Certified Forestsby Ownership: October 2007by Ownership: October 2007
63.0%
21.8%
2.2%
13.1%
Corporate Safcol & Ex Safcol DWAF Individuals
Certified Area – 1 622 196 ha Certified Area – 1 622 196 ha (incl. planted & non-planted areas)(incl. planted & non-planted areas)

Section 3Section 3The Forest Products Industry The Forest Products Industry
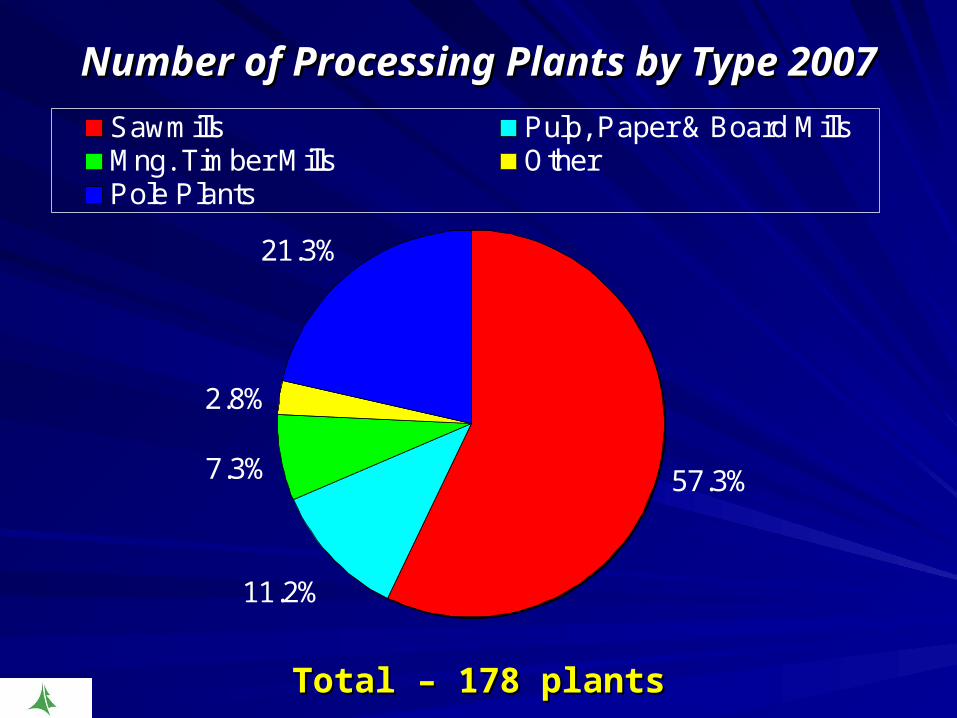
Number of Processing Plants by Type 2007Number of Processing Plants by Type 2007
57.3%
11.2%
7.3%
21.3%
2.8%
Sawmills Pulp, Paper & Board MillsMng. Timber Mills OtherPole Plants
Total – 178 plantsTotal – 178 plants

Intake of Roundwood into Processing Plants Intake of Roundwood into Processing Plants 1980 to 20071980 to 2007
0
5
10
15
20
25
1980 1984 1988 1992 1996 2000 2004
Years
Mill
ion
m3
Pulp & Paper Mills Sawmills
Mng. Timber Mills Other
Total
Total increase in intake over periodTotal increase in intake over period - 8.7 million m- 8.7 million m3 3 (78%) (78%)Biggest increase that of pulpwoodBiggest increase that of pulpwood - 9.7 million m- 9.7 million m33 (229%) (229%)
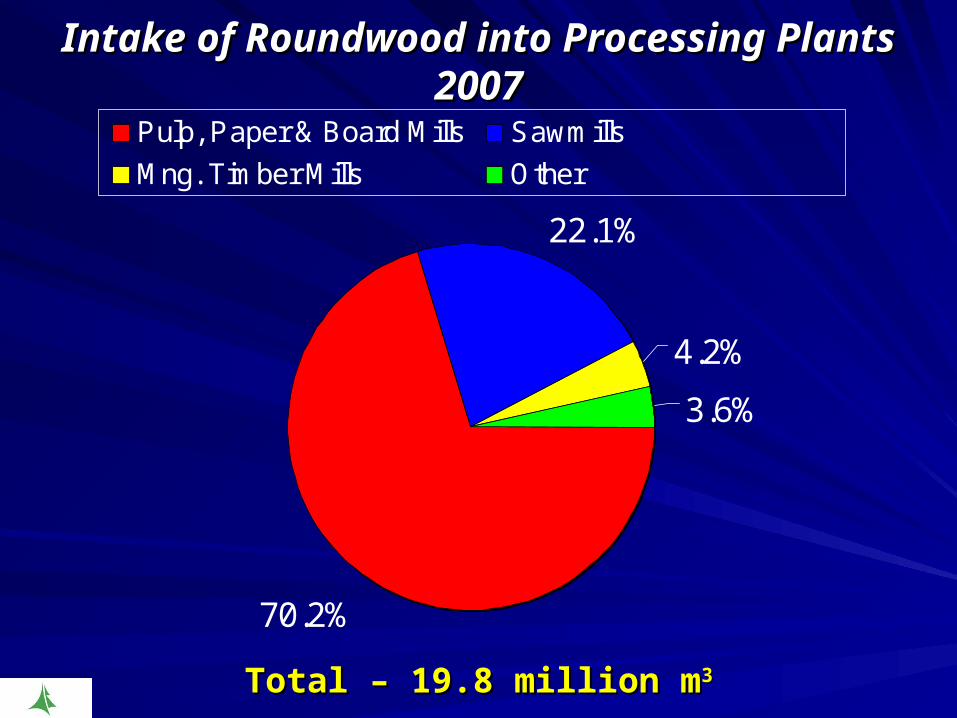
Intake of Roundwood into Processing Plants Intake of Roundwood into Processing Plants 20072007
70.2%
22.1%
4.2%
3.6%
Pulp, Paper & Board Mills Sawmills
Mng. Timber Mills Other
Total – 19.8 million mTotal – 19.8 million m33

Average Size of Plant by IntakeAverage Size of Plant by Intake1980 vs. 20071980 vs. 2007
46
26
7
72
25
351
111
59
11
63
43
694
0 100 200 300 400 500 600 700 800
Average All
Other Plants
Pole Plants
Mng. Timber Mills
Sawmills
Pulp & Paper Mills
Thousand m3
1980 2007
Overall average intake has increased by: Overall average intake has increased by: - 141%- 141%Average intake of PP & Board Mills has increased by: Average intake of PP & Board Mills has increased by: - 98%- 98%Only average intake of MT Mills has declined – byOnly average intake of MT Mills has declined – by - 13%- 13%
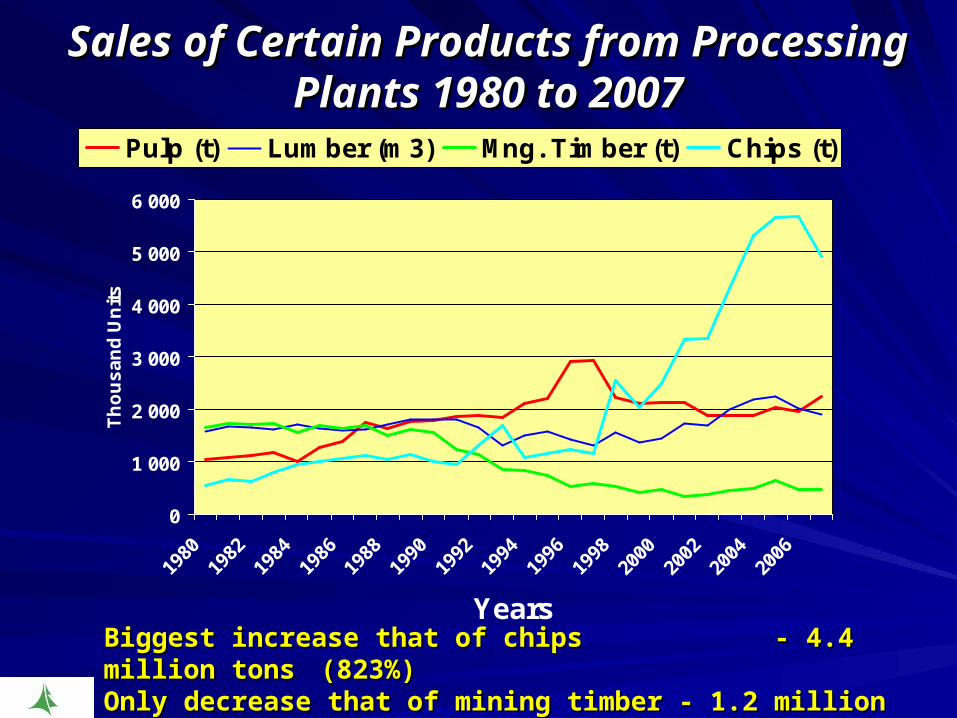
Sales of Certain Products from Processing Sales of Certain Products from Processing Plants 1980 to 2007Plants 1980 to 2007
0
1 000
2 000
3 000
4 000
5 000
6 000
1980
1982
1984
1986
1988
1990
1992
1994
1996
1998
2000
2002
2004
2006
Years
Th
ou
sa
nd
Un
its
Pulp (t) Lumber (m3) Mng. Timber (t) Chips (t)
Biggest increase that of chipsBiggest increase that of chips - 4.4 million tons- 4.4 million tons (823%) (823%)Only decrease that of mining timberOnly decrease that of mining timber - 1.2 million tons (71%) - 1.2 million tons (71%)

Value of Sales from Primary Processing Plants Value of Sales from Primary Processing Plants 20072007
53.2%
10.3%
17.4%
1.2%
4.9%
12.9%
Pulp Chips Lumber Panels Mng. Timber Other
Total – R18.5 billionTotal – R18.5 billion

Value of Sales from Primary Processing Value of Sales from Primary Processing Plants 1980 to 2007Plants 1980 to 2007
0
2
4
6
8
10
12
14
16
18
20
1980 1984 1988 1992 1996 2000 2004
Years
Bil
lio
n R
and
(20
07 R
and
s)Nominal Real
Nominal increase over periodNominal increase over period - R17.8 bn (2 549%)- R17.8 bn (2 549%)Real increase over periodReal increase over period - R8.9 bn (93%)- R8.9 bn (93%)

Contribution to GDP 1980 to 2007Contribution to GDP 1980 to 2007
0%
2%
4%
6%
8%
10%
12%
14%
1980 1984 1988 1992 1996 2000 2004
Years
% C
on
trib
uti
on
to
GD
PForestry to Agric. GDP FP to Mnfg. GDP
FP to total GDP
Increase in Forestry GDP over period from 4.5% to 9.1%Increase in Forestry GDP over period from 4.5% to 9.1%Decrease in For. Prod. GDP over period from 6.3% to 5.7%Decrease in For. Prod. GDP over period from 6.3% to 5.7%
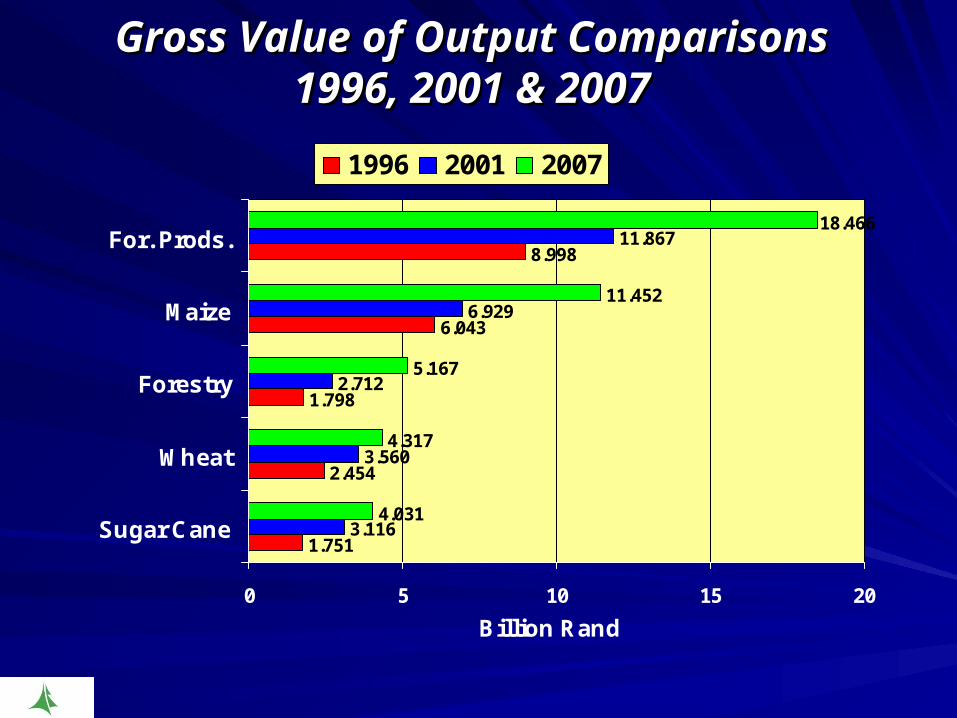
Gross Value of Output ComparisonsGross Value of Output Comparisons1996, 2001 & 20071996, 2001 & 2007
1.751
2.454
1.798
6.043
8.998
3.116
3.560
2.712
6.929
11.867
4.031
4.317
5.167
11.452
18.466
0 5 10 15 20
Sugar Cane
Wheat
Forestry
Maize
For. Prods.
Billion Rand
1996 2001 2007
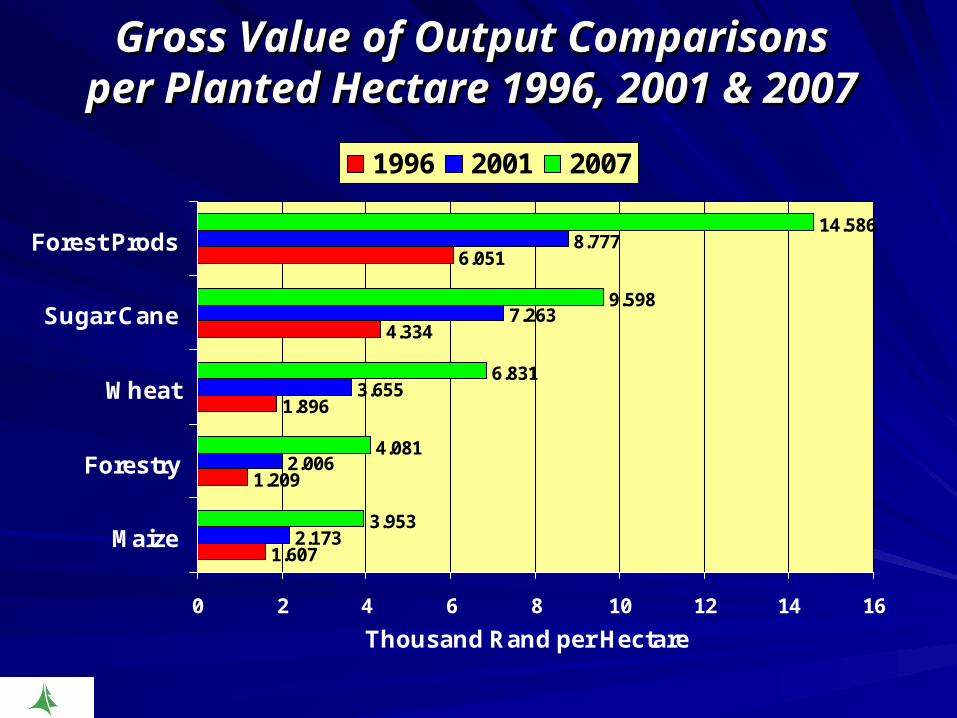
Gross Value of Output ComparisonsGross Value of Output Comparisonsper Planted Hectare 1996, 2001 & 2007per Planted Hectare 1996, 2001 & 2007
1.607
1.209
1.896
4.334
6.051
2.173
2.006
3.655
7.263
8.777
3.953
4.081
6.831
9.598
14.586
0 2 4 6 8 10 12 14 16
Maize
Forestry
Wheat
Sugar Cane
Forest Prods
Thousand Rand per Hectare
1996 2001 2007
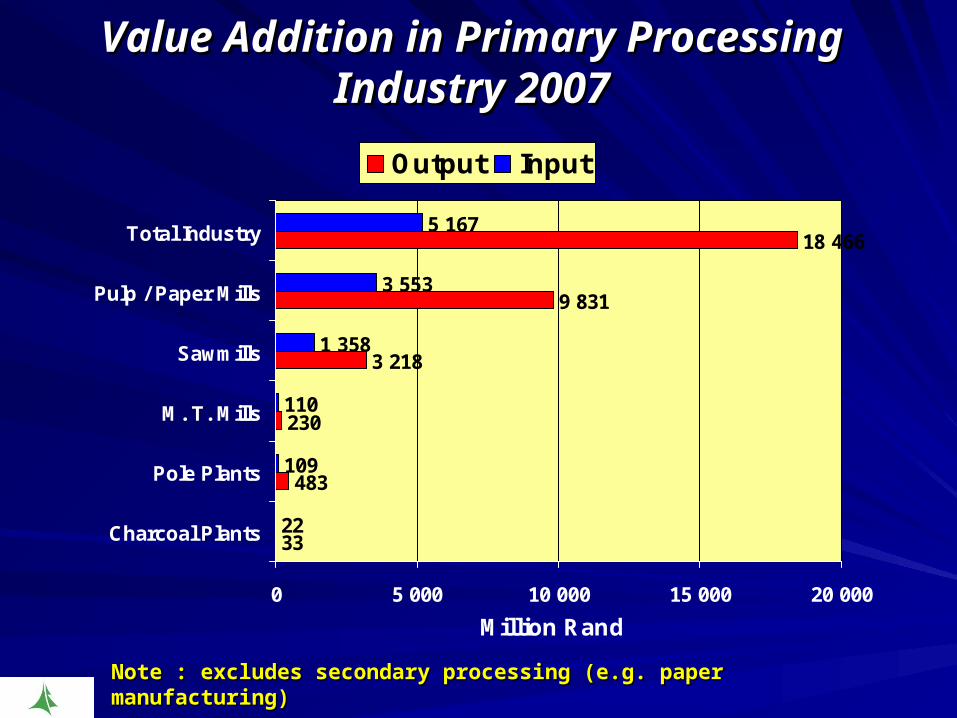
Value Addition in Primary Processing Value Addition in Primary Processing Industry 2007Industry 2007
33
483
230
3 218
9 831
18 466
22
109
110
1 358
3 553
5 167
0 5 000 10 000 15 000 20 000
Charcoal Plants
Pole Plants
M. T. Mills
Sawmills
Pulp / Paper Mills
Total Industry
Million Rand
Output Input
Note : excludes secondary processing (e.g. paper manufacturing)Note : excludes secondary processing (e.g. paper manufacturing)

Value Addition Comparisons in Primary Value Addition Comparisons in Primary Processing Industry 2007Processing Industry 2007
1.50
2.10
2.37
2.77
3.57
4.43
0.0 1.0 2.0 3.0 4.0 5.0
Charcoal Plants
M. T. Mills
Sawmills
Pulp / Paper Mills
Total Industry
Pole Plants
Output as ratio of Input
Note : Based only on input value of raw fibre (i.e. excludes all other input costs)Note : Based only on input value of raw fibre (i.e. excludes all other input costs)

Section 4 Section 4 Contribution to Employment Contribution to Employment
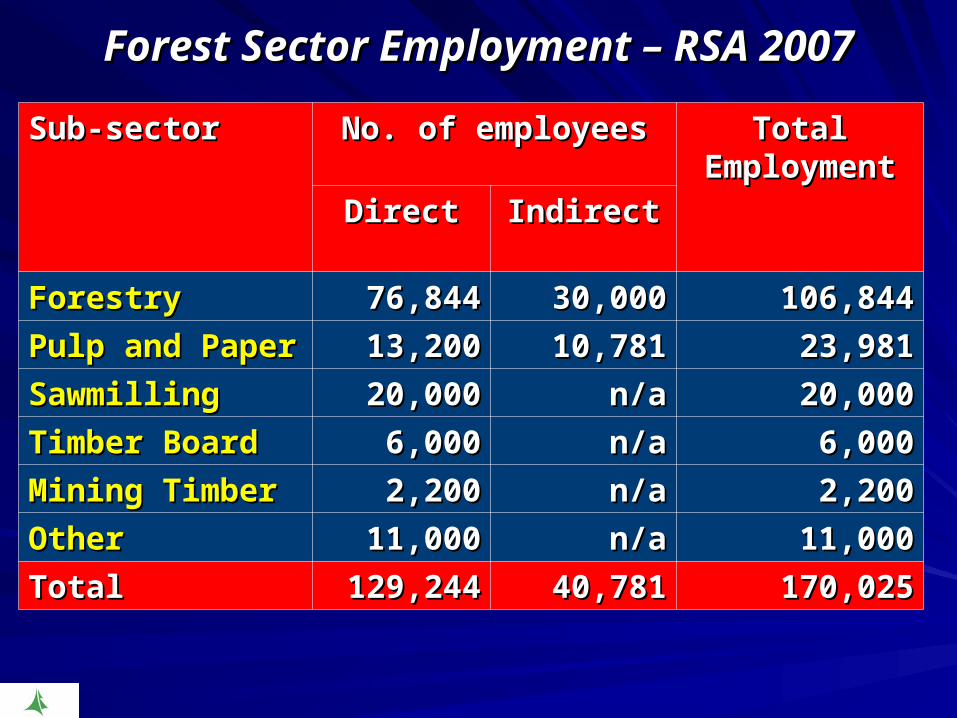
Forest Sector Employment – RSA 2007Forest Sector Employment – RSA 2007
Sub-sectorSub-sector No. of employeesNo. of employees Total Total EmploymentEmploymentDirectDirect Indirect Indirect
ForestryForestry 76,84476,844 30,00030,000 106,844106,844
Pulp and PaperPulp and Paper 13,20013,200 10,78110,781 23,98123,981
SawmillingSawmilling 20,00020,000 n/an/a 20,00020,000
Timber BoardTimber Board 6,0006,000 n/an/a 6,0006,000
Mining TimberMining Timber 2,2002,200 n/an/a 2,2002,200
OtherOther 11,00011,000 n/an/a 11,00011,000
TotalTotal 129,244129,244 40,78140,781 170,025170,025

Direct Employment in Forestry Industry Direct Employment in Forestry Industry by Province 2007by Province 2007
45.0%
38.0%13.4%
3.6%
KZN Mpumalanga Cape Limpopo
Total – 77,000Total – 77,000
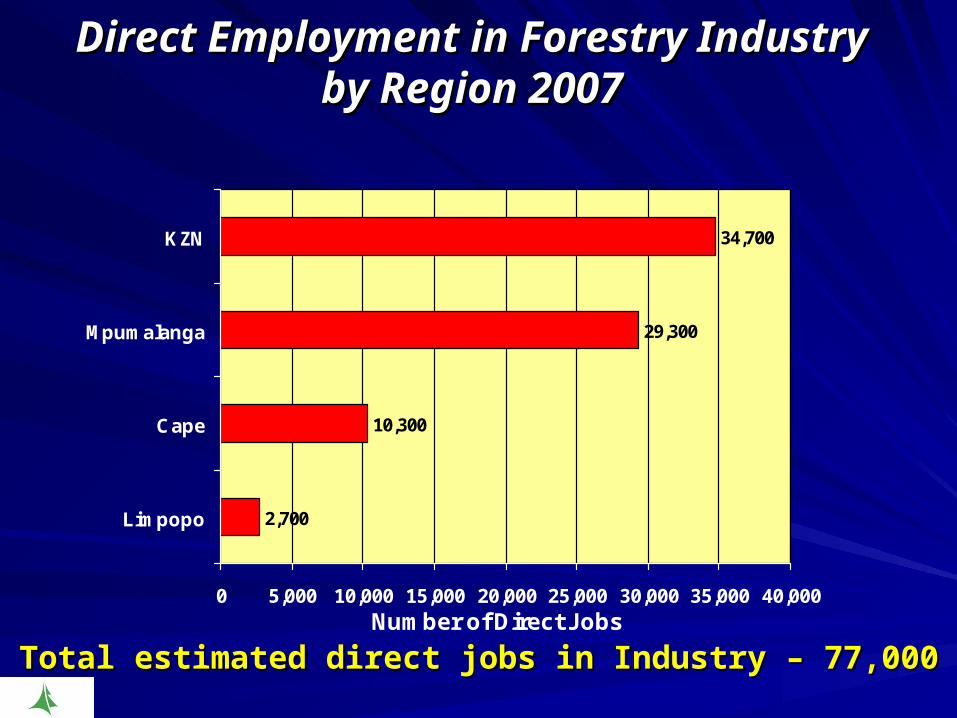
Direct Employment in Forestry Industry Direct Employment in Forestry Industry by Region 2007by Region 2007
2,700
10,300
29,300
34,700
0 5,000 10,000 15,000 20,000 25,000 30,000 35,000 40,000
Limpopo
Cape
Mpumalanga
KZN
Number of Direct Jobs
Total estimated direct jobs in Industry – 77,000Total estimated direct jobs in Industry – 77,000
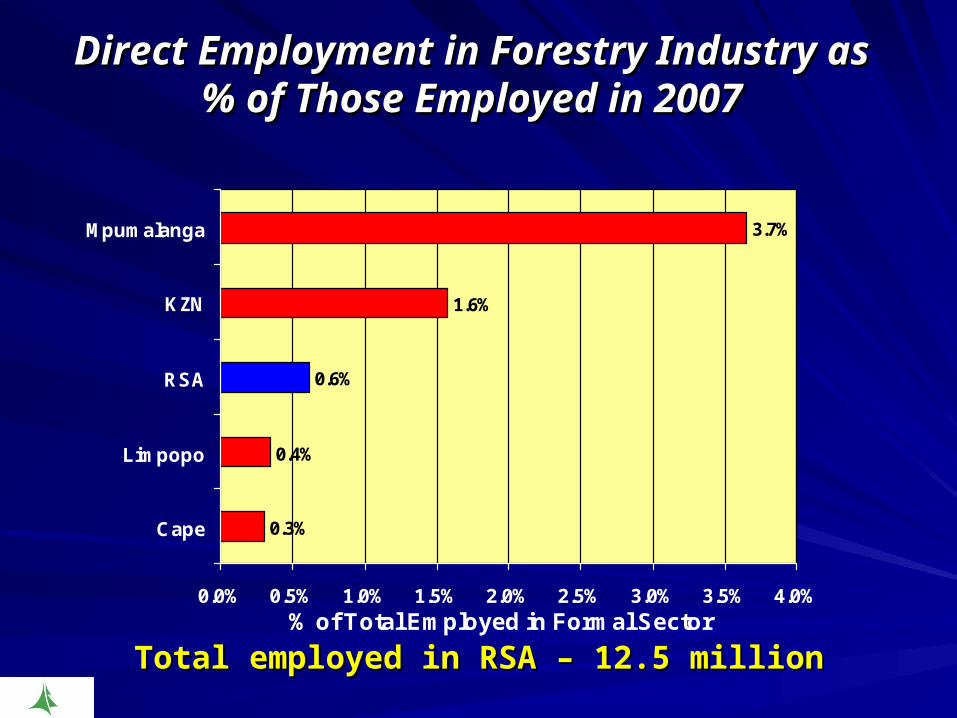
Direct Employment in Forestry Industry as Direct Employment in Forestry Industry as % of Those Employed in 2007% of Those Employed in 2007
0.3%
0.4%
0.6%
1.6%
3.7%
0.0% 0.5% 1.0% 1.5% 2.0% 2.5% 3.0% 3.5% 4.0%
Cape
Limpopo
RSA
KZN
Mpumalanga
% of Total Employed in Formal Sector
Total employed in RSA – 12.5 millionTotal employed in RSA – 12.5 million

Indirect Employment in Forestry Indirect Employment in Forestry Industry by Province 2007Industry by Province 2007
16,200
61,800
175,800
208,200
0 50,000 100,000 150,000 200,000 250,000
Limpopo
Cape
Mpumalanga
KZN
Number of Indirect Jobs
Total estimated indirect jobs created by Industry – 462,000Total estimated indirect jobs created by Industry – 462,000
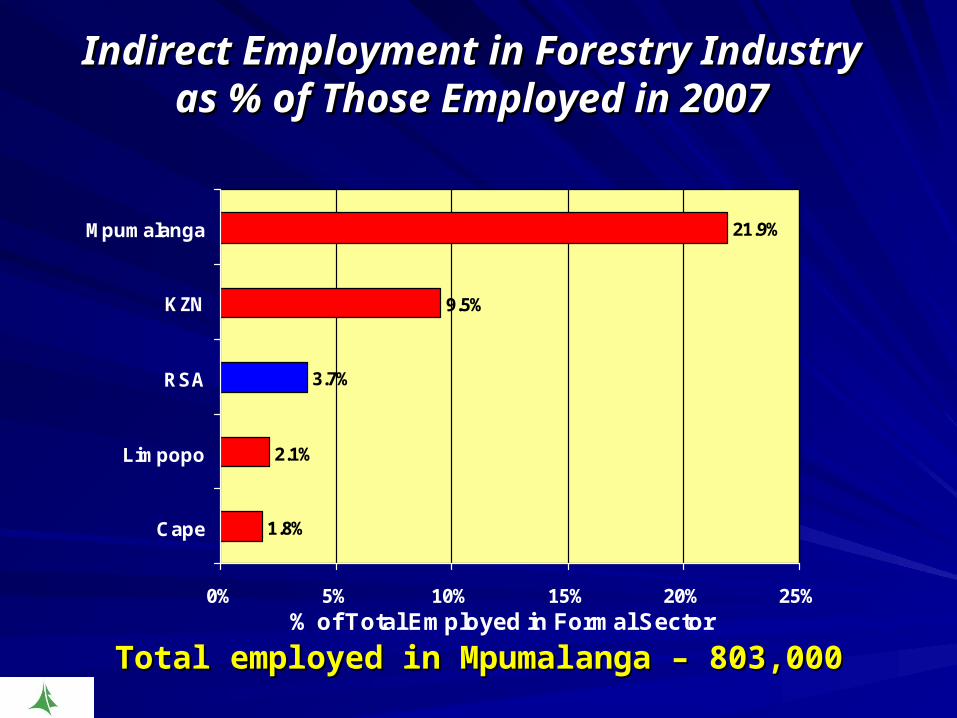
Indirect Employment in Forestry Industry Indirect Employment in Forestry Industry as % of Those Employed in 2007as % of Those Employed in 2007
1.8%
2.1%
3.7%
9.5%
21.9%
0% 5% 10% 15% 20% 25%
Cape
Limpopo
RSA
KZN
Mpumalanga
% of Total Employed in Formal Sector
Total employed in Mpumalanga – 803,000Total employed in Mpumalanga – 803,000
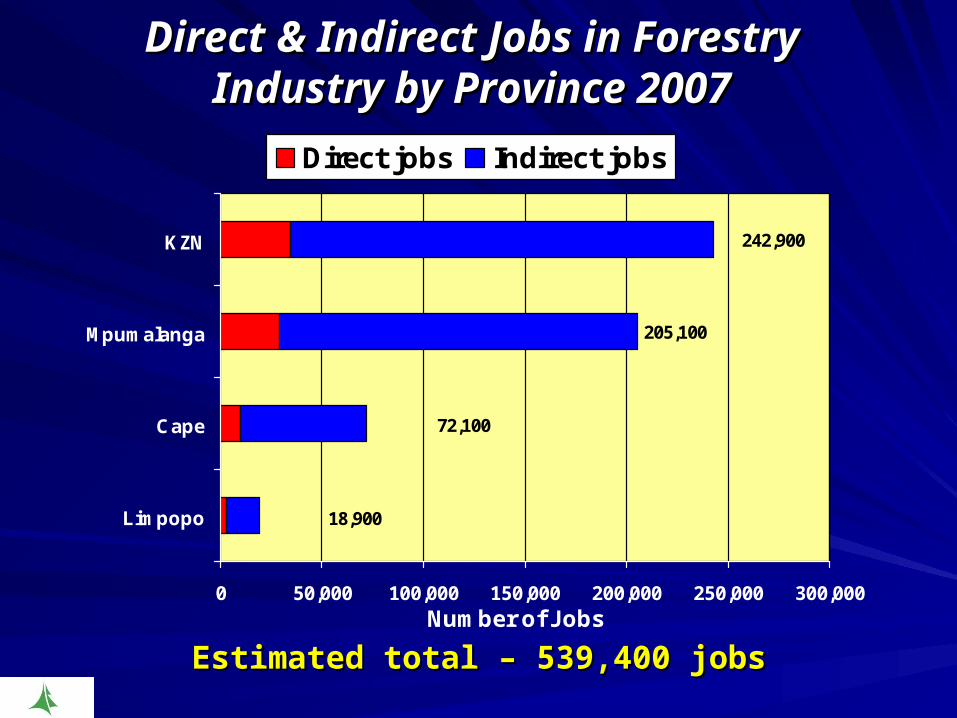
Direct & Indirect Jobs in Forestry Direct & Indirect Jobs in Forestry Industry by Province 2007Industry by Province 2007
242,900
18,900
72,100
205,100
0 50,000 100,000 150,000 200,000 250,000 300,000
Limpopo
Cape
Mpumalanga
KZN
Number of Jobs
Direct jobs Indirect jobs
Estimated total – 539,400 jobsEstimated total – 539,400 jobs
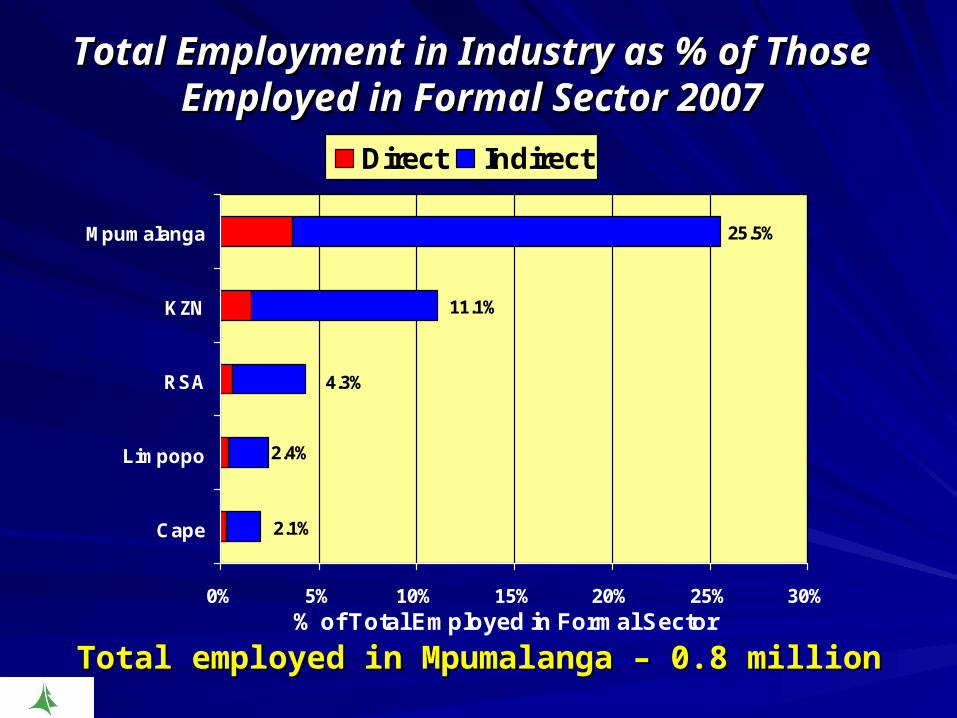
Total Employment in Industry as % of Those Total Employment in Industry as % of Those Employed in Formal Sector 2007Employed in Formal Sector 2007
2.1%
2.4%
4.3%
11.1%
25.5%
0% 5% 10% 15% 20% 25% 30%
Cape
Limpopo
RSA
KZN
Mpumalanga
% of Total Employed in Formal Sector
Direct Indirect
Total employed in Mpumalanga – 0.8 millionTotal employed in Mpumalanga – 0.8 million

Dependents of Those Working in Dependents of Those Working in Forestry Industry by Region 2007Forestry Industry by Region 2007
645,000
227,000
763,000
0 200,000 400,000 600,000 800,000 1,000,000
Limpopo
Cape
Mpumalanga
KZN
Number of Dependents
Direct job dependents Indirect job dependents
9
Estimated total – 1.7 million dependentsEstimated total – 1.7 million dependents
59,000

Total Number of People Dependent on Total Number of People Dependent on Forestry Industry by Region 2007Forestry Industry by Region 2007
904,000
730,000
24,000
64,000
115,000
0 200,000 400,000 600,000 800,000 1,000,000 1,200,000
W. Cape
Limpopo
E. Cape
Mpumalanga
KZN
Number of People Dependent on Industry
Workers Dependents
9
Estimated total – 2.3 million livelihoodsEstimated total – 2.3 million livelihoods

Estimated % of Population Dependent Estimated % of Population Dependent on Forestry Industry 2007on Forestry Industry 2007
1.5%
2.7%
5.0%
10.7%
27.2%
0% 5% 10% 15% 20% 25% 30%
Limpopo
Cape
RSA
KZN
Mpumalanga
% of Provincial Population

Section 5 Section 5 Investment in Sector Investment in Sector

Investment in RSA Forestry Industry 2007Investment in RSA Forestry Industry 2007
54.3%
21.0% 15.8%
1.5%
7.5%
Trees LandRoads Fixed AssetsMoveable Assets
Total Investment - R17.4 BillionTotal Investment - R17.4 Billion

Investment in RSA Forestry Industry 2007Investment in RSA Forestry Industry 2007
46.9%
28.5%16.2%
1.9%
6.6%
Pine Long Gum Short Pine Short
Wattle Gum Long
Total Investment - R17.4 BillionTotal Investment - R17.4 Billion
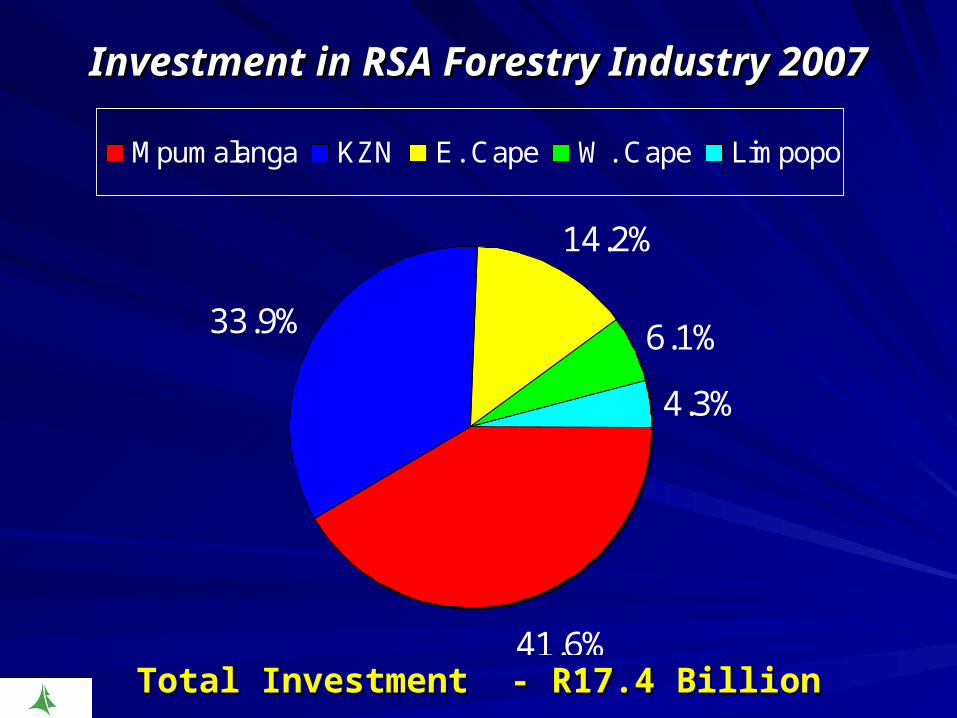
Investment in RSA Forestry Industry 2007Investment in RSA Forestry Industry 2007
41.6%
33.9%
14.2%
4.3%
6.1%
Mpumalanga KZN E. Cape W. Cape Limpopo
Total Investment - R17.4 BillionTotal Investment - R17.4 Billion
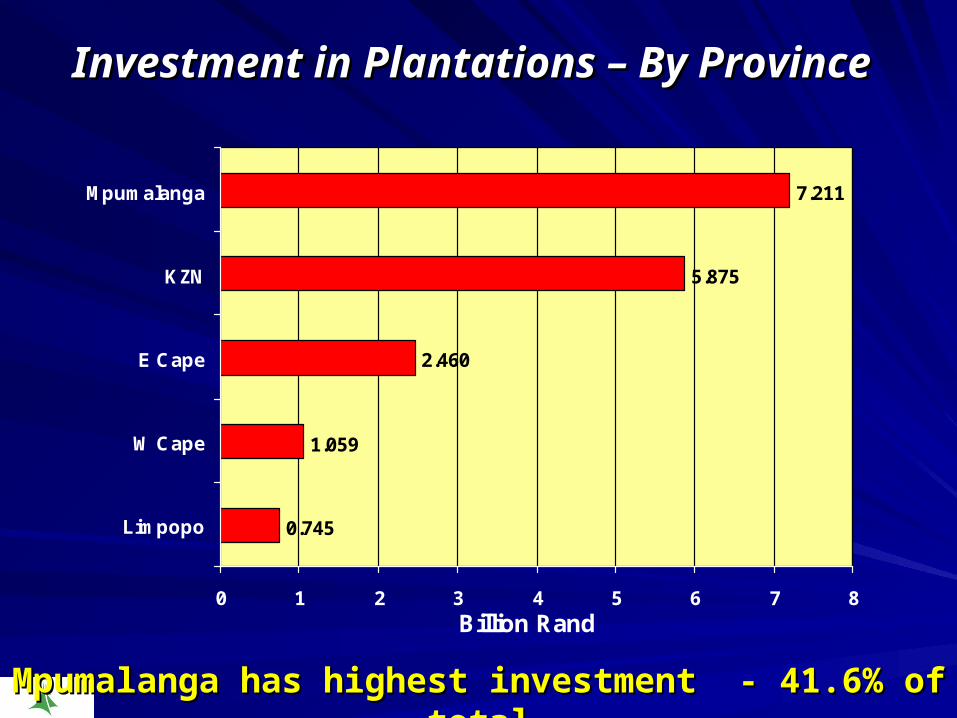
Investment in Plantations – By ProvinceInvestment in Plantations – By Province
0.745
1.059
2.460
5.875
7.211
0 1 2 3 4 5 6 7 8
Limpopo
W Cape
E Cape
KZN
Mpumalanga
Billion Rand
Mpumalanga has highest investment - 41.6% of totalMpumalanga has highest investment - 41.6% of total
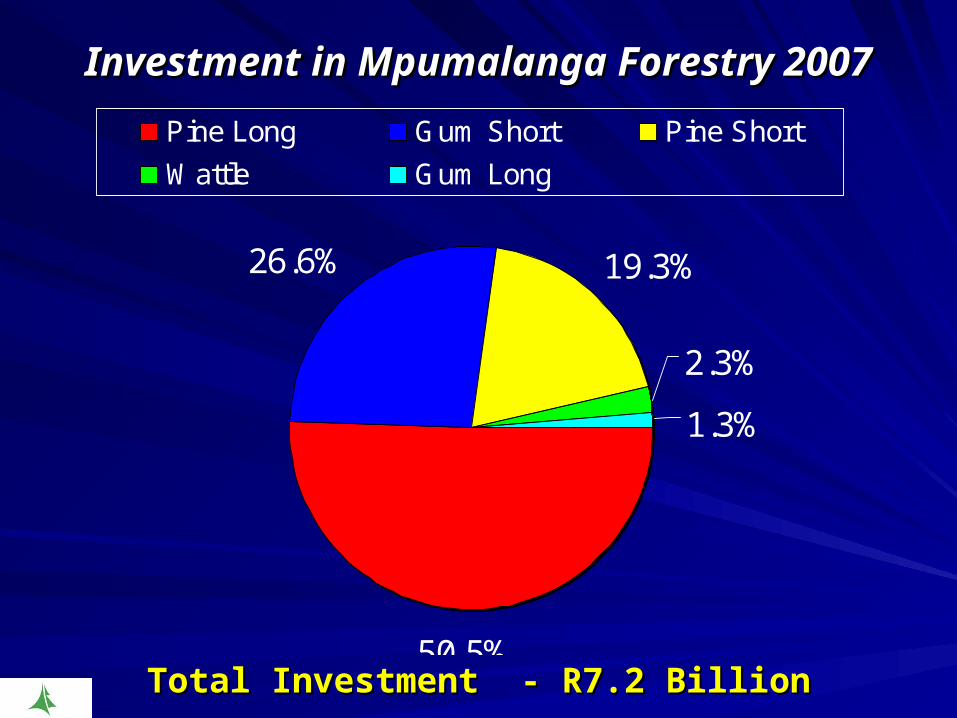
Investment in Mpumalanga Forestry 2007Investment in Mpumalanga Forestry 2007
50.5%
26.6% 19.3%
1.3%
2.3%
Pine Long Gum Short Pine Short
Wattle Gum Long
Total Investment - R7.2 BillionTotal Investment - R7.2 Billion
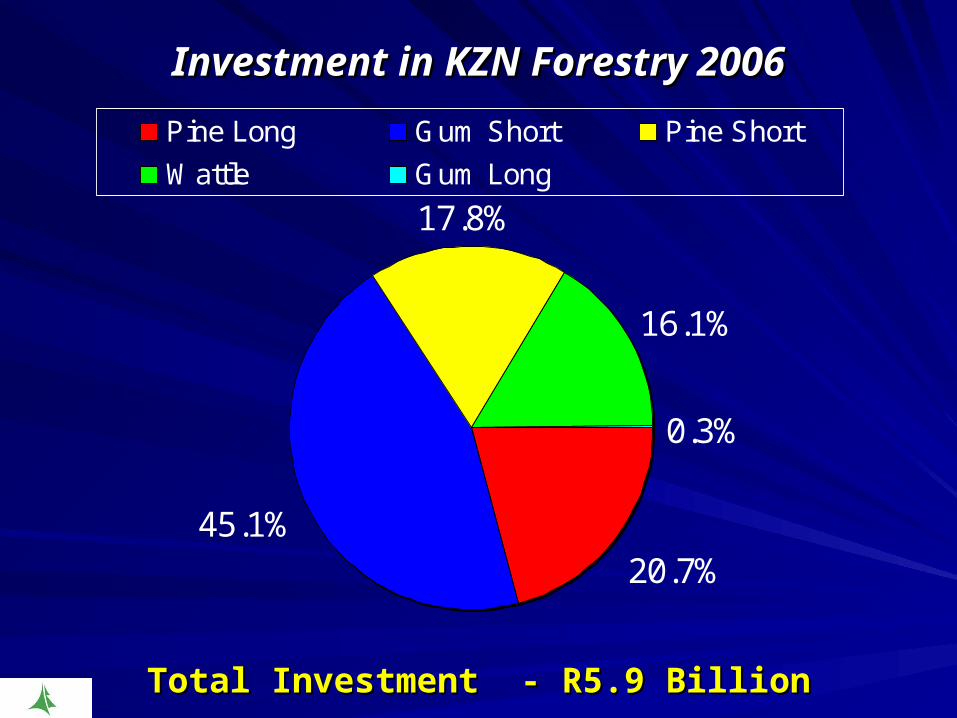
Investment in KZN Forestry 2006Investment in KZN Forestry 2006
20.7%45.1%
17.8%
0.3%
16.1%
Pine Long Gum Short Pine Short
Wattle Gum Long
Total Investment - R5.9 BillionTotal Investment - R5.9 Billion

Investment in E. Cape Forestry 2007Investment in E. Cape Forestry 2007
74.7%
8.5%
14.9%
0.7%
1.2%
Pine Long Gum Short Pine Short
Wattle Gum Long
Total Investment - R2.5 BillionTotal Investment - R2.5 Billion

Investment in W. Cape Forestry 2007Investment in W. Cape Forestry 2007
91.9%
1.1%
0.6%
6.3%
0.0%
Pine Long Gum Short Pine Short
Wattle Gum Long
Total Investment - R1.1 BillionTotal Investment - R1.1 Billion
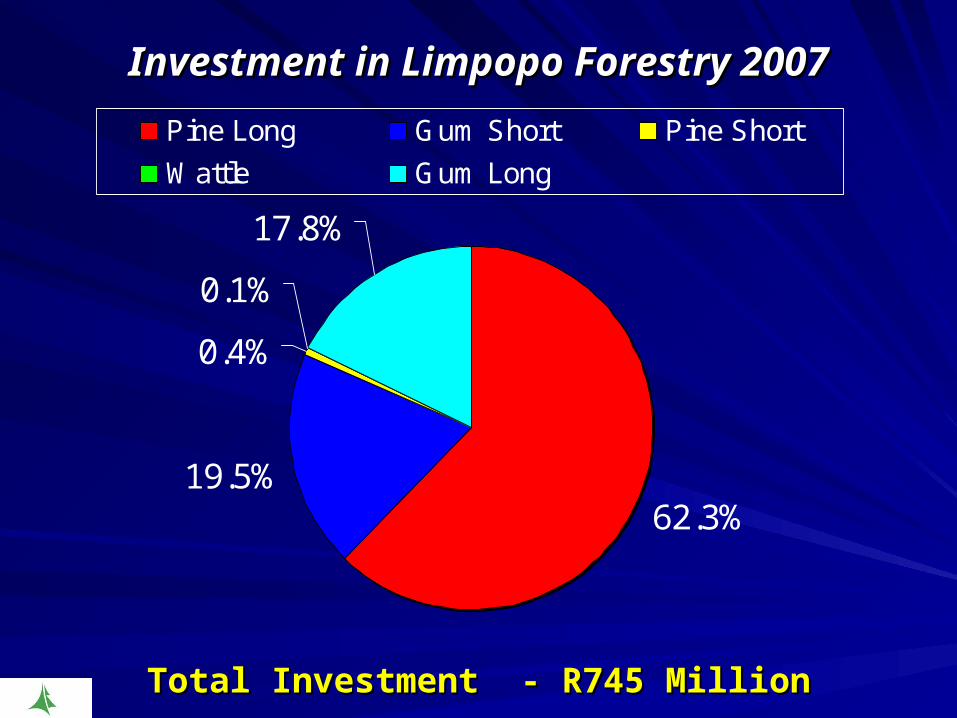
Investment in Limpopo Forestry 2007Investment in Limpopo Forestry 2007
62.3%19.5%
0.4%
17.8%
0.1%
Pine Long Gum Short Pine Short
Wattle Gum Long
Total Investment - R745 MillionTotal Investment - R745 Million

Investment in Forest Products Sector Investment in Forest Products Sector by Type of Processing Plant 2007by Type of Processing Plant 2007
89.3%
9.4%
0.6%
0.5%
0.2%
Pulp & Board Sawmills & VeneerPole Plants Mng. TimberOther
Total Book Value of Investments - R15.8 BillionTotal Book Value of Investments - R15.8 Billion
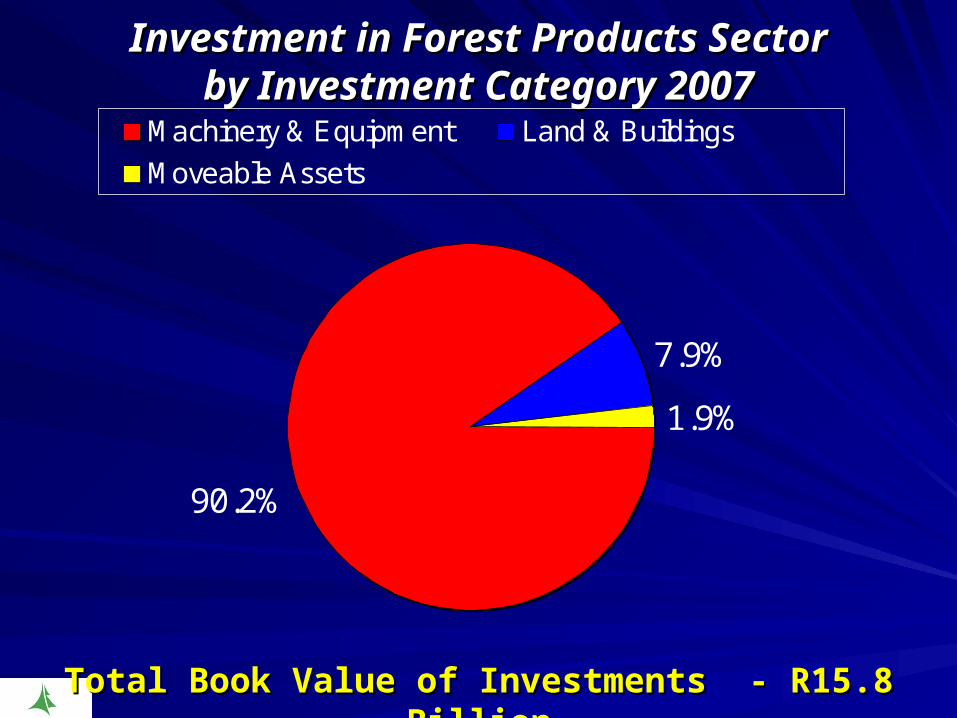
Investment in Forest Products SectorInvestment in Forest Products Sectorby Investment Category 2007by Investment Category 2007
90.2%
7.9%
1.9%
Machinery & Equipment Land & Buildings
Moveable Assets
Total Book Value of Investments - R15.8 BillionTotal Book Value of Investments - R15.8 Billion

Section 6 Section 6 Contribution to GDP Contribution to GDP

Composition of RSA GDPComposition of RSA GDP20072007
2.7%
7.9%
4.8%
22.0%
44.4%
18.2%
Agric Mining Other Secondary
Manufacturing Finance Other Tertiary
Total GDP – R1 727 BillionTotal GDP – R1 727 Billion
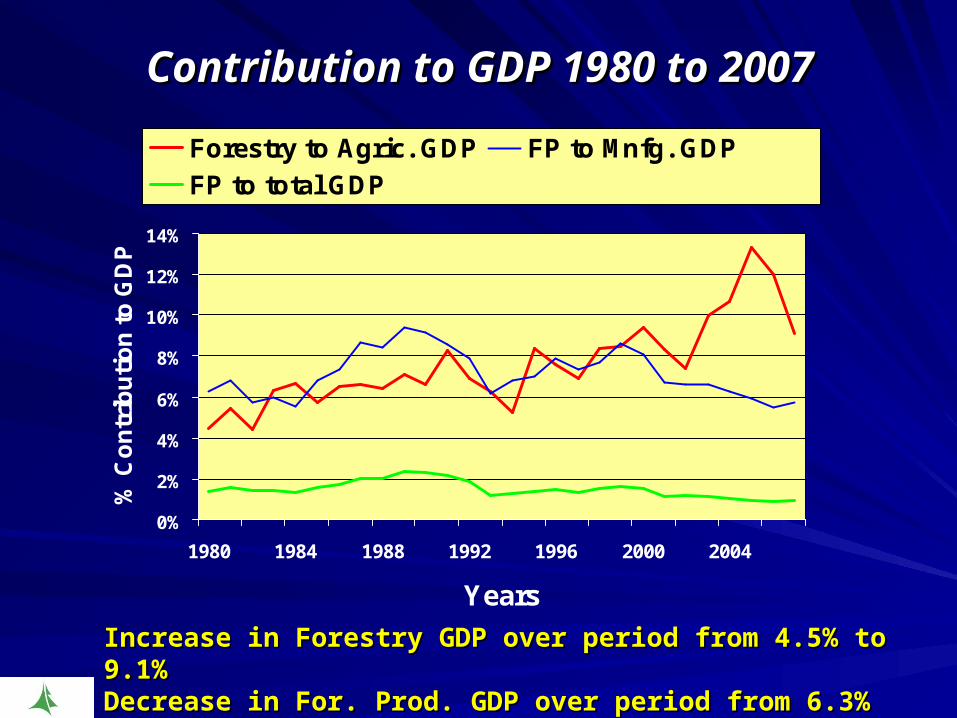
Contribution to GDP 1980 to 2007Contribution to GDP 1980 to 2007
0%
2%
4%
6%
8%
10%
12%
14%
1980 1984 1988 1992 1996 2000 2004
Years
% C
on
trib
uti
on
to
GD
PForestry to Agric. GDP FP to Mnfg. GDP
FP to total GDP
Increase in Forestry GDP over period from 4.5% to 9.1%Increase in Forestry GDP over period from 4.5% to 9.1%Decrease in For. Prod. GDP over period from 6.3% to 5.7%Decrease in For. Prod. GDP over period from 6.3% to 5.7%

Forestry vs. Other Agricultural GGP per Forestry vs. Other Agricultural GGP per Region 2007Region 2007
14.0%4.0%5.5%28.8%
53.7%
0%
10%
20%
30%
40%
50%
60%
70%
80%
90%
100%
Mpumalanga KZN Limpopo Cape RSA
Province
Forestry Other Agriculture
Forestry in Mpumalanga of major importance Forestry in Mpumalanga of major importance
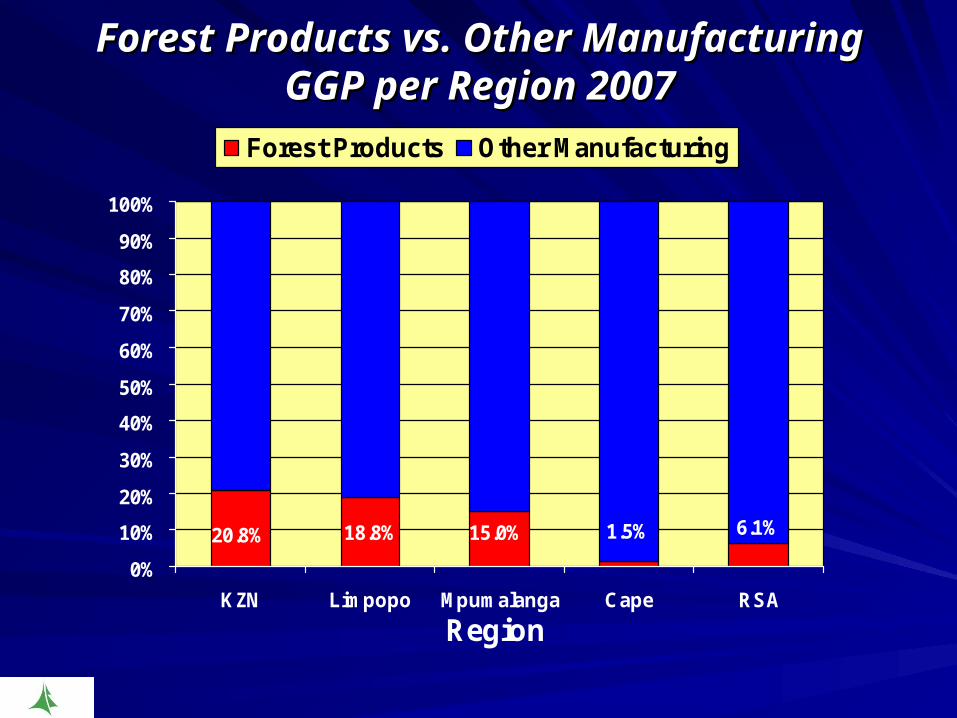
Forest Products vs. Other Manufacturing Forest Products vs. Other Manufacturing GGP per Region 2007GGP per Region 2007
6.1%1.5%15.0%18.8%20.8%
0%
10%
20%
30%
40%
50%
60%
70%
80%
90%
100%
KZN Limpopo Mpumalanga Cape RSA
Region
Forest Products Other Manufacturing
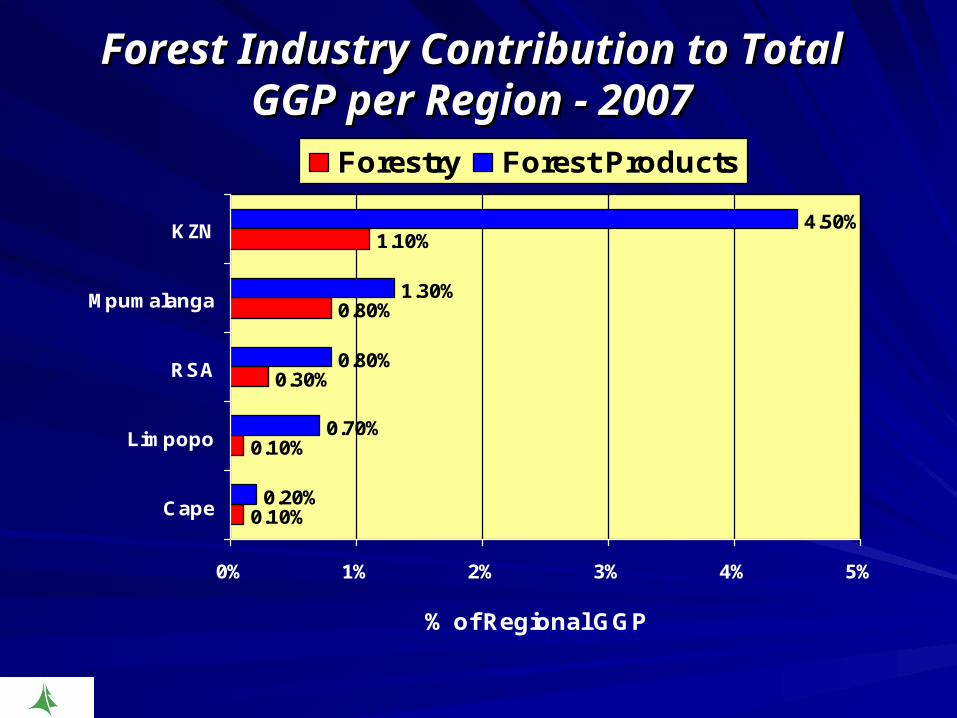
Forest Industry Contribution to Total Forest Industry Contribution to Total GGP per Region - 2007GGP per Region - 2007
0.10%
0.10%
0.30%
0.80%
1.10%
0.20%
0.70%
0.80%
1.30%
4.50%
0% 1% 2% 3% 4% 5%
Cape
Limpopo
RSA
Mpumalanga
KZN
% of Regional GGP
Forestry Forest Products

Forest Industry Contribution to Total Forest Industry Contribution to Total GGP per Region - 2007GGP per Region - 2007
5.62%
0.37%
0.8%
1.36%
2.09%
0% 1% 2% 3% 4% 5% 6%
Cape
Limpopo
RSA
Mpumalanga
KZN
% of Regional GGP
Forestry Forest Products

Gross Value of Output ComparisonsGross Value of Output Comparisons1996, 2001 & 20071996, 2001 & 2007
1.751
2.454
1.798
6.043
8.998
3.116
3.560
2.712
6.929
11.867
4.031
4.317
5.167
11.452
18.466
0 5 10 15 20
Sugar Cane
Wheat
Forestry
Maize
For. Prods.
Billion Rand
1996 2001 2007

Gross Value of Output ComparisonsGross Value of Output Comparisonsper Planted Hectare 1996, 2001 & 2007per Planted Hectare 1996, 2001 & 2007
1.607
1.209
1.896
4.334
6.051
2.173
2.006
3.655
7.263
8.777
3.953
4.081
6.831
9.598
14.586
0 2 4 6 8 10 12 14 16
Maize
Forestry
Wheat
Sugar Cane
Forest Prods
Thousand Rand per Hectare
1996 2001 2007

Section 7 Section 7 Contribution to Foreign Trade Contribution to Foreign Trade
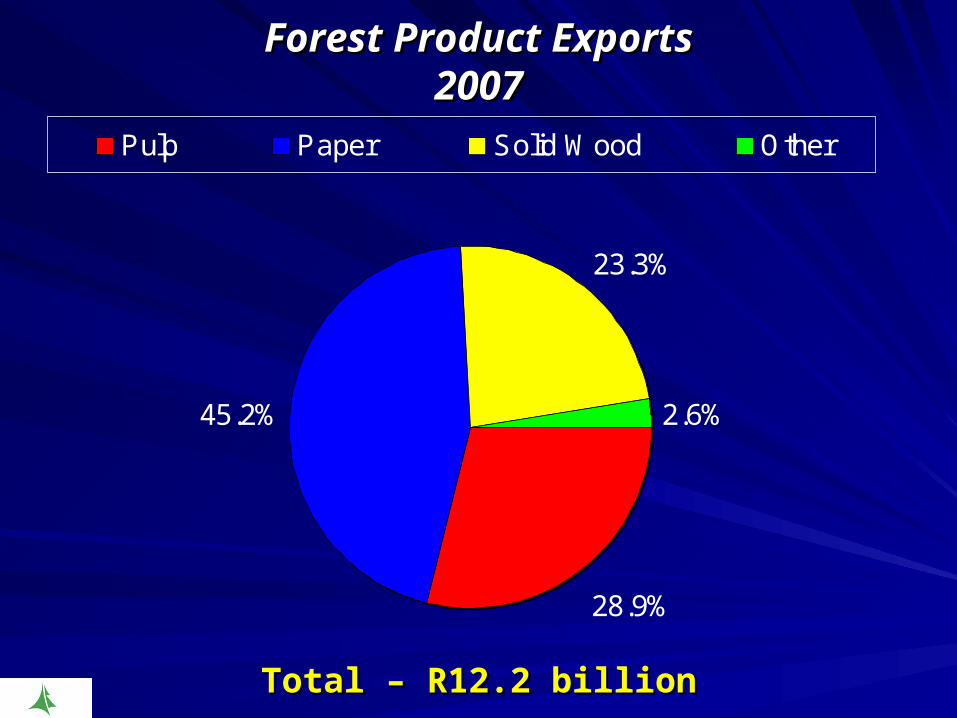
Forest Product ExportsForest Product Exports20072007
28.9%
45.2%
23.3%
2.6%
Pulp Paper Solid Wood Other
Total – R12.2 billionTotal – R12.2 billion
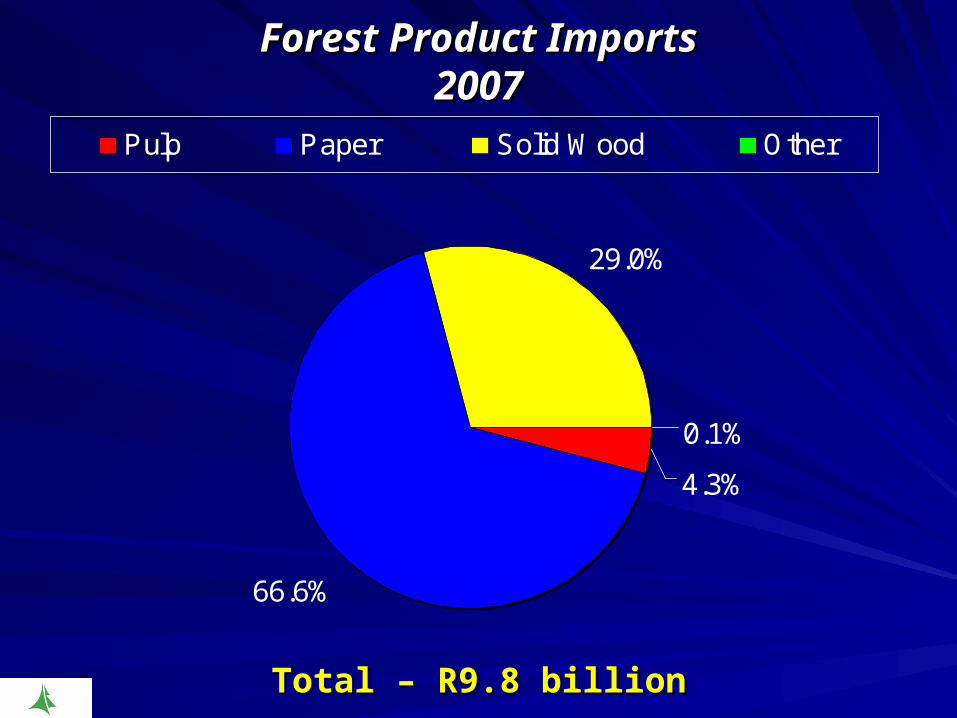
Forest Product ImportsForest Product Imports20072007
4.3%
66.6%
29.0%
0.1%
Pulp Paper Solid Wood Other
Total – R9.8 billionTotal – R9.8 billion

Trade Balance in Forest ProductsTrade Balance in Forest Products1980 to 2007 (nominal)1980 to 2007 (nominal)
0
2
4
6
8
10
12
14
1992
1993
1994
1995
1996
1997
1998
1999
2000
2001
2002
2003
2004
2005
2006
2007
Years
Bill
ion
Ra
nd
Imports Exports Trade Balance
Increase in importsIncrease in imports - R8.3 billion (589%)- R8.3 billion (589%)Increase in exportsIncrease in exports - R9.8 billion (421%)- R9.8 billion (421%)Increase in trade balanceIncrease in trade balance - R1.5 billion (164%)- R1.5 billion (164%)

Trade Balance in Forest ProductsTrade Balance in Forest Products1980 to 2007 (real)1980 to 2007 (real)
0
2
4
6
8
10
12
14
16
1992
1993
1994
1995
1996
1997
1998
1999
2000
2001
2002
2003
2004
2005
2006
Years
Bill
ion
Ra
nd
(2
00
7 R
an
ds
)
Imports Exports Trade Balance
Increase in importsIncrease in imports - R6.1 billion (168%)- R6.1 billion (168%)Increase in exportsIncrease in exports - R6.2 billion (103%)- R6.2 billion (103%)Increase in trade balanceIncrease in trade balance - R0.06 billion (3%)- R0.06 billion (3%)

Export ComparisonsExport Comparisons1996, 2001 & 20071996, 2001 & 2007
1.5
2.1
4.6
6.6
4.0
2.9
4.6
9.5
15.1
9.1
2.1
10.4
12.2
23.7
31.1
0 5 10 15 20 25 30 35
Sugar
Fruit
Forest Products
Coal
Metal Ores
Billion Rand
1996 2001 2007