THE SOUTH AFRICAN CEMENT INDUSTRY · cement sale projections were made in 2006, just before the...
70
THE SOUTH AFRICAN CEMENT INDUSTRY: A REVIEW OF ITS ENERGY EFFICIENCY AND ENVIROMENTAL PERFORMANCE SINCE 1980. MPhil: Specializing in Climate Change and Sustainable Development. University of Cape Town by CHINEDU INNOCENT OHANYERE OHNCHI001 Supervisor: Professor Mark . G. Alexander
Transcript of THE SOUTH AFRICAN CEMENT INDUSTRY · cement sale projections were made in 2006, just before the...

THE SOUTH AFRICAN CEMENT INDUSTRY:
A REVIEW OF ITS ENERGY EFFICIENCY AND
ENVIROMENTAL PERFORMANCE SINCE 1980.
MPhil: Specializing in Climate Change and Sustainable Development. University of Cape Town
by
CHINEDU INNOCENT OHANYERE
OHNCHI001
Supervisor: Professor Mark . G. Alexander

1 Ohanyere, C.I (2012)
DECLARATION
Minor dissertation presented for the approval of the Senate in partial fulfillment of the
requirements for the MPhil in Climate Change and Sustainable Development in
approved courses and a minor dissertation. I hereby declare that I have read and
understood the regulations governing the submission on MPhil specializing in Climate
Change and Sustainable Development dissertations, including those relating to length
and plagiarism, as contained in the rules of this University, and that this minor
dissertation conforms to those regulations.
Signature: ……Ohanyere C.I……… Date:...31 January, 2013…….
Energy Efficiency and Environmental Performance of the SA Cement Industry 2
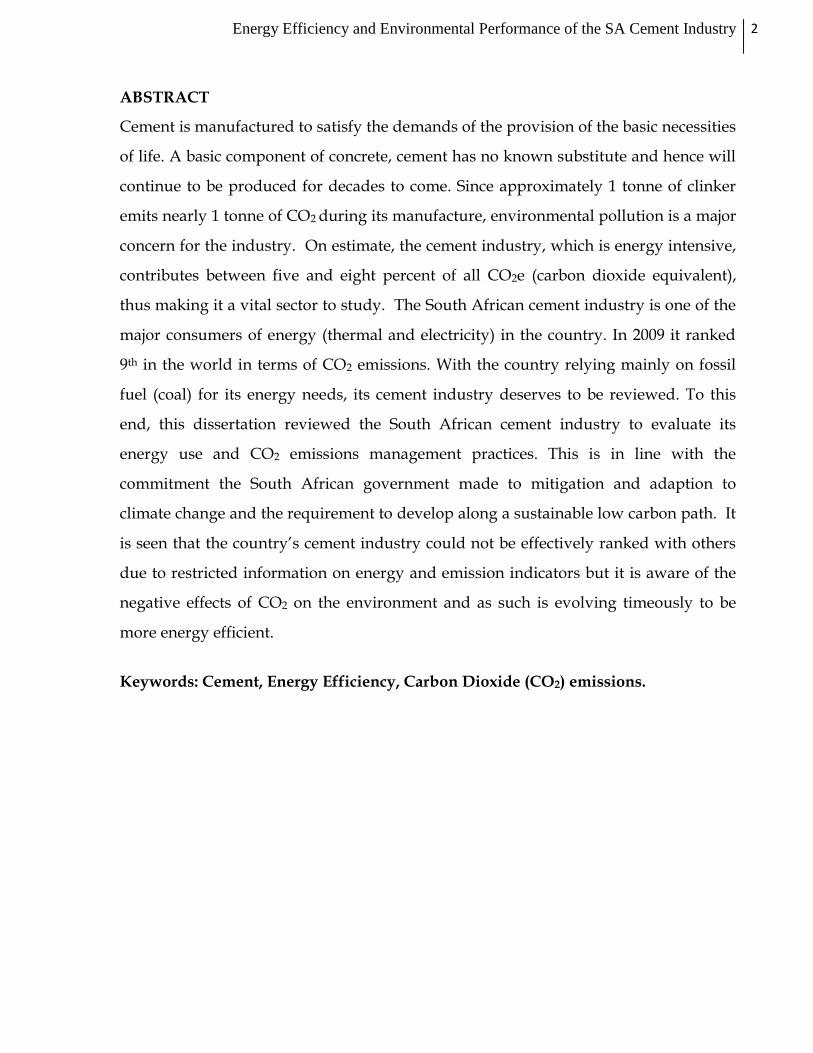
ABSTRACT
Cement is manufactured to satisfy the demands of the provision of the basic necessities
of life. A basic component of concrete, cement has no known substitute and hence will
continue to be produced for decades to come. Since approximately 1 tonne of clinker
emits nearly 1 tonne of CO2 during its manufacture, environmental pollution is a major
concern for the industry. On estimate, the cement industry, which is energy intensive,
contributes between five and eight percent of all CO2e (carbon dioxide equivalent),
thus making it a vital sector to study. The South African cement industry is one of the
major consumers of energy (thermal and electricity) in the country. In 2009 it ranked
9th in the world in terms of CO2 emissions. With the country relying mainly on fossil
fuel (coal) for its energy needs, its cement industry deserves to be reviewed. To this
end, this dissertation reviewed the South African cement industry to evaluate its
energy use and CO2 emissions management practices. This is in line with the
commitment the South African government made to mitigation and adaption to
climate change and the requirement to develop along a sustainable low carbon path. It
is seen that the country’s cement industry could not be effectively ranked with others
due to restricted information on energy and emission indicators but it is aware of the
negative effects of CO2 on the environment and as such is evolving timeously to be
more energy efficient.
Keywords: Cement, Energy Efficiency, Carbon Dioxide (CO2) emissions.

3 Ohanyere, C.I (2012)
INTRODUCTION
1.1 BACKGROUND
The census data shows South Africa has been increasing in population since 1980 at
approximately 2% per annum (Kok and Collinson, 2006). Similarly, the country’s
cementitious sales have steadily risen from 7 million tonnes in 1980 to an estimated 11
million tonnes in 2010 (C&CI, 2012). Economists allude to the fact that as population
increases, there is bound to be a corresponding rise in demand for the basic necessities
of life – with housing as top priority. However, if unchecked, such growth may lead to
the unsustainable consumption of scarce natural resources. So to meet structural and
infrastructural demands Aïtcin (2008) finds that one of the most important building
and construction materials in use is concrete – which has cement as a basic component.
This is so because concrete is versatile in use, thus culminating in the justification for
production of more cement. The most common cement, Portland cement (PC), is
derived from the calcining of clay, sand and limestone (a natural resource), with
limestone being its predominant constituent.
The fact that concrete has played, is still playing, and will continue to play major roles
in South Africa’s path to meeting its development agenda cannot be over emphasized.
Concrete is virtually seen everywhere (Aïtcin, 2008). Though not bearing the same
meaning, the terminologies concrete and cement have been used interchangeably by
many. As will be further elucidated upon in this dissertation, cement is an essential
ingredient in concrete. It possesses many positive features some of which include its
‘bond’ like function and its role in filling the voids between fine and coarse aggregates
in concrete, as well as its hydration reaction qualities which enables concrete to gain
strength continuously (Owen, 2003). But, by itself, cement is a poor building material
mainly due to its high shrinkage properties. Nonetheless, since its use and positive
qualities outweigh its negative qualities and since no suitable substitute (with similar
or better qualities) has yet been discovered, cement production globally and in South
Africa will remain a mainstay of a country’s manufacturing sector for the foreseeable
future.
Energy Efficiency and Environmental Performance of the SA Cement Industry 4
This makes reviewing the South African cement industry’s energy use and
environmental performance very important. Additionally, it is warranted to evaluate
the South African cement industry’s performance regionally and globally through the
lenses of energy efficiency and environmental performance because the industry
among others is facing huge pressures in its delivery requirements to the economy and
society at large. This is so because cement companies sometimes import cement and/or
clinker in order to augment their production rates, still consume large quantities of
fossil fuel (coal) to heat up their aging kilns and pre-heaters and, emit a proportionally
high amount of CO2 for a single industry.
Hence, this dissertation aims to critically analyze the energy efficiency and
environmental performance of the South African cement industry since 1980 with
respect to the Portland cement manufacturing process, the energy (thermal and
electrical) consumed per tonne of cement produced and the consequent CO2 emissions
being a resultant effect of the energy use and limestone de-carbonization in the process.
These analyses will fall within the context of the challenges of climate change and
sustainable development the industry faces and will be benchmarked against
international best practices. Therefore, to do this, the importance of cement will be
highlighted in its growing demand and production figures in addition to how critical
the material is to meet development objectives. Moreover, the significance of reducing
energy use and CO2 emissions during cement manufacture will be discussed.
1.2 DISSERTATION OVERVIEW
1.2.1 Rising Cement Demand and Production.
The first Portland cement manufactured in South Africa was in 1892 by De Eerste
Zement Fabrieken Beperkt, which became Pretoria Portland Cement, or PPC (PPC,
2010). Since then there has been a steady growth (Akindahunsi, 2011) in the quantity of
cement produced in direct relation to the country’s demand (PPC, 2007).
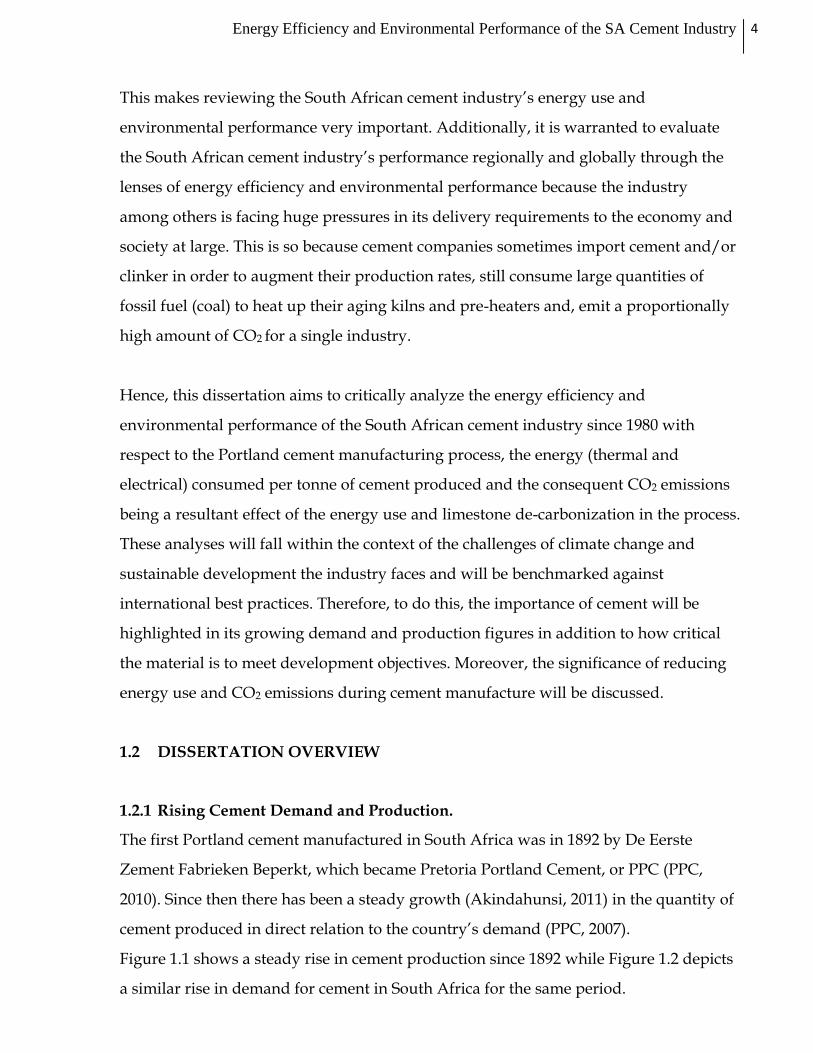
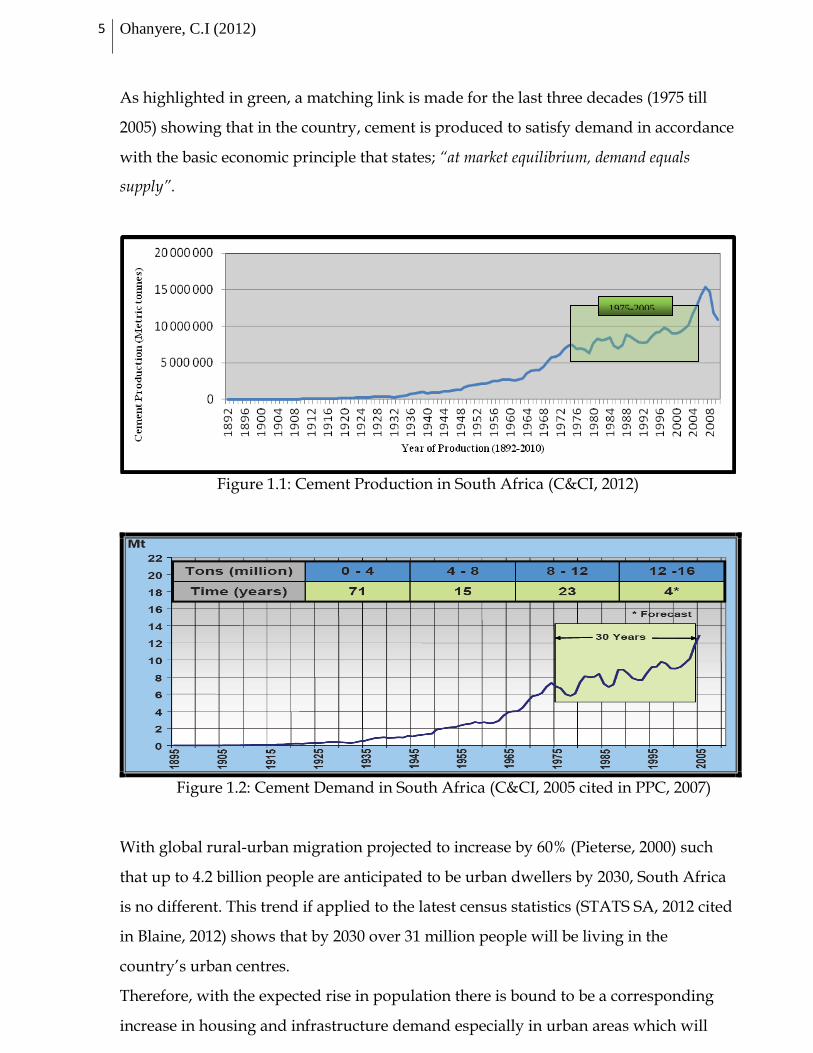
Figure 1.1 shows a steady rise in cement production since 1892 while Figure 1.2 depicts
a similar rise in demand for cement in South Africa for the same period.
5 Ohanyere, C.I (2012)
As highlighted in green, a matching link is made for the last three decades (1975 till
2005) showing that in the country, cement is produced to satisfy demand in accordance
with the basic economic principle that states; “at market equilibrium, demand equals
supply”.
Figure 1.1: Cement Production in South Africa (C&CI, 2012)
Figure 1.2: Cement Demand in South Africa (C&CI, 2005 cited in PPC, 2007)
With global rural-urban migration projected to increase by 60% (Pieterse, 2000) such
that up to 4.2 billion people are anticipated to be urban dwellers by 2030, South Africa
is no different. This trend if applied to the latest census statistics (STATS SA, 2012 cited
in Blaine, 2012) shows that by 2030 over 31 million people will be living in the
country’s urban centres.
Therefore, with the expected rise in population there is bound to be a corresponding
increase in housing and infrastructure demand especially in urban areas which will
1975-2005

Energy Efficiency and Environmental Performance of the SA Cement Industry 6
culminate in more cement production and importation to meet production deficits if
any. For example, as represented in Figure 1.3, the South African Presidential
Infrastructure Coordinating Commission (PICC, 2012), illustrated the forecasted
growth in the economy based on current infrastructure thus vividly expressing the
potential for future investment in infrastructure development. In this Figure, the
change in Gross Value Added (GVA1) for 2010 and 2020 are shown thus indicating
where growth is most likely to occur in the country with increase in forecast growth
ranging from white (expected increase ranging from 1 % to 1.5 %) to dark brown
(expected increase ranging from 1.5 % -1.8%) as shown in the legend. This depicts the
essential role cement plays in development.
Figure 1.3: Projected economic and infrastructure growth in SA (PICC, 2012)
1.2.2 Cement as a Development Imperative.
1 GVA is a macroeconomic indicator which measures the total value added as a result of a production process –
which includes the value of production of the total goods and services made excluding those consumed during
production within an area and over a time period (Cadillo, 2012)
7 Ohanyere, C.I (2012)
Cement is an important ingredient for development because it is a basic component of
concrete which is mainly used for construction of structures and infrastructure. South
Africa like many other developing countries is grappling with meeting its millennium
development goals, most notably in the provision of the basic human needs of its
people – shelter. As a leading emerging economy, South Africa’s demand for cement is
rising appreciably with a very optimistic forecast cement sales ranging from 18 to 28
million metric tonnes within the next decade (PPC, 2007). Though now, these figures
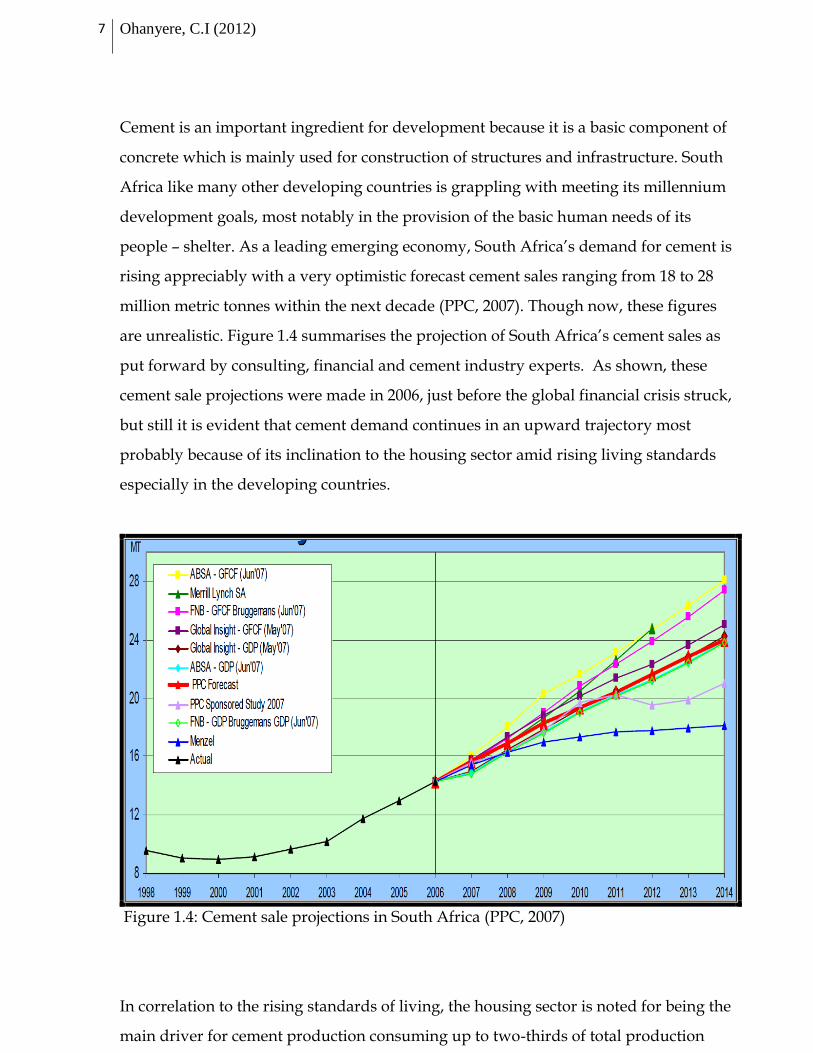
are unrealistic. Figure 1.4 summarises the projection of South Africa’s cement sales as
put forward by consulting, financial and cement industry experts. As shown, these
cement sale projections were made in 2006, just before the global financial crisis struck,
but still it is evident that cement demand continues in an upward trajectory most
probably because of its inclination to the housing sector amid rising living standards
especially in the developing countries.
Figure 1.4: Cement sale projections in South Africa (PPC, 2007)
In correlation to the rising standards of living, the housing sector is noted for being the
main driver for cement production consuming up to two-thirds of total production
Energy Efficiency and Environmental Performance of the SA Cement Industry 8
while the combination of the infrastructure, commercial, institutional and industrial
sectors make up the remaining one-third (EARPL, 2012). Consequently, South Africa’s
infrastructure backlog has been evaluated at R 3.5 trillion (Abedian, 2012) with low
cost housing said to be responsible for the highest demand of cement manufacture
(PPC, 2007). This is so because the country has a backlog of about 2.1 million housing
units (Sexwale, 2011 cited in Sowetan, 2011).
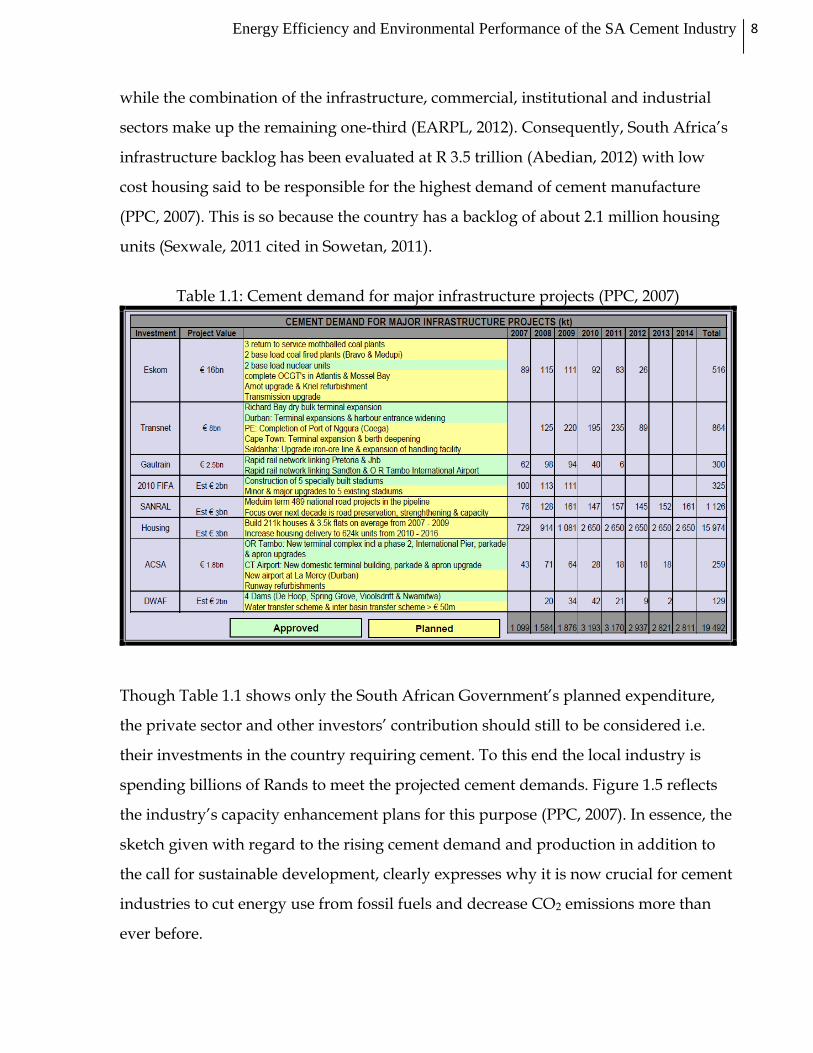
Table 1.1: Cement demand for major infrastructure projects (PPC, 2007)
Though Table 1.1 shows only the South African Government’s planned expenditure,
the private sector and other investors’ contribution should still to be considered i.e.
their investments in the country requiring cement. To this end the local industry is
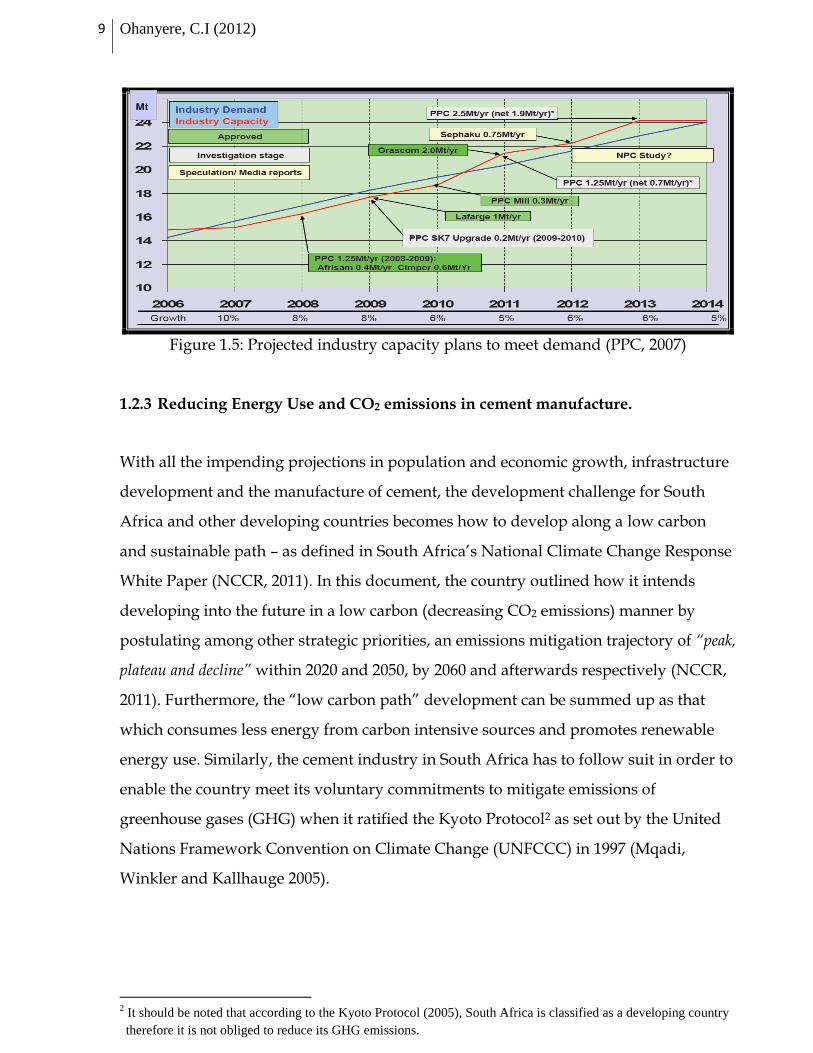
spending billions of Rands to meet the projected cement demands. Figure 1.5 reflects
the industry’s capacity enhancement plans for this purpose (PPC, 2007). In essence, the
sketch given with regard to the rising cement demand and production in addition to
the call for sustainable development, clearly expresses why it is now crucial for cement
industries to cut energy use from fossil fuels and decrease CO2 emissions more than
ever before.
9 Ohanyere, C.I (2012)
Figure 1.5: Projected industry capacity plans to meet demand (PPC, 2007)
1.2.3 Reducing Energy Use and CO2 emissions in cement manufacture.
With all the impending projections in population and economic growth, infrastructure
development and the manufacture of cement, the development challenge for South
Africa and other developing countries becomes how to develop along a low carbon
and sustainable path – as defined in South Africa’s National Climate Change Response
White Paper (NCCR, 2011). In this document, the country outlined how it intends
developing into the future in a low carbon (decreasing CO2 emissions) manner by
postulating among other strategic priorities, an emissions mitigation trajectory of “peak,
plateau and decline” within 2020 and 2050, by 2060 and afterwards respectively (NCCR,
2011). Furthermore, the “low carbon path” development can be summed up as that
which consumes less energy from carbon intensive sources and promotes renewable
energy use. Similarly, the cement industry in South Africa has to follow suit in order to
enable the country meet its voluntary commitments to mitigate emissions of
greenhouse gases (GHG) when it ratified the Kyoto Protocol2 as set out by the United
Nations Framework Convention on Climate Change (UNFCCC) in 1997 (Mqadi,
Winkler and Kallhauge 2005).
2 It should be noted that according to the Kyoto Protocol (2005), South Africa is classified as a developing country
therefore it is not obliged to reduce its GHG emissions.
Mt
Energy Efficiency and Environmental Performance of the SA Cement Industry 10
To this end, given that sustainable development and climate change have swiftly
become key challenges for most societies – especially in developing countries, the
country’s cement industry has risen to the challenge by continuously improving its
processes and its member companies are now being lauded for their environmental
and social successes. For instance, as far back as 1999 Lafarge, Cimpor and Holcim
(three of the major global cement manufacturers with major stakes in the South African
cement industry), met with the WBCSD for a 20 year appraisal structuring the concerns
around sustainable development that the cement industry faces worldwide (WBCSD,
2002). This meeting which is proving socially and environmentally successful so far,
catalysed the global cement industry into carrying out its operations with due
diligence, hinged on climate change and sustainable development. But one may argue
that the meeting arose because the companies recognized the fact that to sustain their
operations for the long term and reap the fruits of the economic opportunities that the
challenges may present, they had to mainstream these issues with their business
strategies. Whichever way the arguement goes, the threat of anthropogenic emissions
exacerbating global warming and thus instigating climate change remains one not to
be discounted.
According to Winkler and Marquard (2009), South Africa has since antiquity been one
of the most energy intensive countries in the world. This coupled with the apartheid
legacy has resulted in the country facing numerous development challenges (Scott,
2003). In summary, this dissertation contextualises the challenge of the South African
cement industry – in accordance with Winkler and Marquard – as that which aims to
achieve the country’s development objectives in alignment with its climate change
perspectives.
11 Ohanyere, C.I (2012)
1.3 RESEARCH OVERVIEW
1.3.1 Problem Statement
This dissertation defines the research problem from two perspectives namely;
South Africa, among the top 20 global CO2 emitters,
South Africa being highly dependent (up to 98 %) on fossil fuel energy.
1.3.1.1 South Africa: A main contributor of CO2 emissions.
According to Worrell, et al., (2001) and WWF, (2008), the global cement industry
contributes between five and eight percent of all anthropogenic CO2 emissions. For
South Africa, Mwakasonda (2012) showed that the country contributed about 1.44 %
carbon dioxide equivalent globally (CO2e3), while contributing as much as 40 % to 60 %
of the entire CO2e emissions from Sub Saharan in 2009. With its local economy driven
by coal, South Africa’s CO2 emissions from fossil fuel combustion has multiplied
almost seven times since 1950 with up to 93 % of emissions from coal alone (Boden et
al., 2011).
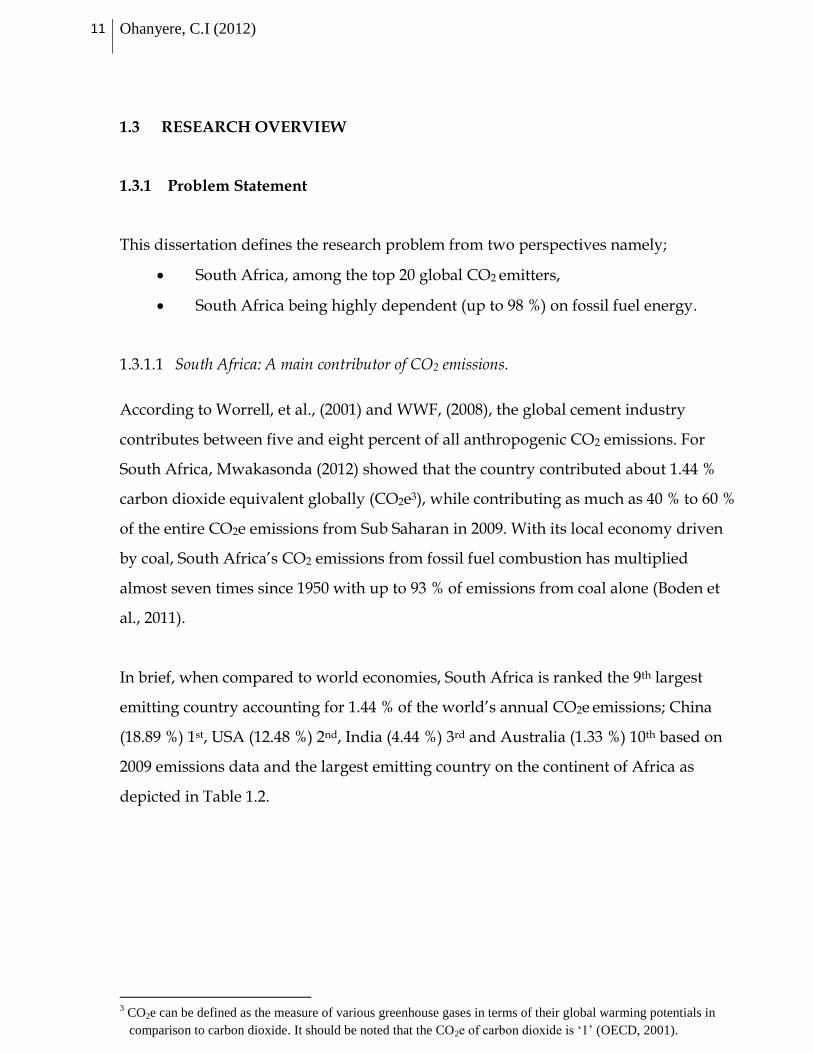
In brief, when compared to world economies, South Africa is ranked the 9th largest
emitting country accounting for 1.44 % of the world’s annual CO2e emissions; China
(18.89 %) 1st, USA (12.48 %) 2nd, India (4.44 %) 3rd and Australia (1.33 %) 10th based on
2009 emissions data and the largest emitting country on the continent of Africa as
depicted in Table 1.2.
3 CO2e can be defined as the measure of various greenhouse gases in terms of their global warming potentials in
comparison to carbon dioxide. It should be noted that the CO2e of carbon dioxide is ‘1’ (OECD, 2001).
Energy Efficiency and Environmental Performance of the SA Cement Industry 12
Table 1.2: Top 20 global greenhouse gas emitting countries (Mwakasonda, 2012)
Rank Country 2009 CO2e Gt % Global Total
1 China 8.50 18.89
2 United States 5.60 12.48
3 India 2.00 4.44
4 Russian Federation 1.50 3.28
5 Japan 1.10 2.53
6 Brazil 1.01 2.23
7 Germany 0.94 2.08
8 Canada 0.68 1.51
9 South Africa 0.65 1.44
10 Australia 0.60 1.33
11 United Kingdom 0.57 1.26
12 France 0.46 1.02
13 Italy 0.40 0.88
14 Ukraine 0.36 0.79
15 Poland 0.35 0.77
16 Spain 0.34 0.76
17 Turkey 0.29 0.64
18 Netherlands 0.20 0.45
19 Czech Republic 0.13 0.28
20 Belgium 0.12 0.27
13 Ohanyere, C.I (2012)
1.3.1.2 South Africa: A major consumer of energy from fossil fuels.
Due to the physical abundance of the main raw materials, its requirement as a
construction material and its relative affordability (Worrell et al., 2001), cement is
effectively produced globally. Producing cement involves the emission of CO2 through
fossil fuel combustion (coal burning predominantly), and also through the de-
carbonation of limestone. According to the World Energy Council (1995), cement
production is a highly energy-intensive production type and global cement industries
consume an estimate of about 2 % of the global primary energy consumption, or
approximately 5 % of the total global industrial energy consumption. Mainly using
coal – a carbon intensive fuel – in the manufacture of clinker, South Africa is heavily
dependent on burning of fossil fuels to meet its energy needs (Winkler and Marquard
2009). Therefore, the cement industry in South Africa can be seen as a major consumer
of energy from fossil fuels.
In addition to the emission output from fossil fuel combustion which can be
environmentally unsafe, Klee (2002) put forward that the other sustainability concerns
are noise, dust, other pollutant emissions (NOx, SOx etc.) and major land disturbance
e.g. during blasting and quarrying. However, as the 76th country to ratify the Kyoto
protocol, South Africa is steadfast in its efforts to meet its commitment to GHG
reduction evident in the country’s ‘peak, plateau, decline’ approach as stipulated in the
2009 government’s climate change response strategy even though it is not mandated to
do so (NCCR, 2011).
Therefore, this dissertation expresses the problem statement as: How does a carbon
intensive economy like South Africa develop along a low carbon path? This illustrates why it
is worthwhile to review the energy efficiency and environmental performance of the
South African cement industry (Cahn, et al., 1997; Canada Portland Cement
Association, 1997 and Cembureau, 1998).

Energy Efficiency and Environmental Performance of the SA Cement Industry 14
1.3.2 Research Rationale
The justification for this research is founded on the following;
The projected growth of cement manufacture globally,
The corresponding anticipated increase in cement related emissions under the
“Business As Usual” scenario.
1.3.2.1 Global Projected Cement Growth
The global production of cement in 2050 is projected to grow to 5.5 Gt worldwide
(WWF, 2008) i.e. a level roughly six times higher than its level in 1980 (USGS, 2010).
With China and India leading the way, Figure 1.6 shows the world’s anticipated
production figures till 2050.
As at 2008 – the time of the WWF report, world cement production was estimated at
2.8 Gt (USGS, 2009) but increased to 3.2 Gt in 2011 (USGS, 2012). Projections in cement
growth have been linked with projections in population growth. But for the cement
industry to balance the expected rises it needs to do so in a manner that facilitates
lowering CO2 emissions from its processes. The next subsection will define this path as
the “mitigation path”.
Figure 1.6: Projected cement production in industrialized & developing countries
(WWF, 2008)
15 Ohanyere, C.I (2012)
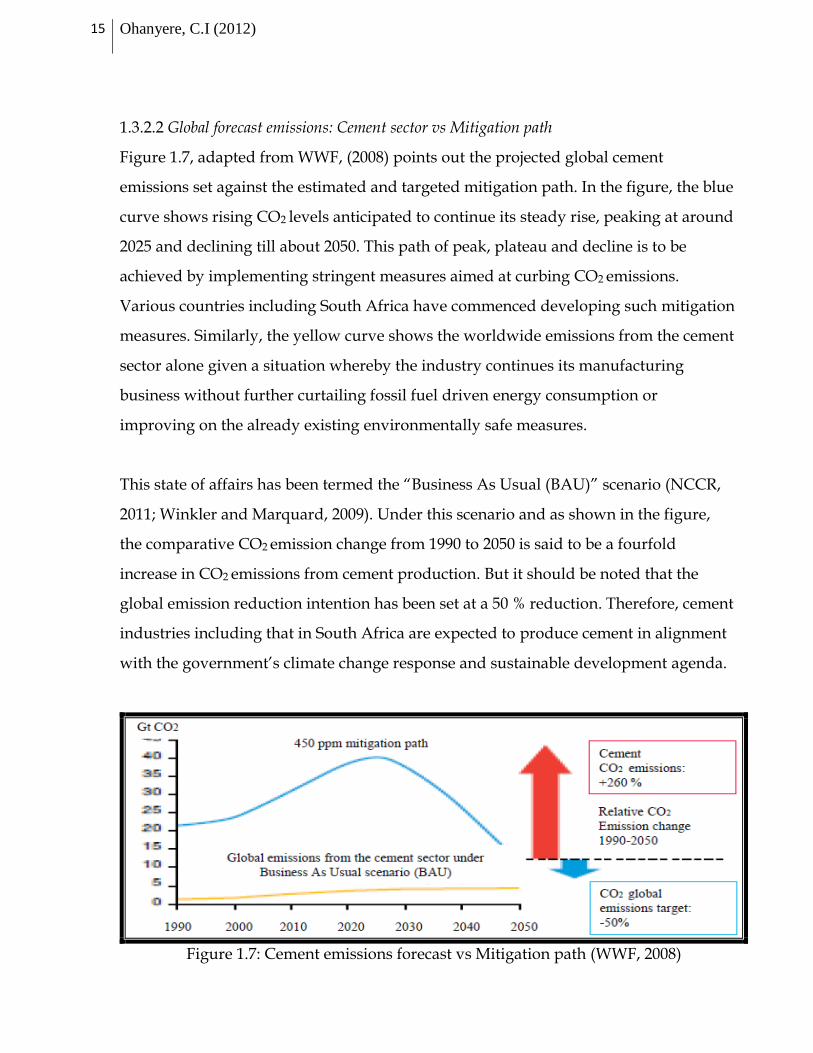
1.3.2.2 Global forecast emissions: Cement sector vs Mitigation path
Figure 1.7, adapted from WWF, (2008) points out the projected global cement
emissions set against the estimated and targeted mitigation path. In the figure, the blue
curve shows rising CO2 levels anticipated to continue its steady rise, peaking at around
2025 and declining till about 2050. This path of peak, plateau and decline is to be
achieved by implementing stringent measures aimed at curbing CO2 emissions.
Various countries including South Africa have commenced developing such mitigation
measures. Similarly, the yellow curve shows the worldwide emissions from the cement
sector alone given a situation whereby the industry continues its manufacturing
business without further curtailing fossil fuel driven energy consumption or
improving on the already existing environmentally safe measures.
This state of affairs has been termed the “Business As Usual (BAU)” scenario (NCCR,
2011; Winkler and Marquard, 2009). Under this scenario and as shown in the figure,
the comparative CO2 emission change from 1990 to 2050 is said to be a fourfold
increase in CO2 emissions from cement production. But it should be noted that the
global emission reduction intention has been set at a 50 % reduction. Therefore, cement
industries including that in South Africa are expected to produce cement in alignment
with the government’s climate change response and sustainable development agenda.
Figure 1.7: Cement emissions forecast vs Mitigation path (WWF, 2008)
Energy Efficiency and Environmental Performance of the SA Cement Industry 16
In short, the projection of cement manufacture, CO2 emissions forecast for the same
period and the uncertainties surrounding the impacts of global warming and climate
change are some of the factors serving as the rationalization for this research. Also they
are the issues which were considered by the cement industry worldwide to consent to
the call for the implementation of GHG mitigation efforts. Indeed, to its credit, the
global industry has to a great extent evolved in this direction with the industry in
South Africa following suit.
1.4 RESEARCH QUESTION
This dissertation seeks to analyse the South African cement industry’s energy
efficiency and environmental performance by answering the question:
How does the South African cement industry compare to others in terms of its energy
use and CO2 emissions in cement manufacturing?
But in doing so, the following sub questions need to be answered: 1. What is the status quo of the South African cement industry?
a. What is Portland cement, its components and properties?
b. How did the industry come to be and who are the major players?
c. Where does the country’s cement industry generally rank on a global
scale?
d. What is the country and industry’s perception of climate change and
sustainable development?
2. How does the South African cement industry manage energy efficiency and CO2
emissions during cement production?
a. What is Energy Efficiency?
b. How does the industry use and manage Energy (Thermal and Electrical)
as well as CO2 emissions?
c. What technology is used in the industry and how does it affect energy
use and CO2 emissions?
17 Ohanyere, C.I (2012)
1.5 RESEARCH AIMS AND OBJECTIVES
1.5.1 Broad Aim
In answering the research question, the broad aim of this dissertation is to form a 30
year review indicating energy use and carbon dioxide (CO2) emissions management of
the South African cement industry.
1.5.2 Objectives
Given the rationale behind the research and the broad aim, the goal of this study is to
answer the research question within the following contexts:
Determine how the South African cement industry compares to others.
Evaluate the level of energy efficiency practised in the country’s cement industry
Establish how the industry compares to others in terms of CO2 emissions per ton
of cement produced.
To attain these objectives, the following steps will be followed:
Extract relevant data/information from the websites and publications of
the four major cement manufacturers in South Africa, the Cement and
Concrete Institute of South Africa (C&CI) and the Association of
Cementitious Material Producers of South Africa (ACMP).
Extract pertinent data/information from journals, articles, periodicals
and so on of some of the other major cement producing countries in the
world.
Analyse and synthesise the extracted data/information to ascertain gaps
(if any) before determining the country’s status quo measured against
others.
1.6 RESEARCH SCOPE AND LIMITATION
Energy Efficiency and Environmental Performance of the SA Cement Industry 18
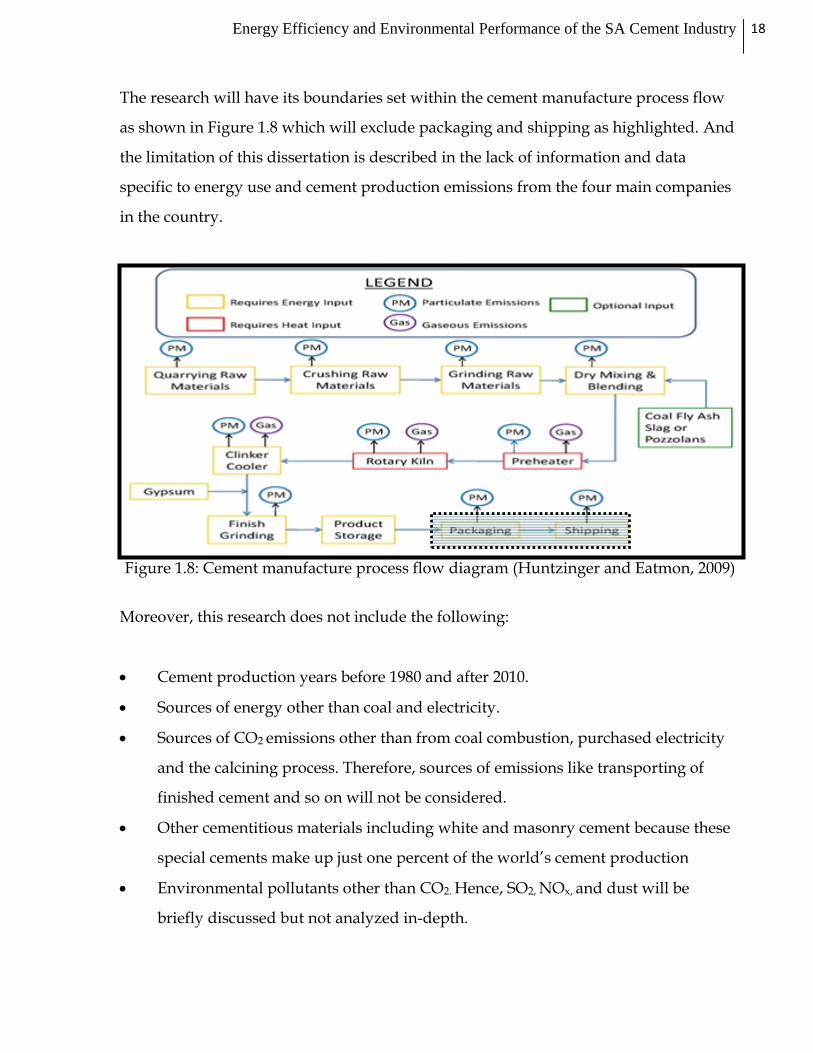
The research will have its boundaries set within the cement manufacture process flow
as shown in Figure 1.8 which will exclude packaging and shipping as highlighted. And
the limitation of this dissertation is described in the lack of information and data
specific to energy use and cement production emissions from the four main companies
in the country.
Figure 1.8: Cement manufacture process flow diagram (Huntzinger and Eatmon, 2009)
Moreover, this research does not include the following:
Cement production years before 1980 and after 2010.
Sources of energy other than coal and electricity.
Sources of CO2 emissions other than from coal combustion, purchased electricity
and the calcining process. Therefore, sources of emissions like transporting of
finished cement and so on will not be considered.
Other cementitious materials including white and masonry cement because these
special cements make up just one percent of the world’s cement production
Environmental pollutants other than CO2. Hence, SO2, NOx, and dust will be
briefly discussed but not analyzed in-depth.
19 Ohanyere, C.I (2012)
1.7 DISSERTATION LAYOUT
The research focuses on three main themes namely; the South African cement industry,
energy efficiency and environmental performance with respect to CO2 as a GHG
emission. Therefore, the organization of the report will be such that:
Chapter 1 delivers the introduction and background to the dissertation.
Chapter 2 discusses the literature review which comprises data and information
from various literature, books, journals, articles, electronic sources and so on. This
chapter is split into two sections to properly account for the two themes of this
dissertation.
The method employed and the research limitations are detailed in Chapter 3.
Chapter 4 contains the findings and analysis.
As a denouement, Chapter 5 will present the conclusion and recommendations.
2.0 LITERATURE REVIEW
Energy Efficiency and Environmental Performance of the SA Cement Industry 20
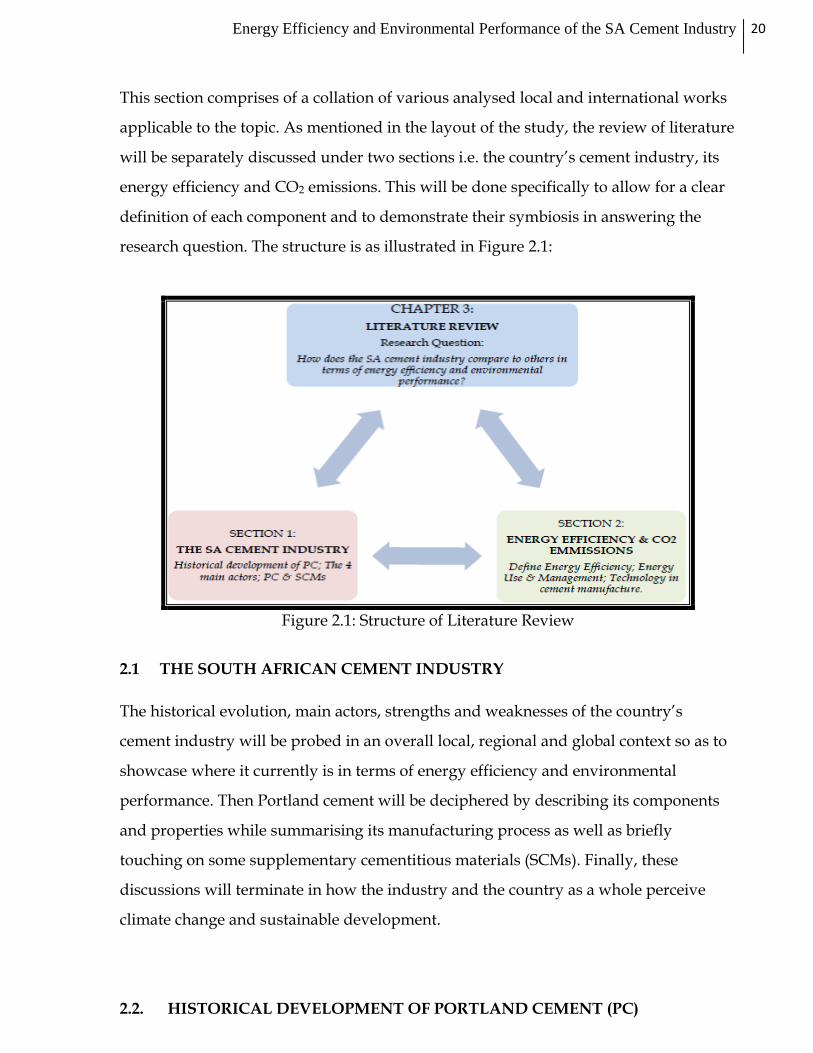
This section comprises of a collation of various analysed local and international works
applicable to the topic. As mentioned in the layout of the study, the review of literature
will be separately discussed under two sections i.e. the country’s cement industry, its
energy efficiency and CO2 emissions. This will be done specifically to allow for a clear
definition of each component and to demonstrate their symbiosis in answering the
research question. The structure is as illustrated in Figure 2.1:
Figure 2.1: Structure of Literature Review
2.1 THE SOUTH AFRICAN CEMENT INDUSTRY
The historical evolution, main actors, strengths and weaknesses of the country’s
cement industry will be probed in an overall local, regional and global context so as to
showcase where it currently is in terms of energy efficiency and environmental
performance. Then Portland cement will be deciphered by describing its components
and properties while summarising its manufacturing process as well as briefly
touching on some supplementary cementitious materials (SCMs). Finally, these
discussions will terminate in how the industry and the country as a whole perceive
climate change and sustainable development.
2.2. HISTORICAL DEVELOPMENT OF PORTLAND CEMENT (PC)
21 Ohanyere, C.I (2012)
Cement has been used in construction ever since civilization started to build. Buckley
(2001) finds that the Assyrians and Babylonians put up structures with a clayey
material. Moreover, as far back as 12 000 BC it was recorded that naturally occurring
cement complexes were formed in Israel as a result of unprompted combustion of
shale and limestone (Auburn University, 2012). In addition to combining mud and
straw to hold dried brick together and utilizing cemetitious materials to stick bamboo
in their boats, it was recorded that in 3 000 BC binding agents such as gypsum and
lime were further discovered and mixed with this building materials, and then used in
constructions such as the great pyramids built by the Egyptians (Buckley, 2001;
Auburn University, 2012). The Greeks furthered the discoveries and applications made
by the Egyptians before the Romans eventually developed a binder that was used for
constructions of high resilience – such as the great Roman baths (27 BC), the Coliseum
and the Constantine Basilica (Buckley, 2001). To achieve these, they made use of slaked
lime (a volcanic ash called “Pozzuolana”, derived from the eruptions of Mount
Vesuvius near Naples, Italy) as a cementitious material. Similarly, Buckley (2001)
found that work done by Pliny and Vitruvius (AD 79) suggested that the cementitious
mortar used historically comprised of 20 % lime and 80 % sand or 33 % lime and 66 %
pozzolana.
2.3 HISTORY OF PORTLAND CEMENT IN SOUTH AFRICA
From 1892 when the first Portland cement was produced (PPC, 2011; C&CI, 2012) till
2010, almost 419 million tonnes of cemntitious materials have been sold with 65 % of
this figure recorded for sales between 1980 and 2010 (C&CI, 2012). Using these figures,
a calculated average of nearly 14 million tonnes per annum for the last 30 years can be
deduced, thus representing a high figure for just one country. Figure 2.2 (C&CI, 2012)
shows the regional cementitious sales profile since 1892 with the lowest cementitious
materials’ sales figure recorded as 1 360 tonnes for the year 1892 and the highest sales
figure recorded as over 15.3 million metric tonnes for the year 2007.
Given the timing, the high figure recorded in 2007 can be linked mainly to the
construction of stadiums for the 2010 soccer world cup, the Gautrain Rapid Rail Link
project and Eskom’s Kusile and Medupi power station projects. This therefore shows

Energy Efficiency and Environmental Performance of the SA Cement Industry 22
the importance of the cement sector to South Africa and for return on investments as
well.
Figure 2.2: Regional cement sales history 1892 - 2010 (C&CI, 2012)
Still, the history of Portland cement manufacture and sales in South Africa has been
impaired by claims of a century old collusion, price fixing and “cartel” like modus
operandi which were said to be pervasive from the 20th century until the early part of
the 21st century (IOL, 2012). Accordingly, Fourie and Smith, (1994) with Walker,
(2006), acknowledged this when they suggested that before 1996, the cement industry
in South Africa functioned formally within a recognized cartel.
As a result, the present state of the industry may arguably be attributed to the fine of
nearly R 275 million imposed by the South African Competition Commission on two of
the four major cement producers in the country – Larfarge SA and AfriSam – for
historical collusion relating to market sharing and price fixing. However, for the other
two, PPC was exempted given its cooperation and information disclosure while NPC-
Cimpor has till date not reached an agreement (IOL, 2012).
Nonetheless, the regulation of cement has since 1999 become the task of the South
African National Standard (SANS) – through a mandatory requirement; to do away
with cement products without the ‘SANS’ seal of approval (Mining Weekly, 2006).
23 Ohanyere, C.I (2012)
These in any case highlight the importance of manufacturing cement both for
development and as a contribution to GDP.
2.3.1 History of Portland cement in South Africa: The Four Main Actors
This dissertation focuses on the four major companies that produce and sell cement in
South Africa namely; Pretoria Portland Cement (PPC), Lafarge, AfriSam and Natal
Portland cement – CIMPOR.
2.3.1.1 Pretoria Portland Cement (PPC)
PPC is the first cement company established in South Africa and it has been in
existence since 1892. According to PPC (2011), the set up of the company was born out
of the need to find a cheaper solution to the costly cement import costs from Europe
experienced in the late 19th century. With eight cement production factories and three
milling depots in the South African region, PPC has the capability to produce 8 million
tonnes of cement annually; thus making it the foremost supplier of cement in the
region – comprising of South Africa, Botswana and Zimbabwe (PPC, 2011).
Drawing up a timeline for PPC it is seen that after operations began in 1892, the
company started producing Lime in the then Northern Transvaal in 1907. After 18
years of cement and lime manufacture, PPC got listed on the Johanessburg Stock
Exchange (JSE) in 1910. The success of this listing and the production operations in
addition to the local market demands encouraged PPC to build a new Slurry factory in
the North West province of South Africa which started manufacturing cement in 1916.
From 1921 till 1998 the company grew and expanded its operations around the country
and its environs by opening facilities in De Hoek (1921), Port Elizabeth (1927),
Germiston (1937), Orkney (1949), Riebeek (1960), Gaborone, Botswana (1994) and in
Dwaalboom (1998).
Furthermore, in 1958, PPC converted from the wet slurry process of cement
manufacture to the dry mix process of cement manufacture which increased their
production efficiency and cost effectiveness (PPC, 2011). Listed among the top 40
Energy Efficiency and Environmental Performance of the SA Cement Industry 24
companies on the JSE and included in Financial Times and Stock Exchange (FTSE)
index in 2003, PPC gained independence from Barloworld in 2007.
2.3.1.2 Lafarge
Lafarge has its origins traced to an English company called White’s South African
Cement Company, established in England in 1913. Trading as Blue Circle in the United
Kingdom had since 1914 been offering the South African construction industry services
and novel products. That same year, it commenced cement works at Hennenman in the
then Orange Free State – historically heralding what is now called the Free State
province (Lafarge, 2010). Furthermore, as previously shown, growth in
industrialization most often times lead to increase in cement demand. This analogy
encouraged Blue Circle South Africa to expand its cement works and according to
Lafarge (2010), the Lichtenburg facility (based in the North West province) was born in
1948. Half a century after the inception of the Lichtenburg plant, Lafarge bought over
Blue Cicle South Africa, renamed and rebranded it to suit the BEE requirements of the
South African government. Hence, Lafarge Industries South Africa (Pty) Limited was
created in 1998. Functioning through four business units; Lafarge Concrete, Aggragate,
Gypsum and Cement, the company employs 2 740 staff and is capable of
manufacturing 3 million tonnes of cement annually (Lafarge, 2010).
2.3.1.3 AfriSam
In 1934, Anglo Alpha cement Limited was formed in South Africa. After operating for
over six decades the company changed its name to Alpha (Pty) Limited and shuffled
its management hierarchy in 1996 in order to support the Black Economic
Empowerments’ (BEE) legislative policy enacted in 1994. Trading for a further 13 years,
Holcim, South Africa (the parent company of Alpha (Pty) Limited) formed AfriSam in
2007 (Holcim, 2013). With operations locally, in Lesotho, Swaziland and Botswana,
AfriSam has more than 2 000 staff and employs up to 1 000 contractors.
The company has six manufacturing facilities, nine cement depots, 16 yearly quarry
and aggregate operations all of which combine to enable the company have almost 4.6

25 Ohanyere, C.I (2012)
million tonnes of cement production capacity on an annual basis. For half a century,
AfriSam has been producing Slagment from its Vanderbijlpark operations thus making
it the leading provider of Slag as a cement extender in South Africa. The company
reportedly has the capacity to produce 800 000 tonnes of slag cement and 200 000
tonnes of blended cementitious materials per annum (AfriSam, 2010).
2.3.1.4 NPC - Cimpor
NPC-Cimpor’s roots can be traced back to 1964 when Durban Cement Limited began
operations in Bellair, in the KwaZulu Natal (KZN) province of South Africa. Two
decades later, the company transformed into Natal Portland Cement (NPC) in 1984
mainly due to its operations and expansions situated only in the Natal region of
Newcastle, Port Shepstone and Durban. Until 2002 when CIMPOR (Cimentos de
Portugal) took over NPC completely, it was run by Alpha PPC and Lafarge (NPC, 2010).
NPC-Cimpor ran for five years before being formed in full by incorporating a 26 %
BEE shareholding partnership to comply with South Africa’s empowerment policy
drive. Inclined to plugging the gap in cement shortage, NPC-Cimpor’s appetite for
expansion and efficiency saw the installation of South Africa’s latest kiln at its Simuma
facility (it is worth mentioning that the last kiln installed in the country prior to this
was over two decades old). The foremost cement producing company in KZN, NPC-
Cimpor possesses the capacity to manufacture 1.5 million tonnes of cement on an
annual basis and it employs over 500 permanent staff, 45 temporary staff and 30
interns (NPC, 2013).
Apart from these companies, the latest news from the industry suggests that another
company, Sephaku cement, is due to commence operations in December of 2013 and its
capacity has been projected to be 1.2 million tonnes of cement per year. Figure 3.2
shows the locations and total capacity estmates of the four main cement producing
companies in the country.
Adapted from (PPC, 2007), the capacity estimates have been updated making use of
the latest information and data as currently reported by the companies themselves.

Energy Efficiency and Environmental Performance of the SA Cement Industry 26
Figure 2.3: Overview of SA cement industry (PPC, 2007; updated by Ohanyere, 2012)
In brief, the four major cement producers have been discussed and put into perspective
in terms of their historical development and involvement in the South African cement
industry. For the purpose of this dissertation, the next section will explore what the
material “cement” consists of, other cementitious materials and how cement is
produced.
2.4 PORTLAND CEMENT (PC).
Cement is generally described as “glue”, binder or a binding material (Alexander and
Mindess, 2005; Grieve, 2009). Aïtcin and Mindess (2011), extends this definition by
referring to cement as “binder" which according to them are fine materials used in to
form concrete when hydrated. This so as to shorten, clarify and unlimit the ACI 1164
definition of cement because it contains 46 various definitions having “cement” and
“Portland cement” as entries.
Portland cement is a result of a chemical mixture including calcium, silicon, aluminium,
iron and other compunds. During its manufacture a regulated quantity of gypsum is
4 Refer to external link: http://www.prof-ce1.com/books/civil/116r_00.PDF for the ACI 116 definitions of cement
27 Ohanyere, C.I (2012)
added to aid in retarding the setting time of concrete (Rinker, 2010). After water,
concrete comprising of Portland cement is the material for construction that is mostly
used in the world. But on its own, Alexander and Mindess (2005) conclude that it is not
appropriate for almost any purpose; with the exception of some unique applications.
Also they alluded to the fact that PC is less frequently manufactured as a single blend
product but nowadays combined with other materials to form blended cements. In
addition, Aïtcin and Mindess (2011), suggest that in a concrete mix, the PC phase is
believed to be the basis on which binding occurs irrespective of the presence of other
materials in the mix such as cement extenders or supplementary cementitious
materials.
The terminology known as Portland cement was derived by Joseph Aspdin in 1824
who obtained a patent for his cement mixture. He used the term “Portland” because
the grey color of his final mix looked like the naturally occurring limestone mined from
the Isle of Portland along the English channel (Buckley, 1996-2001; Aitcin, 2011).
Various kinds of PC are produced to satisfy different needs and adapt to diverse
environments. The South African National Standards (SANS) 50197-1 lists the five
different types of cements; product notations and composition (Refer to appendix A)
2.4.1 Portland cement and Supplementary Cementitious Materials: Composition,
Types and Properties.
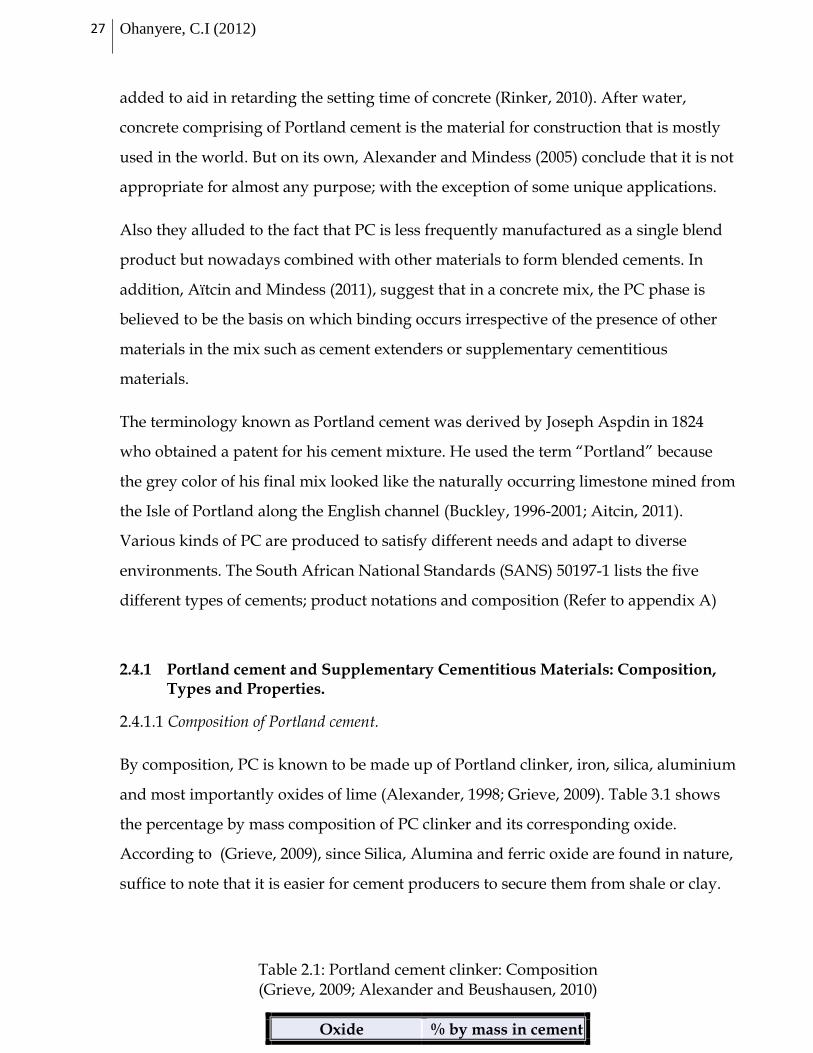
2.4.1.1 Composition of Portland cement.
By composition, PC is known to be made up of Portland clinker, iron, silica, aluminium
and most importantly oxides of lime (Alexander, 1998; Grieve, 2009). Table 3.1 shows
the percentage by mass composition of PC clinker and its corresponding oxide.
According to (Grieve, 2009), since Silica, Alumina and ferric oxide are found in nature,
suffice to note that it is easier for cement producers to secure them from shale or clay.
Table 2.1: Portland cement clinker: Composition (Grieve, 2009; Alexander and Beushausen, 2010)
Oxide % by mass in cement
Energy Efficiency and Environmental Performance of the SA Cement Industry 28
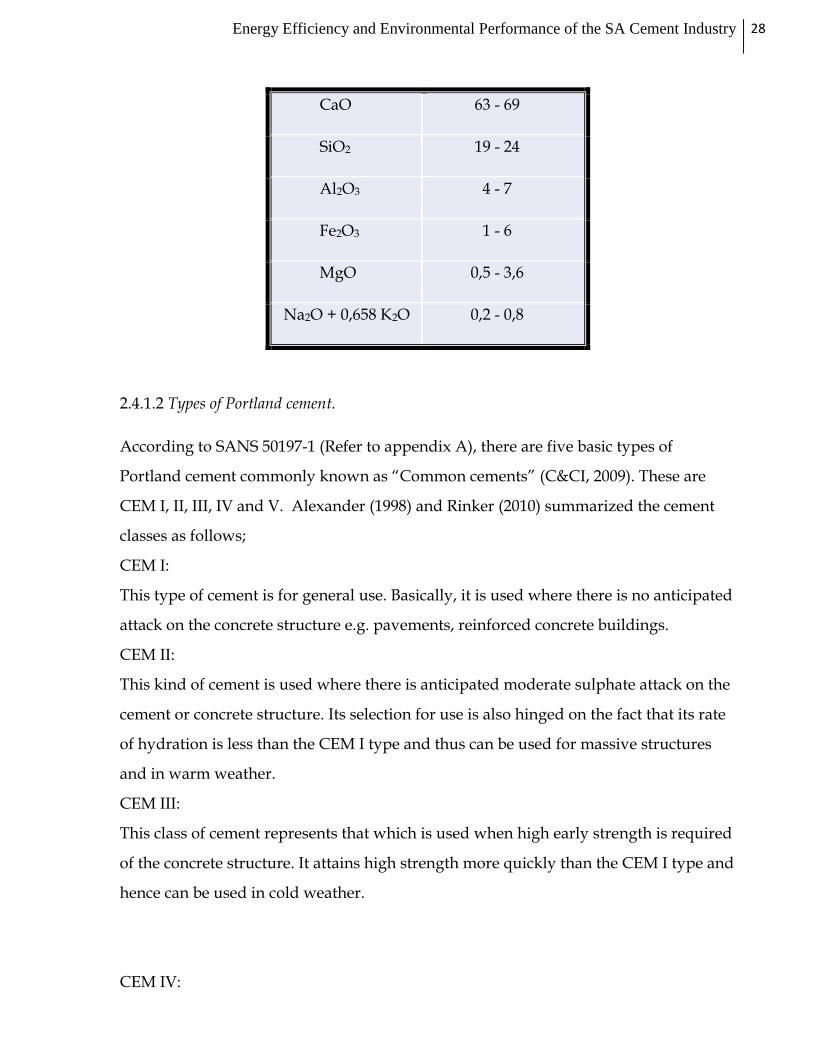
CaO 63 - 69
SiO2 19 - 24
Al2O3 4 - 7
Fe2O3 1 - 6
MgO 0,5 - 3,6
Na2O + 0,658 K2O 0,2 - 0,8
2.4.1.2 Types of Portland cement.
According to SANS 50197-1 (Refer to appendix A), there are five basic types of
Portland cement commonly known as “Common cements” (C&CI, 2009). These are
CEM I, II, III, IV and V. Alexander (1998) and Rinker (2010) summarized the cement
classes as follows;
CEM I:
This type of cement is for general use. Basically, it is used where there is no anticipated
attack on the concrete structure e.g. pavements, reinforced concrete buildings.
CEM II:
This kind of cement is used where there is anticipated moderate sulphate attack on the
cement or concrete structure. Its selection for use is also hinged on the fact that its rate
of hydration is less than the CEM I type and thus can be used for massive structures
and in warm weather.
CEM III:
This class of cement represents that which is used when high early strength is required
of the concrete structure. It attains high strength more quickly than the CEM I type and
hence can be used in cold weather.
CEM IV:
29 Ohanyere, C.I (2012)
This sort of cement refers to cement types which exhibit low heat of hydration. Their
rate of strength development is slower than CEM I. Therefore, they can be used for
massive concrete structures e.g. gravity dams.
CEM V:
This range characterizes high sulphate resisting cements used in concrete structures
where extreme sulphate attack is anticipated.
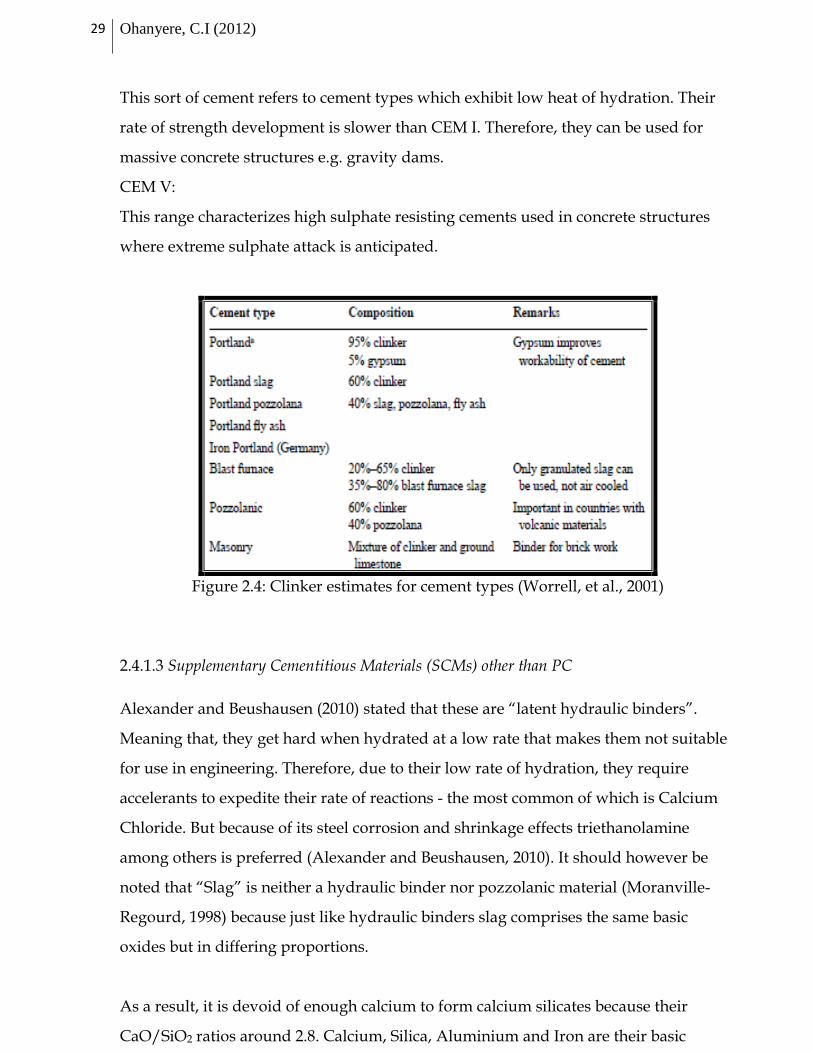
Figure 2.4: Clinker estimates for cement types (Worrell, et al., 2001)
2.4.1.3 Supplementary Cementitious Materials (SCMs) other than PC
Alexander and Beushausen (2010) stated that these are “latent hydraulic binders”.
Meaning that, they get hard when hydrated at a low rate that makes them not suitable
for use in engineering. Therefore, due to their low rate of hydration, they require
accelerants to expedite their rate of reactions - the most common of which is Calcium
Chloride. But because of its steel corrosion and shrinkage effects triethanolamine
among others is preferred (Alexander and Beushausen, 2010). It should however be
noted that “Slag” is neither a hydraulic binder nor pozzolanic material (Moranville-
Regourd, 1998) because just like hydraulic binders slag comprises the same basic
oxides but in differing proportions.
As a result, it is devoid of enough calcium to form calcium silicates because their
CaO/SiO2 ratios around 2.8. Calcium, Silica, Aluminium and Iron are their basic
Energy Efficiency and Environmental Performance of the SA Cement Industry 30
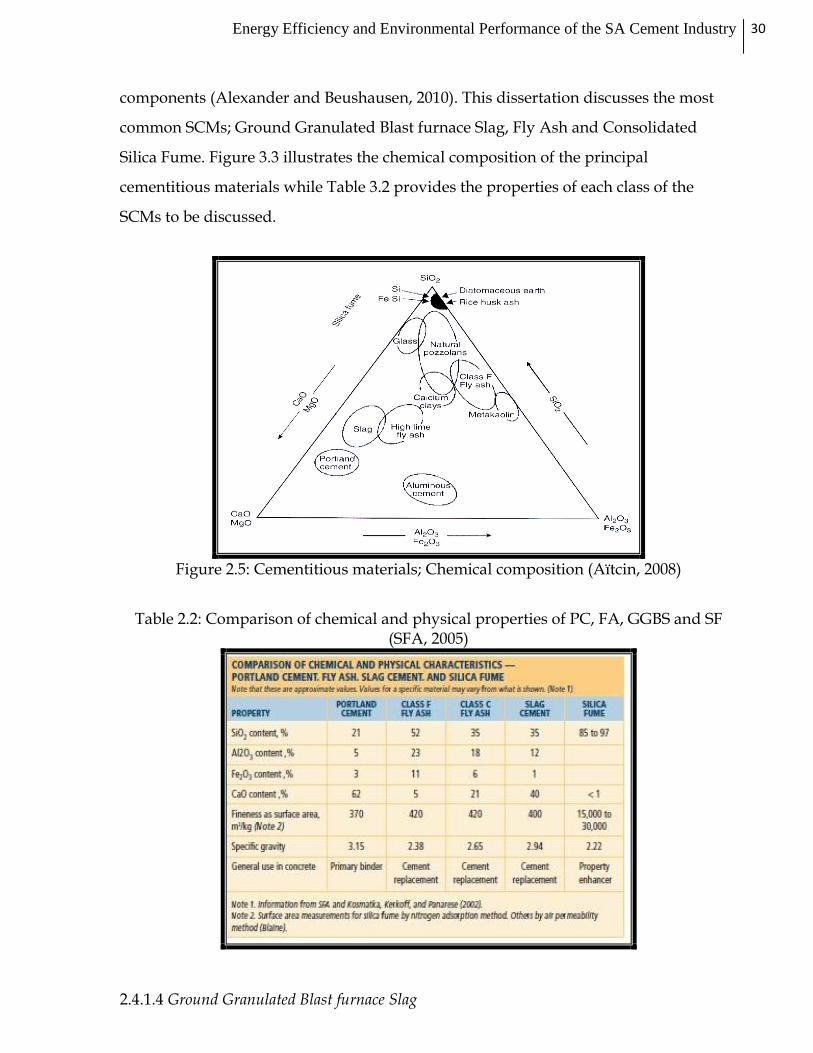
components (Alexander and Beushausen, 2010). This dissertation discusses the most
common SCMs; Ground Granulated Blast furnace Slag, Fly Ash and Consolidated
Silica Fume. Figure 3.3 illustrates the chemical composition of the principal
cementitious materials while Table 3.2 provides the properties of each class of the
SCMs to be discussed.
Figure 2.5: Cementitious materials; Chemical composition (Aïtcin, 2008)
Table 2.2: Comparison of chemical and physical properties of PC, FA, GGBS and SF
(SFA, 2005)
2.4.1.4 Ground Granulated Blast furnace Slag

31 Ohanyere, C.I (2012)
GGBS for short, its first use dates back to 1868 as a result of work done by E. Langen in
Germany (Papadakis, 1966). According to Mindess et al. (2011), it is a non-metallic
product consisting mainly of silicates and aluminosilicates of calcium and other bases,
collected at the bottom of the blast furnace as impurities during the production of pig
iron. It can either be quenched in water or air.
Figure 2.6: General schematic of blast furnace operation and slag production
(FHWA , 2012)
Aïtcin (2008) states that, Portland cement is a good catalyst for slag activation because
it contains lime, calcium sulphate and alkalis. In the Western Cape, South Africa, Corex
slag or GGCS as it is popularly known is the most common (Alexander and
Beushausen, 2010). Due to the non-detrimental dolomitic limestone used for fluxing,
the magnesia (MgO) content in GGBS found in the country is higher than that in other
countries (Grieve, 2009). The chemical reaction can be illustrated as;
3 (C + S) + 3H C3S2H3 + S ………………… (1)
(a x S) + (b x CH) + Other C3S2H3 + CA products ... (2)
In reaction (1), (C+S) denotes GGBS. In reaction (2), a and b are numbers with values
required for equilibrium; S is derived from reaction (1); CH is derived from the
hydration of Portland cement (Grieve, 2009).
Table 2.3: Chemical composition of South African GGBS (Grieve, 2009)
Oxide % by mass in cement
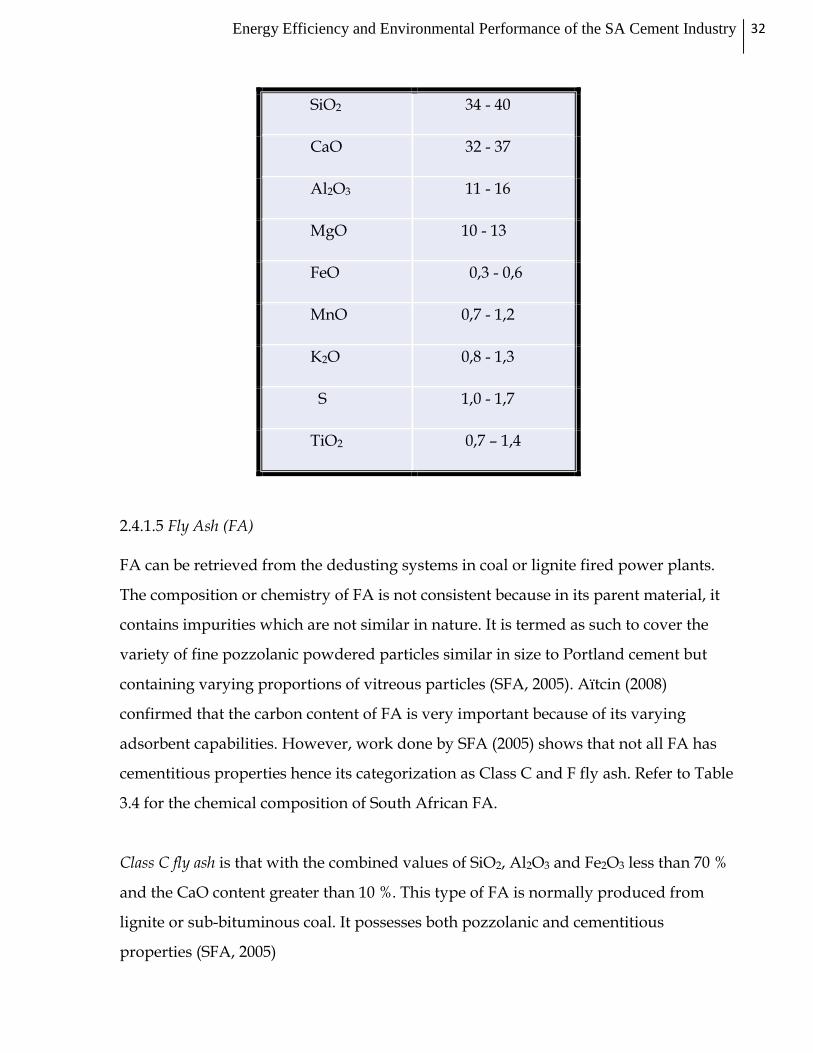
Energy Efficiency and Environmental Performance of the SA Cement Industry 32
SiO2 34 - 40
CaO 32 - 37
Al2O3 11 - 16
MgO 10 - 13
FeO 0,3 - 0,6
MnO 0,7 - 1,2
K2O 0,8 - 1,3
S 1,0 - 1,7
TiO2 0,7 – 1,4
2.4.1.5 Fly Ash (FA) FA can be retrieved from the dedusting systems in coal or lignite fired power plants.
The composition or chemistry of FA is not consistent because in its parent material, it
contains impurities which are not similar in nature. It is termed as such to cover the
variety of fine pozzolanic powdered particles similar in size to Portland cement but
containing varying proportions of vitreous particles (SFA, 2005). Aïtcin (2008)
confirmed that the carbon content of FA is very important because of its varying
adsorbent capabilities. However, work done by SFA (2005) shows that not all FA has
cementitious properties hence its categorization as Class C and F fly ash. Refer to Table
3.4 for the chemical composition of South African FA.
Class C fly ash is that with the combined values of SiO2, Al2O3 and Fe2O3 less than 70 %
and the CaO content greater than 10 %. This type of FA is normally produced from
lignite or sub-bituminous coal. It possesses both pozzolanic and cementitious
properties (SFA, 2005)
33 Ohanyere, C.I (2012)
Class F fly ash has a combined value of SiO2, Al2O3 and Fe2O3 greater than 70 %. It is
normally produced from anthracite or bituminous coal. This type of FA has pozzolanic
properties (SFA, 2005). South Africa only has Type F fly ash.
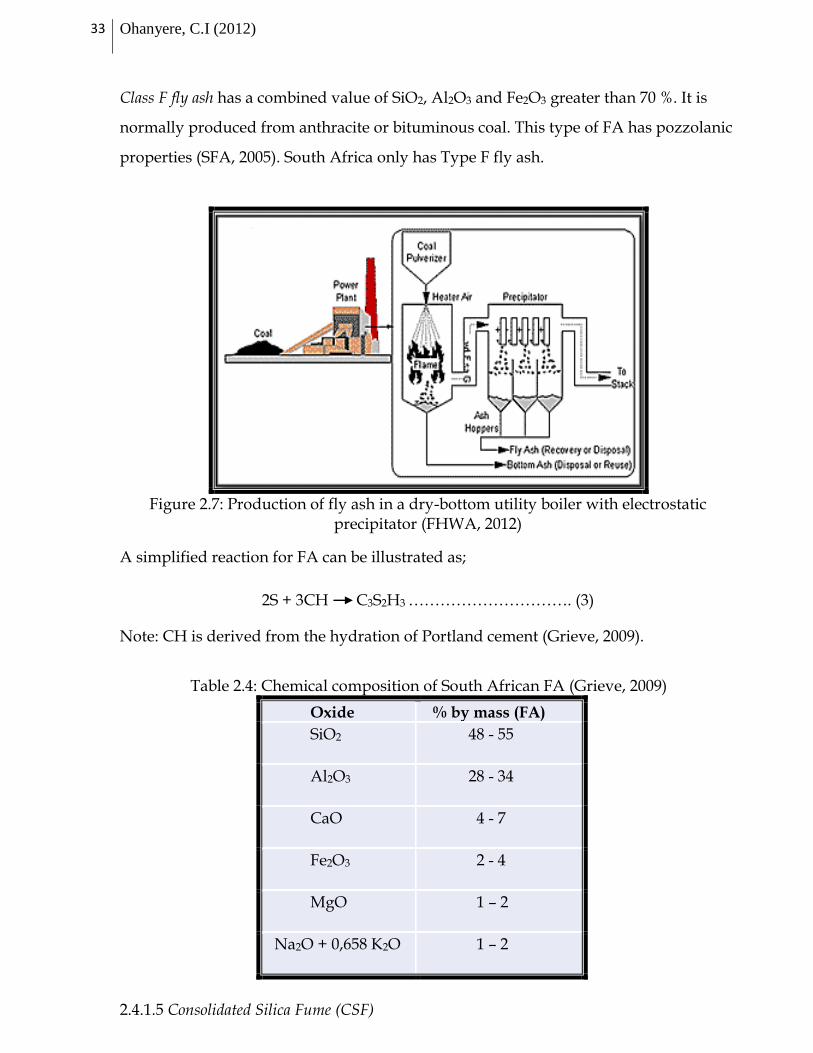
Figure 2.7: Production of fly ash in a dry-bottom utility boiler with electrostatic
precipitator (FHWA, 2012)
A simplified reaction for FA can be illustrated as;
2S + 3CH C3S2H3 …………………………. (3)
Note: CH is derived from the hydration of Portland cement (Grieve, 2009).
Table 2.4: Chemical composition of South African FA (Grieve, 2009)
Oxide % by mass (FA)
SiO2 48 - 55
Al2O3 28 - 34
CaO 4 - 7
Fe2O3 2 - 4
MgO 1 – 2
Na2O + 0,658 K2O 1 – 2
2.4.1.5 Consolidated Silica Fume (CSF)
Energy Efficiency and Environmental Performance of the SA Cement Industry 34
According to Aïtcin (2008), SF is the by-product of the fabrication of silicon metal,
ferrosilicon alloys or occasionally zirconium. He reports that, according to Fidjestøl and
Lewis (1998), silica fume is a hundred times finer than Portland cement particles. They
are very reactive fine pozzolans, possessing also filler effects (Bentur, 2002; Kosmatka
and Wlsion, 2011). Bentur further stated that adding SF into concrete reduces the
bleeding effect and alters the microstructure of the hydrated cement paste which looks
amorphous. This according to Regourd (1983), makes the transition zone (ITZ) around
the coarse aggregates more compact in comparison Portland cement.
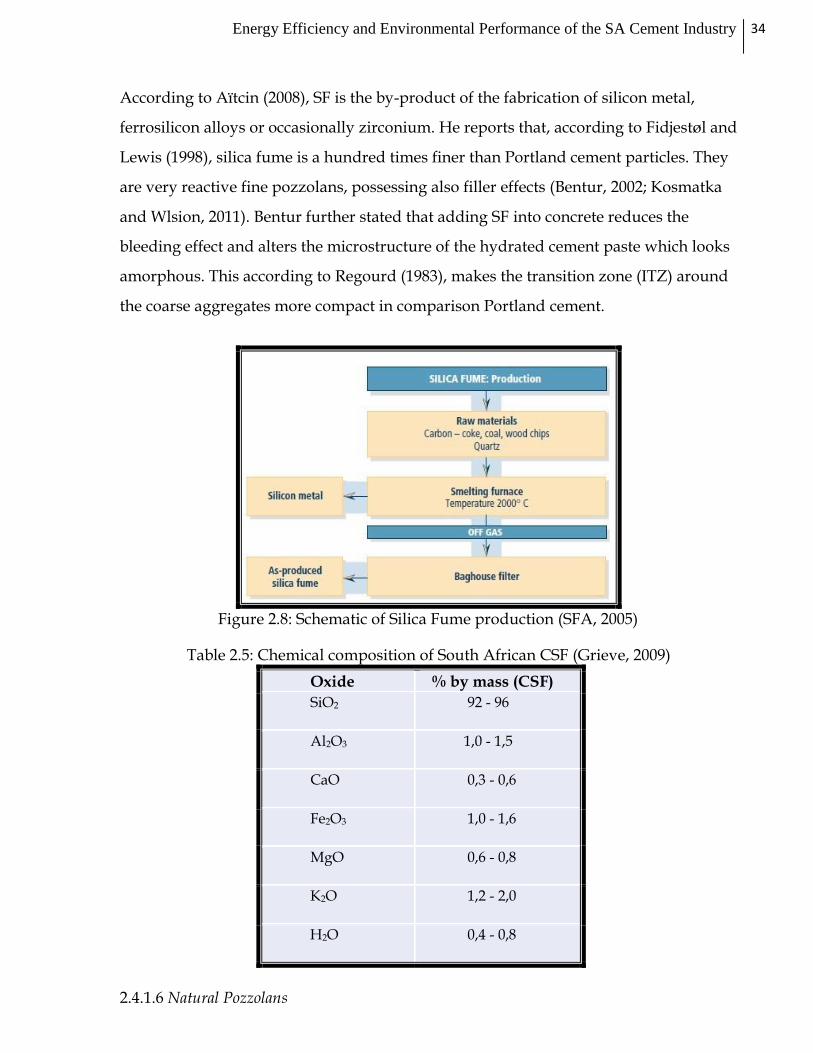
Figure 2.8: Schematic of Silica Fume production (SFA, 2005)
Table 2.5: Chemical composition of South African CSF (Grieve, 2009)
Oxide % by mass (CSF)
SiO2 92 - 96
Al2O3 1,0 - 1,5
CaO 0,3 - 0,6
Fe2O3 1,0 - 1,6
MgO 0,6 - 0,8
K2O 1,2 - 2,0
H2O 0,4 - 0,8
2.4.1.6 Natural Pozzolans
35 Ohanyere, C.I (2012)
Natural pozzolans have been used for centuries. As previously mentioned, the term
“pozzolan” comes from a volcanic ash mined at Pozzuoli, a village near Naples, Italy,
following the 79 AD eruption of Mount Vesuvius. However, the use of volcanic ash
and calcined clay dates back to 2 000 BC and earlier in other cultures (Buckley, 1996-
2001). In addition to controlling heat rise, natural pozzolans were used to improve
resistance to sulphate attack and were among the first materials to be found to mitigate
alkali-silica reaction. The most common natural pozzolans used today are processed
materials, which are heat treated in a kiln and then ground to a fine powder they
include calcined clay/shale, and metakaolin (Kosmatka and Wilson, 2011).
2.4.1.7 Calcined clays/shales Their use dates back to the Phoenician times (Buckley, 1996-2001; Auburn University,
2012). Calcination of up to 750˚C sees clays or shales dehydrate and loose its crystalline
structure. It should be noted that the addition of these materials to concrete increases
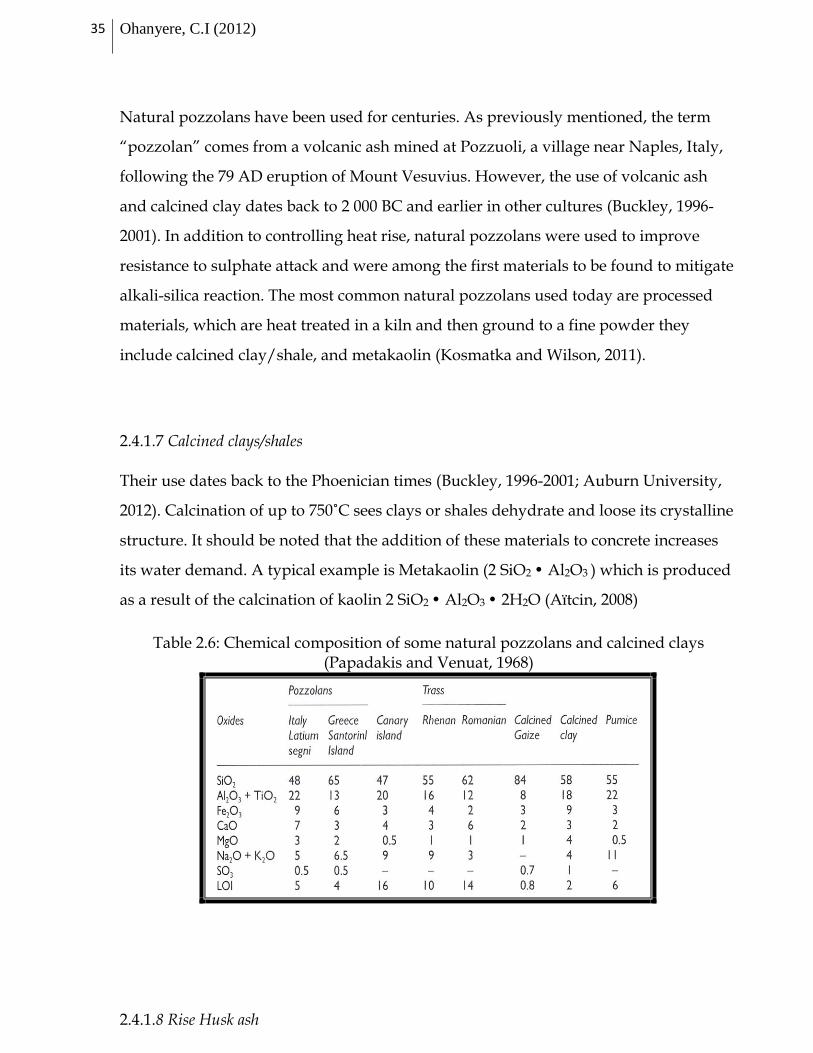
its water demand. A typical example is Metakaolin (2 SiO2 • Al2O3 ) which is produced
as a result of the calcination of kaolin 2 SiO2 • Al2O3 • 2H2O (Aïtcin, 2008)
Table 2.6: Chemical composition of some natural pozzolans and calcined clays (Papadakis and Venuat, 1968)
2.4.1.8 Rise Husk ash
Energy Efficiency and Environmental Performance of the SA Cement Industry 36
The protective pod of rice which is silicious in composition when calcined up to a
temperature of 750˚C brings out its vitreous silica nature in the ashes. This ash form
possesses very good pozzolanic properties but again when mixed with fresh concrete,
it tends to increase the water demand of the mix (Malhotra and Mehta, 1996).
As a result of the rate of energy consumption (from coal: a fossil fuel) and CO2
emissions experienced per ton of cement produced, the industry has been working
very hard to reduce its dependence on fossil fuels and emissions which may be
harmful to the environment. Thus, for about three decades, the global cement industry
and the South African cement industry have researched SCMs and their applicability
in this regard. To this end, the most commonly used SCMs and a few others have been
discussed and their roles as cement extenders which ultimately reduces the quantity of
cement required in selected mixes and applications have been shown.
So, the next section will briefly touch on how PC is manufactured in South Africa, with
a view to consolidating on work already done by others and highlighting where
energy is utilized, CO2 emissions occur (within the scope of the dissertation) and how
they can be reduced and mitigated respectively.
2.4.2 Portland cement manufacturing process.
Portland cement is generally made by further grinding and blending cooled cement
clinker with measured quantities of gypsum. Gypsum is added more often than not to
act as a retarding agent for the setting time of concrete. But to produce the cement
clinker, naturally occurring materials like calcium carbonate (limestone), clay/shale
and sand are quarried, ground, mixed and milled to fine granules at very high
temperatures (up to 1 450°C) in a 3° to 4° inclined rotating kiln for chemical reactions
to occur thus producing cement (MARSH, 2005; Grieve, 2009; Aitcin and Mindess,
2011). In a nutshell, according to Worrell et al., (2001) this process can simply be
described in three steps i.e. preparation of the raw materials, clinker production in the
kiln and manufacture of cement.
37 Ohanyere, C.I (2012)
2.4.2.1 Preparation of Raw Materials.
The raw materials used in the production of cement clinker can be distinguished as
primary and secondary. The primary raw materials are basically the limestone, sand,
clay and haematitie (mineralized Fe2O3). These materials are necessary because they
contain the basic constituents of cement (oxides of calcium, silica, alumina, iron and so
on) as shown in Table 3.1. After quarrying washing and stockpiling all these materials,
raw limestone is is fed through several caliberated crushers so as to attain a material
size of less than 19 mm particle size.
Then blending the crushed limestone with the prepared shale, sand and haematite, the
mixture is sent to the raw mill where further grinding and blending occurs bringing
the mixture to a fine powder. This powder is conveyed to the blending silo for
homogenization to produce what is known as the “kiln feed”. At this stage the kiln
feed is stored in silos ready for use. According to (MARSH, 2005), 1 ton of clinker can
be derived from about 1.5 tonnes of kiln feed.
In addition, should the requirement of the final product (cement) be of a special need
such as to resist sulphate attack, for mass concrete structures where a low heat of
hydration is required, secondary raw materials such as supplementary cementitious
materials SCMs can be included as additional components. This however, depends on
the location of the cement plant, and the availability of the secondary material.
2.4.2.2 Clinker production in the kiln.
The kiln is a cylinderical shaped vessel-like steel structure, inclined up to 4 degrees to
the horizontal to allow for gravity flow of the homogenized materials through it.
MARSH (2005), suggests that for proper blending of the feed, the kiln rotates between
0.5 to 4.5 revs/min to cater for sufficient reidence time5 of the kiln feed which is
needed for a complete thermal conversion process to occur (Worrell et al., 2001;
MARSH, 2005).
5 The residence time of the kiln feed refers to the standard time it spends within the kiln system for complete thermal conversion
of its particles to occur.
Energy Efficiency and Environmental Performance of the SA Cement Industry 38
To produce clinker, the homogenized kiln feed passes into the kiln system via a
multistage preheating process – which can cut energy requirement in the entire process
by up to half (Worrell, 2001; MARSH, 2005; Aitcin and Mindess 2011) – where ample
heating required for the thermal process is applied on the feed before it reaches the
calcining, upper transition, sintering and lower transition zones; otherwise called the
four thermal zones (MARSH, 2005):
The Calcining Zone:
This is the zone where the heat peaks at a temperature of 900° C. Here, through
thermal action, limestone is chemically disintegrated to lime by releasing carbon
dioxide. The process is called calcinations.
The Upper-Transition Zone:
In this zone, the kiln feed is exposed to more heat that rises to a temperature as high as
1 200° C where more thermal conversion is imminent.
The Sintering Zone:
Sintering refers to the action that produces materials from finely ground materials (in
powder form). Thus, this zone also known as the burning zone, is that which sees
lumps of clinker (greater than 3 mm but less than 20 mm in diameter) forming at a
temperature of 1 450° C.
The Lower Transition Zone:
Also called the cooling zone, it is the phase where the formed clinker starts to cool
though he zone is still at a temperature of 1 250° C. As the clinker forms, it continues its
path to the firing end of the kiln system where it is sent to cool to about 100° C before it
is fed through to its storage location.
It should be noted that because of its relatively cheap price and its abundant
availability, cement companies in South Africa derive almost all the energy used to fire
their kilns from coal (a highly energy intensive fuel).

39 Ohanyere, C.I (2012)
Figure 2.9: Dry Cement Manufacturing Process (MARSH, 2005)
To summarize, PC is a man-made material that is chemically produced by the
combination of naturally occurring materials like limestone, sand and clay in a
controlled environment. When mixed at specified proportions with aggregates, sand
and sometimes other additives (cement extenders), it forms concrete after hydration.
Concrete which is vital for construction is the most used material after water on earth
(Aitcin, 2008; Alexander and Beushausen, 2010; Aitcin and Mindess, 2011). Recent
construction breakthroughs have shown the advancement in the versatile applications
of Portland cement globally and in South Africa.
Therefore, this chapter has shed light on the South African cement industry. In doing
so, the origins of the industry have been discussed from the historical point of view of
the four main players. One recurrent theme in the evolution of the industry is that
cement production was and is still is a viable business venture in the country owing to
the desire and appetite South Africa has to develop and build world class
infrastructure.
Energy Efficiency and Environmental Performance of the SA Cement Industry 40
PC as a basic constituent of concrete has been unpacked from a global to local
perspective. The basic types of PC in South Africa were briefly mentioned along with
its components and properties. In recognition of the fact that the manufacture of plain
Portland cement is fast being replaced by blended cements, some supplementary
cementitious materials were also mentioned. In conclusion, the chapter wrapped up
with a description of how cement is manufactured using the dry process.
Having gone through the dry cement making process, it is evident that it is an energy
intensive process as stated by (Worrell et al., 2001). Being that the country relies
heavily on coal for its energy source (Mqadi et al., 2005), the cement industry is no
different but it is making efforts to curb its coal consumption. Also the fact that during
the calcining process, vast amounts of CO2 is emitted into the environment is a source
of concern for the industry. Hence, this shows the relevance of analyzing the energy
efficiency and environmental performance of the cement industry in South Africa as
will be seen in the next section.
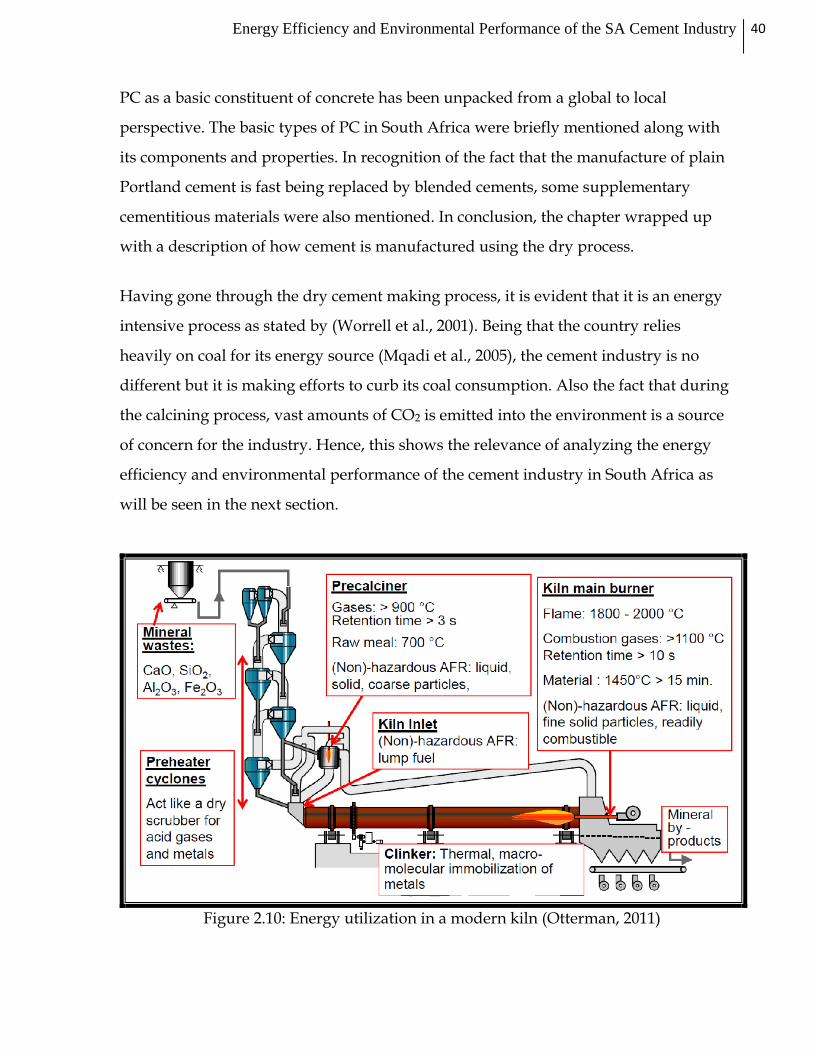
Figure 2.10: Energy utilization in a modern kiln (Otterman, 2011)
41 Ohanyere, C.I (2012)
Figure 2.10 shows a modern cement kiln. Here, its input components and energy
requirements are highlighted for each phase of cement production. AFR refers to
alternative fuels and raw materials which for sometime are being used to substitute
coal for energy in cement kilns. Aiding in reducing the amount of coal consumed,
recycling of waste materials and reduction of CO2 emissions, its use represents a shift
of paradigm which is very important for the industry as it deals with energy efficiency,
climate change and sustainable development issues. Some examples of AFRs are
rubber tyres, sludge and depleted solvents (CEMBUREAU, 1997).
2.5 ENERGY EFFICIENCY IN THE SOUTH AFRICAN CEMENT INDUSTRY.
2.5.1 INTRODUCTION
Energy is a major resource utilized and consumed in the production of cement.
Sourced mainly from fossil fuels, electricity or a combination of both, energy is an
integral part of the needs of a cement plant. Thus, it should be in constant supply to
avoid interruptions e.g. in a manufacturing process which can mar output and
productivity. Therefore, it is imperative that each company tackles this issue from a
corporate perspective. In this dissertation, the source of energy that will be discussed
will refer to that from coal (thermal energy) and electricity (electric energy) only.
This section will define energy efficiency and explore its benefits. Then, it will look into
how the South African cement industry has managed the challenges and prospects of
energy utilization and consumption in the production of cement. To do this, the South
African energy policy will be unpacked and juxtaposed with that of its cement
industry with a view to identifying gaps (if any).
2.5.2 DEFINITION OF ENERGY EFFICIENCY.
Energy Efficiency and Environmental Performance of the SA Cement Industry 42
Energy has generally been defined as the ability to do work. But in accordance with
Lehrman (1973), energy should not be defined without heat. Rather, he said it should
be defined as a quantity with a measurement of work and expressed algebraically such
that the sum of its algebraic parts remains constant either in an aggregated or
segregated system. Thus, energy may be termed as heat, work and so on depending on
its transfer mechanism (Lehrman, 1973). Given the definition of energy, it is evident
that for work to take place e.g. manufacturing cement, energy is indeed an important
resource to achieving it. This leads to the question of energy efficiency and its role in
the cement manufacturing business and the environment.
2.5.3 What is Energy Efficiency?
In broad terms, efficiency represents an action or set of actions devised to produce a
desired effect with minimal to zero wastage of input resources. So, energy efficiency
can be defined as a designed plan or set of plans meant to utilize energy in production
with as little waste as possible. Similarly, EPA (2008) defines an efficient system as that
which derives similar or more output while using a smaller amount of energy.
Additionally, DME (2004) stated that in meeting the requirements of sustainable
development – defined by the Brundtland commission as satisfying present needs
without jeopardising the ability to satisfy future needs (Brundtland, 1987) – energy
efficiency is one of the cheapest options available. Furthermore, it alluded to the fact
that practising energy efficiency can be advantageous to the environment because it
can deal with all issues surrounding pollution; issues such as CO2 emissions from
cement production – as is the focus of this dissertation.
Hence, as Otterman (2011) suggested, competitiveness within the cement industry will
be hinged on how effectively cement companies can manage energy. Therefore, the
next section will explore the ways in which the country’s cement industry has handled
energy use.
2.6 ENERGY USE AND MANAGEMENT IN THE SA CEMENT INDUSTRY.
43 Ohanyere, C.I (2012)
For a cement manufacturing facility to remain economically viable, it needs to plan and
budget for energy because according to (Otterman, 2011), it represents more than a
third of the production costs in most cement factories. While Taylor, Tam and Gielen
(2006) infered that energy represents between a fifth and nearly 40 % of the energy
costs. However, Otterman pointed out that the challenges of energy supply in South
Africa viewed from a short, medium and long term basis, shows that very high
electricity costs, rapid depletion of coal sources will make it difficult for cement
producers to operate if the system they are accustomed to remains unchanged
(Otterman, 2011).
In addition, the issue of mitigating greenhouse gas emissions which has fast become
the suject of global discourse, constitutes another challenge to the industry and is one
that should not be overlooked.
To shed more light on energy utilization and its management in cement production,
this dissertation will delve into the cement manufacturing process and probe where
energy is consumed and how it is being managed.
2.6.1 Technology and Thermal Energy consumption in the manufacture of cement
In work done by Taylor, Tam and Gielen (2006), they found that combining the energy
used in manuafcturing non metallic minerals, cement production alone accounts for
about 66 % of all the energy use. The cement kiln is the component that accounts for
the most coal use. With other process functions like drying of raw materials before use
utilizes coal as well in cases where the kiln does not dry the raw materials completely.
Additionally, the clinkering phase which has fans that work on electricity supply,
consumes up to 6 000 MJ / tonne of clinker manufactured. However, it should be
noted that its major source of thermal energy6 is coal (Taylor, Tam and Gielen, 2006;
Otterman, 2011).
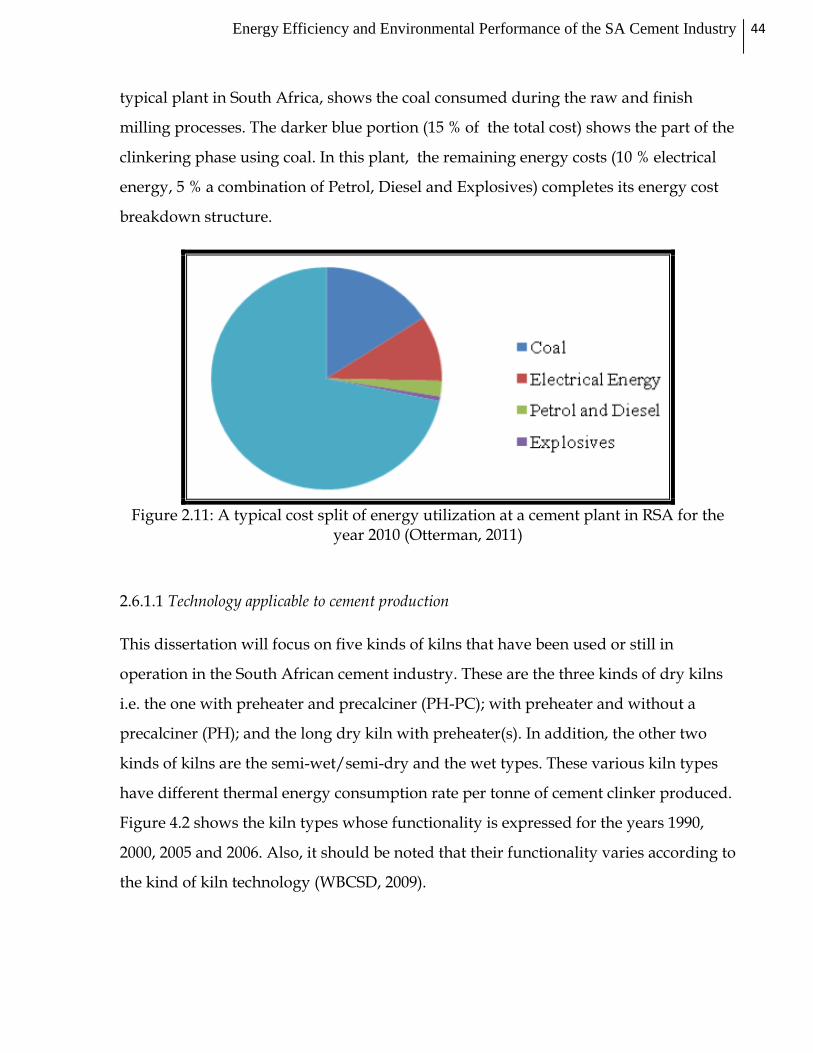
Figure 2.11 illustrates the vast proportion of coal consumption in comparison to other
energy sources in a typical cement plant in South Africa. The light blue portion
representing about 70 % of the entire cost of energy utilized in cement production in a
6 Thermal energy can be defined as the component of total energy (potential and kinetic) which determines the temperature
(measure of heat) of a medium or system.
Energy Efficiency and Environmental Performance of the SA Cement Industry 44
typical plant in South Africa, shows the coal consumed during the raw and finish
milling processes. The darker blue portion (15 % of the total cost) shows the part of the
clinkering phase using coal. In this plant, the remaining energy costs (10 % electrical
energy, 5 % a combination of Petrol, Diesel and Explosives) completes its energy cost
breakdown structure.
Figure 2.11: A typical cost split of energy utilization at a cement plant in RSA for the
year 2010 (Otterman, 2011)
2.6.1.1 Technology applicable to cement production
This dissertation will focus on five kinds of kilns that have been used or still in
operation in the South African cement industry. These are the three kinds of dry kilns
i.e. the one with preheater and precalciner (PH-PC); with preheater and without a
precalciner (PH); and the long dry kiln with preheater(s). In addition, the other two
kinds of kilns are the semi-wet/semi-dry and the wet types. These various kiln types
have different thermal energy consumption rate per tonne of cement clinker produced.
Figure 4.2 shows the kiln types whose functionality is expressed for the years 1990,
2000, 2005 and 2006. Also, it should be noted that their functionality varies according to
the kind of kiln technology (WBCSD, 2009).
45 Ohanyere, C.I (2012)
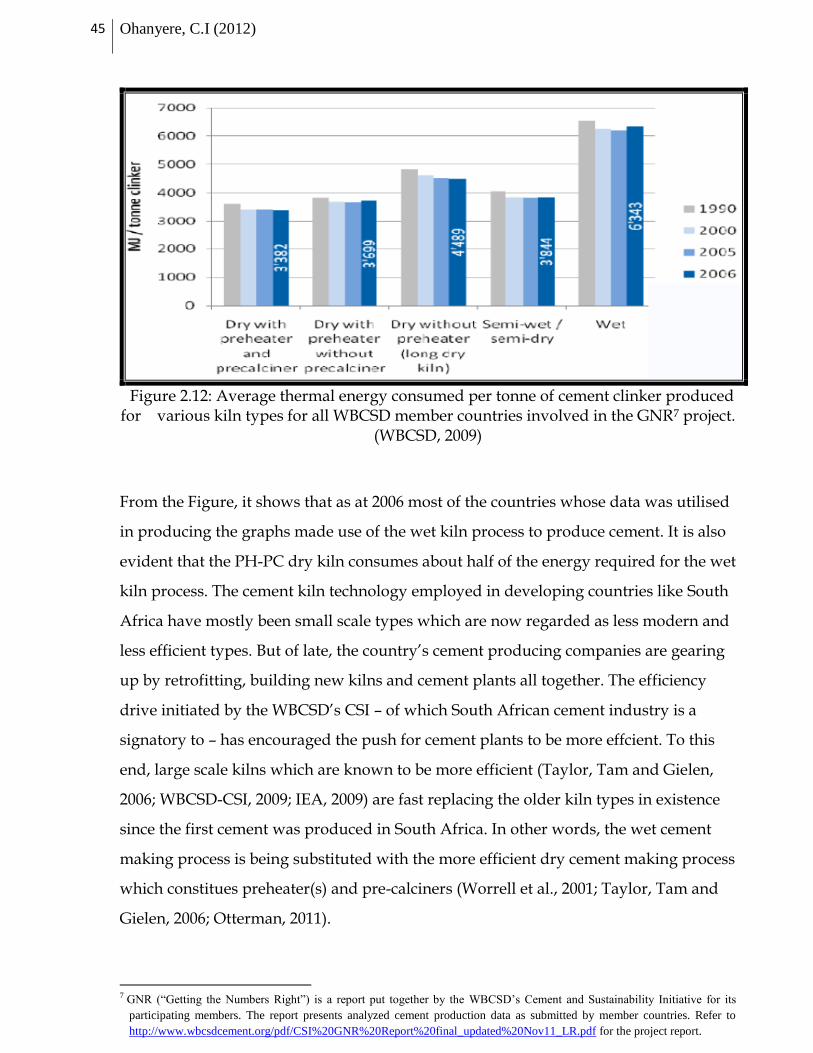
Figure 2.12: Average thermal energy consumed per tonne of cement clinker produced for various kiln types for all WBCSD member countries involved in the GNR7 project.
(WBCSD, 2009)
From the Figure, it shows that as at 2006 most of the countries whose data was utilised
in producing the graphs made use of the wet kiln process to produce cement. It is also
evident that the PH-PC dry kiln consumes about half of the energy required for the wet
kiln process. The cement kiln technology employed in developing countries like South
Africa have mostly been small scale types which are now regarded as less modern and
less efficient types. But of late, the country’s cement producing companies are gearing
up by retrofitting, building new kilns and cement plants all together. The efficiency
drive initiated by the WBCSD’s CSI – of which South African cement industry is a
signatory to – has encouraged the push for cement plants to be more effcient. To this
end, large scale kilns which are known to be more efficient (Taylor, Tam and Gielen,
2006; WBCSD-CSI, 2009; IEA, 2009) are fast replacing the older kiln types in existence
since the first cement was produced in South Africa. In other words, the wet cement
making process is being substituted with the more efficient dry cement making process
which constitues preheater(s) and pre-calciners (Worrell et al., 2001; Taylor, Tam and
Gielen, 2006; Otterman, 2011).
7 GNR (“Getting the Numbers Right”) is a report put together by the WBCSD’s Cement and Sustainability Initiative for its
participating members. The report presents analyzed cement production data as submitted by member countries. Refer to
http://www.wbcsdcement.org/pdf/CSI%20GNR%20Report%20final_updated%20Nov11_LR.pdf for the project report.
Energy Efficiency and Environmental Performance of the SA Cement Industry 46
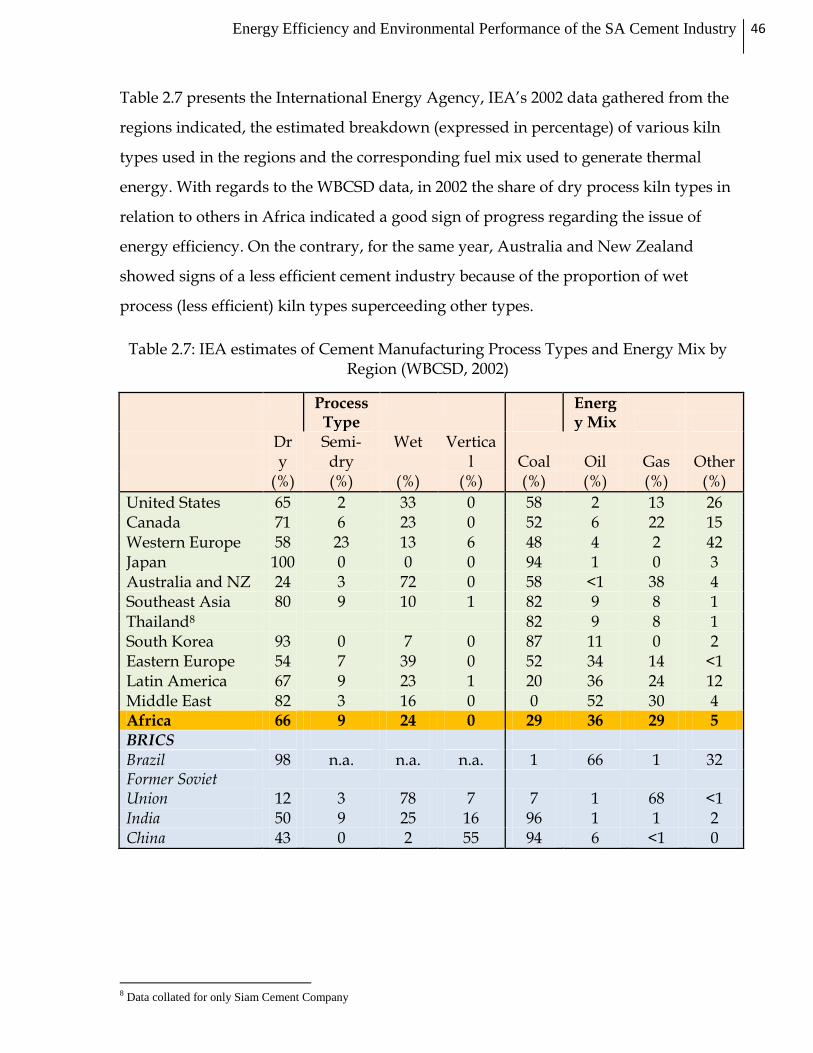
Table 2.7 presents the International Energy Agency, IEA’s 2002 data gathered from the
regions indicated, the estimated breakdown (expressed in percentage) of various kiln
types used in the regions and the corresponding fuel mix used to generate thermal
energy. With regards to the WBCSD data, in 2002 the share of dry process kiln types in
relation to others in Africa indicated a good sign of progress regarding the issue of
energy efficiency. On the contrary, for the same year, Australia and New Zealand
showed signs of a less efficient cement industry because of the proportion of wet
process (less efficient) kiln types superceeding other types.
Table 2.7: IEA estimates of Cement Manufacturing Process Types and Energy Mix by Region (WBCSD, 2002)
Process Type
Energy Mix
Dry
Semi-dry
Wet Vertical Coal Oil Gas Other
(%) (%) (%) (%) (%) (%) (%) (%)
United States 65 2 33 0 58 2 13 26 Canada 71 6 23 0 52 6 22 15 Western Europe 58 23 13 6 48 4 2 42 Japan 100 0 0 0 94 1 0 3 Australia and NZ 24 3 72 0 58 <1 38 4 Southeast Asia 80 9 10 1 82 9 8 1 Thailand8 82 9 8 1 South Korea 93 0 7 0 87 11 0 2 Eastern Europe 54 7 39 0 52 34 14 <1 Latin America 67 9 23 1 20 36 24 12 Middle East 82 3 16 0 0 52 30 4 Africa 66 9 24 0 29 36 29 5 BRICS Brazil 98 n.a. n.a. n.a. 1 66 1 32 Former Soviet Union 12 3 78 7 7 1 68 <1 India 50 9 25 16 96 1 1 2 China 43 0 2 55 94 6 <1 0
8 Data collated for only Siam Cement Company

47 Ohanyere, C.I (2012)
2.6.1.2 Thermal Energy consumed in cement production
According to WBCSD-CSI and IEA (2009), a cement kiln consuming below 3 500 MJ
/tonne of clinker is regarded to be an energy efficient type. Though, in 2002 the
WBCSD theoretically found that the least thermal energy consumed in the production
of a tonne of clinker is 1 760 MJ / tonne of cement clinker produced. Also, wet kilns
(which are said to be the least efficient) utilzes between 5 300 and 7 100 MJ / tonne
while kilns having preheater(s) and pre-calciners are said to consume about 3 060 MJ to
manufcture a tonne of cement (WBCSD, 2002).
Figure 2.13 presents collated data showing typical energy utilisation per tonne of
cement clinker produced in different regions for the years 1990, 2000, 2005 and 2006.
With the preceeding paragraph as reference, Figure 2.13 shows that the wet kiln type is
the least efficient because the WBCSD-CSI member countries making use of this kiln
type in their cement plants, recorded a thermal (fuel) energy consumption average of
over 6 000 MJ / tonne of clinker produced. While those using the dry preheater and
precalciner kiln types operated more efficiently because they recorded an average
thermal energy consumption of under 3 500 MJ / tonne of produced clinker.
Figure 2.13: Thermal energy consumed per tonne of cement clinker produced (WBCSD, 2009).
Energy Efficiency and Environmental Performance of the SA Cement Industry 48
For China and North America (US and Canada), the three countries responsible for
almost 50 % of the global cement production figures, make use of nearly 5 000 MJ /
tonne of cement clinker. As for the EU, their consumption figure sits at about 3 700 MJ
/ tonne while the rest range from 3 150 to 3 650 MJ / tonne (Taylor, Tam and Gielen,
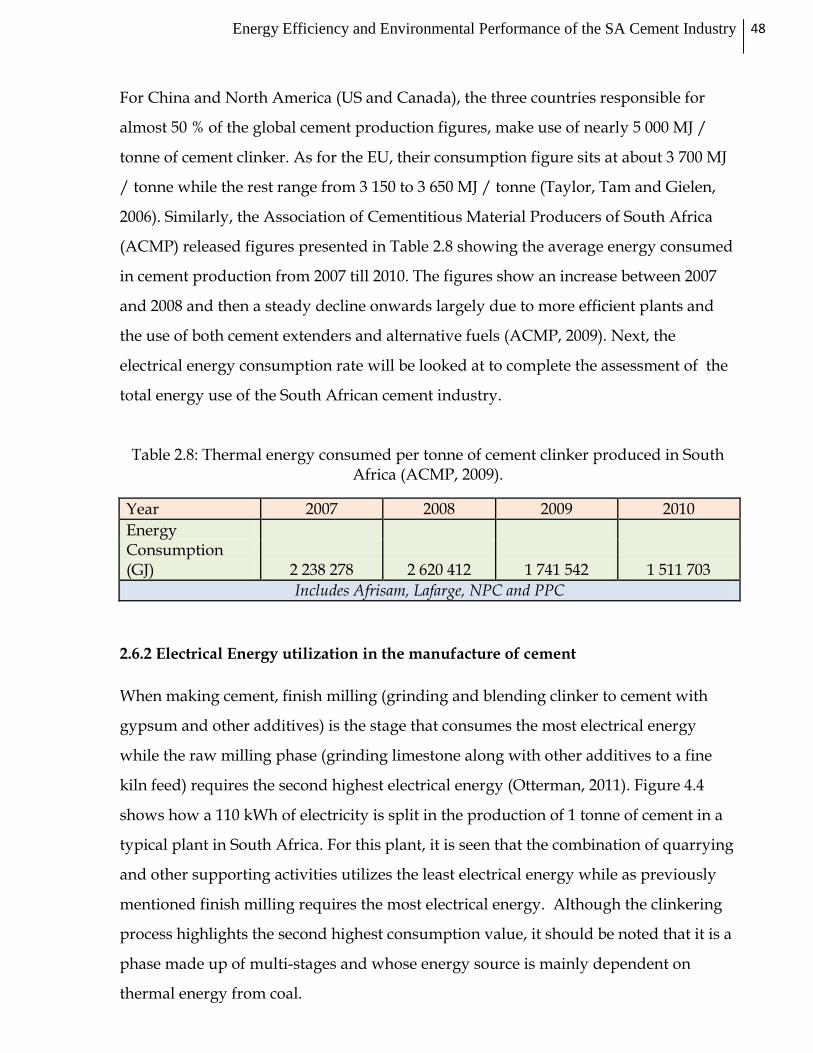
2006). Similarly, the Association of Cementitious Material Producers of South Africa
(ACMP) released figures presented in Table 2.8 showing the average energy consumed
in cement production from 2007 till 2010. The figures show an increase between 2007
and 2008 and then a steady decline onwards largely due to more efficient plants and
the use of both cement extenders and alternative fuels (ACMP, 2009). Next, the
electrical energy consumption rate will be looked at to complete the assessment of the
total energy use of the South African cement industry.
Table 2.8: Thermal energy consumed per tonne of cement clinker produced in South Africa (ACMP, 2009).
Year 2007 2008 2009 2010
Energy Consumption (GJ) 2 238 278 2 620 412 1 741 542 1 511 703
Includes Afrisam, Lafarge, NPC and PPC
2.6.2 Electrical Energy utilization in the manufacture of cement
When making cement, finish milling (grinding and blending clinker to cement with
gypsum and other additives) is the stage that consumes the most electrical energy
while the raw milling phase (grinding limestone along with other additives to a fine
kiln feed) requires the second highest electrical energy (Otterman, 2011). Figure 4.4
shows how a 110 kWh of electricity is split in the production of 1 tonne of cement in a
typical plant in South Africa. For this plant, it is seen that the combination of quarrying
and other supporting activities utilizes the least electrical energy while as previously
mentioned finish milling requires the most electrical energy. Although the clinkering
process highlights the second highest consumption value, it should be noted that it is a
phase made up of multi-stages and whose energy source is mainly dependent on
thermal energy from coal.

49 Ohanyere, C.I (2012)
Figure 2.14: A typical electrical split of energy utilization at a cement plant in RSA
(Otterman, 2011)
But Sathaye, J., et al. (2005), stated that according to the current best practice for
electricity consumption in the cement industry, a plant utilizing electrical energy at a
rate between 75 to 80 kWh is classified as efficient and modern. Even at this, the energy
efficiency of the combination finish and raw milling (grinding) stages are still as much
as 90 % to 95 % inefficient because this amount of the process is converted to heat
(Taylor, Tam and Gielen, 2006). The consumption rate of the South African plant (110
kWh / tonne of clinker) represented in Figure 2.14 corresponds to those in Brazil
which Soares and Tolmasquim (2005) found to range between 90 and 200 kWh / tonne
of clinker.
Table 2.9: Total Electricity purchased for cement clinker produced in South Africa (ACMP, 2009).
Year 2007 2008 2009 2010
Electricity Purchased (MWh) 611 150.5 606 153.5 946 498 852 230
Includes Afrisam, IDM, NPC and PPC

Energy Efficiency and Environmental Performance of the SA Cement Industry 50
Comparing Table 2.9 to 2.8 it is seen that electricity purchased dropped from 2007 to
2008 by 1 % while simulteneously 17 % more energy was consumed within the same
period. Between 2008 and 2009, 56 % more electricity was purchased and 34 % less coal
energy was utilized.
And from 2009 to 2010 both thermal and electrical energy consumption dropped.
These fluctuations of energy use in the South African cement industry shows an
absolute increase in electricity purchased of about 50 % and a concurrent absolute
decrease of about 50 % in thermal energy consumed from 2007 to 2009. Given the 2008
global financial crisis, these indications may be attributed to international coal demand
that may have benefitted South Africa and hence encouraged the country to export
more thereby making less avilble for consumption.
In a nutshell, making use of modern efficient kiln technologies is a way of achieving
reduction of energy costs (Worrell, 2001; WBCSD-CSI, 2002 and 2009; Taylor, Tam and
Gielen, 2006; Otterman, 2011). Therefore as alluded to by the authors, in order to
increase efficiency with time it is pertinent to advance in technology as well. Though,
looking at the bigger picture of mitigating emissions, it can be deduced that installing
modern kilns (e.g. dry rotary kilns) alone cannot guarantee reduced emissions except
when combined with operating the technologically advanced plant efficiently. Thus,
raising the vital question of how energy is managed in the South African cement
industry.
2.6.3 Energy management in cement production
Managing energy in a cement plant is a key ingredient to its success and sustenance
and requires buy in, informed policy and strategy from the corporate level. For South
Africa, energy management is very important because as previously mentioned the
country is one of the highest emitters of CO2 and consumers of fossil fuel for energy in
the world. To manage cement production effectivel, it is important to know the
effeciency requirements of the components of the production process. See Appendix B
for the steps and energy consumed for each step in cement production.
51 Ohanyere, C.I (2012)
Therefore, in accordance with WBCSD (2009) and Otterman (2011), the production
capacity of cement plants with modern PH-PC kiln types is usually higher than those
with other kinds of kilns.
As such, these kiln types record higher values of energy efficiency i.e. at a thermal
energy consumption rate of up to 600 MJ / tonne of cement clinker produced.
Additionally, their reports showed that long dry kilns with no preheater consumes
about 800 MJ / tonne of cement clinker while the old wet kilns consumes nearly 1 120
MJ / tonne of cement clinker. With this in mind, the challenge for the management of a
cement plant can be summarised as their ability to overcome hurdles such as: the cost
of energy; constantly securing energy and the government’s regulations on climate
change.
2.6.3.1 The medium to long term Cost of Energy in SA
In recent years Eskom (South africa’s main electricity company) has announced
potential increases in the cost of electricty supply which are gradually being
implemented and are estimated to be in the region of about 30 %. This cost increase
including the inconsistent coal prices may not augor well for energy prices in the
medium to long term. Accordingly, Otterman (2011) indicated that the projected
increase could raise the cost of input into the cement production process by as much as
45%.
2.6.3.2 Constantly Securing Energy.
The constraints in energy supply in South Africa is a growing concern for the cement
industry. From the variations in the supply of electricty to meet demand adequately, to
the issues surrounding export and local coal consumption. Figure 4.5 shows the risk
level faced by the local coal market should local exports rise to its maximum capacity.
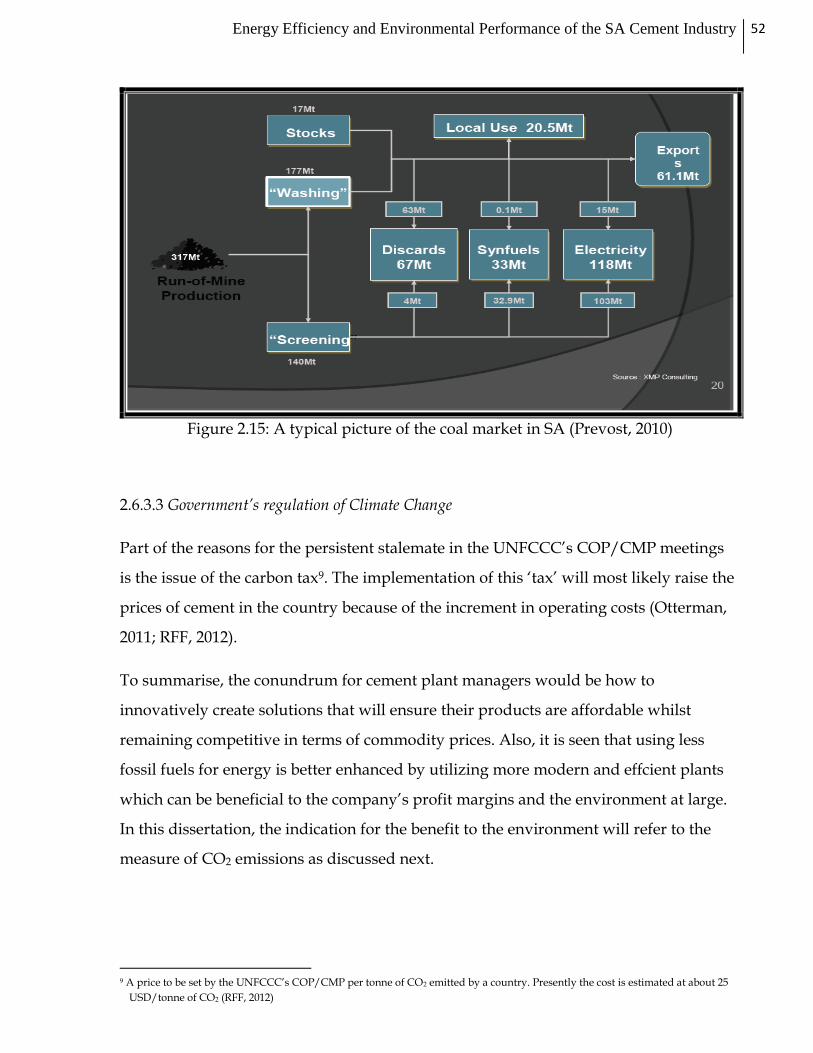
Energy Efficiency and Environmental Performance of the SA Cement Industry 52
Figure 2.15: A typical picture of the coal market in SA (Prevost, 2010)
2.6.3.3 Government’s regulation of Climate Change
Part of the reasons for the persistent stalemate in the UNFCCC’s COP/CMP meetings
is the issue of the carbon tax9. The implementation of this ‘tax’ will most likely raise the
prices of cement in the country because of the increment in operating costs (Otterman,
2011; RFF, 2012).
To summarise, the conundrum for cement plant managers would be how to
innovatively create solutions that will ensure their products are affordable whilst
remaining competitive in terms of commodity prices. Also, it is seen that using less
fossil fuels for energy is better enhanced by utilizing more modern and effcient plants
which can be beneficial to the company’s profit margins and the environment at large.
In this dissertation, the indication for the benefit to the environment will refer to the
measure of CO2 emissions as discussed next.
9 A price to be set by the UNFCCC’s COP/CMP per tonne of CO2 emitted by a country. Presently the cost is estimated at about 25
USD/tonne of CO2 (RFF, 2012)

53 Ohanyere, C.I (2012)
3.0 METHODOLOGY AND LIMITATIONS OF THE RESEARCH
3.1 RESEARCH METHOD
The process used for this dissertation, as adapted from (DST, 2007), is categorized
under three main activities namely; research initiation, criteria recognition for
assessment and prioritization of energy efficiency and GHG emissions from cement
manufacture and collation of a synthesized dissertation.
3.1.1 1st Activity: Research Initiation
In addition to the aims spelt out in item 1.3.2, this research endeavors to provide a
concise picture of how the country’s cement industry has performed in relation to
others so that it can do better going forward.
3.1.2 2nd Activity: Criteria Recognition
The purpose of this activity is to critically create an analytical framework to be used in
carrying out the research. Here, the parameters for reviewing the energy consumption
and emissions performance of the country’s cement industry were identified,
prioritized and systemically analyzed using the benchmarking and energy saving tool
for the cement industry (BEST, 2008) and cement based (ICF, 1999) methodologies
respectively.
3.1.3 3rd Activity: Synthesized Report
This section sees the collation of the data and information originating from the
framework for the final document from the previous activity and in a prioritized
format.
Energy Efficiency and Environmental Performance of the SA Cement Industry 54
3.2 CRITICAL ANALYTICAL FRAMEWORK
In achieving the one broad objective and the four aims of this dissertation, a desktop
review methodology is adopted within a critical analytical framework context. This
framework is in line with the theoretical framework supporting the idea that cement
has no known substitute and hence will have to be continuously produced. The
research descriptively analyses data and information from numerous sources such as
journals, articles, reports, electronic sources, personal and expert views and books. This
dissertation is highly dependent on data from the Association of Cementitious Material
Producers of South Africa (ACMP), the Cement and Concrete Institute of South Africa
(C&CI), electronic databases and annual reports of the country’s top four cement
manufacturers namely; PPC, Afrisam, Lafarge and NPC-Cimpor. Furthermore, the
study is done within the context of the cement life cycle analysis (LCA) i.e. from
“Cradle to Gate” (Huntzinger, et al., 2009) as previously mentioned.
3.3 RESEARCH LIMITATIONS
To achieve the set objective and aims of this research within the prescribed scope, it
should be mentioned that the limitations of this research are considered as;
3.3.1 Access to pertinent data and Information
The limitations to this research are summed up in the acquisition of relevant data and
information specifically from the four main companies because the cement industry in
South Africa is very sensitive.
3.3.2 Data and Information verity
Due to the fragile state the local cement industry is in and its well documented
antecedents, there is no way to cross check and verify the precision and accuracy of the
industry’s overall energy and emissions data published by the ACMP, C&CI and the
individual companies. Therefore this research is confined to desktop reviews and thus
wholly reliant on these sources and those previously mentioned.
55 Ohanyere, C.I (2012)
3.3.3 Hegemony and Autonomy within the South African cement industry
Given that the major players in the country’s cement industry have been operating for
decades and were borne out of multi-billion dollar parent companies, there is a strong
sense of deliberate collusion and dominance present in the economic sector although
no endorsed proof or official report of this exists. Moreover, South Africa’s nascent
democracy has had its fair share of bad media and publicity regarding similar
collusion claims in some major industries e.g. bread, airline, construction and milk
industries among others.
3.3.4 Lack of previous literature on the topic
The shortage of local literature relating to this research can be attributed to the
restricted access to relevant data and information which may largely be due to the
susceptibility of the industry as a whole.
To summarise this chapter, the research methodology employed is that which seeks to
rate the companies collectively. Then, the approach establishes and untangles the
factors that characterises the industry’s energy use and emissions performance. To end
with, it collates a study that contributes to local literature. To accomplish these, a
critical analytical framework defined by the cradle to gate boundary concept is used.
But, securing the correct, reliable and verifiable data and information about the in-
depth operations, the cement market “monopolistic power” held by the major players
as well as shortage of literature regarding this topic in the South African cement
industry are identified restrictions of this research.
Energy Efficiency and Environmental Performance of the SA Cement Industry 56
4.0 FINDINGS AND ANALYSIS
This chapter contains findings from the desktop study and review of literature. It
endeavors to show how the cement industry in South Africa manages its energy
consumption and CO2 emissions in relation to others. The findings made during the
research and review of literature is subsequently discussed.
4.1 FINDINGS
4.1.1 South Africa and its cement industry.
Since 1980 the population of the country has been increasing by approximately
2 % per annum. In addition there has been similar growth in rural urban
migration.
The demand for cement has equally been on the rise with a corresponding rise
in cement production. This has seen an increase in cementitious sales of about
57 % between 1980 and 2010.
First cement was produced in 1892.
From 1892 till 2010, 419 Mt of cement has been produced. 65% of these sales
were recorded between 1980 and 2010. Thus, an average production of 14 Mt pa
since 1980.
Lowest cementitious sale of 1 360 t was recorded in 1892 while the highest sale
of 15.3 Mt was noted in 2007.
There are 4 major cement producers namely; PPC, Afrisam, Lafarge and NPC-
Cimpor. Their kiln descriptions are shown in Figure 4.1.
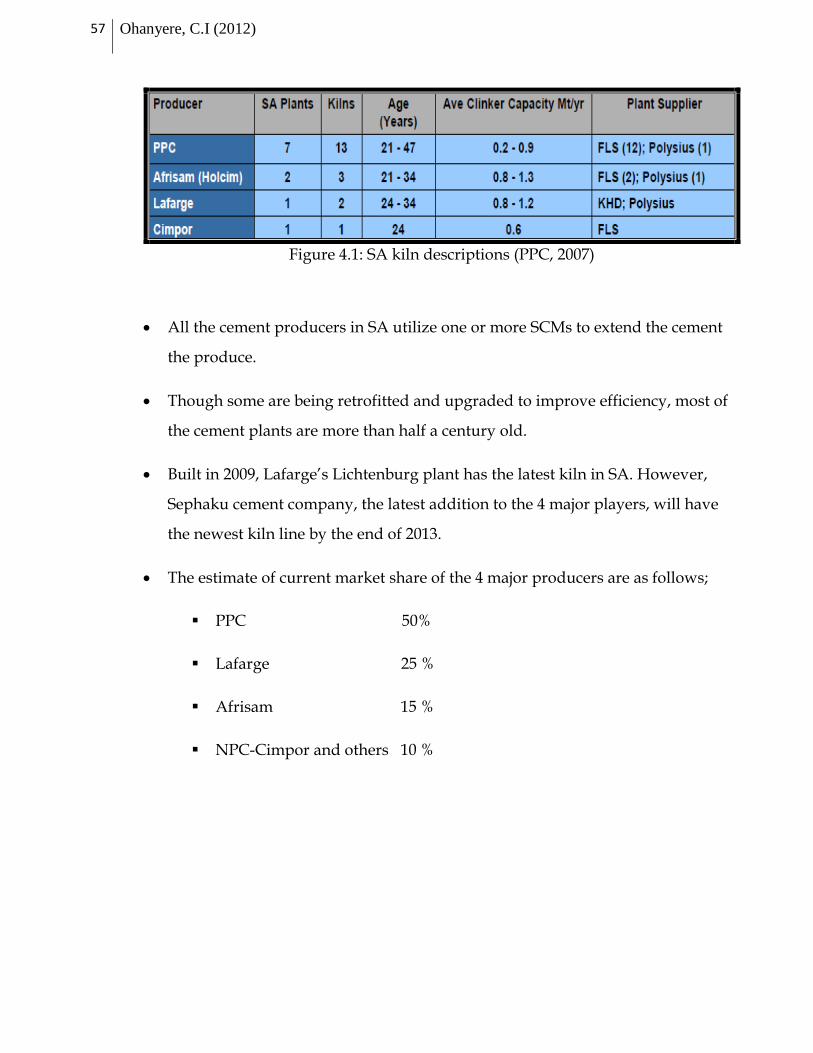
57 Ohanyere, C.I (2012)
Figure 4.1: SA kiln descriptions (PPC, 2007)
All the cement producers in SA utilize one or more SCMs to extend the cement
the produce.
Though some are being retrofitted and upgraded to improve efficiency, most of
the cement plants are more than half a century old.
Built in 2009, Lafarge’s Lichtenburg plant has the latest kiln in SA. However,
Sephaku cement company, the latest addition to the 4 major players, will have
the newest kiln line by the end of 2013.
The estimate of current market share of the 4 major producers are as follows;
PPC 50%
Lafarge 25 %
Afrisam 15 %
NPC-Cimpor and others 10 %
Energy Efficiency and Environmental Performance of the SA Cement Industry 58
4.1.2 Energy Efficiency and CO2 emissions in the SA cement industry
Energy costs represent between 20 % to 40 % of the total production costs of
cement factories.
Cement production (especially the calcining process) is highly energy intensive.
The major source of thermal energy in SA is coal and the main source of
electricity is Eskom.
SA is among the highest CO2 emitters in the world.
Energy efficient kiln consumes between 3 000 to 3 500 MJ / t of clinker produced.
And less energy efficient kilns consume between 5 300 to 7 100 MJ / t of clinker
produced.
Electrical efficient kiln consumes 75 to 85 kWh / t of clinker produced.
Cement consumption per capita in the country is about 0.25 t/capita or 1
m3/capita. A typical plant in SA consumes electricity at about 110 kW/h
CO2e emissions per capita in the country is about 13 tCO2e/capita (OECD,
UNEP, 2011).
59 Ohanyere, C.I (2012)
4.2 ANALYSIS
The SA cement industry is one of the oldest in Sub-Saharan Africa and for about
120 years it has been producing cement to meet local and regional (SADC10
region) demands.
SA cement industry leads most of the African continent in terms of cement
production and sales figures. Consequently, regarding cement production, it is
the highest ranked in terms of energy use and CO2 emissions in SSA11. However,
the country is at the forefront of scientific research into the chemistry of cement
and the use of cement extenders in SSA.
The four main producers control more than 95 % of the local market. Therefore
this leaves little or no room for other players and if unchecked, can create an
atmosphere of monopoly, price collusion and so on. For this reason and the
sensitivity of the entire industry, retrieving data and information valuable to
this research proved very difficult.
The analysis of the findings regarding the energy efficiency and CO2 emissions
of the SA cement industry shows that though the cement utilization per person
is roughly the same as that of the global average, the industry’s energy (thermal
and electrical) use and CO2 emissions are still relatively high.
10 SADC: South African Development Community
11 SSA: Sub Saharan Africa.
Energy Efficiency and Environmental Performance of the SA Cement Industry 60
5.0 CONCLUSION AND RECOMMENDATIONS
In conclusion, this dissertation finds no existing critical review of the South African
cement industry as a whole with respect to energy efficiency and CO2 emissions.
Neither is there an in-depth review of the four main producers in comparison to a
benchmark. Therefore, it differs from existing literature on the subject matter because
the dissertation aims to explore the topic within the South African context. But, it is
seen that each company has websites - which are regularly updated and regular
publications which highlight their specific achievements and so on. The cement
industry representatives like the ACMP and C&CI also have regular publications
which endeavor to present collated data. However, information regarding exact
cement production and emission figures as well as efficiency levels of plants are
difficult to retrieve from each of the companies. This may be attributed to the fine they
recently paid for alleged price collusion and fixing. This research contributes to
previous work in that it includes South Africa in most of the comparisons made
though it raises new questions as to where exactly the country is in terms of how
exactly it compares with others in energy use and management of CO2 emissions.
Finally, this study is built around the theoretical framework that till date there is no
known substitute for cement. Backed up by research through various literature, it is
founded on the economic theory that demand equals supply. On this basis, cement
production will continue for some time to come. Hence, since cement manufacture
relies heavily on energy (mainly sourced from coal in South Africa) and emits CO2 at a
rate almost equal to a tonne of clinker produced, cement companies in the country will
have to embark on continuous improvement and bring their plants and processes up to
date with the latest technology and know-how. In answering the research question,
the dissertation finds no conclusive evidence as to where the industry belongs in
comparison to others because of the difficulty in acquiring information. But it should
be mentioned that a lot of progress has been made regarding installing new kilns and
retrofitting existing ones to improve energy use and reduce CO2 emissions.

61 Ohanyere, C.I (2012)
Thus, the aim of the work is to review a very important industry in South Africa which
is highly energy intensive and emits a significant quantity of CO2 for a single industry
with a view to reviewing its energy use and environmental performance for the past 30
years. The importance of the review is borne out of the need for such industries to
practice energy conservation, use little or no energy from fossil fuel sources and reduce
emissions that may be harmful to the environment.
As such the recommendations of this dissertation are listed next.
SA cement industry should;
• Invest more in research into the chemistry of cement and its production process
because the calcining stage (decarbonising limestone to lime) is responsible for
most of the CO2 emissions. In addition, the hydration process may reveal the
best way to reduce the quantity of CaO in the C3S (Tricalcium silicate) which has
the highest percentage by mass in CEM I common cements.
• Utilize more Alternative Fuels and Raw materials like the SCMs as previously
discussed.
• Invest in more new (energy efficient) technologies.
• Encourage more joint implementations and transfer of technology.
• Increase reduction of clinker to cement ratios.
• Further explore and consider opportunities that will be beneficial in case the
carbon tax is signed into law. An example of this is the opportunity present in
the clean development mechanism (CDM) which monetarily rewards CO2
emission reduction schemes.
• Consider a portfolio of these recommendations as the best emissions reduction
and energy efficiency practice.
BILIOGRAPHY
Energy Efficiency and Environmental Performance of the SA Cement Industry 62
Abedian, I., 2012. South African Infrastructure Drive: Beware of inappropriate financila structuring, Johanessburg: Pan African Investment and Research Services: Political Economy Note.
ACMP, 2009. [Online]. Available at: http://www.acmp.co.za [Accessed 9 December 2012].
AfriSam, 2010. AfriSam South Africa (Pty) Ltd, South Africa.. [Online] Available at: http://www.afrisam.co.za/about.asp [Accessed 27 November 2012].
Aitcin, P., 2008. Binders for durable and sustainable concrete. London: Taylor and Francis.
Aitcin, P.-C. a. M. S., 2011. Sustainability of concrete. First ed. New York: Spon Press.
Akindahunsi, A., 2011. Cement and Concrete in Africa. Johanessburg, Spearhead Network for Innovative, Clean and Safe Cement and Concrete Technologies (SPIN).
Alexander, M., 1998. Cement: Chemistry and Physics; Hydration and Properties. Cape Town: CIV 5002 Z Lectures, University of Cape Town.
Alexander, M. a. B. H., 2010. Concrete: Constituent Materials and Properties. Cape Town: Concrete and Structural Integrity Research Group, Iniversity of Cape Town.
Alexander, M. a. M. S., 2005. Aggregates in Concrete. 1st ed. New York: Taylor and Francis.
Auburn University, 2012. Timeline of Concrete. [Online] Available at: http://www.auburn.edu/academic/architecture/bsc/classes/bsc314/timeline/timeline.htm [Accessed 16 April 2012].
Blaine, S., 2012. Business Day Live. [Online] Available at: http://www.bdlive.co.za/economy/2012/10/30/census-sas-population-of-51.8m-is-still-young [Accessed 5th November 2012].
Brundtland, 1987. Report of the World Commission on Environment and Development: Our Common Future, Geneva: United Nations.
Bentur, A., 2002. Cementitious Materials-Nine Millennia and A New Century: Past, Present and Future. Journal of Materials in Civil Engineering, Volume 14, pp 1-22.
Boden, e. a., 2011. Record HigGlobal, Regional, and National Fossil-Fuel CO2 Emissions from Fossil-Fuel Combustion and Cement Manufacture, Tennessee: Carbon Dioxide Information Analysis Center, Oak Ridge National Laboratory, U.S. Department of Energy, Oak Ridge, Tenn., U.S.A.
Buckley, J., 1996-2001. A History of Cement. [Online] Available at: http://www.rumford.com/articlemortar.html [Accessed 15 April 2012].
Boden, e. a., 2011. Record HigGlobal, Regional, and National Fossil-Fuel CO2 Emissions from Fossil-Fuel Combustion and Cement Manufacture, Tennessee: Carbon Dioxide Information Analysis Center, Oak Ridge National Laboratory, U.S. Department of Energy, Oak Ridge, Tenn., U.S.A.
63 Ohanyere, C.I (2012)
CEMBUREAU, 1997. Alternative Fuels in Cement Manufacture: A technical and environmental review, Brussels: CEMBUREAU. The European Cement Association.
C&CI, 2009. Cementitious materials for concrete; standards, selection and properties, midrand: Cement and Concrete Institute.
Cahn, D., W, G. & Moir, R., 1997. Atmospheric CO2 and the US cement industry. World Cement, pp. 64-68.
Canada Portland Cement Association, 1997. Cement, Concrete and Climate Change, Toronto: Canada Portland Cement Association.
Cembureau, 1998. Climate Change, Cement and the EU, Brussels: Cembureau.
Cement and Concrete Institute, 2012. National Cementitious Sales Statistics for South Africa, Pretoria: Cement and Concrete Institute.
Department of Science and Technology, Republic of South Africa, 2007. Synthesis Report: South Africa's Climae Change Technology Needs Assessment, Pretoria, Gauteng: Department of Science and Technology.
DME, 2004. Draft Energy Efficiency Strategy of the Republic of South Africa, Pretoria: Department of Minerals and Energy, RSA.
EPA, 2008. Energy Efficiency: Reduce Energy Bills, Protect the Environment, Washington: U.S. Environmental Protection Agency.
FHWA , 2012. User Guidelines for Waste and Byproduct Materials in Pavement Construction, Washington: U.S Department of Transportation. Federal Highway Administration.
Fidjestøl, R. a. L. R., 1998. Micosilica as an Addition. P.C. Hewlett (ed.) Lea’s Chemistry of Cement and Concrete, Arnold, London, pp. pp. 675-708.
Fourie & Smith, 1994. The South African Cement Cartel: A Critique of Fourie and Smith. South African Journal of Education (SAJE), 62(3), p. 254.
Grieve, G., 2009. Cementitious materials. In: G. Owens, ed. Fulton's concrete technology. Midrand, Johanessburg: Cement & Concrete Institute, pp. 1-16.
Grieve, G., 2009. Cementitious Materials. In: G. Owens, ed. Fulton's Concrete Technology. Johannesburg: Cement and Concrete Institute, p. pp 9.
Holcim, 2013. Holcim. [Online] Available at: http://www.holcim.com/press-and-media/statements-regarding-multiwatch-allegations/south-africa.html [Accessed 25 November 2013].
Huntzinger, D. a. E. T., 2009. A life-cycle assessment of Portland cement manufacturing: comparing the traditional process with alternative technologies. Journal of Cleaner Productions , Volume 17, pp. 668-675.
IEA, 2009. Cement Technology Roadmap 2009: Carbon emissions reductions up to 2050, Paris: International Energy Agency.
International Energy Statistics, 2011. guardian.co.uk/news. [Online] Available at: http://www.guardian.co.uk/news/datablog/2011/jan/31/world-carbon-dioxide-emissions-country-data-co2#data [Accessed 15 October 2012].
Energy Efficiency and Environmental Performance of the SA Cement Industry 64
IOL: Business Report, 2012. Lafarge SA agrees to pay R149m cartel fine. [Online] Available at: http://www.iol.co.za/business/business-news/lafarge-sa-agrees-to-pay-r149m-cartel-fine-1.1252519 [Accessed 27 April 2012].
IOL, 2012. Independent Online: Business Report. [Online] Available at: http://www.iol.co.za/business/business-news/lafarge-sa-agrees-to-pay-r149m-cartel-fine-1.1252519 [Accessed 27 April 2012].
Klee, H., 2002. Towards a Sustainable Cement Industry, Geneva, Swiytzerland: World Business Council for Sustainable Development.
Kok, P. a. C. M., 2006. Migration and urbanization in South Africa., Pretoria 001: Statistics South Africa, Private Bag X44, .
Kosmatka, S. H. a. W. M. L., 2011. Chapter 3. Fly Ash, Slag, Silica Fume, and Natural Pozzolans. In: Design and Control of Concrete Mixtures. Illinois: Portland Cement Association, pp. 57 - 72.
Lafarge, 2010. LAFARGE LICHTENBURG. [Online] Available at: http://www.lafarge.co.za/Lichtenburg_Plant_Brochure.pdf [Accessed 30 November 2012].
Lehrman, R., 1973. Energy Is Not The Ability To Do Work. The Physics Teacher, XI(1), pp. 15-18.
Lawrence Berkeley National Laboratory (USA) and Energy Research Institute (China) , 2008. Guidebook for Using the Tool BEST Cement: Benchmarking and Energy Savings Tool for the Cement Industry. Pennsylvania: U.S. EPA and Dow Chemical Company.
Malhotra, V. a. M. P., 1996. Pozzolanic and Cementitious Materials. s.l.:Gordon and Breach.
MARSH, 2005. Environmental Impact Assessment: PPC PORT ELIZABETH SECONDARY MATERIALS CO-PROCESSING PROGRAMME; The cement manufacturing process, Port Elizabeth: Pretoria Portland Cement.
Merrill Lynch, 2012. PPC, Merrill Lynch Investor Conference. Sun City, Johanessburg, Merrill Lynch Consulting .
Mining Weekly, 2006. New cement-regulation structures. [Online] Available at: http://www.miningweekly.com/print-version/new-cementregulation-structures-2006-08-25 [Accessed 2 October 2012].
Moranville-Regourd, M., 1998. Cement Made from Blastfurnace Slag. P.C. Hewlett (ed.) Lea’s Chemistry of Cement and Concrete, pp. 633-74..
Mqadi, L. W. H. a. K. A., 2005. South Africa beyond Kyoto. Naturvardsverket, 5th February, ISBN 91-620-5446-5(ISSN 0282-7298), pp. 1-33.
Mwakasonda, S., 2012. IPCC guidelines: setting up SA system; SA GHG emission profile. Cape Town: University of Cape Town, MEC 5090Z lectures, May 2012.
NPC, 2010. Sustainable Development Annual Report. [Online] Available at: http://www.npc.co.za/site/files/6599/NPC%20CSI%20Brochure%20final.pdf [Accessed 30 November 2012].

65 Ohanyere, C.I (2012)
NPC, 2013. KZN Top Business Portfolio. [Online] Available at: http://kzntopbusiness.co.za/site/top-business-sector/NPC-Cimpor/page/144 [Accessed 28 November 2012].
OECD, 2001. Environmental Indicators for Agriculture; Methods and Results. Agriculture and fisheries statistics - Agricultural policy indicators, Volume 3, pp. glossary, pp. 389-391.
Otterman, E., 2011. Energy management challenges and opportunities in the South African cement industry, Pretoria: Pretoria Portland Cement (PPC).
Owen, D., 2003. Concrete Jungle. The New Yorker, 10 November, pp. 62-81.
Owens, G. E. A., 2009. Fulton’s Concrete Technology. 9th ed. Johannesburg: Cement and Concrete Institute.
Papadakis, M. a. V. M., 1968. Fabrication et Utilization des Liants Hydrauliques. 2nd ed. s.l.:Papadakis, M. and Venuat, M.
Prevost, X., 2010. South African Coal Resources and Reserves. Johannesburg, s.n.
(PICC), P. I. C. C., 2012. Provincial and Local Government Conference: A summary of the Infratsructure Plan. Pretoria, South Africa, Presidential Infrastructure Coordinating Commission (PICC).
Pieterse, E., 2000. Participatory urban governance: Practical approaches, regional trends, and UMP experiences (Urban Management Programme discussion paper). ISBN 9211314607/92-1-131460-7 ed. Nairobi, Kenya: Published for the Urban Management Programme by UNCHS (Habitat) 2000.
PPC, 2011. Pretoria Portland Cement. [Online] Available at: http://www.ppc.co.za/index.cfm [Accessed 23 September 2012].
Pretoria Portland Cement, 2007. The outlook for South African cement supply and regional demand to 2014. Cape Town, Intercem 2007, Cape Town.
Pretoria Portland Cement, 2010. Built to last. Integrated annual reprt for the year ended 30 September, 2010, Pretoria: Pretoria Portland Cement.
Pretoria Portland Cement, 2007. The outlook for South African cement supply and regional demand to 2014. Cape Town, Intercem 2007, Cape Town.
Regourd, M., 1983. Pozzolanic Activity of Condensed Silica Fume. In: Condensed Silica Fume by Aïtcin, P.C. (ed.) . Quebec: Lés editions de l’Université de Sherbrooke, pp. pp 20-4.
RFF, 2012. Considering a U.S. Carbon Tax: Frequently Asked Questions. [Online] Available at: http://www.rff.org/centers/climate_and_electricity_policy/Pages/Carbon_Tax_FAQs.aspx [Accessed 20 January 2013].
Rinker Materials, 2010. Types of Portland cement, Littleton, Colorado: Info Series.
Sathaye, J. e. a., 2005. Assessment of Energy Use and Energy Savings Potential in Selected Industrial Sectors in India, Berkeley, California: Lawrence Berkeley National Laboratory.
Scott, D., 2003. 'Creative Destruction': Early Modernist Planning in the South Durban Industrial. Journal of Southern African Studies, Vol. 29, (No. 1. (Mar., 2003)), pp. 235-259.
Energy Efficiency and Environmental Performance of the SA Cement Industry 66
Silica Fume Association, SFA. , 2005. Silica Fume User’s Manual, Washington: United States Department of Transport, Federal Highway Administartion, FHWA IF-05-016.
Soares, J. a. T. M. T., 2005. Energy Efficiency and Reduction of CO2 Emissions Through 2015:The Brazilian Cement Industry. Mitigation and Adaptation Strategies for Global, pp. 297–318.
STATS SA, 2012. Census 2011, Pretoria: Statistics South Africa.
Taylor, M. & Tam, C. a. G. D., 2006. Energy Efficiency and CO2 Emission Reduction Potentials and Policies in the cement industry. Paris, International Energy Agency: Energy Technology Policy Division.
The Government of the Republic of South Africa, 2011. National Climate Change Response White Paper, Pretoria: The Government of the Republic of South Africa.
United States Environmental Protection Agency's ClimateWise Program, 1999. Calculating (using cement-based methodology) CO2 Emissions from the Production of Cement. Calculation worksheets. August 2002. Version 1.0. Pennsylvania. (NW Washington): U.S. EPA.
Urban Earth, 2012. SA Carbon emissions breakdown 2009. Urban Earth, 26 January, pp. http://urbanearth.co.za/articles/sas-total-carbon-emissions.
USGS, 2009. U.S Geological Survey, Mineral Commodity Summaries. [Online] Available at: http://minerals.usgs.gov/minerals/pubs/commodity/cement/mcs-2009-cemen.pdf [Accessed 17 August 2012].
USGS, 2010. U.S Geological Survey, Mineral Commodity Summaries. [Online] Available at: http://minerals.usgs.gov/ds/2005/140/cement.pdf [Accessed 17 August 2012].
USGS, 2012. U.S Geological Survey, Mineral Commodity Summaries. [Online] Available at: http://minerals.usgs.gov/minerals/pubs/commodity/cement/mcs-2012-cemen.pdf [Accessed 17 August 2012].
Viljoen, J. & Stapelberg, F. a. C. M., 2010. Technical Report on the Geological Storage of Carbon Dioxide in South Africa, Pretoria: Council for Geoscience.
Walker, A., 2006. Climate Change Mitigation and Clean Development Mechanism in the South African Cement Industry. Pretoria(Tshwane): Gordon Institute of Business Science, University of Pretoria.
WBCSD, 2002. Cement Industry, Geneva, Switzerland: World Business Council for Sustainable Development.
WBCSD, 2002. Toward a Sustainable Cement Industry. Climate Change, Geneva: World Business Council on Sustainable Development.
WBCSD, 2009. Cement Industry Energy and CO2 Performance: “Getting the Numbers Right”, Washington: WBCSD Cement Sustainability Initiative (CSI).
WBCSD-CSI, 2009. Cement Technology Roadmap 2009: Carbon emissions reductions up to 2050, Geneva : WBCSD-CSI.

67 Ohanyere, C.I (2012)
Winkler, H. a. M. A., 2009. Changing development paths: From an energy-intensive to low carbon economy in South Africa. Climate and Development, 8th June, pp. 47-65.
World Energy Council, 1995. Efficient Use of Energy Utilizing High Technology: An Assessment of Energy Use in Industry and Buildings, London: World Energy Council.
Worrell, e. a., 2001. Carbon Dioxide Emissions for the Cement Industry. Annual Review of Energy and the Environment, November, 26(DOI: 10.1146/annurev.energy.26.1.303), pp. 303-329.
WWF, 2008. A blueprint for a Climate Friendly Cement Industry , Gland, Switzerland: World Wildlife Fund.
APPENDIX A
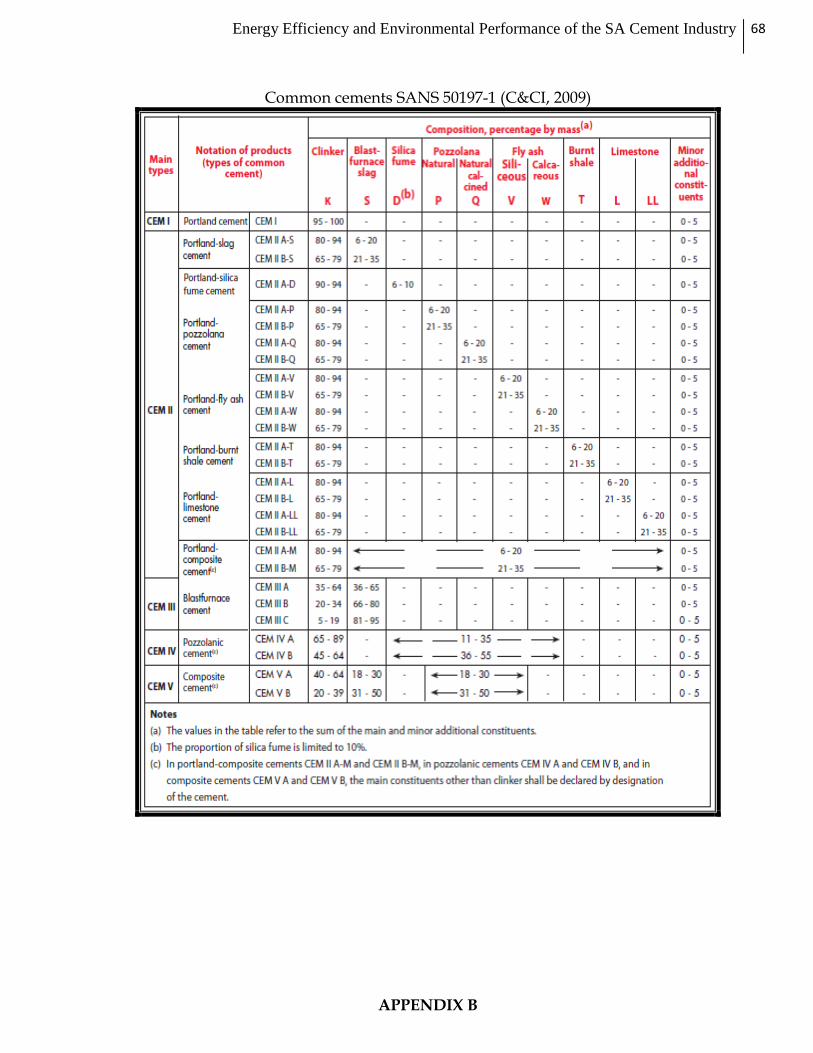
Energy Efficiency and Environmental Performance of the SA Cement Industry 68
Common cements SANS 50197-1 (C&CI, 2009)
APPENDIX B
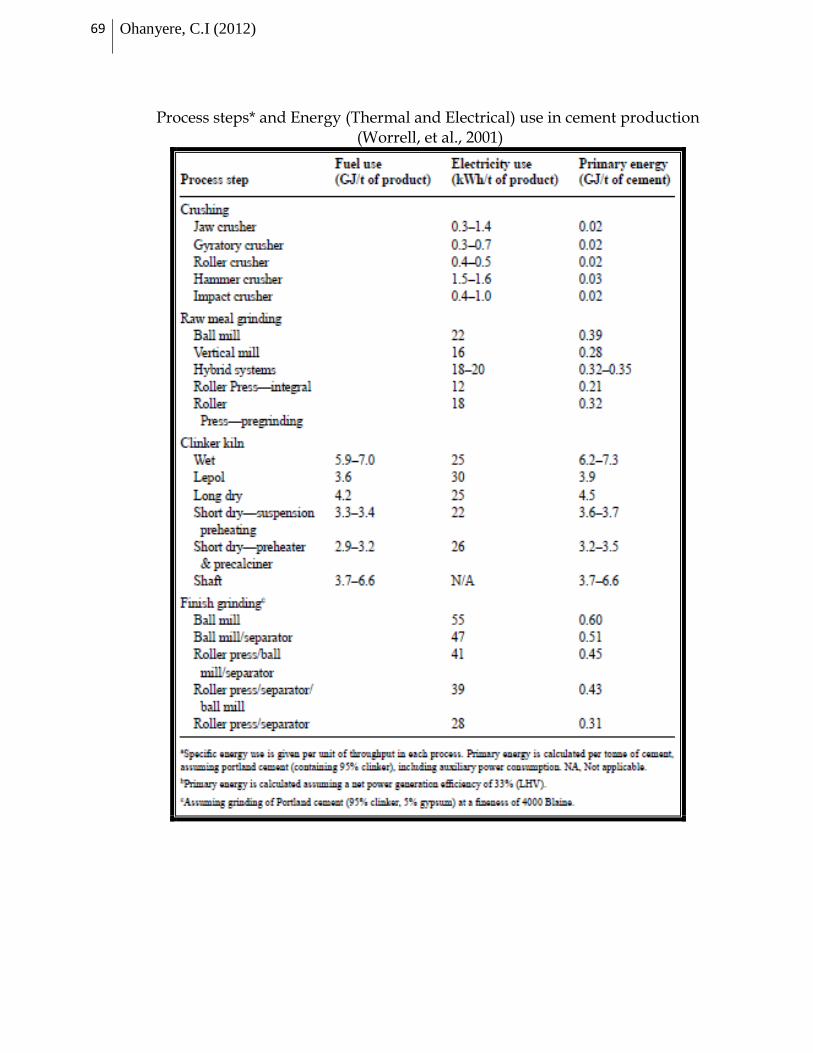
69 Ohanyere, C.I (2012)
Process steps* and Energy (Thermal and Electrical) use in cement production
(Worrell, et al., 2001)