The Solar Energetic Particle Ionic Charge Analyzer (SEPICA
42
1 The Solar Energetic Particle Ionic Charge Analyzer (SEPICA) and the Data Processing Unit (S3DPU) for SWICS, SWIMS and SEPICA 1 E. Möbius, 2 D. Hovestadt, 2 B. Klecker, 1 L.M. Kistler, 1 M.A. Popecki, 1 K.N. Crocker, 3 F. Gliem, 1 M. Granoff, 1 S. Turco, 1 A. Anderson, 2 H. Arbinger, 5 S. Battell, 6 J. Cravens, 1 P. Demain, 1 J. Distelbrink, 1 I. Dors, 1 P. Dunphy, 1 S. Ellis, 1 J. Gaidos, 1 J. Googins, 4 A. Harasim, 1 R. Hayes, 1 G. Humphrey, 1,2 H. Kästle, 2 E. Künneth, 1 J. Lavasseur, 1 E.J. Lund, 1 R. Miller, 7 G. Murphy, 2 E. Pfeffermann, 3 K.-U. Reiche, 1 E. Sartori, 4 J. Schimpfle, 2 E. Seidenschwang, 1 M. Shappirio, 3 K. Stöckner, 1 S.C. Taylor, 1 P. Vachon, 1 M. Vosbury, W. 3 Wiewesiek, 1 V. Ye Abstract The Solar Energetic Particle Ionic Charge Analyzer (SEPICA) is the main instrument on the Advanced Composition Explorer (ACE) to determine the ionic charge states of solar and interplanetary energetic particles in the energy range from ≈ 0.2 MeV/nucleon to ≈ 5 MeV/charge. The charge state of energetic ions contains key information to unravel source temperatures, acceleration, fractionation and transport processes for these particle populations. SEPICA will have the ability to resolve individual charge states and have a substantially larger geometric factor than its predecessor ULEZEQ on ISEE-1 and -3, on which SEPICA is based. To achieve these two requirements at the same time, SEPICA is composed of one high charge resolution sensor section and two low charge resolution, but large geometric factor sections. The charge resolution is achieved by focusing of the incoming ions through a multi-slit mechanical collimator, deflection in an electrostatic analyzer with a voltage up to 30 kV, and measurement of the impact position in the detector system. To determine the nuclear charge (element) and energy of the incoming ions the combination of thin-window flow-through proportional counters with isobutane as counter gas and ion implanted solid state detectors provide for 3 independent ∆ E (energy loss) versus E (residual energy) telescopes. The multi-wire proportional counter simultaneously determines the energy loss ∆ E and the impact position of the ions. Suppression of background from penetrating cosmic radiation is provided by an anti-coincidence system with a CsI scintillator and Si- photodiodes. The data are compressed and formatted in a data processing unit (S3DPU) that also handles the commanding and various automatted functions of the instrument. The S3DPU is shared with the Solar Wind Ion Charge Spectrometer (SWICS) and the Solar Wind Ion Mass Spectrometer (SWIMS) and thus provides the same services for three of the ACE instruments. It has evolved out of a long family of data processing units for particle spectrometers. _______________________ 1 Institute for the Study of Earth, Oceans and Space, University of New Hampshire, Durham, NH 03824 2 Max-Planck-Institut für extraterrestrische Physik, Postfach 1603, D-85740 Garching, Germany 3 1. Institut für Datenverarbeitung, Technische Universität Braunschweig, Postfach 3229, D- 38106 Braunschweig, Germany 4 Fachbereich Elektrotechnik, Fachhochschule Landshut, Am Lurzenhof 4, D-84036 Landshut, Germany 5 Battel Engineering, 10020 North 58th Street, Scottsdale, AZ 85253 6 Cravens Engineering, 1309 Bristol Drive, Iowa City, IA 52240 7 Design Net Engineering, 1968 Mountain Maple Ave., Highlands Ranch, CO 80126
Transcript of The Solar Energetic Particle Ionic Charge Analyzer (SEPICA

1
The Solar Energetic Particle Ionic Charge Analyzer (SEPICA) and the Data ProcessingUnit (S3DPU) for SWICS, SWIMS and SEPICA
1E. Möbius, 2D. Hovestadt, 2B. Klecker, 1L.M. Kistler, 1M.A. Popecki, 1K.N. Crocker, 3F.Gliem, 1M. Granoff, 1S. Turco, 1A. Anderson, 2H. Arbinger, 5S. Battell, 6J. Cravens, 1P. Demain,1J. Distelbrink, 1I. Dors, 1P. Dunphy, 1S. Ellis, 1J. Gaidos, 1J. Googins, 4A. Harasim, 1R. Hayes,
1G. Humphrey, 1,2H. Kästle, 2E. Künneth, 1J. Lavasseur, 1E.J. Lund, 1R. Miller, 7G. Murphy, 2E.Pfeffermann, 3K.-U. Reiche, 1E. Sartori, 4J. Schimpfle, 2E. Seidenschwang, 1M. Shappirio, 3K.
Stöckner, 1S.C. Taylor, 1P. Vachon, 1M. Vosbury, W. 3Wiewesiek, 1V. Ye
Abstract
The Solar Energetic Particle Ionic Charge Analyzer (SEPICA) is the main instrument on theAdvanced Composition Explorer (ACE) to determine the ionic charge states of solar andinterplanetary energetic particles in the energy range from ≈ 0.2 MeV/nucleon to ≈ 5 MeV/charge.The charge state of energetic ions contains key information to unravel source temperatures,acceleration, fractionation and transport processes for these particle populations. SEPICA willhave the ability to resolve individual charge states and have a substantially larger geometric factorthan its predecessor ULEZEQ on ISEE-1 and -3, on which SEPICA is based. To achieve thesetwo requirements at the same time, SEPICA is composed of one high charge resolution sensorsection and two low charge resolution, but large geometric factor sections. The charge resolutionis achieved by focusing of the incoming ions through a multi-slit mechanical collimator, deflectionin an electrostatic analyzer with a voltage up to 30 kV, and measurement of the impact positionin the detector system. To determine the nuclear charge (element) and energy of the incoming ionsthe combination of thin-window flow-through proportional counters with isobutane as countergas and ion implanted solid state detectors provide for 3 independent ∆E (energy loss) versus E(residual energy) telescopes. The multi-wire proportional counter simultaneously determines theenergy loss ∆E and the impact position of the ions. Suppression of background from penetratingcosmic radiation is provided by an anti-coincidence system with a CsI scintillator and Si-photodiodes. The data are compressed and formatted in a data processing unit (S3DPU) that alsohandles the commanding and various automatted functions of the instrument. The S3DPU isshared with the Solar Wind Ion Charge Spectrometer (SWICS) and the Solar Wind Ion MassSpectrometer (SWIMS) and thus provides the same services for three of the ACE instruments. Ithas evolved out of a long family of data processing units for particle spectrometers._______________________1 Institute for the Study of Earth, Oceans and Space, University of New Hampshire, Durham,
NH 038242 Max-Planck-Institut für extraterrestrische Physik, Postfach 1603, D-85740 Garching, Germany3 1. Institut für Datenverarbeitung, Technische Universität Braunschweig, Postfach 3229, D-38106 Braunschweig, Germany4 Fachbereich Elektrotechnik, Fachhochschule Landshut, Am Lurzenhof 4, D-84036 Landshut,Germany5 Battel Engineering, 10020 North 58th Street, Scottsdale, AZ 852536 Cravens Engineering, 1309 Bristol Drive, Iowa City, IA 522407 Design Net Engineering, 1968 Mountain Maple Ave., Highlands Ranch, CO 80126
2
1. Introduction and Scientific Objectives
The ionic charge state Q is an important parameter for deciphering the local conditions at theorigin of energetic particle populations as well as the processes involved in their selection, accel-eration and transport. First direct measurements of the charge state of solar energetic particles inthe energy range of 0.3 - 3 MeV/nucleon were carried out using the Ultra Low Energy Z E Q(ULEZEQ) sensor on the International Sun-Earth Explorers (ISEE-1 and -3) (Hovestadt et al.,1978). More recently the measurements have been extended to higher energies by utilizing theEarth’s magnetic field as a spectrometer with several instruments on the Solar Anomalous andMagnetospheric Explorer (SAMPEX) mission (Mason et al., 1991; Baker et al., 1993; Klecker etal., 1993). These approaches have allowed the determination of average charge states in solar cos-mic rays (Hovestadt et al., 1981), interplanetary accelerated particles (Hovestadt et al., 1982) andthe confirmation that anomalous cosmic rays (ACR) are mostly singly charged (Klecker et al.,1995). However, questions concerning the detailed charge state and/or individual physical proc-esses involved have been left open because of either the lack of individual charge state resolutionor poor counting statistics.
1.1 Solar Energetic Particles
Over the last decade it has been recognized that solar energetic particle events (SEP) can betraced back to basically two classes of solar flares. Impulsive flares are characterized by shorttime scale (several minutes) electromagnetic (radio and X-ray) emission, generally low fluxes ofenergetic particles in interplanetary space, a high electron to ion ratio, and substantialenhancements in the abundances of heavy ions and 3He over 4He (Mason et al., 1986; Reames,1990). Gradual solar flares are accompanied by long duration radio emissions that are generallyassociated with shocks in the corona and emit high fluxes of energetic particles with a lowelectron to ion ratio and abundances that reflect normal solar corona conditions (e.g. Reames,1992). It is assumed that the ionic charge state of energetic ions from these flares carries theinformation on the coronal temperature within the flare site, because the charge stae is quicklyfrozen in during the acceleration process and the column density of matter between the sun andthe observing spacecraft is very low. It is common to deduce a coronal temperature from themeasured average charge state assuming ionization equilibrium (e.g. Arnaud and Rothenflug,1985).
The average charge state of heavy ions during impulsive 3He-rich flares has been found to re-flect temperatures of the order of 107 K (Klecker et al., 1984; Luhn et al., 1987). However, be-cause of the low energetic ion fluxes during these events only average values over the full comple-ment of events during the entire observation period could be obtained. At this point it is notknown whether the relatively wide charge distribution that has been seen is due to substantialvariations from event to event or is a real feature during individual events. Clearly the collectingpower of a charge sensitive instrument has to be substantially increased in order to allow adetailed study of individual impulsive events in order to make progress on local heating andselective acceleration processes prevalent in these flares.
Contrary to the impulsive flares, gradual events exhibit charge states that reflect substantiallylower temperatures in the neighborhood of 1 - 2 . 106 K (Hovestadt et al., 1981). In addition, dif-ferent species seem to indicate different temperatures. Attempts to explain these variations interms of non-thermal conditions in the flare site or through interaction of the accelerated particles

3
with coronal material have been unsuccessful (Luhn et al., 1984). In the most promisinginterpretation Mullan (1986) suggested that heating and ionization in flares through local X-raygeneration plays a role. In order to study the significance of such processes on the ionic chargestates it is necessary to narrow the measurements down on individual charge states, since thiswill allow a much more precise deconvolution of the energy distribution of the electrons and/orX-rays that have produced the observed charge states. The goal requires a substantialimprovement in the charge state resolution over previous instruments.
1.2 Interplanetary Accelerated Particles
Two types of interplanetary accelerated particles have been observed, ion populationsassociated with corotating interaction regions (CIR), where high and low speed solar windstreams meet, and coronal mass ejection (CME) related particle events, where acceleration occursat the corresponding shock waves. During the operational phase of the ISEE instrument (aroundsolar maximum) no good signatures of CIRs were observed. In CME related events charge stateswere found that are basically compatible with the charge states in gradual solar flare particlepopulations (Hovestadt et al., 1982). It came as a surprise that a class of apparentlyinterplanetary events, i.e. events that could not be correlated with solar flare activity, wasdetected that had an unusually high abundance of He+ (Hovestadt et al., 1984). No accompanyinglow charge state heavy ions were found beyond the detection threshold of the instrument. Morerecently Gloeckler et al. (1994) have pointed out that the high He+/He2+ ratio observed by ISEEmay be produced by the acceleration of interstellar pickup ions at interplanetary shocks. Withtheir wide velocity distribution these ions may present a source population for very efficientfurther acceleration in interplanetary space (Möbius et al, 1985). To delineate the sourcedistributions of CIRs and CME related energetic particle events again a larger collecting power ofthe instrument is needed.
1.3 Anomalous Cosmic Rays
The anomalous cosmic rays are thought to be a final product after pickup of interstellar ionsand their acceleration at the heliospheric termination shock (e.g. Fisk et al., 1974; Jokipii, 1986).With the SAMPEX mission it has been well established now that these ions are indeed mostlysingly charged (Klecker et al., 1995). However, the measurements using the cut-off rigidity in theEarth’s magnetic field have been restricted to energies > 8 MeV/nucleon. A low background largegeometric factor instrument for ionic charge state determination will be able to extend theseresults to the lower end of the ACR spectrum.
1.4 Instrument Performance Requirements
Within a complement of high-resolution spectrometers to measure the composition of solar,local interstellar, and galactic cosmic ray material on the Advanced Composition Explorer (ACE)(Stone et al., 1998a) the SEPICA instrument is the prime sensor for the determination of thecharge state distribution of energetic particles. Its basic design requirements are to measure theionic charge state, Q, the kinetic energy, E, and the nuclear charge, Z, of energetic ions in theenergy range 0.2 - 3 MeV/Nuc for elements H through Fe. As a consequence of the scientificobjectives listed above several substantial improvements over previous instrumentation arerequired. The need to resolve individual charge states at least in gradual flares for species such asoxygen and carbon requires a charge state resolution ∆Q/Q ≤ 0.1 over a substantial energy range.For practical reasons charge resolution is limited towards higher energies. Therefore, we adopt a

4
goal for single charge state resolution up to ≈ 1 MeV/charge. Since 3He-rich flares are to bestudied, SEPICA also needs to separate isotopes for low mass number species, in particular 3Heand 4He. On the other hand these impulsive flares as well as CIRs and ACR are known for lowparticle fluxes. In order to accumulate data with sufficient counting statistics a substantially largergeometrical factor than SEPICA’s predecessor, the ULEZEQ sensor on ISEE-1 and -3, isnecessary. To improve on previous measurements by at least one order of magnitude, we adopt ageometric factor of ≥ 0.2 cm2sr. For the very low fluxes in CIRs and ACR the large geometricfactor must be accompanied by a low background susceptibility.
It should be pointed out here that generally the two requirements of a) higher charge stateresolution and b) larger geometric factor are mutually exclusive, if an instrument of the same sizeand with the same resources is to be built. To achieve higher resolution with any deflection tech-nique a collimation to a smaller acceptance angle range has to be chosen, which in turn leads to areduced collecting power of the sensor. Therefore, the SEPICA sensor is significantly larger thanthe ULEZEQ sensor, and we have chosen a modular approach with three individual fans thatallows a separate optimization of these competing goals in individual sensor sections.
We start this paper with the principles of operation in chapter 2, followed by thedescription of the SEPICA sensor subsystems in chapter 3. The sensor electronics and theinternal data selection and processing are described in chapter 4 followed by the sensorcalibration and performance in chapter 5. The supporting subsystems, such as high voltagegeneration and gas regulation are presented in chapter 6. The mechanical packaging and thermalaspects are covered in chapters 7 and 8. The description of the common data processing unit(S3DPU) for SWICS, SWIMS and SEPICA that has been designed and built by the TechnischeUniversität Braunschweig (TUB) under guidance of the University of New Hampshire (UNH) isincluded in this paper in the concluding chapter 9. It should be noted that several subsystemsprovided challenges which were met with novel designs that have pushed technical limits. Thesetechnical aspects are covered in the corresponding chapters. For example, the design of the highprecision collimator system and the integration of many electrical feedthroughs into the ceramicframes of the multi-wire proportional counter are described in chapter 3. A novel arrangement fora 30 kV supply and the first use of micro-machined bi-metallic valves in the isobuthane gas flowsystem are presented in chapter 6. Thus the paper combines the functional description of theSEPICA instrument with a reflection on how some of its biggest technical challenges were met.
2. Principles of Operation and Basic Design
To simultaneously determine the energy E, nuclear charge Z and ionic charge Q of incomingparticles the SEPICA sensor combines several different measurement methods. The analysis ofeach ion starts with the determination of the electrostatic deflection of incoming ions in a collima-tor-analyzer assembly. Then the energy loss and the residual energy are measured in a dE/dx - Etelescope. Potential background from penetrating radiation is suppressed by the use of an anti-coincidence detector. The instrument is based on the general design of the ULEZEQ sensor flownon the ISEE spacecraft (Hovestadt et al., 1978).
5
2.1 Measurement Methods
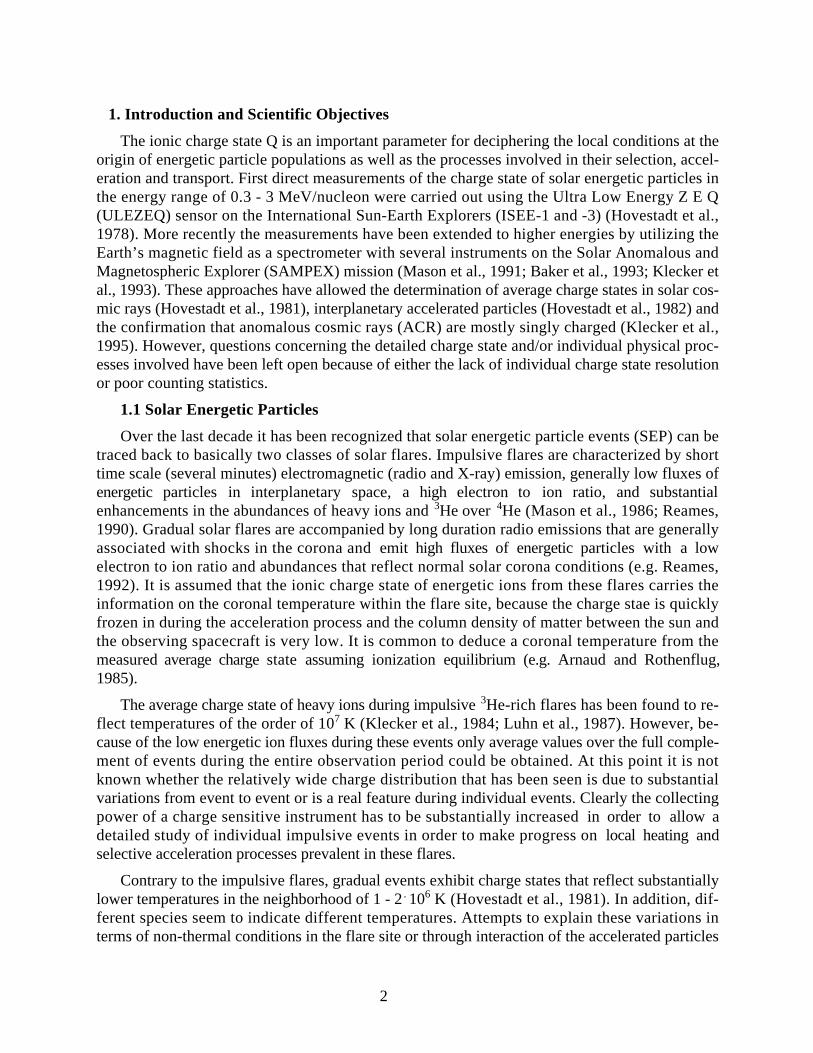
SEPICA consists of three independent sensor units, called “fans”. Each of the three fans issymmetric about the plane with the high voltage deflection plate. A schematic view of oneindividual sensor unit is shown in Fig. 2.1 together with the basic measuring principles. Shown isa single side of one SEPICA fan. Energetic particles enter a multi-slit collimator, which selectsthose incoming particles that target a narrow line in the detector plane (indicated by F, the “focalline”). They are electrostatically deflected between a set of electrode plates. The curved plate ison ground potential, while the flat center plate is supplied with a positive high voltage up to 30kV (to be set by telecommand). In Fig. 2.1 a pair of undeflected ion trajectories (full lines) isshown along with a pair of deflected trajectories (dashed lines). The deflection, which is inverselyproportional to energy per charge, E/Q, is determined in a multi-wire thin-window proportionalcounter. The proportional counter is also used to measure the specific energy loss dE/dx of theions, which depends on the energy E and the nuclear charge Z of the particle. Finally, the residualenergy of the particle, ERes, is directly determined in a silicon solid-state detector (SSD). An anti-coincidence system covers the rear side of each detector assembly to suppress background signalsfrom penetrating high energy particles. This is of particular importance for the study of lowfluxes in weak solar events and during quiet times. It consists of a CsI scintillator which is viewedby silicon photodiodes.
CsI
+30 kV
0 V
Collimator
Deflection Plates
Proportional Counter
Solid State DetectorAnticoincidence
Energy Loss∆E
Residual EnergyERes
Position ∆y
ZZ EE totaltotal
E/Q
ScintillatorPhotodiodes
Electrostatic Analyzer
CsI
F
Fig. 2.1: Schematic view and principles of operation of the SEPICA instrument.
6
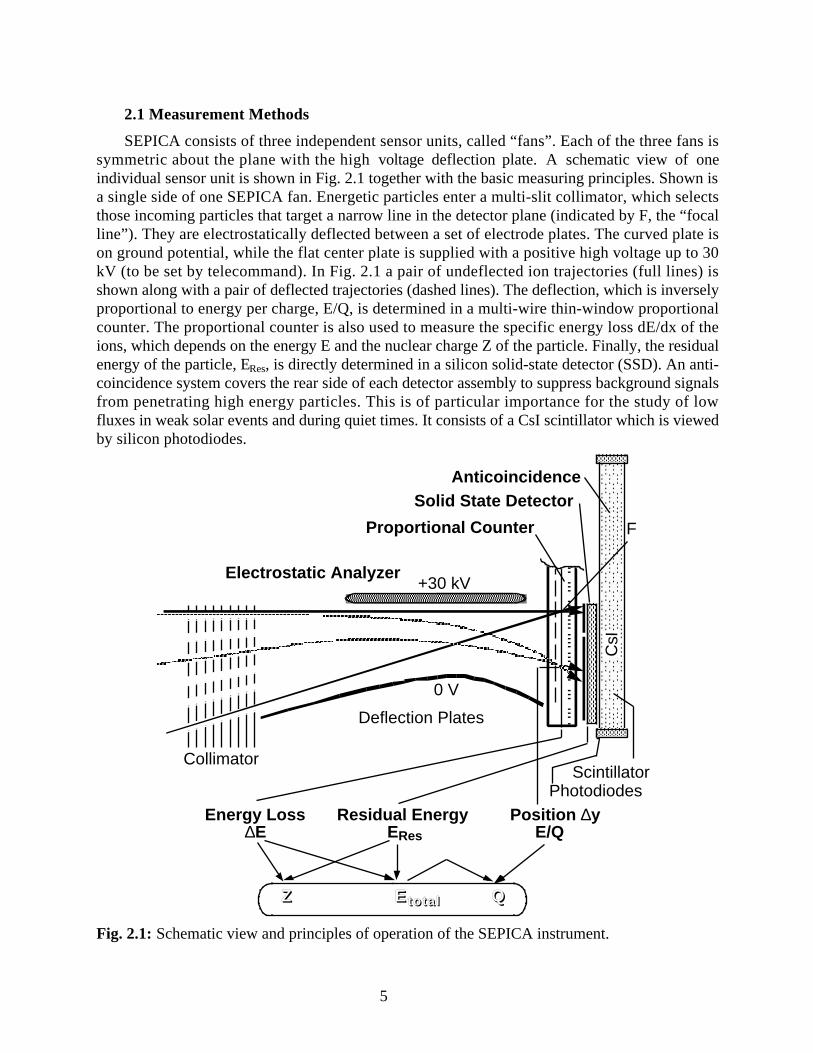
The identity of each incoming ion is determined in two consecutive steps that are illustratedin Fig. 2.2. For energies above approximately 1 MeV/nucleon the specific energy loss dE/dx ofions can be approximated by the relation
dE/dx = β . Z2(E/A)α (2.1)
i.e. it is only a function of the nuclear charge Z and the energy/mass E/A, where A denotes theatomic mass number. α is negative and of the order of 1, i.e. the energy loss falls with increasingenergy. β is a constant that summarizes the effects of the target gas in the proportional counter.Below 1 MeV/nucleon partial recombination in the interaction with the target material reduces theeffective charge of the ion to values Z* < Z so that the specific energy loss decreases withdecreasing energy. Therefore, the typical dE/dx versus ERes curves in the left panel of Fig. 2.2have a maximum at ≈ 1 MeV/nucleon. Because the energy loss is a function of energy/mass (E/A)and not of total energy the curves for different isotopes of the same element are separated bytheir total energy according to the isotope mass A as indicated for He.
Etotal = (E/A)*A (2.2)
∆E i
n ke
V
∆y in
mm
10 0
10 1
10 2
10 3
10 4
10 -1 10 0 10 1 10 2 10 3 10 4
∆E versus ERes
3He
4He
H
O
Fe
∆ E i
n ke
V
ERes in MeV
Etotal in MeV0.1 1 10
10
3
30
∆ y in
mm
He+
He2+
Fig. 2.2: Energy loss (∆E) versus residual energy (ERes) curves for H, 3He, 4He, O, and Fe(background panel). After selection of one element or isotope curve (here 4He) the charge statescan be separated from their deflection ∆y in the electrostatic analyzer (foreground panel).
This leads to a differentiation in the measured residual energy ERes, and thus isotopes can be iden-tified with SEPICA for low Z ions, such as He. The final parameters for the sensor are obtainedin calibration. The same method for the determination of elements and isotopes at higher energies(> 10 MeV/nucleon) is used in the Solar Isotope Spectrometer (SIS) (Stone et al., 1998b) and theCosmic Ray Isotope Spectrometer (CRIS) (Stone et al., 1998c) on ACE.
7
With the knowledge of the species the measured residual energy can now be corrected for theaccumulated energy loss effects in the sensor according to
Etotal = ERes + ∆EWindow + ∆EPC + ∆ESSD (2.3)
where ∆EWindow is the energy loss in the front and rear windows of the proportional counter, ∆EPC
is the loss in the counter gas which includes contributions from additional dead layers in thecounter, and ∆ESSD is the loss in the entrance layers of the solid state detector. All these contribu-tions are determined in sensor calibrations with radioactive sources and at particle accelerators.According to
Q = (Q/E)*Etotal (2.4)
the ionic charge state can be computed by combining the total energy (E) with the energy/charge(E/Q) as derived from the deflection Y of the ions in the electrostatic analyzer voltage Udefl
Y = δ . Udefl . Q/E (2.5)
where δ is a sensor constant that depends on the size and geometry of the analyzer. SEPICA hasbeen designed so that a typical deflection of 10 mm is achieved for 1 MeV/charge ions with adeflection voltage of 30 kV. The spread of charge states for a selected ion species is sketched inthe right panel of Fig. 2.2. The charge resolution is reduced with increasing energy. The determi-nation of average ionic charge states can still be achieved up to ≈ 5 MeV/charge. The ion speciesand energy can be derived for all ions that are stopped by the SSD.
2.2 Design Goals and Capabilities
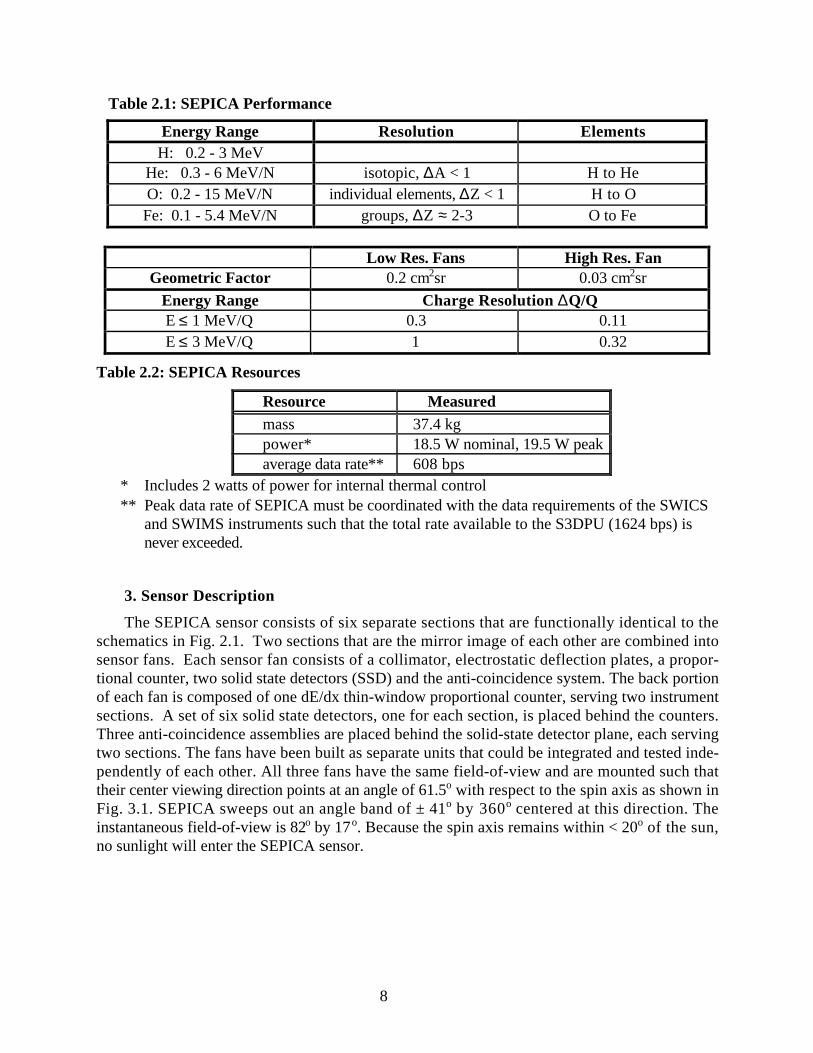
The instrument capabilities of SEPICA are compiled in Table 2.1. The capability of SEPICAto resolve details of the ionic charge states is restricted to the energy range between 0.5 and 3MeV/charge, with determination of the average charge state up to ≈ 5 MeV/charge. Over a widerenergy range (e.g., up to about 6 MeV/nuc for Fe and O) element identification with energydetermination will be possible. For SEPICA two specific goals were set: For energies ≤ 1MeV/charge a resolution ∆Q/Q ≤ 0.1 (FWHM) should be achieved. On the other hand theinstrument should have a total geometric factor of at least ≈ 0.2 cm2sr.
In order to achieve the two seemingly mutually exclusive goals, i.e. to provide high sensitiv-ity for the study of small solar energetic particle (SEP) events and to reach high charge stateresolution to resolve individual charge states, SEPICA has been subdivided into three nearlyindependent sensor fans. The detector systems, their respective electronics, and the electrostaticanalyzer are identical for all three fans. However, there are two different versions of the entrancecollimator. Two fans are identical in the geometry of the slit collimator and have a combined geo-metric factor of about 0.2 cm2sr, which is sufficient in the expected counting rate for even smallSEP events such as 3He-rich solar flares. The third fan has a slit system, whose open width isnarrower by a factor of three, in order to allow for a charge resolution which is higher by a factorof three. As a result, the geometrical factor of this fan is reduced to ≈ 0.03 cm2sr. Therefore, thesensitivity of this portion will be sufficient only during relatively large SEP, CME, and CIRevents, when the particle fluxes are high or when a long accumulation time is possible. With thesecapabilities SEPICA is greatly improved (in both sensitivity and charge resolution) over itspredecessor, the ULEZEQ sensor on ISEE-1 and -3. The required resources are compiled in Table2.2.
8
Table 2.1: SEPICA Performance
Energy Range Resolution ElementsH: 0.2 - 3 MeV
He: 0.3 - 6 MeV/N isotopic, ∆A < 1 H to HeO: 0.2 - 15 MeV/N individual elements, ∆Z < 1 H to OFe: 0.1 - 5.4 MeV/N groups, ∆Z ≈ 2-3 O to Fe
Low Res. Fans High Res. FanGeometric Factor 0.2 cm2sr 0.03 cm2sr
Energy Range Charge Resolution ∆Q/QE ≤ 1 MeV/Q 0.3 0.11E ≤ 3 MeV/Q 1 0.32
Table 2.2: SEPICA Resources
Resource Measuredmass 37.4 kgpower* 18.5 W nominal, 19.5 W peakaverage data rate** 608 bps
* Includes 2 watts of power for internal thermal control** Peak data rate of SEPICA must be coordinated with the data requirements of the SWICS
and SWIMS instruments such that the total rate available to the S3DPU (1624 bps) isnever exceeded.
3. Sensor Description
The SEPICA sensor consists of six separate sections that are functionally identical to theschematics in Fig. 2.1. Two sections that are the mirror image of each other are combined intosensor fans. Each sensor fan consists of a collimator, electrostatic deflection plates, a propor-tional counter, two solid state detectors (SSD) and the anti-coincidence system. The back portionof each fan is composed of one dE/dx thin-window proportional counter, serving two instrumentsections. A set of six solid state detectors, one for each section, is placed behind the counters.Three anti-coincidence assemblies are placed behind the solid-state detector plane, each servingtwo sections. The fans have been built as separate units that could be integrated and tested inde-pendently of each other. All three fans have the same field-of-view and are mounted such thattheir center viewing direction points at an angle of 61.5o with respect to the spin axis as shown inFig. 3.1. SEPICA sweeps out an angle band of ± 41o by 360o centered at this direction. Theinstantaneous field-of-view is 82o by 17o. Because the spin axis remains within < 20o of the sun,no sunlight will enter the SEPICA sensor.

9
± 41o
61.5o
Spin Axis(within < 20o of the Sun)
SEPICA
Spacecraft Deck
Fig. 3.1: Schematic of the orientationand the field-of-view of the SEPICA sensor on the ACEspacecraft.
3.1 Electrostatic Analyzer Sections
One geometrically flat, positive high voltage plate (nominally at 30 kV) is employed for twoneighboring instrument sections. When the high voltage is applied, the particles, which are origi-nally passively collimated by the entrance collimator towards the focus "F" (in Fig. 2.1), will bedeflected towards the curved ground-plates in each section. The high voltage plate has beendesigned as a hollow Ultem structure which is sandwiched between two 0.5 mm Al plates. It hasbeen plated with a sequence of Cu and Au plating. At the ends the plate is thickened to minimizeedge effects and to allow the Ultem insulator mounting and thus the very sensitive high voltagetriple conjunctions (between conductor, insulator and vacuum) to be recessed into a low electricfield region. The 30 kV HV cable is inserted through the insulating mounting into the center of theplate, so that the physical connection is made in the interior which is a perfect equipotentialregion. This connection also contains a 40 MΩ resistor that filters the remaining ripple of the HVsupply together with the intrinsic capacitance of the analyzer of 40 pF.

10
2a
2
v
v cos Θ Θ
Focal Plane
+30 kV
ground
v1 z
y
Fig. 3.2: Top view and cross-sectional view of electrostatic analyzer and sample trajectories. Thetrajectory of the projection 2a of trajectory 2 is the same as that of 1, if only the projection of theion velocity of 2 is considered.
The collimator consists of a flat stack of plates which produces a well-defined focal line inthe detector plane. The deflector plates are trapezoid shaped. The geometry is shown in Fig. 3.2together with sample ion trajectories. As a consequence of the flat collimator-analyzer geometryincoming particles with the same velocity vo perpendicular to the detector plane are deflected bythe same amount. Therefore, a correction has to be applied to ions that enter the sensor at obliqueangles, but with the same total energy. This necessitates the determination of the incoming angleΘ in the plane parallel to the deflection plate. For the computation of the ionic charge Q theenergy component perpendicular to the detector plane
E⊥ = E . cos2Θ (3.1)
11
is used, where E represents the total energy of the incoming ion that is actually measured in thesensor. The angle Θ is determined with two position measurements in the z-direction (parallel tothe deflection plate) of the instrument.
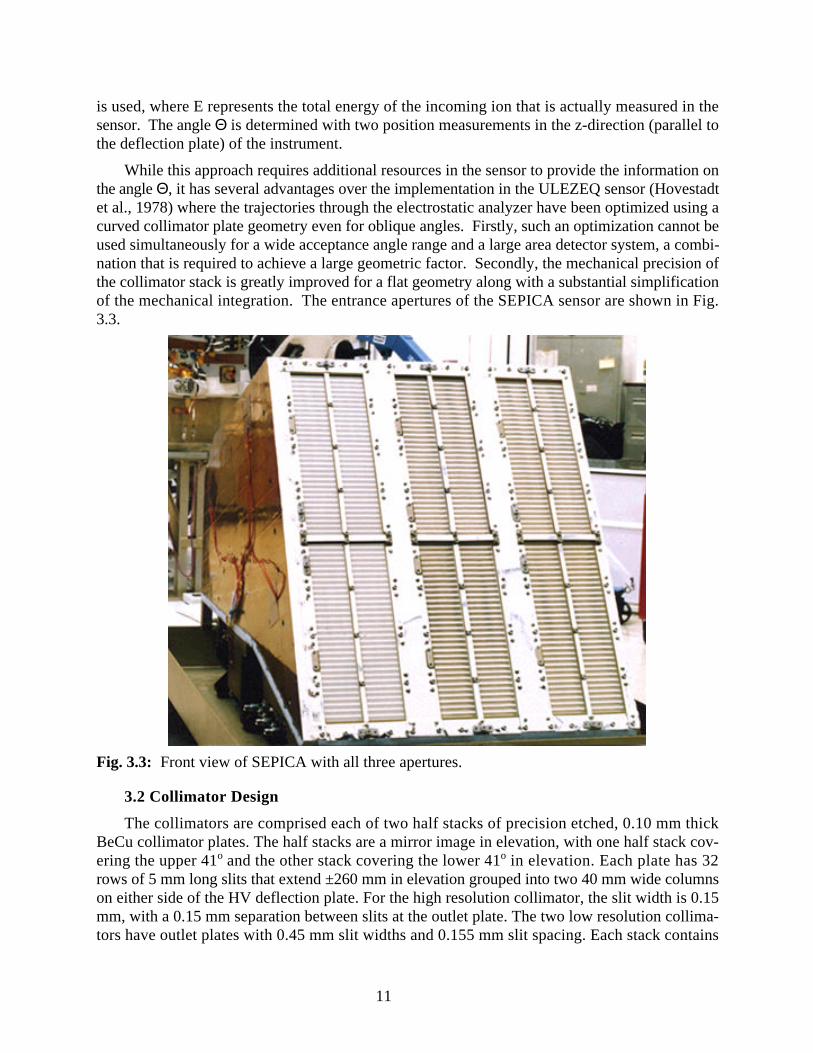
While this approach requires additional resources in the sensor to provide the information onthe angle Θ, it has several advantages over the implementation in the ULEZEQ sensor (Hovestadtet al., 1978) where the trajectories through the electrostatic analyzer have been optimized using acurved collimator plate geometry even for oblique angles. Firstly, such an optimization cannot beused simultaneously for a wide acceptance angle range and a large area detector system, a combi-nation that is required to achieve a large geometric factor. Secondly, the mechanical precision ofthe collimator stack is greatly improved for a flat geometry along with a substantial simplificationof the mechanical integration. The entrance apertures of the SEPICA sensor are shown in Fig.3.3.
Fig. 3.3: Front view of SEPICA with all three apertures.
3.2 Collimator Design
The collimators are comprised each of two half stacks of precision etched, 0.10 mm thickBeCu collimator plates. The half stacks are a mirror image in elevation, with one half stack cov-ering the upper 41o and the other stack covering the lower 41o in elevation. Each plate has 32rows of 5 mm long slits that extend ±260 mm in elevation grouped into two 40 mm wide columnson either side of the HV deflection plate. For the high resolution collimator, the slit width is 0.15mm, with a 0.15 mm separation between slits at the outlet plate. The two low resolution collima-tors have outlet plates with 0.45 mm slit widths and 0.155 mm slit spacing. Each stack contains
12
13 etched plates that are separated by precision thickness (± 0.025 mm tolerance) aluminum andmagnesium spacer plates for a total stack thickness of 40 mm. The collimators are assembled byplacing alternating layers of BeCu and spacer plates onto three precision 3/16” stainless steeldowel pins protruding from an 8 mm thick aluminum mounting plate. Alignment is accomplishedby gently pushing (with silicone rubber faced right angle blocks) the edges of the plates so thatthe slots become tangent with the three pins. An aluminum clamping plate is placed over the inletetched plate to uniformly clamp the stack, and to couple the upper and lower half stackstogether.
The collimator assemblies achieve nearly zero alignment tolerance by placing the majority ofthe burden on the etching and machining precision, in lieu of some elaborate alignment scheme.By direct CAD file transfer errors in graphics interpretation were avoided. Further, by holdingthe etching vendor (Tecomat) to ±0.01 mm locational and size tolerances for the slits, and ±0.005 mm for the alignment slots, the plates established a new benchmark in precision wet etch-ing. Combining these break throughs in etching tolerance with CNC drilling of the mounting platepin holes, and careful (perpendicular) installation of the screened (size and straightness) dowelpins, assembly was possible with only 0.013 mm clearance about the alignment pins. This clear-ance represented less than 10% of the critical spacing between adjacent slits for both the high andlow resolution outlet plates. Clearly the bulk of the alignment was designed and fabricated in theparts.
3.3 Multi-Wire Proportional Counters
Three geometrically flat, multi-wire, dE/dx proportional counters are used, each serving twoinstrument sections in a single sensor fan. The proportional counters serve several purposes inthe SEPICA sensor:
1) They are used to determine the specific energy loss dE/dx of the incoming ions in the countergas. This signal is taken from the central anode wire plane of the counter, whose wires are allinterconnected and to which a positive bias voltage is applied. The dE/dx signal is also used asthe master trigger signal for the electronic readout and event identification circuits of theinstrument.
2) In the two cathode layers between which the anode plane is sandwiched the position of thepenetrating ion is determined in two dimensions. The cathode wires are grouped in bands ofseven wires each that are read out by individual signal channels. In the front cathode the posi-tion in the y-direction, i.e. the direction of electrostatic deflection, is determined. In the rearcathode the position in z is determined. Together with another z-measurement in the solidstate detectors the incoming angle Θ of the ions in elevation is derived.
Such a multi-wire proportional counter has been successfully flown as an imaging detector for X-ray astronomy in the focal plane of the Wolter telescope on the German X-ray satellite ROSAT(Pfeffermann et al., 1987). In order to achieve optimum position resolution the center anodeplane of the counter is the focal plane of the collimator.
- Energy-loss determination
The energy loss of the ions in the counter depends on the gas density and the thickness ofthe gas layer. The ions lose energy mainly due to ionizing collisions with electrons. The result-ing charge of the ion-electron pair production is proportional to the total energy loss. The

13
counter is operated in its proportional regime, i.e. a constant gas amplification of this charge sig-nal is achieved by electron multiplication in the increased electric field close to the anode wires.The anode wires are 10 µm diameter tungsten wires, separated from each other by 2 mm. Withan isobutane filling of nominally 20 Torr and an operational voltage of 1000 - 1100 V an amplifi-cation by ≈ 100 is achieved.
- Position measurement
The position of an incoming ion is determined by the localization of the charges at the anode.Therefore, the anode has been chosen as the focal plane. The charges are concentrated on only afew anode wires. However, the image charges of the electron signal produced on both cathodesand the ion clouds that migrate from the anode to the cathodes are distributed over several adja-cent wire strips in both cathode planes, as is depicted in Fig. 3.4. As a result a charge distributionis recorded whose width is comparable to the anode cathode separation distance. The cathodesconsist of 50 µm stainless steel wires with a pitch of 0.5 mm, grouped into signal strips of eightwires each (3.5 mm wide and 0.5 mm apart). This configuration produces an optimum positionresolution for the counter geometry. The charge clouds are typically distributed over five suchstrips. The position is derived from the center of gravity of the distribution. In the front cathodethe position in the direction of the electrostatic deflection (y-direction) is determined, while in therear cathode the position along the focal line (z-direction) is measured.
0 10-10 Position in mmCathode 2
Anode
Cathode 1Charge Distribution
Charge distribution at cathode 2
z1
y
Fig. 3.4: Distribution of charged particles generated by an ion that penetrates the proportionalcounter. The position is determined from the center of gravity of the distribution over fiveadjacent cathode wire strips (3.5 mm width and 0.5 mm separation) on both cathode 1 and 2.

14
- Counter assembly
The proportional counters are sealed volumes through which isobutane is flowing at a con-stant rate such that an operational pressure of ≈ 20 Torr is maintained. In order to minimize thebuildup of carbon compounds from the isobutane on the anode wires during operation the gas iscompletely exchanged every 4 hours. In addition, care has been taken in the choice of materials inthe counter volume and plumbing. Further an admixture of 2% methanol reduces the destructionof isobutane molecules under radiation (Va’vra, 1986).
Because the SSDs are mechanically separated from the counters, two windows (front andrear) are needed to close the volume. In order to minimize the energy loss of the incoming parti-cles in the windows they had to be made as thin as possible while still providing a sufficient mar-gin for the differential pressure applied. In addition, a conducting surface was necessary to pro-vide equipotential surfaces inside the counter volume. Polyimide windows with a thickness of 0.5µm and a 500 Å Al layer on an Al frame with a stainless steel support grid, supplied by LuxelCorp., Friday Harbor, WA, was used for this purpose. This allowed a significant reduction of theenergy loss in the windows compared with the 450 µg/cm2 Ni window of the ISEE ULEZEQsensor, although SEPICA needs two windows. As an illustration for this improvement take theenergy loss of 4He at 0.34 MeV/nucleon, the low energy threshold for He with ULEZEQ: theloss in the combination of both polyimide windows is 0.24 MeV compared with 0.34 MeV in thesingle Ni window. Together with a 20 mm column of isobutane at 20 Torr in the counter a reduc-tion of the total energy loss by 40% over that of ULEZEQ has been achieved which allows a sig-nificant reduction of the low energy threshold for SEPICA.
The windows have withstood a pressure of up to 60 Torr without a sign of permanentstretching. Much higher overpressures could be applied without rupture. The danger of destruc-tion due to micrometeorites is very low. Due to the presence of the slit collimator in front of theproportional counter the probability of damage to the windows from micrometeorite impactduring a 5 year mission lifetime is estimated to be <0.5%.
The counter design requires one anode plane and two cathode planes with 10 µm and 50 µmwires exactly spaced by 2 mm and 0.5 mm, respectively. The wires are placed on structural Ma-cor frames on a custom made precision winding machine, then bonded in place with adhesive andsoldered to metal traces. The challenge in this configuration is to carry the signal lines from thecathode plates out to the support electronics while maintaining the pressure volume integrity. Inthe ROSAT counter the anode and cathode plates were placed within the gas volume thereby re-quiring a containment vessel and additional signal feedthroughs. With SEPICA, to allow threecounter systems close to each other and to minimize the instrument size and mass, the novelapproach of integrating the containment and the signal feedthroughs into the counter plates wasundertaken. Therefore, the assembly of the counter is broken into six primary component layerswith O-ring seals between each of them: the inlet and outlet thin film windows on Al frames, agas interface plate made from Ultem, the front and rear cathode plates, and the center anode plate,all three of them made from Macor.
The biggest challenge was introduced by the need to hermetically seal 21 electricfeedthroughs in each cathode plate. In the SEPICA counter design this was achieved by devel-oping “Surface Trace Feedthroughs” in cooperation with Ceramic-to-Metal Seals, Melrose MA.Signal line feedthroughs were fabricated into the surface of the Macor cathode plates by firstmilling shallow pockets into the Macor, filling the pockets with Dupont Silver #1773, firing the
15
metallization, and then grinding the surface until the traces and Macor are flush. The bondbetween the Macor and metallization is virtually leak tight, and the resulting surface finish aftergrinding is O-ring seal quality. The surface traces are solderable in their fired state (2% Ag solderrequired), allowing the cathode wires to be soldered inside the O-ring envelope, and the electron-ics interface connector to be soldered outside the envelope. The remaining single 2 kVfeedthrough for the anode plate is a more conventional single O-ring seal with a Ni plated Ti con-ductor compressing a small O-ring in a reamed bore in the anode plate.
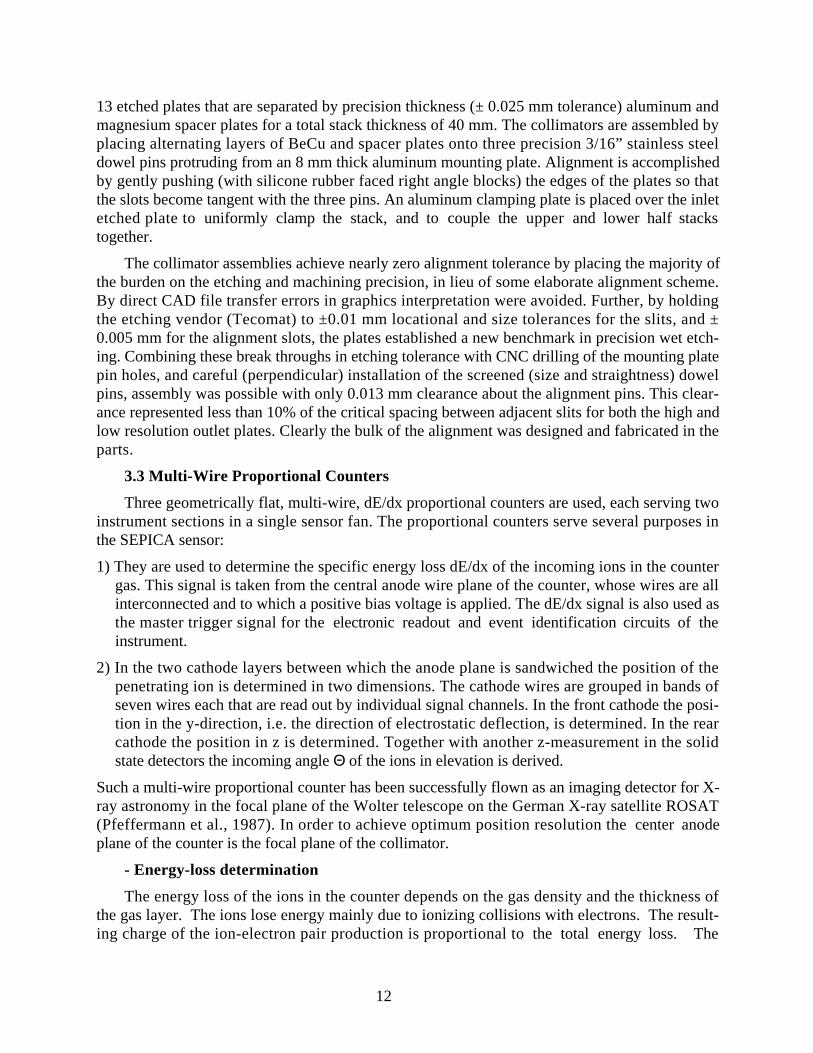
The assembly is integrated from the anode plate outward, i.e., each cathode plate is fastenedseparately with approximately 20 vented cap screws to the anode plate. A custom 1 mm crosssection Buna-N O-ring is placed between each plate to form the seal. The Ultem 1000 gas plate isfastened to the front cathode. The inlet and outlet windows are attached to the gas plate and theback of the second cathode, respectively. A proportional counter assembly is shown in Fig. 3.5.
Fig. 3.5: SEPICA proportional counter assembly, as seen from the front side. The gas in- andoutlet are on the left. In the Fan assembly the center bar of the window support is located exactlybehind the HV deflection plate of the electrostatic analyzer.
3.4 Solid-State Detectors
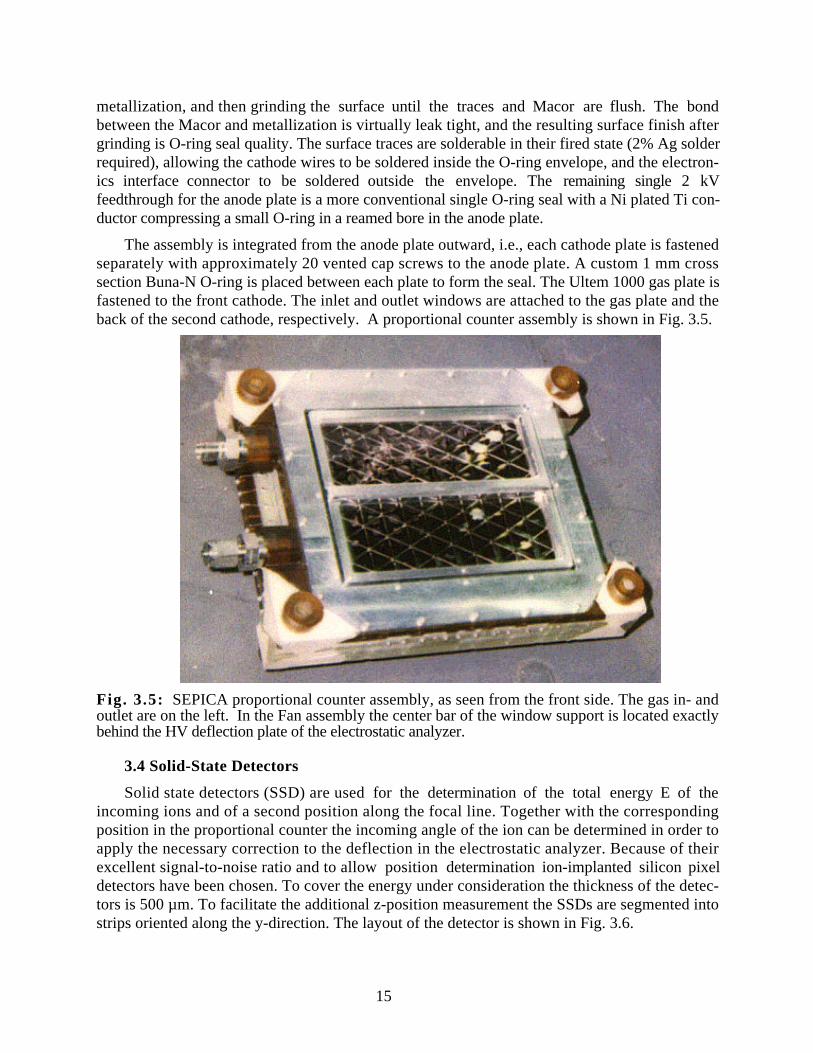
Solid state detectors (SSD) are used for the determination of the total energy E of theincoming ions and of a second position along the focal line. Together with the correspondingposition in the proportional counter the incoming angle of the ion can be determined in order toapply the necessary correction to the deflection in the electrostatic analyzer. Because of theirexcellent signal-to-noise ratio and to allow position determination ion-implanted silicon pixeldetectors have been chosen. To cover the energy under consideration the thickness of the detec-tors is 500 µm. To facilitate the additional z-position measurement the SSDs are segmented intostrips oriented along the y-direction. The layout of the detector is shown in Fig. 3.6.

16
1,150 µ
50 µ
150 µ300 µ
150 x 150 µBond Pad
Pitch: 4 mmPitch: 6 mm
Guard StructureStop Ring
Spacing: 100 µ
Pixel Width: 3.9 mm
Pixel Width: 5.9 mm
z
y
Fig. 3.6: Layout of the rear side of the ion-implanted silicon pixel detectors by Canberra,Belgium. The front side consists of a < 1000 Å thick dead layer with vacuum deposited Al.

17
Another challenge for the SSDs is the required dynamic range of total ion energies from 0.1 to300 MeV. However, by making use of the electrostatic deflection ions with energies ≥ 1MeV/charge are contained to within ≈ 10 mm from the undeflected focal line. Therefore, the SSDshave also been segmented into a high (1 - 300 MeV) and a low (0.1 - 30 MeV) energy section.The high energy section contains eight strips, while the low energy section has twelve strips.This arrangement has been optimized to the need of better angular correction in the low energyregime where a charge resolution ∆Q/Q ≤ 10% can be achieved. To avoid cross talk on the SSDfrom the high to the low energy section a guard structure has been implemented in the layout.The stop ring avoids noise from imperfections at the edge of the SSD wafer. The two SSDs foreach fan are mounted side by side directly on the printed circuit board with the SSD electronics.In this way noise pickup and electronic cross talk between channels could be minimized.
3.5 Anticoincidence Detectors
The anti-coincidence counters completely cover the back of the solid state detectors andextend beyond the sensitive area of the SSDs sufficiently to detect ions which penetrate thedetector volume at oblique angles. CsI scintillators are used with Si photodiodes (by SILICONSensors GmbH, Berlin) as light detecting devices. A similar arrangement has been successfullyimplemented in the SAMPEX HILT experiment (Klecker et al., 1993). Each of the three anti-coincidence units consists of a ≈ 100 x 60 mm CsI crystal with a thickness of 5 mm and a 3 mmacrylic backing. The scintillation signals are picked off by 20 Si photodiodes of 10 x 8 mm, 4 oneach short side and 6 on each long side of the CsI crystal. The anti-coincidence assembly ismounted to the rear side of the SSD circuit board and covered with a ground shield. To avoidcross-talk between anti-coincidence and SSD channels the front side of the CsI crystal has beencovered with a vapor deposited 1000 Å layer of Al. Together with the reflective paint that isapplied to backing this maximizes the light collection of the detector system.
The assembled proportional counter is mounted together with the SSD assembly and anti-coincidence detector as well as the two remaining boards of the sensor electronics over the fourTitanium alignment rods on a mounting frame. This mounting frame is used for integration withthe electrostatic analyzer section of the sensor fan. Clamping nuts secure the PC and electronics,and a ground enclosure that contains the signal and power connectors shields the complete detec-tor assembly.
4. Sensor Electronics
All sensor analog electronics is contained in the sensor Fans, while the conversion to digitalsignals and the event selection is carried out in the electronics box. This also houses most of thesupporting electronics. Figure 4.1 shows the main functions in an electronics block diagram.

18
Iso
bu
tan
eG
as
Single Rates
CAMEX/TIMEX
Strip SSD
PC
PC Channel
Anticoincidencew/ Photodiodes
ADC
Str
ob
e
Eve
nt
Sel
ecti
onADC
Dat
a an
d C
md
I/F
ASICCounters
Basic RatesAnalyzerHV
SSDBias Gas
Regulation
PCBias
HK HK and Status
x
z
E
PosZ2
PosY, PosZ1
∆E
Anti
28V28V±5 V
±15 V
LV PowerConverter
x
y
+30 kV
0 V
Focus
∆E Signal (Anode)
Comparator
PosY (Cathode) PosZ1 (Cathode)
Smple& Hold
CAMEX/TIMEX
PC Window(front and back)
Fig. 4.1: SEPICA block diagram.
4.1 Analog Electronics
The analog electronics consists of individual amplifier chains for the dE/dx and anti-coinci-dence channels as well as CMOS VLSI circuits (CAMEX and TIMEX) which serve the positiondetermination in the proportional counters and the energy measurement in the solid state pixeldetectors. The individual amplifier chains for the PC anode and the anti-coincidence consist of anAMPTEK A250 hybrid circuit with a FET preamplifier stage, followed by pulse shaping. Eachof the three fans contains one dE/dx and one anti-coincidence channel.
Each CAMEX (CMOS Multichannel Analog Multiplexer) contains 32 charge sensitive am-plifier channels whose outputs are sampled by fast switches into storage capacitors. After com-pletion of the measurement cycle the charge difference accumulated during the event is read fromall channels sequentially into the following electronics (Lutz et al., 1987). The CAMEX wasoriginally designed for high energy ion beam experiments, in which event timing is known apriori; i.e. the detection cycle can be treated synchonously with the experiment. In space applica-tions the automatic sampling cycle of the CAMEX has to be interrupted at the detection of anincoming particle to allow a readout sequence. This readout is triggered by a signal in the corre-sponding dE/dx channel for the proportional counter/solid-state detector unit, provided that nohigh energy particle is signaled by the anti-coincidence detector. The necessary control electronicsfor the timing of the sampling and the readout is implemented in a custom VLSI called TIMEX.In order to miniaturize the electronics and to reduce cross-talk the CAMEX/TIMEX combina-

19
tion, including some passive circuitry, has been implemented on a custom hybrid, developed atthe Fachhochschule Landshut, Germany. A similar hybrid was previously flown in the CELIASinstrument on SOHO (Hovestadt et al., 1995). On each CAMEX the user can select the gain for agroup of sixteen channels from 0.12 and 2.2 V/fC.
Four CAMEX/TIMEX amplifier hybrids are used in each fan: two serve the position sensingin the PCs and the other two energy determination with the solid state detectors. Each propor-tional counter CAMEX is connected to 21 cathode wire groups. The connections are interleavedso that position information in both the rear (deflection direction) and front (focal line direction)planes is available on each CAMEX, thus providing partial redundancy. The high gain state ofthe CAMEX is used for the PC. Each SSD CAMEX serves one half of each of the two detectorswith twenty individual pixels. The CAMEX channels that serve the eight pixels next to thedeflection plate in the center of each fan, where the high energy ions hit, are switched to the lowgain, while the remaining twelve pixels are set to the high gain state. The ratio of the two SSDpixel gains is 20, thus providing a nominal energy range of 0.1 - 300 MeV.
4.2 SEPICA Digital Electronics
The SEPICA digital electronics consists of three “ADC/peak boards” (one per fan) on whichthe analog signals (dE/dx, PC positions, and SSD) are digitized and the peak positions are deter-mined, one “event board” which selects valid events from the three fans and accumulates monitorrates from the event signals, and a “pre-processor board”, which carries out initial processing ofthe data to reduce the number of bits per event into the data processing unit (S3DPU). The pre-processor was also necessary so that the same interface to the S3DPU could be used forSEPICA, SWICS and SWIMS.
Two basic types of data are generated in the SEPICA electronics: rate data and pulse-heightanalysis (PHA) event data. Event data contains detailed information about each particle whichenters the instrument. Rate data contains count rates of individual signals and coincidencesbetween signals, as shown in Table 4.1.
Table 4.1: Trigger conditions and related count rates for each of the three fans
Trigger DescriptionPPC_Trigger Trigger from the proportional CounterPPC_Trig*Anticoincidence Trigger Anticoincidence Signal in coincidence with PPC_TrigPPC*Anticoincidence Trigger PPC_Trigger NOT in coincidence with AnticoincidenceValid Event Event satisfying the commandable Valid Event Criteria
(given below)
Event processing begins when a signal above threshold is detected by the PC anode and theselected conditions are met. In this case the signals are read from the ∆E channel as well as fromthe cathode and SSD CAMEXes. They are converted in 11 bit ADCs. The single signal from theanode of the proportional counter goes through a high gain amplifier and a low gain amplifier.The difference between the two gains is a factor of 15. If the high gain signal exceeds a com-mandable threshold, the low gain is used. The outputs from the CAMEXes, the SSD signals andthe position signals from the PC go through further processing on the ADC/peak board. Thebaseline level for each CAMEX output, which is stored in a lookup table, is subtracted from eachmeasurement. The SSD pixel as well as the Y and Z strips in the PC with the largest signals are

20
determined from the resulting signals. The energy signal is read from the selected SSD pixel. Todetermine the positions in the proportional counter in Y and Z, the peak signal plus the signalsfrom the two adjacent strips on each side are selected. Prior to passing the data to the preproc-esser board, it is determined whether the event is valid according to criteria in Table 4.2.
Table 4.2: Criteria for the validation of events in SEPICA
Criteria DescriptionPC Y-Position At least one wire strip had a signal over thresholdPC Z1-Position At least one wire strip had a signal over thresholdSSD-1 One and only one SSD strip had a signal over threshold.SSD-2 At least one SSD strip had a signal over threshold
Any combination of these PC Y, PC Z1, and SSD criteria, including disabling all checks, areallowed and can be set by telecommand. The default valid event condition is
PC Y-position • PC Z1-Position • (SSD-1) (4.1)
There are two sensor modes, “engineering mode” and “science mode”. In engineering mode, thefull set of pulse height signals as shown in Table 4.3 is transmitted unchanged for a limited num-ber of events.
Table 4.3: Pulse height signals transmitted in engineering mode
Signal Description Quantity Bits/item∆E + gain bit PC anode signal (both gains) 2 12E Energy (8 low, 12 high gain pixels, both SSDs) 40 11Z2 Strip number of the peak SSD pixel 1 5YC Pulse height of all strips in Y 21 11YP Strip number of peak Y strip - 2 1 5Z1C Pulse height of all strips in Z1 21 11Z1P Strip number of peak Z strip - 2 1 5Fan ID Fan ID 1 2SSD ID Identifies top or bottom half of fan 1 1
In science mode the information for each valid event is already limited to the most importantsignals upon transfer into the pre-processor board according to Table 4.4.
Table 4.4: Pulse height signals passed into the pre-processor in science mode
Signal Desciption Quantity Bits/item∆E + gain bit the proportional counter signal 1 12E Peak Energy from the SSD’s 1 11Z2 Strip number of the peak SSD 1 5YC Pulse height of strips surrounding Y peak 5 11YP Strip number of corresponding Y strips 5 5Z1C Pulse height of strips surrounding Z1 peak 5 11Z1P Strip number of corresponding Z strips 5 5Fan ID Fan ID 1 2SSD ID Identifies top or bottom half of fan 1 1

21
In science mode, the pre-processor board reduces the information to be transmitted even further.It calculates the total deflection Y of the incoming ion in the deflection field according to
Y = ∑i(YPi*YCi)/∑i(YCi) (4.2)where YPi is the wire position and YCi is the pulse height amplitude for each cathode strip. TheZ position Z1 is calculated from the amplitude distribution at the rear cathode in a similar way,whereas the Z position Z2 taken in the SSDs is the center position of the SSD pixel with themaximum signal. Finally, the two Z positions Z1 and Z2 are combined into the difference |Z1-Z2|which is proportional to the tangent of the incoming angle Θ parallel to the fan plane. The loca-tions of the center of each wire strip and of each SSD pixel are stored in a lookup table so that theSSD position, Z2, and the PC position, Z1, will be in the same units, with the origins of Z1 andZ2 aligned such that Z1 = 0 and Z2 = 0 corresponds to θ = 0. Figure 4.2 shows the Z1 (PC) andZ2 (SSD) planes and indicates for a sample trajectory how |Z1-Z2| is used to determine the inci-dent fan angle Θ. The PC cathode strip numbers and the high gain pixels of the SSD are shown.The pre-processor also drops the LSB from the ∆E signal thus returning ∆E', and it adds a gain bitto the ∆E’ and the SSD energy signal.
|Z1
-Z2
|
10
12
14
16
0
2
4
6
8
18
20
8
10
12
14
16
18
Proportional Counter
SSD
Z1 Z2
22.5 mm
|Z1
-Z2
|
Θ
Fig. 4.2: Schematic of fan angle θ, and the Z1 and Z2 directions.
The processed PHA event data that is transferred into the S3DPU is compiled in Table 4.5.
Table 4.5: PHA event data as transferred into the S3DPU
Signal Desciption Quantity Bits/item∆E’ + gain bit PC anode signal 1 11E + gain bit Peak Energy from the SSDs 1 12Y Computed position in deflection direction 1 10|Z1-Z2| Computed angle in fan direction 1 8Fan Fan ID 1 2SSD ID Identifies top or bottom half of fan 1 1Mode 0 = Science, 1 = Engineering 1 1

22
4.3 Event Processing in the S3DPU
The SEPICA instrument is served by a common Data Processing Unit (S3DPU) togetherwith the SWICS and SWIMS experiments. In this section the requirements for the S3DPU fromthe side of SEPICA and the data stream through the unit are compiled. A brief description of theS3DPU architecture is given in section 9.
- Basic and Matrix Rate Data
In the S3DPU, the event data is accumulated on-board into bins representing specific species,energies and charge states. Prior to the accumulation, two corrections are applied to the data.i) The ∆E signal is corrected for the path length through the PC:
∆E' = ∆E*cosθ (4.5)
ii) The deflection Y is corrected for traversal of the electrostatic analyzer at oblique angles:
Y' = Y*cos2θ (4.6)
These corrections are made using a look-up table for cosΘ and cos2Θ, given the value |Z1 - Z2|.The charge state is then calculated according to
Q* = C1* Y' *ERes (4.7)
where C1 is a constant determined by calibration.
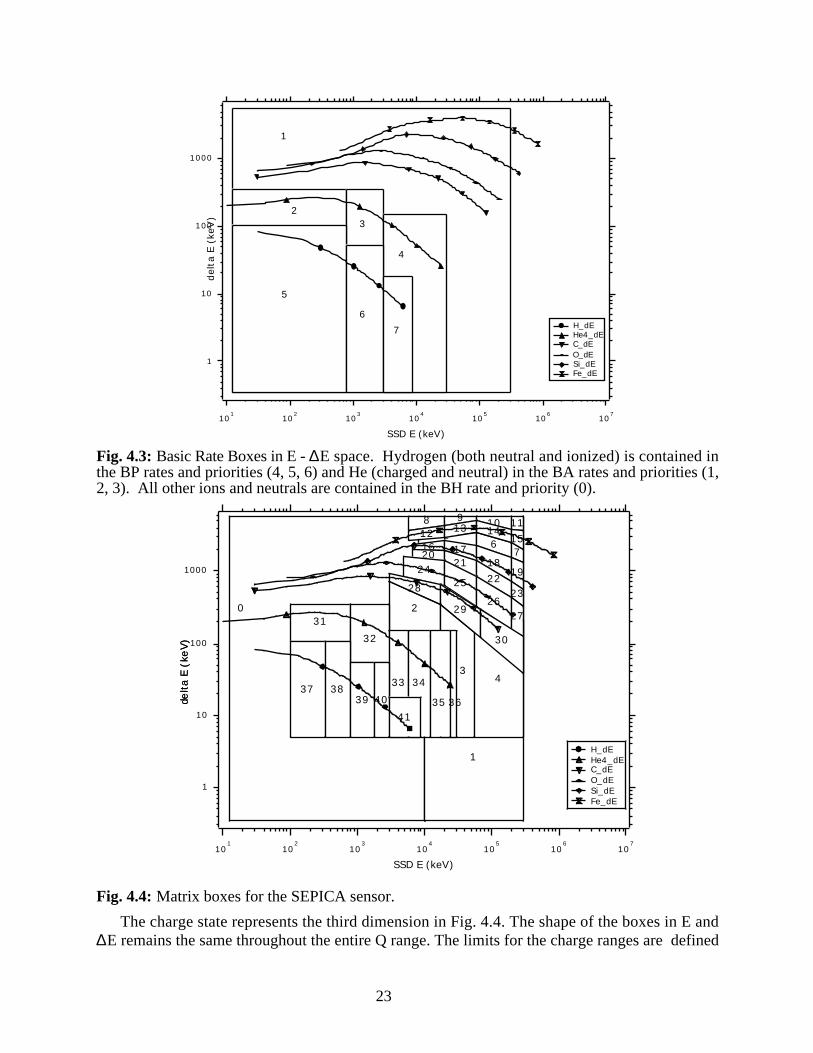
Using the values of ERes, ∆E', and Q*, each event is accumulated into two types of“Classification Rates”: Basic Rates and Matrix Rates. Both sets of rates cover the full valid eventrange in ERes, ∆E', and Q*. The Basic Rates are larger bins, designed to grossly divide up the datainto protons, helium, and heavy ions. The basic rates are not further divided into charge statesranges. The boundaries for the basic rates are also the boundaries that determine the priorities forthe PHA Data. The Matrix Rates divide the data more finely into individual species and intocharge state ranges. The boundaries for the Basic Rates and Matrix Rates as defined for the startof the mission are shown in Figs. 4.3 and 4.4. These boundaries are adjustable by telecommand.
23
0
1
1
23
4
5
6
7
1
10
100
1000
del
ta E
(ke
V)
101
102
103
104
105
106
107
SSD E (keV)
H_dE He4_dE C_dE O_dE Si_dE Fe_dE
Fig. 4.3: Basic Rate Boxes in E - ∆E space. Hydrogen (both neutral and ionized) is contained inthe BP rates and priorities (4, 5, 6) and He (charged and neutral) in the BA rates and priorities (1,2, 3). All other ions and neutrals are contained in the BH rate and priority (0).
delta E
(ke
V)
0
1
2
34
5 67
8 9 10 1112 13 14
1516 17
1819
2021
2223
2425
2627
28
29
30
31
32
33 34
35 3637 38
39 40
41
1
10
100
1000
delta E
(ke
V)
101
102
103
104
105
106
107
SSD E (keV)
H_dE He4_dE C_dE O_dE Si_dE Fe_dE
Fig. 4.4: Matrix boxes for the SEPICA sensor.
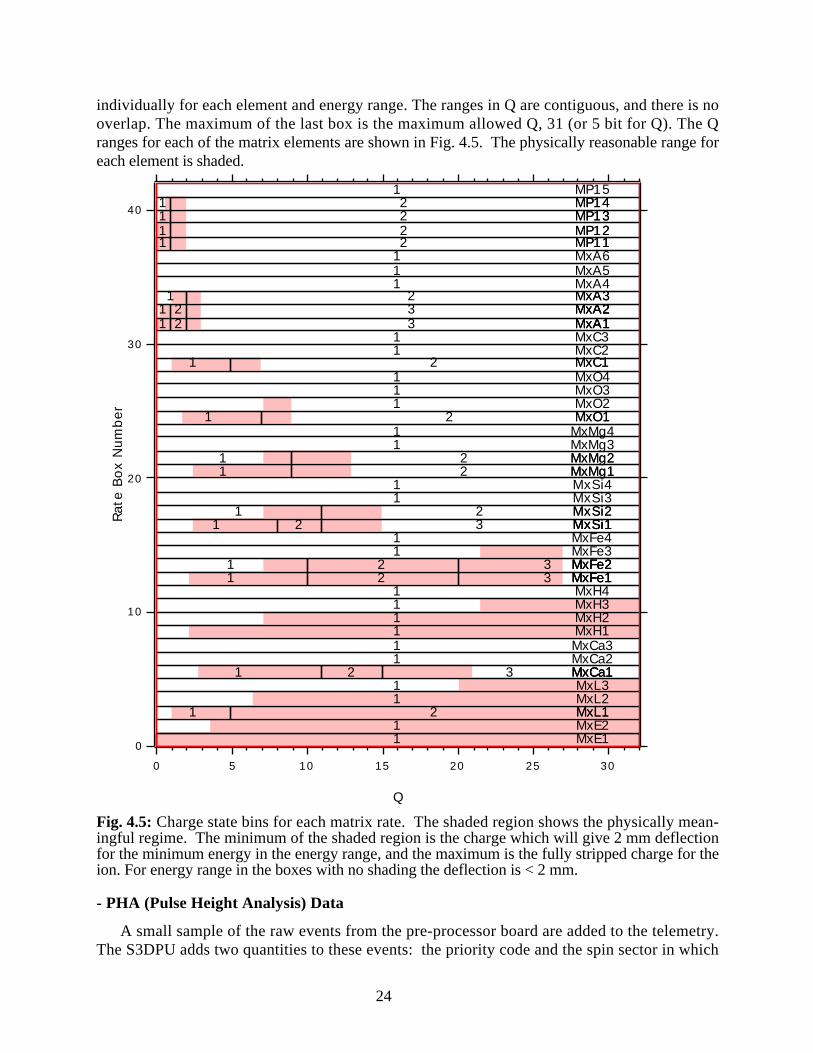
The charge state represents the third dimension in Fig. 4.4. The shape of the boxes in E and∆E remains the same throughout the entire Q range. The limits for the charge ranges are defined
24
individually for each element and energy range. The ranges in Q are contiguous, and there is nooverlap. The maximum of the last box is the maximum allowed Q, 31 (or 5 bit for Q). The Qranges for each of the matrix elements are shown in Fig. 4.5. The physically reasonable range foreach element is shaded.
1 MxE11 MxE2
1 MxL12 MxL11 MxL21 MxL3
1 MxCa12 MxCa13 MxCa11 MxCa21 MxCa31 MxH11 MxH21 MxH31 MxH4
1 MxFe12 MxFe13 MxFe11 MxFe22 MxFe23 MxFe2
1 MxFe31 MxFe4
1 MxSi12 MxSi13 MxSi11 MxSi22 MxSi2
1 MxSi31 MxSi4
1 MxMg12 MxMg11 MxMg22 MxMg2
1 MxMg31 MxMg4
1 MxO12 MxO11 MxO21 MxO31 MxO4
1 MxC12 MxC11 MxC21 MxC3
1 MxA12 MxA13 MxA11 MxA22 MxA23 MxA21 MxA32 MxA3
1 MxA41 MxA51 MxA6
1 MP112 MP111 MP122 MP121 MP132 MP131 MP142 MP14
1 MP1540
30
20
10
0
Rat
e Box
Num
ber
302520151050
Q
Fig. 4.5: Charge state bins for each matrix rate. The shaded region shows the physically mean-ingful regime. The minimum of the shaded region is the charge which will give 2 mm deflectionfor the minimum energy in the energy range, and the maximum is the fully stripped charge for theion. For energy range in the boxes with no shading the deflection is < 2 mm.
- PHA (Pulse Height Analysis) Data
A small sample of the raw events from the pre-processor board are added to the telemetry.The S3DPU adds two quantities to these events: the priority code and the spin sector in which

25
the event occurred. In addition, it log compresses the energy and energy loss signals. The prior-ity code indicates which range the event occurred in. The priority range boundaries correspondto the basic rate boundaries. In order to emphasize heavy ions in the transmitted data, the frac-tion of events from each range to be put into the telemetry can be specified. If there are notenough events of a high priority range to fill the available telemetry, it is filled by events of lowerpriority.
In order to emphasize data from the high resolution fan (fan 1) when it is available, theS3DPU checks the BH rate for fan 1. If it exceeds a programmable threshold, only PHA eventsfrom fan 1 are included in the PHA data. Otherwise, the PHA data comes from all fans. The finalPHA events that are transmitted in science mode contain 48 bit as shown in Table 4.6.
Table 4.6: PHA events as transmitted into telemetry in science mode
Signal Desciption Quantity Bits/item∆E’ + gain bit PC anode signal, log compressed 1 10E + gain bit Peak energy from SSDs, log compressed 1 11Z1-Z2 Angle in fan direction 1 8Y Computed position in deflection direction 1 10Fan ID Fan ID 1 2SSD ID Identifies top or bottom half of fan 1 1Priority Priority Code 1 3Azimuth Sector in which event was measured 1 3Total 48
5. Calibration and Performance
The calibration of the SEPICA can be separated into the determination of the geometric factor,the evaluation of the charge resolution (separate for each fan), and the identification of elementsand charge states to define the Matrix boxes in Figs. 4.3 and 4.4. The geometric factor of each fanis determined by the effective aperture area and the acceptance angle of the respective collimatorand the transparency of any obstructing structure in the detector assemblies, such as grids andthe proportional counter wires. Also the charge state resolution depends mainly on the geometryof the collimator. Therefore, these sensor attributes can be determined from a geometric charac-terization of the collimators, which has been performed before the fan integration activities.However, the element and charge state identification are properties of the entire sensor fan.Therefore, the latter activity was performed with complete fans or even the total sensor using α-sources and accelerator beams.
5.1 Geometric characterization of the collimators
Focal line width and throughput of the SEPICA collimators were verified in a series of opticaltests. The focal line widths were measured with the full collimator illuminated. The focal lineFWHMs for the three fans are 0.982 ± 0.007 mm, 3.23 ± 0.04 mm, and 3.47 ± 0.03 mm. Idealper design values are 0.984 mm, 2.95 mm, and 2.95 mm, respectively. The slightly increased val-ues for the focal line of fans 2 and 3 are probably due to taking the measurement below the focalline. Evaluation of data with partial illumination of the collimator showed a distinct separation ofthe respective focal line images. Because the collimators were already integrated at this time, the
26
measurement could not be repeated. By comparing the centers of the focal line separately for theupper and lower half of the collimators it was verified that the two halves of the collimator arealigned to within 2.5 µm.
The collimator throughput was determined for the engineering model by a comparison of thelight transmission through a single slit for a two plate collimator (entrance and exit only) withthat through the full collimator assembly. Any misalignment due to tolerances reduces the trans-mission for the full collimator over the two plate assembly, which represents ideal transmissionfor the design geometry. Because this more precise method requires excessive handling of the col-limator plates, the relative transmission of the flight collimators was verified by determining thereduction of the focal line width over the design geometry for several 5 mm × 5 mm sample areasacross the collimator. The square of the focal line width reduction is equivalent to the reduction intransmission, because both entrance aperture and acceptance angle are affected. For fan 1 an aver-age transmission across the collimator area of 67±4%, close to the goal of 70% was found. Thistranslates into a net geometric factor of 0.031 cm2 sr. For the other two fans, the transmission isconsistent with a combined geometric factor of 0.20 cm2 sr. This value includes all reductions ofthe instrument detection efficiency due to collimator transmission and the transparency of thedetector assemblies. The detection efficiency computed from the individual grid transparenciesand the actual efficiency as derived from the comparison between the proportional counter triggerrate and the coincidence rate agree within the instrument accuracy.
The deflection in the electrostatic analyzer and position resolution of the collimator-analyzersystem were tested with low (2 keV) ion beam. A microchannel plate imaging system was usedfor detection in the focal plane, and the deflection voltage was scaled to the lower energies. Thedeflection test was repeated in the full fan configuration with α-particles from an Am 241 source.These measurements have verified that SEPICA deflects 1 MeV/Q ions by 10 mm with the fulldeflection voltage of 30 kV.
5.2 Calibration of the element and charge identification of SEPICA
The element identification in SEPICA is achieved in a ∆E versus residual energy E parameteranalysis of the sensor. While the energy response of SSDs is fixed by their charge conversion of ≈3 eV per e-ion pair, the ∆E signal as measured by a PC depends on its geometry, the gas compo-sition and density, as well as the electric field strength around the anode wires. In isobuthane thecreation of an e-ion pair requires 23 eV. For nominal operation of the SEPICA fans with 20 TorrPC pressure at 25 oC and an anode voltage of 1000 V a gas gain of 115 is achieved with a doublingof the signal for each additional 90 V. The electronic threshold for the ∆E signal is set to 6 fCwhich is equivalent to an energy loss of 8 keV in the PC. This corresponds to the signal of a 3MeV proton. The high gain section of the amplifier chain tops at 195 fC (equivalent to the maxi-mum energy loss of He ions), while the low gain section extends to 4.27 pC thus including also60 MeV Fe with the maximum energy loss in the operational regime.
Figure 5.1 shows a sample of calibration data taken at the Brookhaven National Lab (BNL)with a 20 MeV Fe beam. Both element identification capability from dE/dx versus E and chargeresolution from ion deflection are illustrated. The FWHM of the dE/dx distribution is ≈ 10% andfor residual energy ≈ 8%. Some events are found along a line towards lower dE/dx and E and a lineat constant dE/dx. The first group probably has lost energy at the support grid of the entrancewindow and thus falls on the Fe track at lower energies, while the latter group must have lostenergy after passing the PC. The event groups with E = 0 mark ions that were stopped in one of

27
the grids or wire planes of the PC and thus were degraded in E and/or dE/dx. The relatively widefoot in energy may be attributed to the large energy loss and straggling experienced by 0.36MeV/Nuc Fe ions. The lower right panel of Fig. 5.1 demonstrates the position resolution and iondeflection in a comparison of two measurements with 11.5 kV and 0 kV deflection voltageapplied. The undeflected focal line is at the nominal Y position of 5 mm, while an additionaldeflection of 2 mm is achieved in the 11.5 kV run. The result is compatible with the beam chargestate of 10 to 11 and a slightly less than 1 mm wide focal line in the PC.
dE/dx (LG) for 20 MeV Fe with 1000 V Anode
0
10
20
30
40
50
60
0 50 100 150 200 250 300 350 400dE/dx in ADC Channels
Cou
nts
Y Position for 20 MeV Fe
0
50
100
150
200
250
300
350
-10 -8 -6 -4 -2 0Y in mm
Cou
nts
0 kV11.9 kV
dE/dx vs. E for 20 MeV Fe
0
50
100
150
200
250
300
350
400
0 20 40 60 80 100
E in ADC Channels
dE/d
x (L
G) i
n A
DC
Cha
nnel
s
Energy for 20 MeV Fe
0
50
100
150
200
250
0 20 40 60 80 100E in ADC Channels
Cou
nts
Fig. 5.1: Sample calibration measurement as taken with the SEPICA spare fan at BNL with a 20MeV Fe beam at 11.5 kV deflection voltage. A dE/dx versus E chart is shown in the upper leftalong with the corresponding dE/dx and E spectra to its right and bottom. The fourth panel on thelower right shows the deflection of the ions in comparison with the deflection voltage turned off.
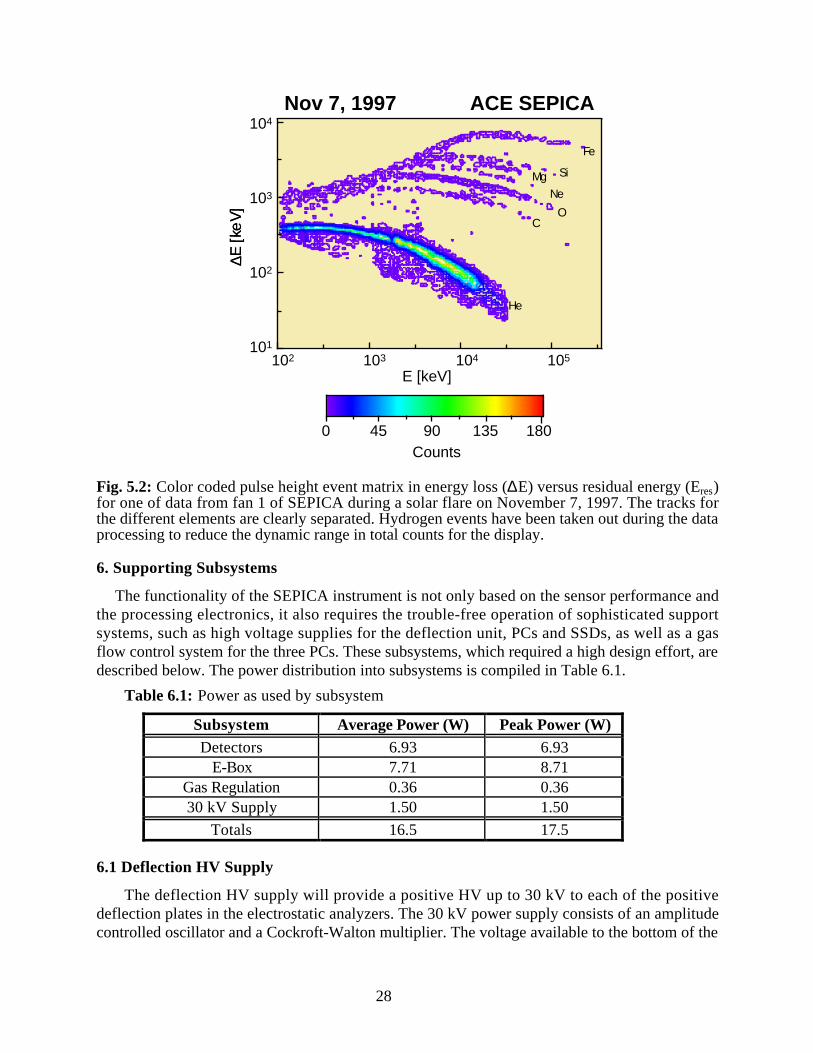
The element resolution of SEPICA and the actual position of the element tracks for the cali-bration of the Matrix Rate boxes as shown in Fig. 4.3 are demonstrated for in-flight operationfrom the strong solar flare on November 5, 1997, in Fig. 5.2. SEPICA can indeed resolve individ-ual elements up to Ne and provides a good resolution of the major ion groups up to Fe. The longterm behavior of the inflight calibration can be monitored through three Am 241 α-sources with50 µCi activity, one in each sensor fan. The calibration α -particles are directed into the lowenergy part of the detector in order to avoid interference with the natural He population. Thestability of the electronics is monitored separately through a self-stimulation sequence that can beinitiated by telecommand.
28
∆E [
keV
]
105
104
E [keV]
0 45 90 135 180Counts
Nov 7, 1997 ACE SEPICA
∆E [
keV
]
103
102
101
104103102
He
CO
NeMg Si
Fe
Fig. 5.2: Color coded pulse height event matrix in energy loss (∆E) versus residual energy (Eres)for one of data from fan 1 of SEPICA during a solar flare on November 7, 1997. The tracks forthe different elements are clearly separated. Hydrogen events have been taken out during the dataprocessing to reduce the dynamic range in total counts for the display.
6. Supporting Subsystems
The functionality of the SEPICA instrument is not only based on the sensor performance andthe processing electronics, it also requires the trouble-free operation of sophisticated supportsystems, such as high voltage supplies for the deflection unit, PCs and SSDs, as well as a gasflow control system for the three PCs. These subsystems, which required a high design effort, aredescribed below. The power distribution into subsystems is compiled in Table 6.1.
Table 6.1: Power as used by subsystem
Subsystem Average Power (W) Peak Power (W)Detectors 6.93 6.93
E-Box 7.71 8.71Gas Regulation 0.36 0.3630 kV Supply 1.50 1.50
Totals 16.5 17.5
6.1 Deflection HV Supply
The deflection HV supply will provide a positive HV up to 30 kV to each of the positivedeflection plates in the electrostatic analyzers. The 30 kV power supply consists of an amplitudecontrolled oscillator and a Cockroft-Walton multiplier. The voltage available to the bottom of the

29
voltage multiplier can be varied from zero to 2000 V peak by comparing an input analog com-mand with feedback from the high voltage and using the error signal to control the current in theoscillator. A hard limit is set at 2000 V peak by the DC power supply to the oscillator. The mul-tiplier consists of 35 stages which allow the output voltage to reach about 36 kV.
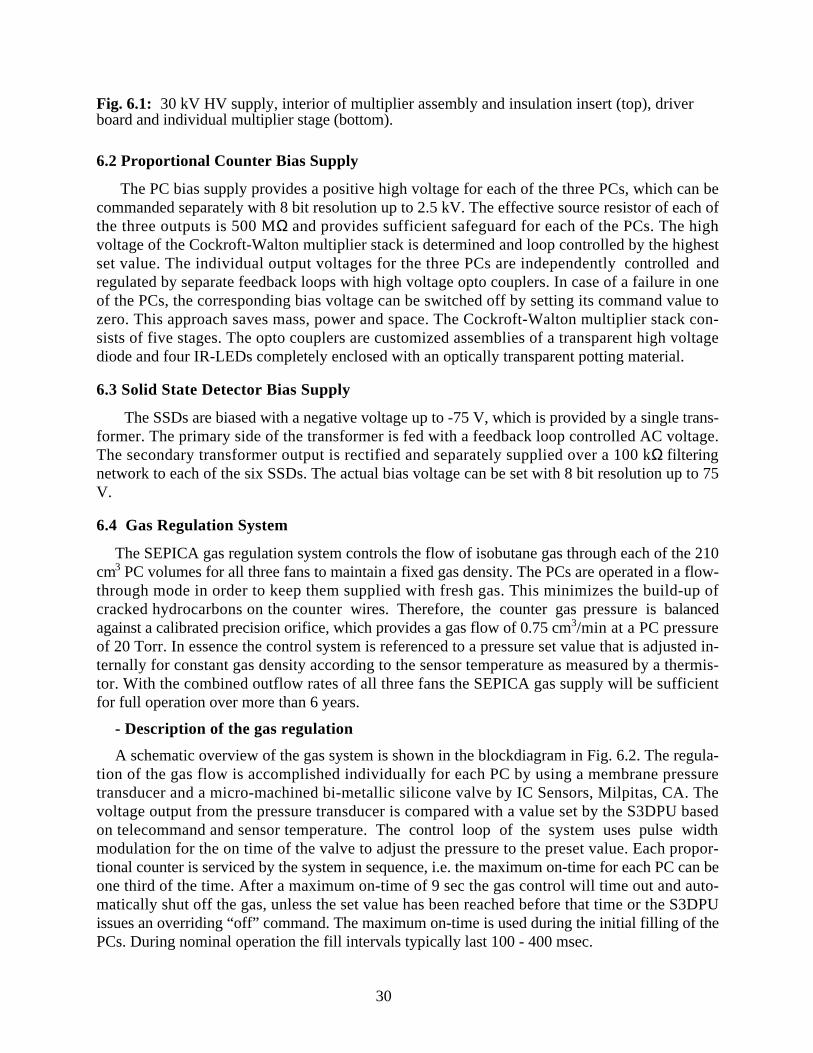
The power supply is divided into two cavities, one with the low voltage circuits up to theoutput transformer, the other with the voltage multiplier and the 5000 MΩ feedback resistors.The low voltage circuitry is packaged in a standard printed wire board, the transformer ismounted on the metallic housing, and the high voltage output wire is routed very carefully tominimize the danger of discharges. The voltage multiplier is subdivided into seven circular printedwire boards each with five stages of multiplication and a metal shield ring around the circumfer-ence that provides a low electric field environment on the board and shapes the field between theelectronics and the housing. The boards have a center hole and are mounted on an Ultem tube thatcontains the high voltage feedback resistors. Short tubes of silicon nitride are used to set thespacing between the boards and to provide a low thermal resistance to the metal housing at thebottom of the structure. There is an insulating sleeve of fiberglass inside the external aluminumcylindrical housing. The high voltage end is capped by a field shaping torus and supportedthrough an Ultem end piece. The output is through high voltage cables, with their metal shieldterminated on the metal housing and the center wire and insulation extending through the Ultemsupport to the center of the torus. Here the connections are made by means of pin and socket in alow field region. A view of the open HV supply is shown in Fig. 6.1.
The electric field distribution in the high voltage section was studied and optimized through-out the design phase using the ELECTRO simulation program by Integrated Engineering Soft-ware. The engineering model supply was tested up to 40 kV by raising the input voltage supplybeyond the specified value. It was operated for 400 hours at 36 kV for flight qualification.
30
Fig. 6.1: 30 kV HV supply, interior of multiplier assembly and insulation insert (top), driverboard and individual multiplier stage (bottom).
6.2 Proportional Counter Bias Supply
The PC bias supply provides a positive high voltage for each of the three PCs, which can becommanded separately with 8 bit resolution up to 2.5 kV. The effective source resistor of each ofthe three outputs is 500 MΩ and provides sufficient safeguard for each of the PCs. The highvoltage of the Cockroft-Walton multiplier stack is determined and loop controlled by the highestset value. The individual output voltages for the three PCs are independently controlled andregulated by separate feedback loops with high voltage opto couplers. In case of a failure in oneof the PCs, the corresponding bias voltage can be switched off by setting its command value tozero. This approach saves mass, power and space. The Cockroft-Walton multiplier stack con-sists of five stages. The opto couplers are customized assemblies of a transparent high voltagediode and four IR-LEDs completely enclosed with an optically transparent potting material.
6.3 Solid State Detector Bias Supply
The SSDs are biased with a negative voltage up to -75 V, which is provided by a single trans-former. The primary side of the transformer is fed with a feedback loop controlled AC voltage.The secondary transformer output is rectified and separately supplied over a 100 kΩ filteringnetwork to each of the six SSDs. The actual bias voltage can be set with 8 bit resolution up to 75V.
6.4 Gas Regulation System
The SEPICA gas regulation system controls the flow of isobutane gas through each of the 210cm3 PC volumes for all three fans to maintain a fixed gas density. The PCs are operated in a flow-through mode in order to keep them supplied with fresh gas. This minimizes the build-up ofcracked hydrocarbons on the counter wires. Therefore, the counter gas pressure is balancedagainst a calibrated precision orifice, which provides a gas flow of 0.75 cm3/min at a PC pressureof 20 Torr. In essence the control system is referenced to a pressure set value that is adjusted in-ternally for constant gas density according to the sensor temperature as measured by a thermis-tor. With the combined outflow rates of all three fans the SEPICA gas supply will be sufficientfor full operation over more than 6 years.
- Description of the gas regulation
A schematic overview of the gas system is shown in the blockdiagram in Fig. 6.2. The regula-tion of the gas flow is accomplished individually for each PC by using a membrane pressuretransducer and a micro-machined bi-metallic silicone valve by IC Sensors, Milpitas, CA. Thevoltage output from the pressure transducer is compared with a value set by the S3DPU basedon telecommand and sensor temperature. The control loop of the system uses pulse widthmodulation for the on time of the valve to adjust the pressure to the preset value. Each propor-tional counter is serviced by the system in sequence, i.e. the maximum on-time for each PC can beone third of the time. After a maximum on-time of 9 sec the gas control will time out and auto-matically shut off the gas, unless the set value has been reached before that time or the S3DPUissues an overriding “off” command. The maximum on-time is used during the initial filling of thePCs. During nominal operation the fill intervals typically last 100 - 400 msec.

31
The regulation band for the gas pressure is ± 1% and can be set by command through theS3DPU to any value between 10 and 30 Torr. Nominal operation is anticipated at 20 Torr. Gasregulation of 1% precision is assured with a 10 bit ADC. The control algorithm and additionalsafety functions are implemented in an Actel gate array.
The gas regulation works off a supply pressure of 250 Torr. Preregulation of the gas pressurefrom the tank, which is at the isobutane vapor pressure, is achieved with a mechanical pressurereducing valve. A fourth pressure transducer monitors the preregulated gas at 250 Torr whichfeeds the three gas regulation valves. During launch the tank volume is sealed by a magnetic latchvalve that is controlled by spacecraft command.
- System Safeguards
During the ascent of the spacecraft through the atmosphere all three counter systems are opento the outside through a baro switch that closes at an outside pressure of ≈ 60 Torr. In this waythe integrity of the PC windows is assured. The remainder of the air trapped in the counter vol-ume will then bleed slowly through the precision orifice.
During instrument operation the PC gas pressure and the valve on-times will be continuouslymonitored by the S3DPU. If the gas pressure is too high or too low, or if the gas valve on-time istoo long, the S3DPU will automatically take corrective action without human intervention. Incase of an overpressure, the corresponding regulation valve will be power-cycled with a pulse offull power automatically, which is a known cure in case a valve stays open after an excessivetemperature swing. In case of an underpressure the corresponding regulation valve will be shut-off and the PC HV for this unit will be disabled to avoid damage of the PC. In all cases an over-or underpressure alarm will be set in the telemetry.

32
U2
U1
U11
MUX1
MUX2
MUX2 0,1,2
MUX
U4U3
A/D
ADC DATA BUS
VALVE DRIVE
PRESSURE
TEMPERATURE
TEMPERATURE
ACTELSU9,U10
CLK_100CLK_1MHZCMD_CLK
AT4,AT5,AT6ALARMS
LOW PRESSURE
BA
CK
PL
AN
E
ALARMS 1,2,3
VALVESPRESSURETRANSDUCERS
VALVEDRIVERS
U10
LOWPRESSURE
ALARMS
ALARMS 1,2,3
MUX1 0,1,2
BASESSD1,2,3TANKE-BOXHV-BOXCOLL
PC1,2,3GRM
CONTROLS
SYS_RSTCMD_DATA_RCMD_EN_RCMD_DATA_TDISCHARGE
UX2
UX2
UX1
SEPICA GAS SUBSYSTEMBLOCK DIAGRAM
CLK_1MHZ
ISOBUTANEGAS
5 PSI
PC 1,2,3 ORIFICES 1,2,3
VALVEON TIME
VALVECURRENT
BARO 1,2,3
U1
VAPOR PRES45.4 PSIA (LIQUID)
MANUAL SHUTOFF VALVE
PRESSUREREGULATOR
LATCHVALVE
LINE PRESTRANS
LAUNCH PRESSUREEQUALIZATION
Fig. 6.2: Block diagram of SEPICA gas flow control.
7. Structural Design and Packaging
SEPICA is a modular instrument with 3 distinct sensor fans, an isobutane gas supply andregulation system, a 30 kV high voltage supply, an electronics box and a passive thermal radiatorall tied to a common base plate. This modular design allows independent assembly, testing andintegration of each Fan and supporting subsystem with minimal impact on the balance of theinstrument. All subsystems are through bolted to the base plate. SEPICA weighs 37.4 kg readyfor launch with basic outline dimensions of 71 cm x 46 cm and 53 cm height. The mass distribu-tion according to subsystems is compiled in Table 7.1.
The bulk of the SEPICA structure is aluminum, with alloy 6061 used in low stress areas, andalloys 7075 and 2219 used in higher stress parts such as the base plate, or in elaborate partsrequiring precise flatness and tolerance control such as the collimator mounting and spacer platesas well as the radiator. A limited supply of magnesium AZ-31B plate is used in the collimatorspacer plates and some of the structure for mass reduction purposes. As a high electrical per-formance, low outgassing material Ultem 1000 polyetherimide is used for electrical and HV insu-lation in the detector assembly and the 30 kV HV supply. Macor machineable ceramic is utilizedfor the proportional counter cathode and anode plates. The isobutane tank is a carbon fiber over-wrapped aluminum vessel, custom fabricated for this application.
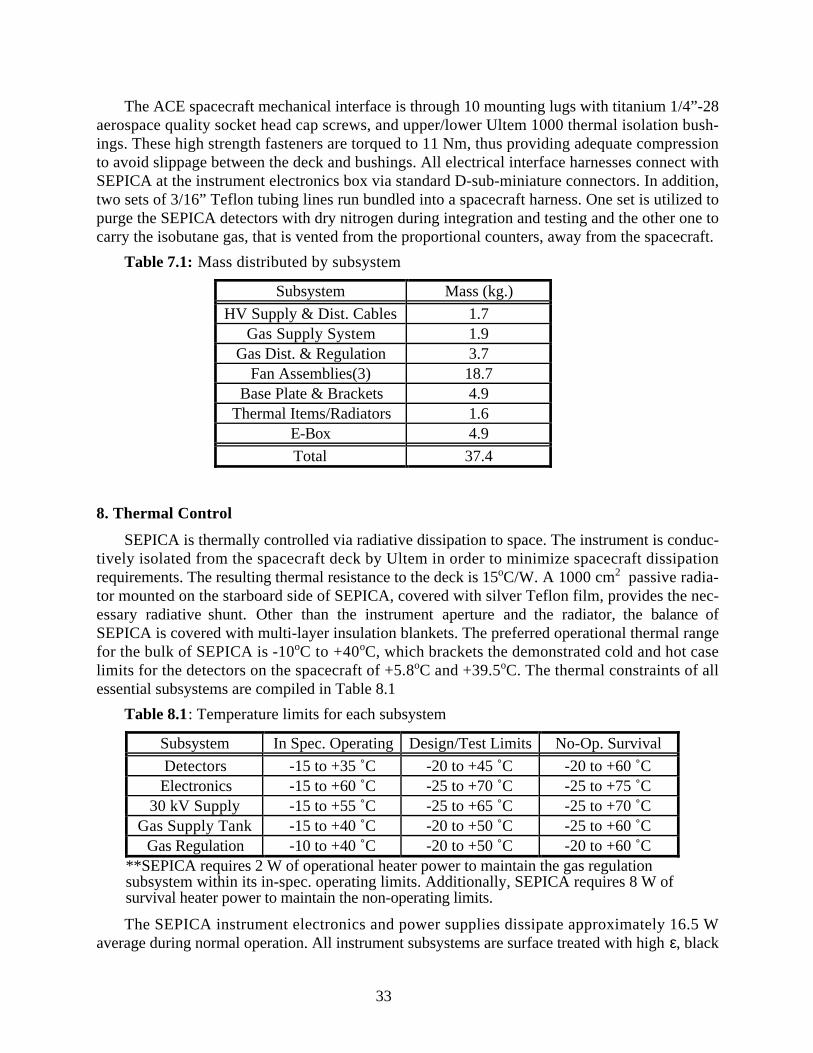
33
The ACE spacecraft mechanical interface is through 10 mounting lugs with titanium 1/4”-28aerospace quality socket head cap screws, and upper/lower Ultem 1000 thermal isolation bush-ings. These high strength fasteners are torqued to 11 Nm, thus providing adequate compressionto avoid slippage between the deck and bushings. All electrical interface harnesses connect withSEPICA at the instrument electronics box via standard D-sub-miniature connectors. In addition,two sets of 3/16” Teflon tubing lines run bundled into a spacecraft harness. One set is utilized topurge the SEPICA detectors with dry nitrogen during integration and testing and the other one tocarry the isobutane gas, that is vented from the proportional counters, away from the spacecraft.
Table 7.1: Mass distributed by subsystem
Subsystem Mass (kg.)
HV Supply & Dist. Cables 1.7Gas Supply System 1.9
Gas Dist. & Regulation 3.7Fan Assemblies(3) 18.7
Base Plate & Brackets 4.9Thermal Items/Radiators 1.6
E-Box 4.9
Total 37.4
8. Thermal Control
SEPICA is thermally controlled via radiative dissipation to space. The instrument is conduc-tively isolated from the spacecraft deck by Ultem in order to minimize spacecraft dissipationrequirements. The resulting thermal resistance to the deck is 15oC/W. A 1000 cm2 passive radia-tor mounted on the starboard side of SEPICA, covered with silver Teflon film, provides the nec-essary radiative shunt. Other than the instrument aperture and the radiator, the balance ofSEPICA is covered with multi-layer insulation blankets. The preferred operational thermal rangefor the bulk of SEPICA is -10oC to +40oC, which brackets the demonstrated cold and hot caselimits for the detectors on the spacecraft of +5.8oC and +39.5oC. The thermal constraints of allessential subsystems are compiled in Table 8.1
Table 8.1: Temperature limits for each subsystem
Subsystem In Spec. Operating Design/Test Limits No-Op. Survival
Detectors -15 to +35 ˚C -20 to +45 ˚C -20 to +60 ˚CElectronics -15 to +60 ˚C -25 to +70 ˚C -25 to +75 ˚C
30 kV Supply -15 to +55 ˚C -25 to +65 ˚C -25 to +70 ˚CGas Supply Tank -15 to +40 ˚C -20 to +50 ˚C -25 to +60 ˚C
Gas Regulation -10 to +40 ˚C -20 to +50 ˚C -20 to +60 ˚C**SEPICA requires 2 W of operational heater power to maintain the gas regulationsubsystem within its in-spec. operating limits. Additionally, SEPICA requires 8 W ofsurvival heater power to maintain the non-operating limits.
The SEPICA instrument electronics and power supplies dissipate approximately 16.5 Waverage during normal operation. All instrument subsystems are surface treated with high ε, black
34
anodize hard coat for optimal emittance into the cavity under the blanket, and eventually to theback of the radiator. The aperture (collimator) plates are coated with Goddard Composite Coat-ing (GCC), a unique high ε, low α vacuum deposited film, intended to minimize solar heatingeffects. Thermal baffles between the three detector apertures and forward edge of the radiator arealso covered with silver Teflon.
A thermostatically actuated operational heater circuit of 2 W is provided on the isobutanegas regulation module to protect the regulation transducers from low temperature extremes(below 0oC). An 8 W survival heater circuit is provided on the instrument electronics box in theevent of an extreme cold temperature turn-on or other casualty. The survival heater has beendemonstrated to maintain the SEPICA cavity temperature to an average of +17oC.
9. Common Data Processing Unit (S3DPU) for SWICS, SWIMS and SEPICA
Three of the ACE-sensors, SWICS, SWIMS and SEPICA, are served by one common dataprocessing unit, whose heritage goes back to the DPUs for AMPTE-CHEM, Ulysses-SWICS,PHOBOS-SOWICOMS, Geotail-EPIC and SOHO-CELIAS, which have been designed andimplemented by the Technical University Braunschweig, Germany. The S3DPU is a directderivative of the SOHO-CELIAS DPU (Hovestadt et al., 1995). A common characteristic of thisDPU family is an event driven, table-oriented fast preprocessor for classification and priorityidentification, that is very flexible and can serve a variety of different sensors with identicalhardware. The general hardware and software functions as well as the design philosophy of theS3DPU are described in the following section, while the data structure and the scientific contentsare discussed in conjunction with the individual sensors. For SEPICA the data flow from the sen-sor to the spacecraft has been described in section 4. of this paper. The corresponding descrip-tion for SWICS and SWIMS may be found in the paper by Gloeckler et al. (1998) in this volume.
9.1 Tasks and General Structure
The S3DPU has been designed to perform the following tasks:1. Pathlength correction for passage through the electrostatic analyzer and the proportional
counter (PC) according to the impact positions in the PC and the solid state detectors forSEPICA;
2. Classification of pulse height analysis (PHA) events into:- a two dimensional M versus M/Q matrix for SWICS- a one dimensional M vector for SWIMS
and accumulate them separately into Matrix Rates (with low resolution in matrix space, energyseparation and high time resolution) and into Matrix Elements (with high resolution in matrixspace, energy integrated and low time resolution)
- two-dimensional Z versus Q Matrix Rates for SEPICA;3. Prioritization of PHA events from each sensor according to a predefined scheme and insertion
of these events into the PHA section of the Experiment Data Blocks;4. Formatting and transfer of the Experiment Data Block into the spacecraft telemetry;
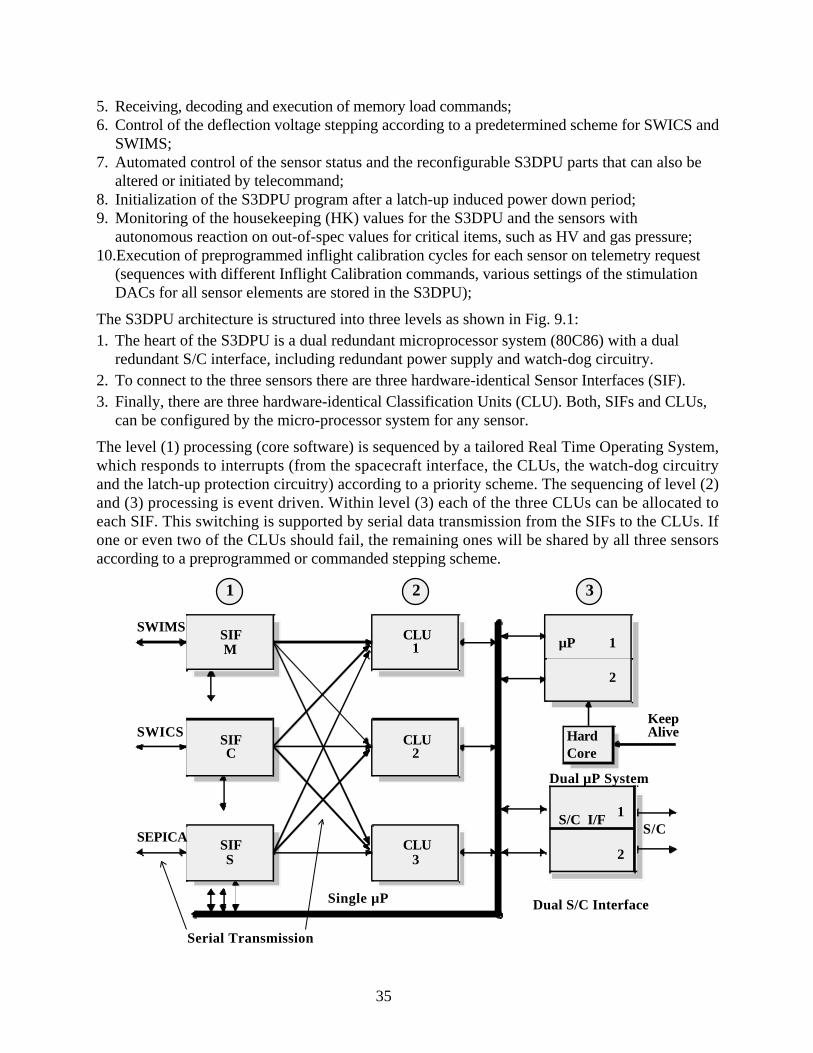
35
5. Receiving, decoding and execution of memory load commands;6. Control of the deflection voltage stepping according to a predetermined scheme for SWICS and
SWIMS;7. Automated control of the sensor status and the reconfigurable S3DPU parts that can also be
altered or initiated by telecommand;8. Initialization of the S3DPU program after a latch-up induced power down period;9. Monitoring of the housekeeping (HK) values for the S3DPU and the sensors with
autonomous reaction on out-of-spec values for critical items, such as HV and gas pressure;10.Execution of preprogrammed inflight calibration cycles for each sensor on telemetry request
(sequences with different Inflight Calibration commands, various settings of the stimulationDACs for all sensor elements are stored in the S3DPU);
The S3DPU architecture is structured into three levels as shown in Fig. 9.1:1. The heart of the S3DPU is a dual redundant microprocessor system (80C86) with a dual
redundant S/C interface, including redundant power supply and watch-dog circuitry.2. To connect to the three sensors there are three hardware-identical Sensor Interfaces (SIF).3. Finally, there are three hardware-identical Classification Units (CLU). Both, SIFs and CLUs,
can be configured by the micro-processor system for any sensor.
The level (1) processing (core software) is sequenced by a tailored Real Time Operating System,which responds to interrupts (from the spacecraft interface, the CLUs, the watch-dog circuitryand the latch-up protection circuitry) according to a priority scheme. The sequencing of level (2)and (3) processing is event driven. Within level (3) each of the three CLUs can be allocated toeach SIF. This switching is supported by serial data transmission from the SIFs to the CLUs. Ifone or even two of the CLUs should fail, the remaining ones will be shared by all three sensorsaccording to a preprogrammed or commanded stepping scheme.
SWIMS SIFM
CLU1
SWICS SIFC
CLU2
SEPICA SIFS
CLU3
HardCore
S/C I/F
2
µP
2
S/C
KeepAlive
Serial Transmission
Single µP
Dual µP System
Dual S/C Interface
1 2 3
1
1
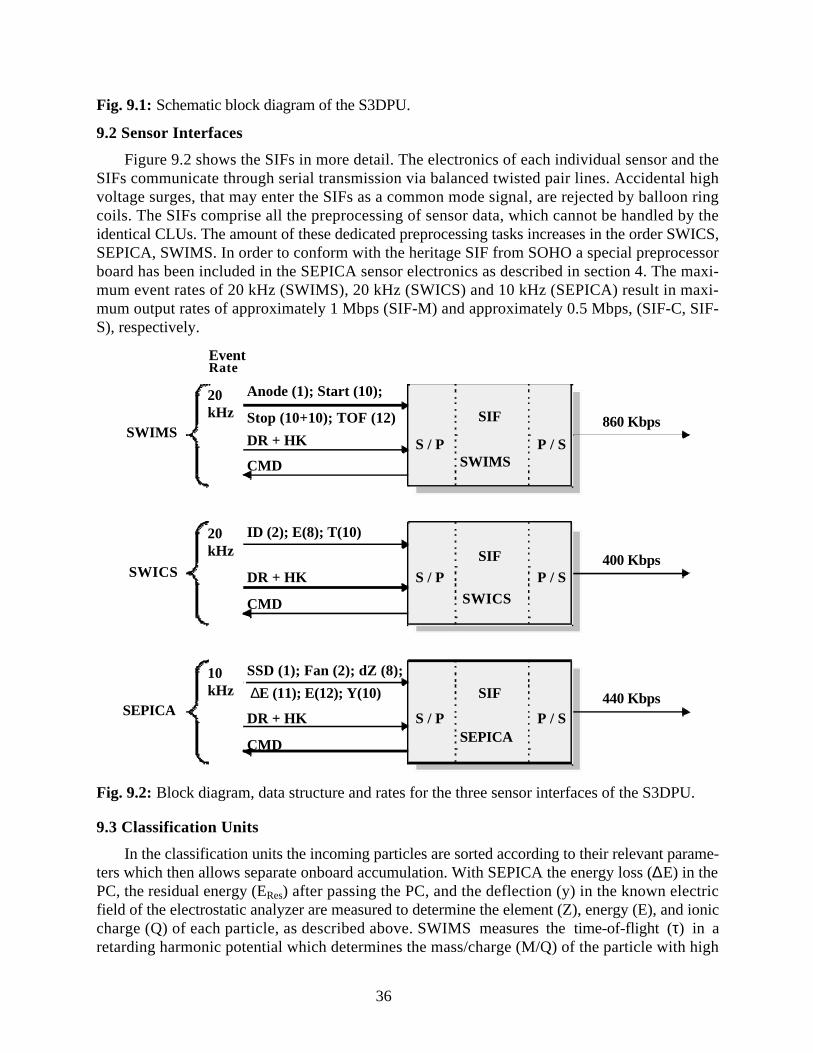
36
Fig. 9.1: Schematic block diagram of the S3DPU.
9.2 Sensor Interfaces
Figure 9.2 shows the SIFs in more detail. The electronics of each individual sensor and theSIFs communicate through serial transmission via balanced twisted pair lines. Accidental highvoltage surges, that may enter the SIFs as a common mode signal, are rejected by balloon ringcoils. The SIFs comprise all the preprocessing of sensor data, which cannot be handled by theidentical CLUs. The amount of these dedicated preprocessing tasks increases in the order SWICS,SEPICA, SWIMS. In order to conform with the heritage SIF from SOHO a special preprocessorboard has been included in the SEPICA sensor electronics as described in section 4. The maxi-mum event rates of 20 kHz (SWIMS), 20 kHz (SWICS) and 10 kHz (SEPICA) result in maxi-mum output rates of approximately 1 Mbps (SIF-M) and approximately 0.5 Mbps, (SIF-C, SIF-S), respectively.
SWIMS
20kHz
DR + HK
CMD
Stop (10+10); TOF (12)
Anode (1); Start (10);
860 Kbps
SWICS
20kHz
ID (2); E(8); T(10)
400 Kbps
SEPICA
10kHz ∆E (11); E(12); Y(10)
SSD (1); Fan (2); dZ (8);
440 Kbps
EventRate
S / P P / S
SIF
SWIMS
SIF
SWICS
SIF
SEPICA
DR + HK
DR + HK
CMD
CMD
S / P P / S
S / P P / S
Fig. 9.2: Block diagram, data structure and rates for the three sensor interfaces of the S3DPU.
9.3 Classification Units
In the classification units the incoming particles are sorted according to their relevant parame-ters which then allows separate onboard accumulation. With SEPICA the energy loss (∆E) in thePC, the residual energy (ERes) after passing the PC, and the deflection (y) in the known electricfield of the electrostatic analyzer are measured to determine the element (Z), energy (E), and ioniccharge (Q) of each particle, as described above. SWIMS measures the time-of-flight (τ) in aretarding harmonic potential which determines the mass/charge (M/Q) of the particle with high
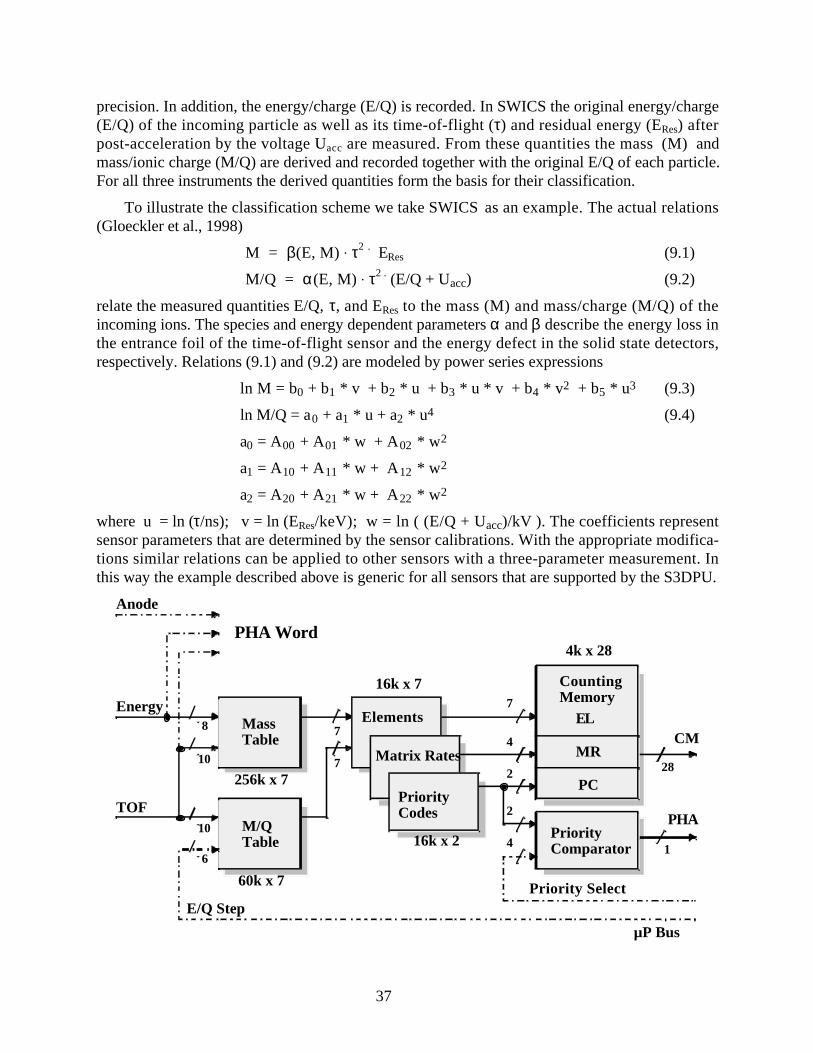
37
precision. In addition, the energy/charge (E/Q) is recorded. In SWICS the original energy/charge(E/Q) of the incoming particle as well as its time-of-flight (τ) and residual energy (ERes) afterpost-acceleration by the voltage Uacc are measured. From these quantities the mass (M) andmass/ionic charge (M/Q) are derived and recorded together with the original E/Q of each particle.For all three instruments the derived quantities form the basis for their classification.
To illustrate the classification scheme we take SWICS as an example. The actual relations(Gloeckler et al., 1998)
M = β(E, M) . τ2 . ERes (9.1)
M/Q = α(E, M) . τ2 . (E/Q + Uacc) (9.2)
relate the measured quantities E/Q, τ, and ERes to the mass (M) and mass/charge (M/Q) of theincoming ions. The species and energy dependent parameters α and β describe the energy loss inthe entrance foil of the time-of-flight sensor and the energy defect in the solid state detectors,respectively. Relations (9.1) and (9.2) are modeled by power series expressions
ln M = b0 + b1 * v + b2 * u + b3 * u * v + b4 * v2 + b5 * u3 (9.3)
ln M/Q = a0 + a1 * u + a2 * u4 (9.4)
a0 = A00 + A01 * w + A02 * w2
a1 = A10 + A11 * w + A12 * w2
a2 = A20 + A21 * w + A22 * w2
where u = ln (τ/ns); v = ln (ERes/keV); w = ln ( (E/Q + Uacc)/kV ). The coefficients representsensor parameters that are determined by the sensor calibrations. With the appropriate modifica-tions similar relations can be applied to other sensors with a three-parameter measurement. Inthis way the example described above is generic for all sensors that are supported by the S3DPU.
TOF
7 28
8
10
1
Priority Select
PHA
CM
Energy
16k x 7
16k x 2
7
10
4k x 28
4
2
2
7
E/Q Step
PriorityComparator
MassTable
Elements
CountingMemory
EL
MR
PriorityCodes
M/QTable
PC
Matrix Rates
256k x 7
60k x 7
4
PHA Word
µP Bus
6
Anode

38
Fig. 9.3: Flow diagram of the CLU coding for SWICS as an example.
In case of low event rates up to ≈ 1 kHz a numerical calculation of these relations can be per-formed by a standard microprocessor. Such a software-based approach has been applied, e.g., tothe energetic particle and ion composition instrument on Geotail (Williams et al., 1994). Higherevent rates call for a table-based evaluation within a dedicated preprocessor. For illustration pur-poses Fig. 9.3 shows a straight-forward implementation as a hardwired two-stage pipeline offixed-sized tables. The two-dimensional table of 28 entries in energy and 210 entries in time-of-flight delivers a seven-bit value for M = f (E, τ). Correspondingly, the two-dimensional table of210 entries in time-of-flight and 27 entries in energy per charge delivers a seven-bit value forM/Q. The combination of both table outputs defines one out of 214 fine resolution bins withinthe M-M/Q-plane. The three channel (M, M/Q, E/Q) address tables in the second pipeline stagecompact a set of adjacent fine resolution bins into an accumulation channel into either a MatrixRate, a Matrix Element, or a Priority Class for PHA events. The E/Q entry of the M/Q table isconstant over the period of each deflection voltage step, generally one spacecraft spin. Therefore,the size of the M/Q-table can be reduced to 1K x 7 by loading only the valid table section foreach E/Q step, provided the entire table is stored within additional random access memory(RAM).
At the extreme end of the implementation a task specific hardwired pipeline structure cansupport very high event rates (up to several 106 events/s), but at the expense of flexibility. Formedium event rates (104 - 105 events/s) the tables may be accessed in sequence. A compromise offive subsequent steps has been chosen for the S3DPU. The transition from parallel to sequentialtable access leads to a very flexible approach that is characterized by a large uniform addressspace and by mapping of the data flow diagram into a RAM-controlled state machine, which exe-cutes the various table operations step by step. Then the number of tables, their size and theinterconnection scheme can be configured in software. In this way the table contents are also con-figurable. Thus the processor can individualize the CLU for each sensor.
DIN
EventWord
Total Capacity512 K 7 (+ 1 Parity)Address
DOUT
ProgrammableSeq. & Crtl.
Incre-ment
RegisterSet+
AddressCompi-lation
Table 1
Table n
.
.
.
UniformRAM
max.16 K 28
CountingMemory
39
Fig. 9.4: Flow diagram of a typical classification software architecture along with the allocationof memory space to the relevant classification tables.
The RAM address space of the S3DPU CLUs can be configured into nine tables pluscounting channels as seen in Fig. 9.4. Typically, an individual table lookup returns anotheraddress, which after appropriate modification, e.g. by adding a base address, represents thepointer for the subsequent table access. The final result is the pointer to the counting channels tobe incremented (up to three in our example). The contents of the tables is routinely calculated andtransferred into the table locations by the active processor. Computation algorithms and coeffi-cients are stored in the micro-processor software. These EPROM-stored coefficients can bemodified via telecommand. In this way adjustments or even substantial adaptations to the algo-rithms can be implemented during the mission.
In addition to the two-dimensional matrix spectra, PHA-words of selected events areinserted into the experiment data frame. A priority code that biases against the most abundantspecies, such as H and He, is assigned to each event. This priority scheme is based on the sameclassification algorithm as the matrix elements, but with a much coarser resolution. For each PHAevent the resulting priority code is compared with a priority select mask that is computed by theprocessor based on previous events. If the priority of the current PHA event is accepted, theevent is read and added to the data block. The detailed requirements for the matrices and the PHAevent processing are described for SEPICA in chapter 4. The corresponding information forSWICS and SWIMS can be found in the paper by Gloeckler et al. (1998).
9.4 Data Validation and Redundancy Concepts
The S3DPU presents a potential single-point failure for three instruments and therefore hasto be inherently reliable. Therefore, great care has been taken to avoid single point failures in theS3DPU and to allow sharing of identical multiple hardware as much as possible. In particular, theS3DPU contains a dual redundant processor system. All core hardware that supports the basicoperating system is dual redundant with the exception of the bus system. This concept includes adual redundant spacecraft interface and a dual redundant power converter. Selection of the inter-face is controlled by a flip-flop, which toggles automatically with each power cycle of theS3DPU. The processor can be selected by toggling a selection flip-flop via a specific pulse com-mand issued by the spacecraft. The flip-flops belong to the minimum core hardware and arepowered by a keep-alive-line from the spacecraft. A high degree of redundancy is achieved for thethree identical CLUs by cross-strapping. If one or even two CLUs should fail, the remainingCLUs can be shared by all three sensors according to a cyclic automatic reconfiguration scheme.In case of the failure of one of the sensors, the CLUs can be configured such that the data streamwill be completely filled with data from the remaining active sensors.
The S3DPU is equipped with protection switches against latch-up through penetrating radia-tion. The S3DPU circuitry is subdivided into eight independent supply partitions. If a partition-individual threshold for the supply current is exceeded, the S3DPU is shut down completely,with the exception of the status memory and some status flip-flops. This core hardware is thenpowered by the keep-alive voltage. After a short delay time of ≈ 5 s the central switch will beclosed again, and the S3DPU is reinitialized. Since the current of the partitions varies substan-tially with the activity, a single threshold would have to be set so high that even a sub-thresholdlatch-up current could overheat a device after some time. Therefore, two thresholds are monitored

40
separately, a high threshold during regular S3DPU operation and a low threshold every 156 mswithin a short time window of ≈ 1 ms, when the S3DPU is driven into a sleeping state.
Great care has been taken with the software to run the unit inherently reliable and to ensuredata integrity. The software is protected by hamming single error correction (SEC) for both theprocessor-RAM and -EPROM. For example, single event upset (SEU) induced bit flips are cor-rected automatically by a SEC coder/decoder hardware in the S3DPU. The parity bit protectionis extended to the CLU table RAM in order to avoid SEU induced misclassifications. In addition,the table contents are routinely refreshed by recalculation from the stored parameter set.
9.5 Packaging
The S3DPU is built in classic card-cage technique. A stack of nine multilayer daughter boards isinterconnected by a multilayer motherboard with flexible extensions to all box connectors. Thebox walls have been designed to a thickness of 3 mm Al in order to provide sufficient shieldingfor the high-density standard RAM/EPROM devices within the CLUs and the microprocessor-systems, whose tolerance dose is approximately 15 krad. The S3DPU weighs 3.9 kg, uses 3.0 Won average (4.0 W peak) and can operate within -55oC and +85oC.
Acknowledgements
The investigators gratefully acknowledge the enthusiastic support with contracts, rush pur-chasing and accounting by the staff of the Space Science Center Jeanne Bartlett, Susan Roy, andPat Stevenson as well as the dedicated day-to-day assistance by Phyllis Kelly and Robin Pendex-ter. They wish to include in their thanks to the many unnamed individuals at the hardware con-tributing institutions. Four test and calibration campaigns at Brookhaven National Lab were madea success due to the help by Charles W. Carlson and his team. We also like say special thankspersonnel of the Goddard Space Flight Center test facilities who went to great lengths to helpSEPICA in the end game. In addition, we we would like to extend special thanks to the ACEPayload Management Office under Al Frandsen and the Explorer Project Office under DonMargolies for their continued assistance to keep the instrument implementation effort on track.
The University of New Hampshire would like to extend special thanks to the following peo-ple and their corporations. The expertise and dedication they brought to the project helped makeSEPICA become a true technological achievement for all involved. In no special order we thank:Mark Amrich, Thermo Electron (Tecomet), for the fabrication of the photo-etched collimatorplates; Forbes Powell, Luxel Corp., for the fabrication of the proportional counter polyimidewindows; Paul Burger, Canberra Semiconductor, for the fabrication of the Solid State Detectors;Hal Jerman, IC Sensors, for the fabrication of the micro-machined silicon regulation valves; DaveBroderick, Ceramic-to-Metal Seals, for the development and fabrication of the proportionalcounter anode and cathode plates; Dave Ferguson, MOOG Space Products Division, for the fab-rication of the main isobutane gas latch valve and regulator; Aleck Papanicolopoulos, StructuralComposite Industries, for the fabrication of the Isobutane tank; Jennifer Molin, Northeast EDM,for the fabrication of the collimator spacer plates; Steve Dunham, Dunham Engineering, for thedesign effort with the collimator assembly. Other notable companies with major contributions toSEPICA are Stone Machine, American Electroplating, Seacoast Machine, Bicron, AOTCO MetalFinishing, Janco P/C, Eastern Manufacturing Corp., Sovereign Circuits, Lockheed Sanders,Assurance Technology Corp., Plating for Electronics.

41
Without the continued help and dedication of all these institutions, companies and the manyindividuals this instrument would not have been possible. The design, fabrication and testingeffort for SEPICA was supported under NASA Contract #NAS5-32626 to the CaliforniaInstitute of Technology through subcontract # PC112778 to the University of New Hampshire.
References
Arnaud, M., R. Rothenflug, Astron. Astrophys. Suppl. Ser., 60, 425, 1985.
Baker, D.N., G.M. Mason, O. Figueroa, G. Colon, J.G. Watzin, and R.M. Aleman, An Overviewof the Solar, Anomalous, and Magnetospheric Particle Explorer Mission, IEEE Trans. onGeosci. and Remote Sens., 31, 531 - 541, 1993.
Fisk, L.A., B. Kozlovsky, and R. Ramaty, An Interpretation of the Observed Oxygen andNitrogen Enhancements in Low-Energy Cosmic Rays, Ap. J. Letters, 190, L39, 1974.
Gloeckler, G., J. Geiss, E.C. Roelof, L.A. Fisk, F.M. Ipavich, K. Ogilvie, L.J. Lanzarotti, R. vonSteiger, B. Wilken, J. Geophys. Res., 99, 17637, 1994.
Gloeckler, G., P. Bedini, P. Bochsler, L.A. Fisk, J. Geiss, F.M. Ipavich, J. Cain, J. Fischer, R.Kallenbach, J. Miller, O. Tums, R. Winner, Investigation of the Composition of Solar Windand Interstellar Matter Using Solar Wind and Pickup Ion Measurements with SWICS andSWIMS on the ACE Spacecraft, Space Science Reviews, this issue, 1998.
Hovestadt, D., et al., The Nuclear and Ionic Charge Distribution Particle Experiments on theISEE-1 and ISEE-C Spacecraft, IEEE Trans. Geosci. El., GE-16, 166, 1978.
Hovestadt, D., G. Gloeckler, H. Höfner, B. Klecker, C.Y. Fan, L.A. Fisk, F.M. Ipavich, J.J.O’Gallagher and M. Scholer, Direct Observation of Charge State Abundances of Energetic He,C, O, and Fe Emitted in Solar Flares, Adv Space Res., 1, 61, 1981.
Hovestadt, D., B. Klecker, H. Höfner, M. Scholer, G. Gloeckler and F.M. Ipavich, Ionic ChargeState Distribution of Helium, Carbon, Oxygen, and Iron in an Energetic Storm ParticleEnhancement, Ap. J. Letters, 258, L57, 1982.
Hovestadt, D., G. Gloeckler , B. Klecker and M. Scholer, Ionic Charge State MeasurementsDuring He+-rich Solar Energetic Particle Events, Ap. J., 281, 463, 1984.
Hovestadt, D., et al., CELIAS - Charge, Element and Isotope Analysis System for SOHO, in:The SOHO Mission, Solar Phys., 162, 441 - 481, 1995.
Jokipii, J.R., Particle Acceleration at the Termination Shock 1. Applications to the Solar Windand the Anomalous Component, J. Geophys. Res., 91, 2929, 1986.
Klecker, B., D. Hovestadt, G. Gloeckler, F.M. Ipavich, M. Scholer, C.Y. Fan, and L.A. Fisk,Direct Determination of the Ionic Charge Distribution of Helium and Iron in 3He-rich SolarEnergetic Particle Events, Ap. J. 281, 458, 1984.
Klecker, B., et al., HILT: A Heavy Ion Large Area Proportional Counter Telescope for Solar andAnomalous Cosmic Rays, IEEE Trans. on Geosci. and Remote Sens., 31 , 542 - 548, 1993.
Klecker, B., et al., Charge states of anomalous cosmic-ray nitrogen, oxygen, and neon: SAMPEXobservations', Ap. J. Letters, 442, L69, 1995.
Luhn, A., B. Klecker, D. Hovestadt, G. Gloeckler, F.M Ipavich, M. Scholer, C.Y Fan andL.A Fisk, Ionic Charge States of N, Ne, Mg, Si, and S in Solar Energetic Particle Events, Adv.Space Res., 4, 161, 1984.
Luhn, A., B. Klecker, D. Hovestadt, and E. Möbius, The Mean Ionic Charge of Silicon in 3He-Rich Solar Flares, Ap. J., 317, 951, 1987.

42
Lutz, G. , W. Buttler, H. Bergmann, P. Holl, B.J. Hosticka, P.F. Manfredi, G. Zimmer, LowNoise Monolithic Front End Electronics, MPI-PAE Report, Exp. El. 170, 1987.
Mason, G.M., et al., The Solar, Anomalous, and Magnetospheric Particle Explorer (SAMPEX),Adv. of Space Sci., 1991.
Mason, G.M., D.V. Reames, B. Klecker, D. Hovestadt, and T.T. von Rosenvinge, The HeavyCompositional Signature in 3He Solar Particle Events, Ap. J., 303, 849, 1986.
Möbius, E., D. Hovestadt, B. Klecker, M. Scholer, G. Gloeckler and F. M. Ipavich, Directobservation of He+ pick-up ions of interstellar origin in the solar wind, Nature, 318, 426,1985.
Mullan, D.J. and W.L. Waldron, Ionic Charge States of Solar Energetic Particles: Effects of FlareX-Rays, Ap. J. Letters, 308, L21, 1986.
Pfeffermann, E., et al., The Focal Plane Instrumentation of the ROSAT Telescope, SPIE 733,519, 1987.
Reames, D.V., Energetic Particles from impulsive Solar Flares, Ap. J. Supp., 73, 235, 1990.
Reames, D.V., Particle Acceleration in Solar Flares: Observations, in: Particle Acceleration inCosmic Plasmas, G.P. Zank, T.K. Gaisser eds., AIP Conf. Proc. 264, 213 - 222, 1992.
Stone, E.C., A.M. Frandsen, R.A. Mewaldt, E.R. Christian, D. Margolies, J.F. Ormes, F. Snow,The Advanced Composition Explorer, Space Science Reviews, this issue, 1998a.
Stone, E.C., C.M.S. Cohen, W.R. Cook, A.C. Cummings, B. Gauld, B. Kecman, R.A. Leske,R.A. Mewaldt, M.R. Thayer, R.L., Dougherty, R.L., Grumm, B.D. Milliken, R.G.,Radocinski, M.E. Wiedenbeck, E.R. Christian, S. Shurman, T.T. von Rosenvinge, The SolarIsotope Spectrometer (SIS), Space Science Reviews, this issue, 1998b.
Stone, E.C., C.M.S. Cohen, W.R. Cook, A.C. Cummings, B. Gauld, B. Kecman, R.A. Leske,R.A. Mewaldt, M.R. Thayer, R.L., Dougherty, R.L., Grumm, B.D. Milliken, R.G.,Radocinski, M.E. Wiedenbeck, E.R. Christian, S. Shurman, S. Trexel, T.T. von Rosenvinge,W.R. Binns, P. Dowkonn, J. Epstein, P.L. Hink, J. Klarmann, M. Eijowski, M.A. Oletich,The Cosmic Ray Isotope Spectrometer (CRIS), Space Science Reviews, this issue, 1998c.
Va’vra, J., Review of wire chamber aging, Proc.of Wire Chamber Conf., Vienna, 1986.
Williams, D.R., R.W. McEntire, C. Schlemm II, A.T.Y. Lui, G. Gloeckler, S.P. Christon, F.Gliem, Geotail Energetic Particles and Ion Composition Instrument, J. Geomag. Geoelectr.,46, 39, 1994.