The socio-economic gradient in early child outcomes ... · evidence from the Millennium Cohort...
87
The socio-economic gradient in early child outcomes: evidence from the Millennium Cohort Study IFS Working Paper 03/11 Lorraine Dearden Luke Sibieta Kathy Sylva
Transcript of The socio-economic gradient in early child outcomes ... · evidence from the Millennium Cohort...

The socio-economic gradient in early child outcomes: evidence from the Millennium Cohort Study
IFS Working Paper 03/11 Lorraine Dearden Luke Sibieta Kathy Sylva

1
The socio-economic gradient in early child outcomes:
evidence from the Millennium Cohort Study1
Lorraine Dearden
Institute for Fiscal Studies and Institute of Education, University of London
Luke Sibieta
Institute for Fiscal Studies
Kathy Sylva
University of Oxford
IFS Working Paper: W11/03
September 2010
DRAFT: please do not cite without permission
Abstract
This paper shows that there are large differences in cognitive and socio-emotional development
between children from rich and poor backgrounds at the age of 3, and that this gap widens by the
age of 5. Children from poor backgrounds also face much less advantageous “early childhood
caring environments” than children from better off families. For example we identify differences in
poor children‟s and their mothers‟ health and well-being (e.g. birth-weight, breast-feeding, and
maternal depression); family interactions (e.g. mother child closeness); the home learning
environment (e.g. reading regularly to the child); parenting styles and rules (e.g. regular bed-times
and meal-times), and experiences of childcare by ages 3 and 5. Differences in the home learning
environment, particularly at the age of 3 have an important role to play in explaining why children
from poorer backgrounds experience lower levels of cognitive development than children from
better off families. However, a much larger proportion of the gap remains unexplained, or appears
directly related to other aspects of family background (such as mothers‟ age, and family size) that
are not mediated through the early childhood caring environment. When it comes to socio-
emotional development, a greater proportion of the socio-economic gap does appear to be related to
differences in the early childhood caring environment.
Key words: home learning environment, early child development, socio-economic gap
1 This work was carried out as part of a larger body of work funded by the Joseph Rowntree Foundation (JRF)
through its programme of research on education and poverty. We gratefully acknowledge the support of JRF,
and the generous and productive guidance of Helen Barnard and Chris Goulden. We are also thankful to
members of the advisory group: Tim Crosier, Naomi Eisenstadt, Leon Feinstein, Zoe Ferguson, Tony Foot,
Leslie Gutman, Lisa Harker, Andrew Ledger, Mark Newman, Ivan Turok, Anna Vignoles, Jane Waldfogel,
and Stephen Witt. All errors remain the responsibility of the authors.

2
1. Introduction
Children growing up in poor families emerge from our schools with substantially lower levels of
educational attainment. These educational deficits emerge early in children‟s lives, even before
entry into school, and widen throughout childhood. Here, we examine some of the routes through
which family socio-economic position (SEP) affects cognitive development in the early years up to
age 5. Our focus is on a range of parenting behaviours, health and well being factors and family
interactions. We refer to these factors collectively as the “early childhood caring environment.”
These have seldom been measured together in large datasets, preventing comprehensive empirical
analysis of their role as predictors and consequences of poor child outcomes. In order to conduct
this analysis we will follow children over time within the Millennium Cohort Study (MCS), a recent
and detailed study of children born at the turn of the millennium. We examine both cognitive
outcome and socio-emotional development (measured at ages 3 and 5).
This working paper should be read in conjunction with three other working papers (Gregg et al
(2010); Chowdry et al (2010); and Crawford et al (2010)) that seek to examine the routes through
which SEP affects educational attainment at later ages: at ages 7-11 using the Avon Longitudinal
Study of Parents and Children; ages 11-16 using the Longitudinal Study of Young People in
England; and across generations using the British Cohort Study. We have attempted to make these
working papers as consistent with one another as possible, such that one can draw out common
themes and connect conclusions across time. However, there will naturally be some differences in
focus across these four working papers since the relevance and relative importance of different
factors will differ across childhood. For instance, the two studies of outcomes and influences later in
childhood place a greater importance than we do on child attitudes and aspirations, and on the role
of schools. Goodman and Gregg (2010) summarise the findings from all these working papers and
seek to draw out common themes, conclusions and policy implications.
The rest of this working paper proceeds as follows. Section 2 describes our theoretical and
empirical framework. Section 3 describes the data and summary statistics, including the socio-
economic gradients in early child outcomes and the early childhood caring environment. In section
4, we use multivariate regression techniques to explain the socio-economic gaps in child outcomes,
both in terms of cognitive and socio-emotional development. In section 5 we ask whether we can
also use measures of the early childhood caring environment to explain gradients across other
dimensions, such as by ethnicity and lone parent status. In section 6 we investigate the determinants
of selected measures of the early childhood caring environment in terms of pre-determined family
and childhood characteristics. Section 7 concludes.
2 Theory and Methodology
Theoretical Approach
There is a wealth of empirical research to suggest that family income and poverty have strong
consequences for child development, though to varying degrees and across different contexts (Blow
et al, 2006; Brooks-Gunn & Duncan, 1997; Duncan & Brooks-Gunn, 1997; Duncan & Brooks-
Gunn, 2000; Gregg and Machin, 1998; Haverman and Wolfe, 1995; Mayer, 1997; Sylva et al,
2008). This paper focuses on the mechanisms by which social and economic disadvantage may

3
translate into child outcomes. As such, the quantitative analysis undertaken in this paper is informed
by a number of theoretical literatures that hypothesise different routes through which advantage and
disadvantage may be transmitted from parents to children.
The economics literature has generally focused on theories of parental investment. For instance, in
the Becker-Tomes model parents invest in their children‟s education because they care about their
children‟s future well-being, investing up until the point that marginal benefit equals marginal cost
(Becker and Tomes, 1986). Under this simple optimising theory, parental income should not
influence child outcomes under the assumption that there are no credit constraints. Given that it
seems unlikely that all families will be able to borrow against future earnings, poorer families may
well not be able to invest optimal amounts (for more information on credit constraints see Carneiro
and Heckman, 2002). Beyond credit constraints, other economic models suggest that a lack of
income may place significant strains on poorer families, preventing them from providing a rich
home-learning environment or reducing the quality of parenting (for a review of such models see
Mayer, 1997).
The developmental psychology literature provides a detailed conceptual framework for studying the
effects of parental beliefs, attitudes and practices on children‟s cognitive and social emotional
development. Bronfenbrenner & Morris, 1998 (p.996) state that, “Throughout the life course,
human development takes place through processes of progressively more complex reciprocal
interaction between an active, evolving bio-psychological human organism and the persons, objects,
and symbols in its immediate external environment. To be effective, the interaction must occur on a
fairly regular basis over extended periods of time. Such enduring forms of interaction in the
immediate environment are referred to as proximal processes.” They further state that these
proximal processes vary systemically with individual characteristics and contexts.
The sociological literature examines how family beliefs, attitudes and practices can be construed as
social and cultural capital. For example, Bourdieu‟s work examines the role played by social and
cultural capital in reproducing patterns of social and economic advantage and disadvantage
(Bourdieu 1977a, 1977b; Bourdieu and Passeron 1977). Under the social capital theory, social
relationships and networks create a resource which families can draw upon (Croll, 2004). Cultural
capital reflects the idea that “cultural experiences in the home facilitate children's adjustment to
school and academic achievement, thereby transforming cultural resources into what [Bourdieu]
calls cultural capital (Lareau, 1987, p 74).”
In the past the developmental psychological literature has relied on observation, questionnaire and
interview methods. It usually relies on research with small samples of about 100 families, and rich
datasets. The sociological and economic literatures have usually relied on secondary analysis of
existing datasets, many of which contain information on a limited number of variables. The current
study attempts to use the extremely rich MCS data to bridge these three theoretical
approaches/literatures.
Empirical research that does exist is far from definitive, but a number of potential pathways are
frequently discussed in the literature (e.g. the home environment, quality of child care, parent-child
relationships etc.), many of which have been included in the present conceptual/analytical
framework, as outlined below.
Several studies have found that differences in the home environment, as measured by the HOME
scale (which includes items on household resources, such as reading materials and toys, and

4
parental practices, such as discipline methods), account for a substantial portion of the effect of
income on the cognitive development of preschool children and on the achievement scores of
elementary school children (Bradley, 1995; Brooks-Gunn et al., 1993; Duncan, Brooks-Gunn &
Klebanov, 1994; Korenman, Miller & Sjaastad, 1995). Similar findings have been obtained by the
Effective Provision of Pre-school Education (EPPE) Project in the U.K., which found that although
other family factors are also highly significant, the early years HLE (i.e. frequency of self-reported
parental involvement in a range of activities, such as reading, library visits, playing with
letters/numbers etc.) exerts a significant and independent influence on several cognitive (i.e.
attainment at ages 3, 5 and 11) and behavioural (i.e. self-regulation, pro-social behaviour, and
hyperactivity) outcomes. However, the EPPE HLE index is only moderately correlated (r=0.33)
with family SES or mother‟s qualification levels (Sylva et al, 2008).
Another important pathway involves the health and well-being of the child and parents (e.g. birth-
weight, gestation, breast-feeding patterns and indicators of post-natal depression). A 1990 analysis
in the U.S. indicated that the poverty-related heath factors such as low birth weight, elevated blood
lead levels, anaemia, and recurrent ear infections and hearing loss contributed to the differences in
IQ scores between poor and nonpoor four-year- olds (Goldstein, 1990). The findings suggest that
the cumulative health disadvantage experienced by poor children on these health measures may
have accounted for as much as 13% to 20% of the difference in IQ between the poor and nonpoor
children during the 1970s and 1980s (Goldstein, 1990). Parents who are poor are also likely to be
less healthy themselves, both emotionally and physically (Adler, Boyce, Chesney, Folkman &
Syme, 1993), and this could result in impaired parent-child interactions and fewer home learning
experiences (Bornstein, 1995; Bradley, 1995). For example, a study conducted by the U.S. National
Longitudinal Survey of Youth (NLSY) found that currently poor mothers spanked their children
more often than nonpoor mothers, and this harsh behaviour was an important component of the
effect of poverty on children‟s mental health (McLeod & Shanahan, 1993).
A third possible pathway is through the care young children receive outside the home, as much
research has shown that high-quality, developmentally appropriate child care in the pre-school years
is associated with enhanced social, emotional, and linguistic competence (Howes 1988; Hofferth &
Phillips, 1991; NICHD Early Child Care Research Network, 1997, 1998; Ramey & Ramey, 1998).
In addition, randomized trials have demonstrated that intensive early childhood programmes for
poor children can increase verbal ability and reasoning skills through early elementary school
(Belfield, Nores, Barnett and Schweinhart, 2006; Brooks-Gunn et al., 1994; Burchinal, Campbell,
Bryant, Wasik, & Ramey, 1997; Garces, Thomas and Currie (2002); Lazar & Darlington, 1982;
Ludwig and Miller (2007); Ramey & Ramey, 1998).
Our empirical research is based on a very simple model linking two indicators of potential financial
(dis)advantage, namely socio-economic position and parental education, to child outcomes
measured from age 3 to age 5 (see Figure 1). The starting point is the fact that there are strong
socio-economic gradients in educational outcomes observed at all ages (three related papers show
how this changes for older cohorts of children). The raw socio-economic gaps are represented by
arrow A in the Figure 1.

5
Figure 1 Simple model linking financial position to early education outcomes
We then explore some of the potential pathways or „mediating factors‟ through which child poverty
and disadvantage may lead to poor child outcomes. We consider two important sets of potential
mediating factors, the first of which are the “family background” variables that are commonly
observed in many data sources. They include: characteristics of the child such as ethnicity, gender,
and month of birth; and family characteristics such as number of siblings, mother‟s age at birth,
parental employment and lone parent status. The effects of family background on child outcomes is
shown as arrow (C) in the figure – the fact that there are arrows in both directions illustrates that the
effects we identify might not be causal, but instead in some cases reflect reverse causation and work
in the other direction in some cases. The mediation of the SEP gradient (A) works via the
combination of the effect of SEP family background (B) and the effects of family background on
child outcomes (C).
The second set of potential mediating factors is less commonly observed in datasets and we refer to
these as measures of the early childhood caring environment. This includes the nature of family
Child outcomes
at age 3 and 5
Cognitive Vocabulary (BAS)
School Readiness
(Bracken)
Socio-Emotional Emotional symptoms,
conduct problems,
hyperactivity/inattention,
peer relationship
problems (SDQ)
Family Interactions
(e.g. mother child relationships, parental
relationships)
Health and well-being (e.g. birth-weight. length of gestation,
breastfeeding, postnatal depression)
Childcare (Type and incidence of childcare)
Home Learning Environment (e.g. Frequency of reading books to
children, visits to library)
Parenting Style/Rules
(e.g. regular meal and bedtimes)
Early Childhood Caring
Environment
Child
Characteristics
Gender, twin/triplet,
ethnicity, child age.
Family
characteristics
Number of siblings,
marital status, lone
parent status
Indicators
of (dis)-
advantage
SEP
Parental
Socio-
Economic
Position
Education
Mother‟s
and father‟s
highest
qualification
Family Background
A
C
B D
F
E

6
interactions, health and well-being factors, childcare arrangements, the home learning environment
(HLE), and parenting style and rules. These factors are interrelated, and seem to be the most likely
to influence child development between birth and the age of five. Our choice of potential mediating
factors reflects the diverse social science literature on the determinants of educational success, as
well as by data availability.
The mediation of the SEP gradient by the early childhood caring environment is shown by arrow F,
though the direction of causation might also be slightly unclear in this case. These factors will
mediate the SEP gradient both via the effects of SEP on the early childhood caring environment
(arrow E), and the early childhood caring environment on child outcomes (arrow F). However, these
factors might also mediate the effects of family background (arrow C) via a combination of arrows
D and F. We will briefly investigate the mediation of family background effects in section 5, and we
will also show the effects of (pre-determined) family background characteristics on the early
childhood caring environment (arrow D). However, the main part of the analysis will focus on the
mediation of the socio-economic gradient (arrow A).
Empirical Approach
In this paper, we follow same approach as taken in Gregg et al (2010), Chowdry et al (2010) and
Crawford et al (2010). We first set out the raw differences in each educational outcome according to
socio-economic position of the parents, focusing on the gap between the top and bottom quintiles
(top-bottom gap) as well as the gap between the middle and bottom quintiles (middle-bottom gap).
As in the other three papers, all gaps are expressed in percentile point terms.
In order to explain these gaps, we will use two multivariate OLS regression techniques. In the first
technique we start by showing the raw differences in each educational outcome and then track the
coefficients on the middle and top socio-economic quintile. We then successively add to the model
sets of potentially mediating variables, observing in each case how much the socio-economic
gradient is reduced when these variables are added. In the final part of this analysis, we run a
regression with all groups of variables included; this indicates the total amount of the socio-
economic gaps that can be explained by our groups of factors considered together.
However, this method will suffer from an ordering bias. Observed reductions in the socio-economic
gap following the addition of an individual group of factors, such as the home-learning
environment, will measure both the effect of this factor and the effect of other factors with which it
is correlated, e.g. parenting styles/rules. In order to avoid some of this bias, we control for family
background characteristics and parental education before examining the role played by our set of
potential mediating factors measuring the early childhood caring environment. This allows us to
measure the extra effect of each set of mediating factor over and above the effects of parental
education and demographics. Unfortunately, this creates a second problem in that we may attribute
some of the role played by our measures of the early childhood caring environment to demographics
and parental education instead.
We therefore use a second methodology that attempts to isolate the role of each factor in explaining
the socio-economic gradient in child outcomes, after controlling for all observable characteristics.
We decompose the raw gap in child outcomes into the amount explained by each variable. This is
calculated as the coefficient on each variable (taken from a regression including all observable
characteristics) multiplied by mean differences in that variable across quintiles of our socio-

7
economic position index. We group similar mediating factors together, but at a more detailed level
than in our first methodology. The sum of the amount explained by all groups of potential mediating
factors represents the total amount explained by observable characteristics; the rest of the raw gap is
thus unexplained. It is important to note here that the amount explained by any given factor is
conditional upon everything else included in the model. The amount explained by each factor (e.g.
education) reflects by how much we predict the socio-economic gap would close if the rich-poor
gap in solely this factor were equalised (e.g. equalising education levels, but not the home-learning
environment, parental health or anything else in the model).
Furthermore, the relationships we estimate are unlikely to be causal. For example, for our estimates
to be the causal impact of these factors, we would have to argue (among other things) that our
measures of family characteristics, and in particular our mediating factors, cannot be affected by the
child outcomes of interest. However, it is highly likely that factors, such as the child‟s home
learning environment, are going to be influenced by the child‟s cognitive development. We do not
attempt to take into account this possible simultaneity. Furthermore, we would also have to argue
that there are no other unobserved characteristics of the child or family that influence these
mediating factors as well as the child outcomes we measure. Again, this is unlikely to be true and
this means that our estimates of the impact of different mediating factors are likely to be biased.2
While our work (along with most other work in this area) cannot robustly establish the presence of
direct causal links between these factors, we are fortunate to have an extremely rich dataset at our
disposal, that allow us to observe in great detail a wide range of family background variables,
family health and well-being as well as parenting activities, relationships and behaviours, that serve
as plausible transmission mechanisms between child poverty and poor early educational attainment.
This should give us some clues as to possible policy responses to address the socio-economic gaps
in early child outcomes, as well as avenues for future research.
3. Data and descriptive statistics
The Millennium Cohort Study MCS began as a longitudinal study of approximately 18,000 children
born in the UK in 2000. The first sweep of the study was conducted when MCS children were about
9 months old. This over-sampled individuals from ethnic minorities and individuals living in
disadvantaged areas of the country. Three further sweeps of data have since been collected when the
children were aged about 36 months (sweep 2), when they were about 5 years old (sweep 3) and
when they were 7 years old (sweep 4). Further sweeps of data will be collected at future key
milestone ages. For our analysis, we chose to sample those who responded to the first three surveys
and those where the mother is the main respondent3. We also excluded individuals who had
2 Without the help of any experimental variation in SEP, parental income, or indeed any mediating factors of
interest in this project, we cannot rule out that there are unobservable factors (such as genetics, or typically
unobserved attributes such as motivation of parent) that instead explain low incomes, poor achievement, and
the potential transmission pathways we have highlighted. Structural Equation Models or Instrumental
Variables Methods could be used to correct for this. However, the assumptions they rely on (e.g. exclusion
restrictions and non-linearities) are not credible in this context and it is easy to show that results are very
sensitive to the particular assumptions made.
3 At the time of writing, the fourth sweep has only very recently become available.

8
missing data for some key characteristics, such as education, measures of the home-learning
environment, child outcomes and ethnicity. This left us with approximately 11,100 observations.
We proxy for each child‟s socio-economic background using two measures: a socio-economic
position index and parent(s) highest educational qualifications. We construct our index of socio-
economic position by performing principal-component analysis on a number of potential proxies for
socio-economic background (equivalised income, mother‟s class, father‟s class, housing tenure,
whether the family have experienced financial difficulties and a number of questions that measure
the level of material deprivation experience by the family). We then take the first principal
component and use this as an index of socio-economic position.
Child outcomes
In this paper, we focus on socio-economic differences in measures of both cognitive and non-
cognitive development. In particular, we analyse three outcome measures for children‟s
development: the British Ability Scales (Early Years version) Vocabulary Test, the Bracken Child
Cognitive Assessment, and the Goodman “Strengths and Difficulties” Profile. These outcomes
require a little bit more explanation and discussion.
The Bracken tests children‟s knowledge of colours, letters, the names of numbers, sizes and shape
words such as “circles, square and triangle.” On one level it is rather easy to increase because it
assesses a small list of vocabulary or concept names that are deemed to be “important” in Early
Years Education Provision.
The BAS test measures children‟s capacity to verbally name what they see in a picture. It is a test in
children‟s productive vocabulary in English. Vocabulary is highly correlated with general
intelligence, and represents knowledge closely aligned with the “cultural capital” of the child‟s
environment. It is not easy to shift vocabulary up as it depends on weeks/months/years of
conversations between adults and children and it also depends (probably) on adults reading to
children. Children acquire a rich vocabulary through exposure to sophisticated English language
and also through their own participation in conversations. Children are not “taught” vocabulary in
the same way they can be “taught” the elements of the Bracken test.
We then use the measure of Strengths and Difficulties (SDQ) in sweeps 2 and 3 as our measure of
non-cognitive development. The four subscales of the Goodman constitute an index of general
“emotional behavioural problems”. These are: emotional symptoms or “internal problems”, conduct
problems, hyperactivity, peer relationship problems. The fifth subscale is called pro-social
behaviour and this was added later to the original scale which looked only at problem behaviours.
We have combined the four sub-scales representing emotional behavioural problems into a single
score, but have rescaled it such that higher scores represent better outcomes in some sense.
The BAS is generally recognised as an excellent measure of children‟s vocabulary, and thus is
highly correlated with other language measures as well. It is also one of the best predictors of
children‟s all-around intelligence- and, like IQ, it is not easy to drive up or down as there is a strong
genetic component in it as well. On the other hand, the Bracken measures children‟s “school
readiness” words and concepts and it‟s much easier to shift in positive direction through Early
Childhood Education Programmes. The Goodman SDQ measure is a well recognised and valid
assessment of children‟s behaviour problems, though the fifth positive subscale of pro-social

9
behaviour is rarely combined with the other four negative subscales. Again, for ease of
interpretability we have converted all outcome measures into percentile ranks.
Socio-economic differences in child outcomes
To illustrate differences in these outcomes across measures of socio-economic position, we divide
children into five equally sized quintiles of our socio-economic position index, those with lowest
socio-economic status are in the bottom quintile and those with the highest socio-economic status
are in the top quintile. The data is also weighted to take account of both the sampling design and
non-response.
Figure 2 shows the average percentile rankings of cognitive child outcomes at age 3 (Bracken,
BAS) and age 5 (BAS only) for these five SEP quintiles. It shows that those in the top SEP quintile
have an average percentile Bracken ranking of 64, whilst the bottom quintile has an average
percentile ranking of 34. The gap between the top and the bottom is thus just over 30 percentile
points. The gap between the top and bottom quintiles for the BAS is lower at 23 percentile
percentile points. By age 5, the gap between the top and bottom quintiles has widened for the BAS
score, standing at around 25 percentile points.
Figure 3 shows the average percentile rankings for socio-emotional development (SDQs) at ages 3
and 5. It shows that the gap between the top and bottom quintiles at age 3 in terms of socio-
emotional development is similar to the gap for BAS scores, standing at about 22 percentile points.
By age 5 this has widened slightly to 23 percentile points.
In Table 1(a) – Cognitive ability at ages 3 and 5, by parents‟ SEP
Proportion of children: SEP Q1 SEP Q2 SEP Q3 SEP Q4 SEP Q5
Bottom 40% at Age 3 (BAS) 59.0 48.7 38.7 32.0 26.4
Escape from bottom 40% by Age 5 (BAS) 25.7 25.7 32.8 42.4 53.0
Top 40% at Age 3 (BAS) 23.9 23.9 34.0 45.1 52.4
Drop out of top 40% by Age 5 (BAS) 57.0 57.0 49.2 40.7 33.8
Bottom 40% at Age 5 (BAS) 62.2 62.2 51.1 40.2 30.4
Top 40% at Age 5 (BAS) 21.9 21.9 31.0 41.5 52.2
Table 1(b) – Strengths and Difficulties at ages 3 and 5, by parents’ SEP
Proportion of children: SEP Q1 SEP Q2 SEP Q3 SEP Q4 SEP Q5
Bottom 40% at Age 3 58.6 46.2 36.2 30.8 24.6
Escape from bottom 40% by Age 5 20.2 26.0 28.9 33.5 39.1
Top 40% at Age 3 20.9 30.2 37.0 41.4 48.7
Drop out of top 40% by Age 5 59.6 46.3 40.2 35.0 29.9
Bottom 40% at Age 5 65.8 52.0 42.9 37.7 29.2
Top 40% at Age 5 19.5 29.8 36.4 41.3 50.2
we investigate the dynamics of the BAS (a) and SDQ (b) scores in a little bit more detail. As we
would expect, children in lower SEP quintiles are much more likely than those in higher quintiles
quintile to be in the bottom 40% of BAS scores at age 3. However, lower quintiles are also much
less likely to escape the bottom 40% by age 5, only around 26% of children from the bottom
quintile do so whilst over half of the top quintile do so. Again, as we would expect, children from
10
lower quintiles are less likely to be in the top 40% of BAS scores at age 3. Those who were in the
top 40% at age 3, though, are more likely than higher quintiles to drop out of the top 40%4. So not
only do children from lower SEP quintiles have lower average outcomes at age 3, but they are more
likely to stay in the bottom 40% of achievers and more likely to drop out of the top 40%.
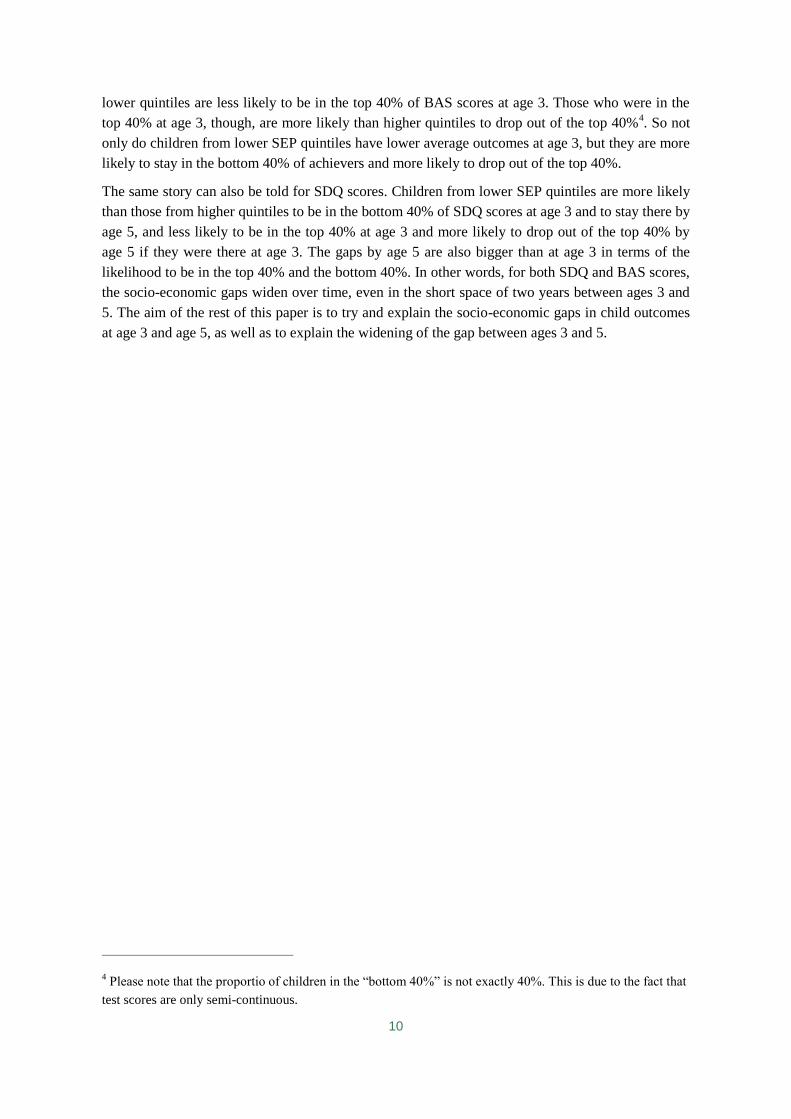
The same story can also be told for SDQ scores. Children from lower SEP quintiles are more likely
than those from higher quintiles to be in the bottom 40% of SDQ scores at age 3 and to stay there by
age 5, and less likely to be in the top 40% at age 3 and more likely to drop out of the top 40% by
age 5 if they were there at age 3. The gaps by age 5 are also bigger than at age 3 in terms of the
likelihood to be in the top 40% and the bottom 40%. In other words, for both SDQ and BAS scores,
the socio-economic gaps widen over time, even in the short space of two years between ages 3 and
5. The aim of the rest of this paper is to try and explain the socio-economic gaps in child outcomes
at age 3 and age 5, as well as to explain the widening of the gap between ages 3 and 5.
4 Please note that the proportio of children in the “bottom 40%” is not exactly 40%. This is due to the fact that
test scores are only semi-continuous.

11
Figure 2 – Cognitive Child Outcomes by SEP Quintile
Figure 3 – Socio-emotional Development by SEP Quintile
Potential Mediating Factors
Here we describe the groups of variables that we have chosen to examine as potential mediating
factors of the socio-economic gradient.
Parental Education consists of variables that measure parent(s) highest educational qualification.
We measure this as the highest equivalent NVQ level for both mothers and, where present, fathers.
Dummy variables are included for other qualifications that could not be categorised into an NVQ
level.
Family Background consists of variables pertaining to characteristics of the child and the family.
We frequently separate them out into child and family characteristics. Child characteristics include:
the sex of the child; their age; whether they are a twin or triple; whether the child was in special
care unit just after birth; and their ethnicity. Characteristics of the rest of the family include:
mother‟s age at birth (plus a quadratic term); a separate teenage mother dummy; parental
employment at sweeps 1, 2 and 3; whether only English is spoken in the household at sweep 1;
0
10
20
30
40
50
60
70
Bottom 2 3 4 Top
Ave
rag
e P
erc
en
tile
Ra
nkin
g
Bracken BAS (age 3) BAS (age 5)
0
10
20
30
40
50
60
70
Bottom 2 3 4 Top
Ave
rag
e P
erc
en
tile
Ra
nkin
g
Age 3 Age 5

12
marital status and partnering of the parents at sweeps 1, 2 and 3; the number of siblings and older
siblings at sweeps 2 and 3.
The next groups of variables are those we collectively refer to as measure of the early childhood
caring environment.
Family Interactions are measured by degree of parental harmony at sweeps 1 and 2 (based on
principal-component analysis of a shortened version of the Golombok Rust Inventory of Marital
State); interviewer assessed measure of mother-child closeness at sweep 2 (defined by number of
items where mother and child appeared close); mother-child relationship and conflict problems
measured as the number of problems identified on 15-item sub-scales of the Pianta index (the
parent-child relationship scale and the parent-child conflicts scale); and whether mothers and fathers
felt that they spent plenty of time with their children at the second sweep.
Health and Well-Being is measured by the number of cigarettes smoked by the mother per day
whilst pregnant; units of alcohol mothers reported drinking whilst pregnant; length of gestation
(days); birth-weight (kg); did the mother try to breast-feed; age at which breast-feeding ceased (0-
26 weeks); still breast-feeding after 26 weeks; whether the mother was suffering from post-natal
depression during the child‟s early infancy; infant temperament (mood, regularity and adaptability);
the mother‟s height, weight and body mass index before birth; and the father‟s height, weight and
body mass index at sweep 1.
(Non-Maternal) Childcare is constructed from sweeps 2 and 3 information to create nursery
school/class, playgroup, pre-school or childminder use by the ages of 3 (sweep 2) and 5 (sweep 3).
Home Learning Environment is constructed from the home learning environment index (frequency
of reading to child, library visits, play with ABCs/letters, teaches numbers/shapes, songs/nursery
rhymes, drawing/painting) and divided into quintiles in our sample. We also separately control for
self-reported parenting competency; frequency of reading to child (which is also included in HLE
index). Including frequency of reading in addition to the overall HLE index allows us to see
whether reading has a differential effect to the others elements. All measures are available at both
sweeps 2 and 3.
Parenting styles/rules measures whether: the parents have lots of rules (at sweep 2); parents strictly
enforce rules (sweep 2); children have regular bed-times (sweeps 2 and 3); children have regular
meal times (sweeps 2 and 3); family eats breakfast together (sweep 3); children watch more than 3
hours of TV a day (sweeps 2 and 3); children play computer for more than 1 hour per day (sweep
3).

13
Table then shows socio-economic differences in parental education, family background and
measures of the early childhood caring environment.
As one might expect, mothers and fathers in the bottom quintile are less highly qualified than those
from higher quintiles. For example, less than 7% of mothers in the bottom quintile have educational
qualifications equivalent to NVQ level 4 or higher (i.e. university or equivalent), as compared with
over 70% of the highest quintile).
Children from higher SEP quintiles are slightly more likely to be twins or triplets and to have been
in a special care unit shortly after birth. Children from lower SEP quintiles are also more likely to
be from ethnic minorities (though Indian children are most likely to come from the middle SEP
quintile). There are bigger differences across the SEP quintiles when we move on to examine
differences in characteristics of the rest of the family. Mothers in the lowest SEP quintile were, on
average, younger at the time of birth than those from higher quintiles. Mothers (and fathers, where
present) are more likely to have been in employment across the three sweeps of the MCS. Nearly
three quarters of mothers from the richest SEP quintile were in work at the time of the third sweep,
as compared with less than 30% of the poorest quintile. Children from the poorest quintile are less
likely to speak only English at home as compared with richest quintile.
Looking at measures of family size and structure, we observe that children in the bottom SEP
quintile are more likely to have come from lone-parent families than those from higher quintiles at
the first MCS sweep (about 37%, as compared with just under 1% of the top SEP quintile). If two
parents are present, parents in the bottom SEP quintile are also more likely to be cohabiting than
those from higher quintiles (about a third at the first sweep, as compared with a little over 12% of
the richest quintile). Children from the bottom SEP quintile, on average, also have a greater number
of siblings (numbers shown in table are for the third sweep).
The table then moves on to examine differences in our measures of the early childhood caring
environment. The first panel relates to family interactions. Lower SEP quintiles seem to experience
more mother-child relationship and conflict problems than richer SEP quintiles. Where they are
together, there is also less parental harmony amongst parents in poorer SEP quintiles than in the
richest SEP quintile.
Mothers in the richest SEP quintile are more likely to try breast-feeding than those from poorer
quintiles (90% of the richest quintile compared with 52% of the poorest quintile). If they do breast-
feed, mothers from the richest SEP quintile are likely to breast-feed for longer as well. However,
mothers in the bottom quintile do not, on average, report consuming more units of alcohol during
and after pregnancy Mothers in the bottom quintile are, however, more likely to smoke during and
prior to pregnancy. Mothers from the poorest quintile also have a shorter length of gestation and
their children have lower birth-weights5. There are also differences in infant temperament, in terms
of mood, regularity and adaptability. It is also noteworthy than whilst 7% of mothers from the
richest quintile suffered from maternal depression during early infancy, about 22% of mothers from
the poorest quintile did so. Parents from the richest quintile also report being taller at birth than
parents from the poorest quintile, and report being slightly heavier. However, when we look at the
proportion classed as over-weight or obese, there is less of a clear pattern.
5 This may be related to ethnic differences in birth weight. Dearden, Mesnard and Shaw (2006) show that
ethnic minorities tend to have lower birth weights.

14
Examining childcare patterns up to sweep 2, we find that children from the poorest SEP quintile are
more likely to have been to a nursery school or class than those from richer SEP quintile, but less
likely to have been to a pre-school, childminder, day nursery or crèche. Children from the middle
SEP quintile are those most likely to have been to a playgroup. These patterns continue up to sweep
3, though (as we would expect) noticeably more children have been to a nursery school or class
between sweeps 2 and 3.
The next part of the table examines socio-economic differences in the home-learning environment.
We find that children from the poorest SEP quintiles are least likely to be in the richest quintile of
our HLE index at sweeps 2 and 3. They are less likely to be read to every day at sweeps 2 and 3.
Nearly 80% of children in the richest SEP quintile are read to every day at sweep 2, compared with
42% of the poorest SEP quintile.
The last block of the table shows that children from the richest quintile are more likely to have lots
of rule and for these to be strictly enforced at sweep 2. They are also the most likely to have regular
bed-times or meal times at sweep 2 (about 92% of these children have a regular bed-time compared
with around 68% of those from the poorest SEP quintile). These differences continue up to sweep 3,
though are less dramatic. Children from the poorest SEP quintile are also more likely to watch more
than 3 hours of TV a day at sweeps 2 and 3 than those from higher quintiles, are more likely to play
more than one hour of computer a day at sweep 3.
Therefore, there are a wide variety of socio-economic differences across a range of factors, from
number of siblings, birth-weight and reading frequency to regularity of bedtimes, mother‟s age at
birth and childcare patterns. But which of these factors explain the socio-economic gaps in child
outcomes at ages 3 and 5 that we saw earlier. This is the focus of the next section.
4. Explaining socio-economic gradients in child outcomes
The aim of this section is to see how much observed socio-economic differences in child cognitive
and socio-emotional development at the ages of 3 and 5 can be explained by differences in parental
education and family background characteristics, and how much can then be explained by the wider
measures of the early childhood caring environment, including: family interactions; health and well-
being; (non-maternal) childcare; the home-learning environment; and parenting style and rules.
We begin by using the two methodologies to account for socio-economic differences BAS scores at
age 3. We then focus on the results of the second methodology for all other outcomes and
specifications. It is important to remember here again that the amount explained by each factor is
conditional on all other factors remaining constant.
Cognitive Ability
Age 3 - BAS (Vocabulary)
In column (1) of Table 3 we show the raw gap at age 3 in BAS average percentile ranks between the
top and bottom quintiles of our index of socio-economic position (22.7 ppts), as well as the gap
between the middle and bottom quintiles (13.8 ppts). Both are statistically significant at the 1%
level. We refer to the former as the top-bottom gap and the latter as the middle-bottom gap.

15
Column (2) shows how much of these estimated gaps remain after controlling for parental
education, both in average percentile ranks terms and as a percentage of their raw value. According
to this methodology, nearly 35% of observed gaps in socio-economic differences can be accounted
for by differences parental education. Column (3) then shows that a further 25% of the gap can be
accounted for by differences in family background characteristics such as ethnicity, number of older
siblings, lone-parent status and mother‟s age. Considered together, parental education and family
background characteristics explain nearly 60% of the raw gap in BAS scores at age 3.
Columns (4) to (8) shows how much this gradient is reduced after we control for
each element of the early childhood caring environment. Column (9) shows how
much the socio-economic gaps remain after we control for all observable
characteristics. Taken together, all factors reduce the middle-bottom gap by nearly
69%, with 31% of the initial gap remaining; they reduce the top-bottom gap by
66%, with 34% of the raw gap remaining. The factors which explain the largest
proportion of the gaps are parental education and family background
characteristics, with a further small role played by the home-learning environment
and health and well-being factors – around 5% each. The full regression results in
column (9) are shown in

16
Table 7 - Explaining socio-economic gaps in non-cognitive ability at age 3 (SDQ)
Percentile point gap As % total gap
Q5-Q1 Q3-Q1 Q5-Q1 Q3-Q1
Raw Gap 21.57 13.70 100% 100%
Total: Explained 17.74 10.34 82% 75%
Total: Unexplained 3.84 3.36 18% 25%
Amount Explained by Groups of Factors:
Parental Education 3.74 1.39 17% 10%
Family Background 3.36 2.33 16% 17%
Gender -0.06 -0.04 0% 0%
Age of Child -0.26 -0.22 -1% -2%
Twin/Triplet 0.02 0.01 0% 0%
Special care unit after birth -0.01 0.00 0% 0%
Ethnicity -0.22 -0.23 -1% -2%
Only English spoken at home 0.06 0.05 0% 0%
Country of residence -0.06 0.00 0% 0%
Mother works 0.18 0.15 1% 1%
Father works -0.67 -0.60 -3% -4%
Mother's age at birth 3.75 2.61 17% 19%
Marital/Partner Status 0.75 0.60 3% 4%
Siblings -0.12 0.00 -1% 0%
Family Interactions 3.05 2.30 14% 17%
Mother-child closeness 2.65 2.13 12% 16%
Parental Harmony 0.57 0.27 3% 2%
Parental time -0.17 -0.11 -1% -1%
Health and Well-Being 3.73 2.22 17% 16%
Breast-feeding 1.36 0.67 6% 5%
Alcohol consumption 0.07 0.01 0% 0%
Smoking before pregnancy 0.41 0.29 2% 2%
Smoking during pregnancy 0.75 0.59 3% 4%
Gestation Length 0.02 0.01 0% 0%
Birth weight 0.22 0.17 1% 1%
Infant Temperament 1.01 0.80 5% 6%
Maternal Depression 0.30 0.21 1% 2%
Parental height/weight -0.40 -0.53 -2% -4%
Childcare 0.13 -0.10 1% -1%
Home-Learning Environment 1.88 1.01 9% 7%
HLE and Reading at Age 3 0.70 0.43 3% 3%
Self-reported parental competence 1.18 0.58 5% 4%
Parenting Style/Rules 1.97 1.24 9% 9%
Amount/strictness of rules 0.21 0.08 1% 1%
Regular bed times at age 3 0.61 0.36 3% 3%
Regular meal times at age 3 0.53 0.38 2% 3%
Watches lots of TV at age 3 0.62 0.42 3% 3%
Missing Dummies -0.14 -0.06 -1% 0%

17
Table 8 - Explaining socio-economic gaps in non-cognitive ability at age 5 (SDQ)
Levels „Value-added‟
Percentile point
gap As % total gap
Percentile point
gap As % total gap
Q5-Q1 Q3-Q1 Q5-Q1 Q3-Q1 Q5-Q1 Q3-Q1 Q5-Q1 Q3-Q1
Raw Gap 23.40 14.37 100% 100% 23.40 14.37 100% 100%
Total Explained 19.04 12.09 81% 84% 21.05 13.79 90% 96%
Total Unexplained 4.37 2.28 19% 16% 2.36 0.58 10% 4%
Amount Explained by Groups of
Factors:
Prior Cognitive Ability 1.99 1.17 9% 8%
Prior Non-Cognitive Ability 9.17 6.21 39% 43%
Parental Education 4.90 2.55 21% 18% 3.32 1.96 14% 14%
Family Background 4.59 3.32 20% 23% 2.07 1.47 9% 10%
Gender -0.08 -0.05 0% 0% -0.05 -0.03 0% 0%
Age of Child -0.03 -0.15 0% -1% -0.03 -0.15 0% -1%
Twin/Triplet 0.02 0.01 0% 0% 0.03 0.01 0% 0%
Special care unit after birth -0.01 0.00 0% 0% 0.00 0.00 0% 0%
Ethnicity 0.24 0.12 1% 1% 0.31 0.22 1% 2%
Only English spoken at home 0.02 0.02 0% 0% -0.03 -0.03 0% 0%
Country of residence 0.01 0.01 0% 0% 0.04 0.01 0% 0%
Mother works 0.69 0.65 3% 5% 0.49 0.47 2% 3%
Father works 0.59 0.39 3% 3% 0.54 0.37 2% 3%
Mother's age at birth 1.82 1.10 8% 8% -0.01 -0.19 0% -1%
Marital/Partner Status 1.69 1.35 7% 9% 1.29 1.02 6% 7%
Siblings -0.38 -0.13 -2% -1% -0.51 -0.23 -2% -2%
Family Interactions 2.47 1.66 11% 12% 0.96 0.54 4% 4%
Mother-child closeness 1.55 1.25 7% 9% 0.30 0.25 1% 2%
Parental Harmony 1.40 0.68 6% 5% 1.11 0.54 5% 4%
Parental time -0.48 -0.27 -2% -2% -0.45 -0.25 -2% -2%
Health and Well-Being 1.81 0.97 8% 7% 0.38 0.15 2% 1%
Breast-feeding 0.84 0.39 4% 3% 0.17 0.06 1% 0%
Alcohol consumption -0.13 -0.07 -1% -1% -0.16 -0.08 -1% -1%
Smoking before pregnancy 0.76 0.53 3% 4% 0.75 0.51 3% 4%
Smoking during pregnancy 0.06 0.05 0% 0% -0.35 -0.27 -1% -2%
Gestation Length 0.04 0.04 0% 0% 0.04 0.03 0% 0%
Birth weight 0.27 0.21 1% 1% 0.16 0.13 1% 1%
Infant Temperament 0.91 0.71 4% 5% 0.47 0.38 2% 3%
Maternal Depression 0.56 0.40 2% 3% 0.40 0.28 2% 2%
Parental height/weight -1.51 -1.28 -6% -9% -1.10 -0.89 -5% -6%
Childcare -0.27 -0.14 -1% -1% -0.44 -0.18 -2% -1%
Home-Learning Environment 2.34 1.26 10% 9% 1.52 0.83 7% 6%
HLE and Reading at Age 3 0.49 0.35 2% 2% 0.03 0.05 0% 0%
HLE and Reading at Age 5 0.39 0.12 2% 1% 0.46 0.18 2% 1%
Self-reported parental competence 1.47 0.80 6% 6% 1.03 0.59 4% 4%

18
Parenting Style/Rules 2.21 1.51 9% 11% 1.20 0.85 5% 6%
Amount/strictness of rules -0.03 -0.02 0% 0% -0.08 -0.04 0% 0%
Regular bed times at age 3 0.17 0.10 1% 1% -0.05 -0.03 0% 0%
Regular bed times at age 5 0.68 0.43 3% 3% 0.57 0.36 2% 3%
Regular meal times 1.01 0.73 4% 5% 0.58 0.41 2% 3%
Watches lots of TV/Computer 0.37 0.27 2% 2% 0.19 0.15 1% 1%
Missing Data 1.00 0.95 4% 7% 0.85 0.80 4% 6%

19
Table 9 – Full Specification Regression Results for BAS, Bracken and SDQ (age 3,
MCS2)
BAS Bracken SDQ
SEP Quintile
2nd SEP quintile 0.979 2.302** 1.601*
3rd SEP quintile 4.325*** 4.501*** 3.359***
4th SEP quintile 6.244*** 8.332*** 3.865***
Top SEP quintile 7.645*** 8.976*** 3.837***
Parental Education
Mother NVQ level 1 1.874 1.443 1.99
Mother NVQ level 2 3.332*** 2.628** 1.469
Mother NVQ level 3 3.324*** 2.497** 2.120*
Mother NVQ level 4/5 5.423*** 5.130*** 4.910***
Mother, Other Qualifications 0.891 2.977 5.024
Father NVQ level 1 -0.103 0.682 -2.072
Father NVQ level 2 0.556 -0.33 -0.519
Father NVQ level 3 1.179 2.787** 0.462
Father NVQ level 4/5 1.47 4.907*** 1.548
Father Other Qualifications 7.862** -15.179** -20.649
Child Characteristics
Male Child -6.572*** -4.842*** -3.974***
Child's Age (months/100) 2.613*** 0.978*** 0.378***
Multiple Birth -0.722 -3.434 2.465
Special Care Unit -1.801 -1.437 -0.903
MCS1 Indian Child -5.079* 0.795 -3.409
MCS1 Pakistani Child -8.867*** -5.373*** 0.019
MCS1 Bangladeshi Child -11.380*** -5.453 4.744
MCS1 Black Caribbean Child -8.142*** -4.408* -0.625
MCS1 Black African/Other Child -3.47 2.749 6.307**
MCS1 Other Ethnicity Child -9.801*** 6.944* 4.702
MCS1 Mixed Ethnicity Child -0.575 2.518 1.523
Family Characteristics
Only English at Home 11.444*** 6.809*** 1.332
Lives in Wales 0.72 -0.999 1.462**
Lives in Scotland 4.608*** 2.704** 0.629
Lives in Northern Ireland 4.924*** -2.522* 4.032***
Mother worked at one of waves 1.1 0.932 0.363
Father worked at one of waves 3.279** 2.620** -1.504
Mother's Age at birth 1.280*** 2.131*** 1.538***
Mother's Age at birth squared -0.015* -0.028*** -0.019**
Lone Parent at MCS1 1.325 -1.959 -2.576
Had baby in teens 0.17 0.737 -0.322
Two Cohabiting Parents at MCS1 1.396* 0.358 0.007
Got Married by MCS2 -0.271 -0.026 -2.140*
Split up by MCS2 -2.200* -0.959 0.414
New partner by MCS2 -1.456 -3.820** 1.907
Number of Siblings at MCS2 0.221 0.469 -1.337**
Number of Older Siblings at MCS2 -3.699*** -5.339*** 1.525**
Family Interactions

20
Mother-child relationship problems (#) -2.533*** -2.269*** -4.060***
Mother-child conflict problems (#) -0.524*** -0.726*** -6.346***
Interviewer assessed measure of closeness 0.816*** 0.733*** 0.265
Parental Harmony 1 (scale) -0.002 0.052 1.137***
Mother spends plenty of time with child - MCS2 0.65 -1.028* 0.677
Father spends plenty of time with child - MCS2 -0.659 0.294 -0.332
Health and Well-Being
Tried to Breast-Feed Child 1.132 0.239 -0.046
Age at which breast-feeding stopped (weeks) -0.004 0.076 0.119**
Still breast-feeding at MCS1 0.921 0.248 0.715
Mother alcohol consumption during pregnancy (units) 0.161 0.216 -0.101
Mother alcohol consumption (small amount) 0.651 0.79 -0.271
Mother alcohol consumption at Wave 1 (units) 0.022 0.03 0.054
Number of cigarettes smoked by Mother during pregnancy -0.274* -0.334** -0.206
Above Squared 0.006 0.008 0.002
Number of cigarettes smoked by mother before pregnancy 0.203 0.187 -0.026
Above Squared -0.004 -0.004 -0.002
Gestation Length in Days 0.579* 0.235 0.500*
Gestation Length in Days (squared) -0.001** 0 -0.001*
Birth Weight (kg) 2.927*** 0.809 1.130*
Infant Temperament Mood - MCS1 -0.652** -0.614** 1.237***
Infant Temperament Regularity - MCS1 -0.236 0.358 0.966***
Infant Temperament Adaptability - MCS1 0.738*** 0.22 1.506***
Mother Suffered Post-Natal Depression 0.692 1.434 -1.988**
Mother Height at Birth (cm) -0.031 0.04 0.028
Father Height at Birth (cm) -0.031 -0.041** 0.005
Mother Weight at Birth (kg) 0.015 -0.089* -0.072
Father Weight at Birth (kg) 0.07 0.063 -0.006
Father Under-Weight -1.684 0.461 4.275
Father Over-Weight -2.052** -2.829*** -1.361*
Father Obese -2.581 -3.017* -1.522
Mother Under-Weight -0.886 -1.598 0.038
Mother Over-Weight -1.584 -1.147 -0.619
Mother Obese -0.866 0.298 -0.342
Childcare
Has Been to Nursery School/Class 0.181 1.214* 0.009
Has Been to Playgroup 0.983 -0.517 -1.341**
Has Been to Pre-School 2.427*** 2.804*** -1.177
HAS Been to Child minder 1.062 -0.412 0.601
Has Been to Day Nursery or Crèche -0.712 2.439** 1.239*
Home-Learning Environment
2nd HLE Quintile at MCS2 1.840** 3.646*** -0.085
3rd HLE Quintile at MCS2 3.086*** 5.086*** 0.758
4th HLE Quintile at MCS2 4.186*** 7.230*** 1.320*
5th HLE Quintile at MCS2 5.589*** 10.835*** 2.488***
Read to Everyday at MCS2 7.240*** 7.903*** 1.291
Read to Some Days at MCS2 2.464* 4.005*** 0.191
Mother rates herself as good parent - MCS2 2.168*** 2.351*** 4.545***
Mother rates herself as very good parent - MCS2 0.775 0.487 6.898***
Father rates himself as good parent - MCS2 1.220* 2.215*** 0.173

21
Father rates himself as very good parent - MCS2 1.217* 0.35 0.974
Parenting Style/Rules
Lots of Rules -0.813 -0.434 -0.049
Strictly Enforced Rules 0.446 1.431*** 1.421**
Regular Bed-times at MCS2 1.906*** 2.654*** 2.603***
Regular Meal-times at MCS2 -0.398 1.549 4.062***
Watches more than 3 hours of TV per day at MCS2 2.119*** 0.519 -2.603***
Observations 11054 11054 11054
R-Squared 0.25 0.29 0.36
22
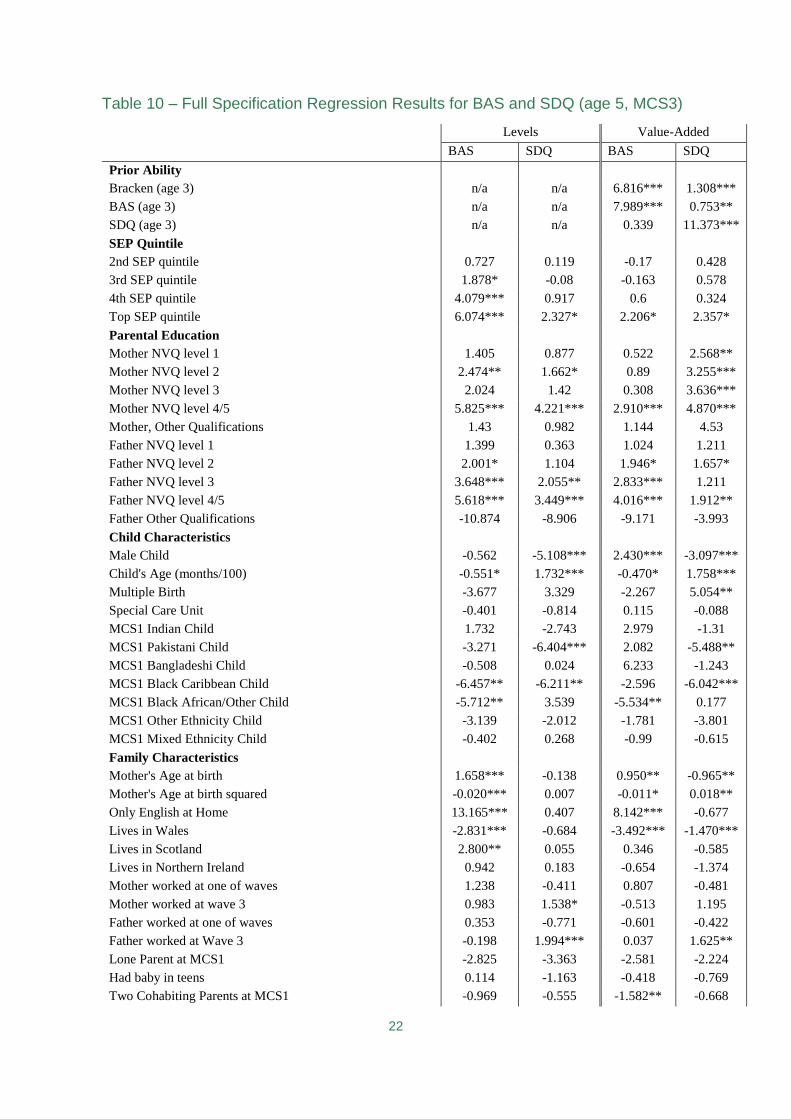
Table 10 – Full Specification Regression Results for BAS and SDQ (age 5, MCS3)
Levels Value-Added
BAS SDQ BAS SDQ
Prior Ability
Bracken (age 3) n/a n/a 6.816*** 1.308***
BAS (age 3) n/a n/a 7.989*** 0.753**
SDQ (age 3) n/a n/a 0.339 11.373***
SEP Quintile
2nd SEP quintile 0.727 0.119 -0.17 0.428
3rd SEP quintile 1.878* -0.08 -0.163 0.578
4th SEP quintile 4.079*** 0.917 0.6 0.324
Top SEP quintile 6.074*** 2.327* 2.206* 2.357*
Parental Education
Mother NVQ level 1 1.405 0.877 0.522 2.568**
Mother NVQ level 2 2.474** 1.662* 0.89 3.255***
Mother NVQ level 3 2.024 1.42 0.308 3.636***
Mother NVQ level 4/5 5.825*** 4.221*** 2.910*** 4.870***
Mother, Other Qualifications 1.43 0.982 1.144 4.53
Father NVQ level 1 1.399 0.363 1.024 1.211
Father NVQ level 2 2.001* 1.104 1.946* 1.657*
Father NVQ level 3 3.648*** 2.055** 2.833*** 1.211
Father NVQ level 4/5 5.618*** 3.449*** 4.016*** 1.912**
Father Other Qualifications -10.874 -8.906 -9.171 -3.993
Child Characteristics
Male Child -0.562 -5.108*** 2.430*** -3.097***
Child's Age (months/100) -0.551* 1.732*** -0.470* 1.758***
Multiple Birth -3.677 3.329 -2.267 5.054**
Special Care Unit -0.401 -0.814 0.115 -0.088
MCS1 Indian Child 1.732 -2.743 2.979 -1.31
MCS1 Pakistani Child -3.271 -6.404*** 2.082 -5.488**
MCS1 Bangladeshi Child -0.508 0.024 6.233 -1.243
MCS1 Black Caribbean Child -6.457** -6.211** -2.596 -6.042***
MCS1 Black African/Other Child -5.712** 3.539 -5.534** 0.177
MCS1 Other Ethnicity Child -3.139 -2.012 -1.781 -3.801
MCS1 Mixed Ethnicity Child -0.402 0.268 -0.99 -0.615
Family Characteristics
Mother's Age at birth 1.658*** -0.138 0.950** -0.965**
Mother's Age at birth squared -0.020*** 0.007 -0.011* 0.018**
Only English at Home 13.165*** 0.407 8.142*** -0.677
Lives in Wales -2.831*** -0.684 -3.492*** -1.470***
Lives in Scotland 2.800** 0.055 0.346 -0.585
Lives in Northern Ireland 0.942 0.183 -0.654 -1.374
Mother worked at one of waves 1.238 -0.411 0.807 -0.481
Mother worked at wave 3 0.983 1.538* -0.513 1.195
Father worked at one of waves 0.353 -0.771 -0.601 -0.422
Father worked at Wave 3 -0.198 1.994*** 0.037 1.625**
Lone Parent at MCS1 -2.825 -3.363 -2.581 -2.224
Had baby in teens 0.114 -1.163 -0.418 -0.769
Two Cohabiting Parents at MCS1 -0.969 -0.555 -1.582** -0.668

23
Got Married by MCS2 1.276 -1.234 1.223 -0.371
Split up by MCS2 -1.957 0.28 -2.690* 0.264
New partner by MCS2 0.383 0.54 1.923 0.327
Split up by MCS3 -1.849 -2.485 -0.203 -2.249
New partner by MCS3 1.122 -0.841 0.205 -1.641
Number of Siblings at MCS3 -0.455 -0.859 -0.226 -0.403
Number of Older Siblings at MCS3 -4.006*** 1.632*** -2.103*** 1.482***
Family Interactions
Mother-child relationship problems (#) 10.636** 2.306 7.174* 4.37
Mother-child conflict problems (#) -0.546 -7.477** 1.357 -6.195**
Interviewer assessed measure of closeness 1.977 3.894 2.559 2.633
Parental Harmony 1 (scale) -2.856*** -2.196*** -1.408*** 0.147
Parental Harmony 2 (scale) -0.143 -4.007*** 0.271 -1.370***
Mother spends plenty of time with child - MCS2 -3.455* -2.179 -3.215* -2.089
Father spends plenty of time with child - MCS2 -0.214 1.311 -1.006 -1.407
Health and Well-Being
Tried to Breast-Feed Child 0.332 -0.585 -0.047 -0.764
Age at which breast-feeding stopped (weeks) 0.082 0.105* 0.068 0.043
Still breast-feeding at MCS1 0.206 0.051 -0.251 0.107
Mother alcohol consumption during pregnancy (units) -0.014 0.239 -0.117 0.232*
Mother alcohol consumption (small amount) 1.688*** -1.108* 1.387** -1.227**
Mother alcohol consumption at Wave 1 (units) -0.023 0.003 -0.028 -0.008
Number of cigarettes smoked by Mother during pregnancy -0.2 0.01 -0.082 0.134
Number of cigarettes smoked by mother before pregnancy 0.276** -0.094 0.165 -0.123
Gestation Length in Days 0.493 0.352 0.22 0.177
Gestation Length in Days (squared) -0.001* -0.001 -0.001 0
Birth Weight (kg) 1.632** 1.390** 0.653 0.831
Infant Temperament Mood - MCS1 -0.372 0.724*** -0.126 0.315
Infant Temperament Regularity - MCS1 0.578** 1.052*** 0.523** 0.619**
Infant Temperament Adaptability - MCS1 0.366 1.053*** 0.041 0.442*
Mother Suffered Post-Natal Depression 0.426 -3.710*** -0.131 -2.634***
Mother Height at Birth (cm) 0.016 0.032 0.006 0.038
Father Height at Birth (cm) -0.033* -0.028 -0.009 -0.026
Mother Weight at Birth (kg) -0.023 -0.084* -0.002 -0.063
Father Weight at Birth (kg) 0.042 0.038 0.001 0.035
Father Under-Weight 2.339 3.714 2.596 2.221
Father Over-Weight -2.450*** -1.341 -1.119 -0.62
Father Obese -0.782 -2.459* 0.889 -1.474
Mother Under-Weight -0.489 -1.865 0.536 -1.727
Mother Over-Weight -0.158 -1.575* 0.208 -1.131
Mother Obese 1.292 0.603 1.303 1.236
Childcare
Has Been to Nursery School/Class (MCS2) -0.408 -0.278 -2.104*** -1.073*
Has Been to Playgroup (MCS2) -1.469* -1.684** -2.175*** -1.234*
Has Been to Pre-School (MCS2) -0.859 -0.017 -2.173** 0.306
Has Been to Childminder (MCS2) 1.706 -1.081 1.049 -1.207
Has Been to Day Nursery or Crèche (MCS2) 1.622 -0.015 0.393 -0.608
Has Been to Nursery School/Class (MCS3) -1.178 0.816 -0.165 1.444**
Has Been to Playgroup (MCS3) 1.258 1.824** 2.028** 1.775**
Has Been to Pre-School (MCS3) 0.707 0.171 0.743 -0.018
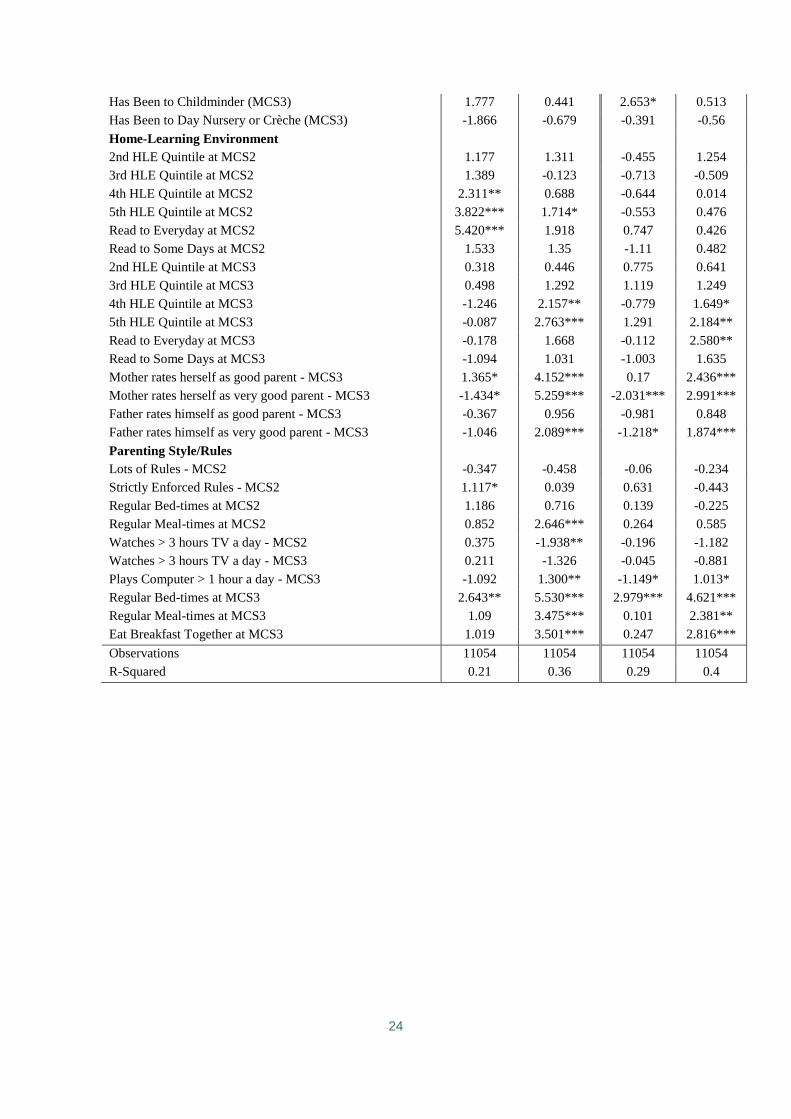
24
Has Been to Childminder (MCS3) 1.777 0.441 2.653* 0.513
Has Been to Day Nursery or Crèche (MCS3) -1.866 -0.679 -0.391 -0.56
Home-Learning Environment
2nd HLE Quintile at MCS2 1.177 1.311 -0.455 1.254
3rd HLE Quintile at MCS2 1.389 -0.123 -0.713 -0.509
4th HLE Quintile at MCS2 2.311** 0.688 -0.644 0.014
5th HLE Quintile at MCS2 3.822*** 1.714* -0.553 0.476
Read to Everyday at MCS2 5.420*** 1.918 0.747 0.426
Read to Some Days at MCS2 1.533 1.35 -1.11 0.482
2nd HLE Quintile at MCS3 0.318 0.446 0.775 0.641
3rd HLE Quintile at MCS3 0.498 1.292 1.119 1.249
4th HLE Quintile at MCS3 -1.246 2.157** -0.779 1.649*
5th HLE Quintile at MCS3 -0.087 2.763*** 1.291 2.184**
Read to Everyday at MCS3 -0.178 1.668 -0.112 2.580**
Read to Some Days at MCS3 -1.094 1.031 -1.003 1.635
Mother rates herself as good parent - MCS3 1.365* 4.152*** 0.17 2.436***
Mother rates herself as very good parent - MCS3 -1.434* 5.259*** -2.031*** 2.991***
Father rates himself as good parent - MCS3 -0.367 0.956 -0.981 0.848
Father rates himself as very good parent - MCS3 -1.046 2.089*** -1.218* 1.874***
Parenting Style/Rules
Lots of Rules - MCS2 -0.347 -0.458 -0.06 -0.234
Strictly Enforced Rules - MCS2 1.117* 0.039 0.631 -0.443
Regular Bed-times at MCS2 1.186 0.716 0.139 -0.225
Regular Meal-times at MCS2 0.852 2.646*** 0.264 0.585
Watches > 3 hours TV a day - MCS2 0.375 -1.938** -0.196 -1.182
Watches > 3 hours TV a day - MCS3 0.211 -1.326 -0.045 -0.881
Plays Computer > 1 hour a day - MCS3 -1.092 1.300** -1.149* 1.013*
Regular Bed-times at MCS3 2.643** 5.530*** 2.979*** 4.621***
Regular Meal-times at MCS3 1.09 3.475*** 0.101 2.381**
Eat Breakfast Together at MCS3 1.019 3.501*** 0.247 2.816***
Observations 11054 11054 11054 11054
R-Squared 0.21 0.36 0.29 0.4

25
Table 11 – Mediation of other characteristics (BAS, MCS2)
(1)
Education &
Family
Background
Only
(2)
(1) plus
Family
Interactions
(3)
(1) plus
Health &
well-being
(4)
(1) plus
Childcare
(5)
(1) plus
HLE
(6)
(1) plus
Parenting
Style/Rules
(7)
All
Controls
SEP Quintile
2nd SEP quintile 2.066** 1.610* 1.564* 2.017** 1.503* 1.951** 0.979
3rd SEP quintile 5.767*** 5.239*** 5.016*** 5.646*** 4.921*** 5.637*** 4.325***
4th SEP quintile 7.867*** 7.280*** 7.054*** 7.802*** 6.778*** 7.664*** 6.244***
Top SEP quintile 9.629*** 8.956*** 8.609*** 9.642*** 8.347*** 9.349*** 7.645***
Parental Education
Mother NVQ level 1 3.155** 2.813** 2.578** 2.998** 2.721** 3.031** 1.874
Mother NVQ level 2 5.677*** 4.972*** 4.647*** 5.471*** 4.625*** 5.413*** 3.332***
Mother NVQ level 3 6.748*** 5.916*** 5.323*** 6.547*** 4.956*** 6.380*** 3.324***
Mother NVQ level 4/5 9.220*** 8.620*** 7.481*** 9.047*** 7.004*** 8.804*** 5.423***
Mother, Other Quals. 2.955 2.642 2.562 2.926 1.662 2.919 0.891
Father NVQ level 1 0.211 -0.109 0.874 0.069 -0.393 0.217 -0.103
Father NVQ level 2 0.645 0.466 1.079 0.464 0.371 0.563 0.556
Father NVQ level 3 1.679 1.525 1.966* 1.55 0.991 1.475 1.179
Father NVQ level 4/5 2.770*** 2.556*** 2.639** 2.681*** 1.617* 2.559*** 1.47
Father Other Quals. 5.975* 5.225 6.651* 6.404* 7.678*** 7.058** 7.862**
Child Characteristics
Male Child -6.944*** -6.749*** -7.448*** -6.881*** -6.188*** -6.953*** -6.572***
Child's Age (months) 2.591*** 2.611*** 2.607*** 2.555*** 2.617*** 2.584*** 2.613***
Multiple Birth -4.562** -4.039* -2.091 -4.605** -2.781 -4.859** -0.722
Special Care Unit -3.532*** -3.353*** -2.071* -3.551*** -3.362*** -3.518*** -1.801
Indian Child -8.613*** -8.108*** -6.909** -8.164*** -7.186*** -8.224*** -5.079*
Pakistani Child -12.068*** -11.213*** -10.275*** -11.547*** -11.358*** -11.642*** -8.867***
Bangladeshi Child -16.046*** -15.226*** -14.432*** -15.454*** -13.891*** -15.699*** -11.380***
Black Caribbean Child -6.990** -6.645* -7.078** -6.446* -4.428 -6.073* -3.47
Black African Child -10.554*** -10.222*** -10.047*** -10.153*** -9.378*** -10.093*** -8.142***
Other Ethnicity Child -11.919*** -11.256*** -10.945*** -11.486*** -11.050*** -11.737*** -9.801***
Mixed Ethnicity Child -1.438 -1.572 -1.207 -1.244 -1.044 -1.228 -0.575
Family Characteristics
Only English at Home 12.651*** 11.773*** 12.851*** 12.667*** 11.996*** 12.530*** 11.444***
Mother worked (MCS1/ 2) 0.674 0.882 0.788 0.749 0.84 0.686 1.1
Father worked (MCS1/ 2) 4.548*** 3.853*** 3.776*** 4.391*** 4.391*** 4.496*** 3.279**
Mother's Age at birth 1.345*** 1.311*** 1.365*** 1.278** 1.288*** 1.299*** 1.280***
Mother's Age at birth Sq -0.016* -0.015* -0.017* -0.015* -0.015* -0.015* -0.015*
Lone Parent (MCS1) 2.274 1.551 1.315 2.328 2.623 2.117 1.325
Had baby in teens 0.262 0.799 0.148 0.101 0.081 0.257 0.17
Cohabiting Parents (MCS1) 1.126 1.269 1.326 1.198 1.189 1.257 1.396*
Siblings (MCS2) -0.087 0.178 -0.188 -0.145 0.195 -0.218 0.221
Older Siblings (MCS2) -4.047*** -4.327*** -3.928*** -3.969*** -3.644*** -3.846*** -3.699***
Observations 11054 11054 11054 11054 11054 11054 11054
R-squared 0.22 0.22 0.22 0.22 0.24 0.22 0.25
***, **, and * indicate significance at the 1, 5 and 10% levels respectively.
26
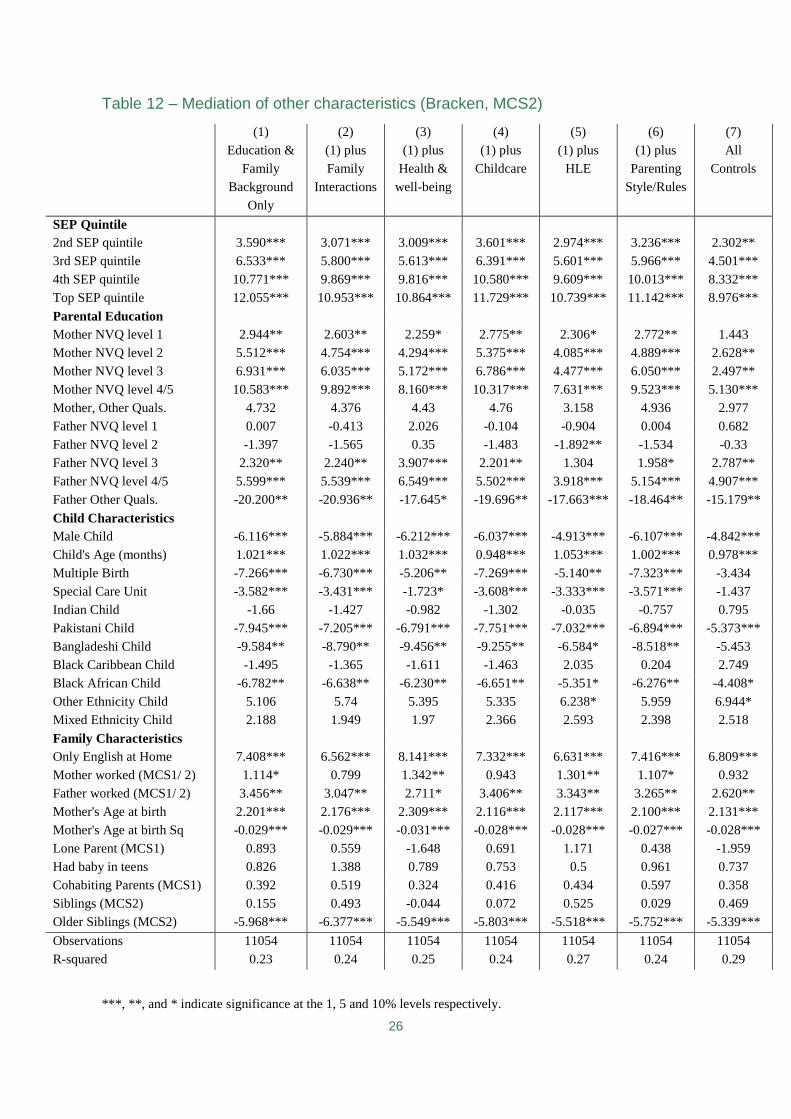
Table 12 – Mediation of other characteristics (Bracken, MCS2)
(1)
Education &
Family
Background
Only
(2)
(1) plus
Family
Interactions
(3)
(1) plus
Health &
well-being
(4)
(1) plus
Childcare
(5)
(1) plus
HLE
(6)
(1) plus
Parenting
Style/Rules
(7)
All
Controls
SEP Quintile
2nd SEP quintile 3.590*** 3.071*** 3.009*** 3.601*** 2.974*** 3.236*** 2.302**
3rd SEP quintile 6.533*** 5.800*** 5.613*** 6.391*** 5.601*** 5.966*** 4.501***
4th SEP quintile 10.771*** 9.869*** 9.816*** 10.580*** 9.609*** 10.013*** 8.332***
Top SEP quintile 12.055*** 10.953*** 10.864*** 11.729*** 10.739*** 11.142*** 8.976***
Parental Education
Mother NVQ level 1 2.944** 2.603** 2.259* 2.775** 2.306* 2.772** 1.443
Mother NVQ level 2 5.512*** 4.754*** 4.294*** 5.375*** 4.085*** 4.889*** 2.628**
Mother NVQ level 3 6.931*** 6.035*** 5.172*** 6.786*** 4.477*** 6.050*** 2.497**
Mother NVQ level 4/5 10.583*** 9.892*** 8.160*** 10.317*** 7.631*** 9.523*** 5.130***
Mother, Other Quals. 4.732 4.376 4.43 4.76 3.158 4.936 2.977
Father NVQ level 1 0.007 -0.413 2.026 -0.104 -0.904 0.004 0.682
Father NVQ level 2 -1.397 -1.565 0.35 -1.483 -1.892** -1.534 -0.33
Father NVQ level 3 2.320** 2.240** 3.907*** 2.201** 1.304 1.958* 2.787**
Father NVQ level 4/5 5.599*** 5.539*** 6.549*** 5.502*** 3.918*** 5.154*** 4.907***
Father Other Quals. -20.200** -20.936** -17.645* -19.696** -17.663*** -18.464** -15.179**
Child Characteristics
Male Child -6.116*** -5.884*** -6.212*** -6.037*** -4.913*** -6.107*** -4.842***
Child's Age (months) 1.021*** 1.022*** 1.032*** 0.948*** 1.053*** 1.002*** 0.978***
Multiple Birth -7.266*** -6.730*** -5.206** -7.269*** -5.140** -7.323*** -3.434
Special Care Unit -3.582*** -3.431*** -1.723* -3.608*** -3.333*** -3.571*** -1.437
Indian Child -1.66 -1.427 -0.982 -1.302 -0.035 -0.757 0.795
Pakistani Child -7.945*** -7.205*** -6.791*** -7.751*** -7.032*** -6.894*** -5.373***
Bangladeshi Child -9.584** -8.790** -9.456** -9.255** -6.584* -8.518** -5.453
Black Caribbean Child -1.495 -1.365 -1.611 -1.463 2.035 0.204 2.749
Black African Child -6.782** -6.638** -6.230** -6.651** -5.351* -6.276** -4.408*
Other Ethnicity Child 5.106 5.74 5.395 5.335 6.238* 5.959 6.944*
Mixed Ethnicity Child 2.188 1.949 1.97 2.366 2.593 2.398 2.518
Family Characteristics
Only English at Home 7.408*** 6.562*** 8.141*** 7.332*** 6.631*** 7.416*** 6.809***
Mother worked (MCS1/ 2) 1.114* 0.799 1.342** 0.943 1.301** 1.107* 0.932
Father worked (MCS1/ 2) 3.456** 3.047** 2.711* 3.406** 3.343** 3.265** 2.620**
Mother's Age at birth 2.201*** 2.176*** 2.309*** 2.116*** 2.117*** 2.100*** 2.131***
Mother's Age at birth Sq -0.029*** -0.029*** -0.031*** -0.028*** -0.028*** -0.027*** -0.028***
Lone Parent (MCS1) 0.893 0.559 -1.648 0.691 1.171 0.438 -1.959
Had baby in teens 0.826 1.388 0.789 0.753 0.5 0.961 0.737
Cohabiting Parents (MCS1) 0.392 0.519 0.324 0.416 0.434 0.597 0.358
Siblings (MCS2) 0.155 0.493 -0.044 0.072 0.525 0.029 0.469
Older Siblings (MCS2) -5.968*** -6.377*** -5.549*** -5.803*** -5.518*** -5.752*** -5.339***
Observations 11054 11054 11054 11054 11054 11054 11054
R-squared 0.23 0.24 0.25 0.24 0.27 0.24 0.29
***, **, and * indicate significance at the 1, 5 and 10% levels respectively.

27
Table 13 – Mediation of other characteristics (SDQ, MCS2)
(1)
Education &
Family
Background
Only
(2)
(1) plus
Family
Interactions
(3)
(1) plus
Health &
well-being
(4)
(1) plus
Childcare
(5)
(1) plus
HLE
(6)
(1) plus
Parenting
Style/Rules
(7)
All
Controls
SEP Quintile
2nd SEP quintile 5.206*** 2.935*** 3.464*** 5.271*** 4.375*** 4.546*** 1.601*
3rd SEP quintile 8.558*** 5.521*** 5.440*** 8.624*** 7.666*** 7.396*** 3.359***
4th SEP quintile 10.671*** 6.875*** 6.893*** 10.740*** 9.167*** 9.169*** 3.865***
Top SEP quintile 12.645*** 7.437*** 8.298*** 12.635*** 10.792*** 10.947*** 3.837***
Parental Education
Mother NVQ level 1 1.304 2.167 1.18 1.408 1.116 1.103 1.99
Mother NVQ level 2 2.078 2.744** 0.904 2.227* 1.43 1.122 1.469
Mother NVQ level 3 3.321** 4.281*** 1.676 3.504** 2.195 1.972 2.120*
Mother NVQ level 4/5 6.003*** 7.994*** 3.930*** 6.181*** 4.713*** 4.334*** 4.910***
Mother, Other Quals. 6.089* 4.93 6.070* 6.132* 5.536 6.438* 5.024
Father NVQ level 1 -1.086 -2.394 -0.811 -0.994 -1.506 -1.158 -2.072
Father NVQ level 2 0.102 -0.651 0.004 0.228 -0.178 -0.042 -0.519
Father NVQ level 3 1.361 0.688 1.273 1.456 0.721 0.922 0.462
Father NVQ level 4/5 2.545** 2.502*** 1.776 2.616** 2.056** 1.908* 1.548
Father Other Quals. -15.065 -21.802 -19.318 -15.226 -10.257 -12.804 -20.649
Child Characteristics
Male Child -4.810*** -4.179*** -4.919*** -4.839*** -4.003*** -4.753*** -3.974***
Child's Age (months) 0.468*** 0.389*** 0.477*** 0.463*** 0.461*** 0.440*** 0.378***
Multiple Birth -1.438 -2.455 1.009 -1.384 4.196* -1.498 2.465
Special Care Unit -3.409*** -2.465*** -1.28 -3.416*** -3.112*** -3.422*** -0.903
Indian Child -1.532 -4.517* -0.446 -1.809 -1.048 -0.264 -3.409
Pakistani Child -0.54 -0.776 0.619 -0.861 -0.406 0.966 0.019
Bangladeshi Child 6.47 5.834 5.38 6.088 5.718 8.148* 4.744
Black Caribbean Child 10.012** 5.734* 8.821** 9.643** 9.861** 12.626*** 6.307**
Black African Child 0.628 -1.1 1.618 0.358 0.332 1.389 -0.625
Other Ethnicity Child 4.666 4.684 5.1 4.39 4.534 6.235* 4.702
Mixed Ethnicity Child 2.361 1.122 2.62 2.222 2.994* 2.536 1.523
Family Characteristics
Only English at Home -1.048 0.638 -0.509 -1.045 -2.115 -0.853 1.332
Mother worked (MCS1/ 2) 0.787 0.377 0.659 0.802 0.926 0.727 0.363
Father worked (MCS1/ 2) 0.399 -0.827 -1.111 0.531 -0.018 0.045 -1.504
Mother's Age at birth 1.318** 1.459*** 1.363*** 1.338** 1.350** 1.184** 1.538***
Mother's Age at birth Sq -0.016* -0.017** -0.017* -0.016* -0.017* -0.013 -0.019**
Lone Parent (MCS1) -1.356 -2.133 -1.419 -1.313 -0.952 -2.128 -2.576
Had baby in teens -2.639 -0.461 -2.058 -2.553 -2.863 -2.319 -0.322
Cohabiting Parents (MCS1) -1.636* -0.135 -0.712 -1.664* -1.613* -1.365 0.007
Siblings (MCS2) -1.443** -1.127* -1.913*** -1.417** -1.248* -1.447** -1.337**
Older Siblings (MCS2) 2.104*** 0.716 2.881*** 2.070*** 2.386*** 2.246*** 1.525**
Observations 11054 11054 11054 11054 11054 11054 11054
R-squared 0.11 0.32 0.16 0.11 0.15 0.12 0.36
***, **, and * indicate significance at the 1, 5 and 10% levels respectively.

28
Table 14 – Mediation of the effect of other characteristics (BAS, MCS3)
(1)
Education &
Family
Background
Only
(2)
(1) plus
Family
Interactions
(3)
(1) plus
Health &
well-being
(4)
(1) plus
Childcare
(5)
(1) plus
HLE
(6)
(1) plus
Parenting
Style/Rules
(7)
All
Controls
SEP Quintile
2nd SEP quintile 1.603* 1.308 1.314 1.491 1.302 1.228 0.727
3rd SEP quintile 3.041*** 2.616** 2.805** 2.871*** 2.444** 2.467** 1.878*
4th SEP quintile 5.492*** 4.977*** 5.301*** 5.222*** 4.838*** 4.685*** 4.079***
Top SEP quintile 7.580*** 7.032*** 7.334*** 7.341*** 6.863*** 6.652*** 6.074***
Parental Education
Mother NVQ level 1 2.650** 2.042 2.148 2.636** 2.312* 2.345* 1.405
Mother NVQ level 2 4.908*** 3.952*** 3.993*** 4.802*** 4.044*** 4.249*** 2.474**
Mother NVQ level 3 5.615*** 4.505*** 4.330*** 5.378*** 4.137*** 4.706*** 2.024
Mother NVQ level 4/5 10.120*** 9.124*** 8.469*** 9.743*** 8.238*** 9.061*** 5.825***
Mother, Other Quals. 2.615 2.368 2.707 2.6 1.465 2.572 1.43
Father NVQ level 1 0.434 0.163 2.034 0.472 0.062 0.456 1.399
Father NVQ level 2 0.589 0.465 2.291** 0.565 0.493 0.475 2.001*
Father NVQ level 3 2.645** 2.578** 4.220*** 2.566** 2.277** 2.342** 3.648***
Father NVQ level 4/5 5.511*** 5.395*** 6.616*** 5.432*** 4.609*** 5.159*** 5.618***
Father Other Quals. -13.081 -12.678 -11.12 -14.297 -11.465 -12.841 -10.874
Child Characteristics
Male Child -0.972 -0.811 -1.235** -0.941 -0.482 -0.833 -0.562
Child's Age (months) -0.568* -0.504 -0.602* -0.635** -0.587* -0.513 -0.551*
Multiple Birth -5.484*** -5.172* -4.439** -5.501*** -4.587** -5.703*** -3.677
Special Care Unit -0.895 -0.81 -0.534 -0.896 -0.739 -0.848 -0.401
Indian Child -2.105 -1.459 -0.649 -1.861 -0.406 -1.213 1.732
Pakistani Child -7.248*** -6.255*** -5.097** -6.856*** -6.709*** -6.222*** -3.271
Bangladeshi Child -4.945 -3.97 -3.718 -4.437 -3.277 -4 -0.508
Black Caribbean Child -9.998*** -9.240*** -9.937*** -9.795*** -7.473*** -8.231*** -5.712**
Black African Child -9.377*** -8.803*** -9.205*** -9.075*** -7.810*** -8.536*** -6.457**
Other Ethnicity Child -6.252* -5.341 -5.083 -5.847* -5.480* -5.42 -3.139
Mixed Ethnicity Child -1.027 -1.078 -1.224 -0.763 -0.743 -0.691 -0.402
Family Characteristics
Only English at Home 14.227*** 13.154*** 14.448*** 14.105*** 13.818*** 14.313*** 13.165***
Mother worked (MCS1/ 2) 1.399 1.208 1.573* 1.154 1.546* 1.366 1.238
Father worked (MCS1/ 2) -0.012 -0.202 0.703 0.599 0.803 0.59 0.983
Mother worked (MC3) 1.266 0.766 0.848 1.037 1.092 1.099 0.353
Mother worked (MC3) 0.619 0.711 -0.008 -0.111 0.024 -0.006 -0.198
Mother's Age at birth 1.801*** 1.771*** 1.712*** 1.840*** 1.722*** 1.728*** 1.658***
Mother's Age at birth Sq -0.022*** -0.022*** -0.021*** -0.023*** -0.021*** -0.021*** -0.020***
Lone Parent (MCS1) 0.489 -0.078 -1.933 0.204 0.006 0.358 -2.825
Had baby in teens -0.117 0.11 0.029 -0.097 -0.211 -0.117 0.114
Cohabiting Parents (MCS1) -0.969 -0.944 -1.09 -0.976 -0.882 -0.757 -0.969
Siblings (MCS3) -0.447 -0.323 -0.552 -0.464 -0.319 -0.633 -0.455
Older Siblings (MCS3) -4.453*** -4.581*** -4.336*** -4.481*** -4.064*** -4.132*** -4.006***
Observations 11054 11054 11054 11054 11054 11054 11054
R-squared 0.18 0.19 0.19 0.19 0.2 0.19 0.21

29
***, **, and * indicate significance at the 1, 5 and 10% levels respectively.
Table 15 – Mediation of other characteristics (SDQ, MCS3)
(1)
Education &
Family
Background
Only
(2)
(1) plus
Family
Interactions
(3)
(1) plus
Health &
well-being
(4)
(1) plus
Childcare
(5)
(1) plus
HLE
(6)
(1) plus
Parenting
Style/Rules
(7)
All
Controls
SEP Quintile
2nd SEP quintile 4.565*** 2.773*** 2.988*** 4.610*** 3.586*** 3.827*** 1.418
3rd SEP quintile 6.902*** 4.523*** 4.059*** 7.003*** 5.843*** 5.533*** 2.282**
4th SEP quintile 8.374*** 5.355*** 5.136*** 8.528*** 6.684*** 6.513*** 2.451**
Top SEP quintile 11.793*** 7.616*** 7.968*** 12.058*** 9.607*** 9.887*** 4.365***
Parental Education
Mother NVQ level 1 4.075*** 3.910*** 3.721*** 4.148*** 3.995*** 3.346** 3.348***
Mother NVQ level 2 6.084*** 5.876*** 4.883*** 6.128*** 5.285*** 4.562*** 4.125***
Mother NVQ level 3 7.312*** 7.227*** 5.806*** 7.459*** 6.000*** 5.380*** 4.761***
Mother NVQ level 4/5 9.623*** 10.363*** 7.610*** 9.884*** 8.028*** 7.511*** 7.072***
Mother, Other Quals. 7.035** 6.426** 7.541** 7.030** 6.431** 7.430** 6.890**
Father NVQ level 1 -0.368 -1.24 1.056 -0.383 -0.983 -0.369 0.083
Father NVQ level 2 0.892 0.11 1.958 0.907 0.591 0.602 1.233
Father NVQ level 3 1.278 0.488 2.273* 1.43 0.623 0.681 1.318
Father NVQ level 4/5 2.495** 2.194** 3.037*** 2.616** 1.925* 1.708* 2.481**
Father Other Quals. -11.156 -12.137 -12.149* -11.275 -8.694 -11.852 -11.919*
Child Characteristics
Male Child -5.441*** -5.101*** -5.538*** -5.495*** -4.815*** -5.499*** -5.108***
Child's Age (months) 1.717*** 1.814*** 1.700*** 1.673*** 1.706*** 1.732*** 1.732***
Multiple Birth 0.565 -0.086 3.15 0.438 5.756** 0.05 3.329
Special Care Unit -3.494*** -2.617*** -1.288 -3.530*** -3.204*** -3.459*** -0.814
Indian Child -3.474 -3.901 -2.232 -3.717 -2.844 -2.112 -2.743
Pakistani Child -9.310*** -7.854*** -7.691*** -9.445*** -8.823*** -7.544*** -6.404***
Bangladeshi Child -1.789 -1.025 -1.365 -1.819 -2.124 0.249 0.024
Black Caribbean Child -7.779** -8.187*** -6.079** -7.691** -7.844*** -6.694** -6.211**
Black African Child 3.502 1.502 3.306 3.634 3.304 6.669* 3.539
Other Ethnicity Child -4.288 -1.803 -3.94 -4.333 -4.559 -2.384 -2.012
Mixed Ethnicity Child -0.485 -0.379 0.007 -0.625 0.226 -0.131 0.268
Family Characteristics
Only English at Home 0.201 -0.114 0.314 0.13 -0.841 0.746 0.407
Mother worked (MCS1/ 2) -0.348 -0.514 -0.296 -0.092 -0.401 -0.444 -0.411
Father worked (MCS1/ 2) 2.019*** 1.932*** 2.332** 2.200** 2.535*** 1.975*** 1.994***
Mother's Age at birth 0.654 -0.036 -0.96 0.656 0.544 0.42 -0.771
Mother's Age at birth Sq 2.235** 1.462 1.573** 2.130*** 2.070** 2.169** 1.538*
Lone Parent (MCS1) -0.353 -0.122 -0.407 -0.375 -0.38 -0.402 -0.138
Had baby in teens 0.01 0.007 0.01 0.01 0.01 0.011 0.007
Cohabiting Parents (MCS1) -1.732 -2.899 -3.174 -1.389 -0.973 -1.774 -3.363
Siblings (MCS2) -2.349 -0.89 -1.877 -2.335 -2.965 -2.121 -1.163
Older Siblings (MCS2) -2.364** -0.69 -1.649* -2.243** -2.391*** -1.986** -0.555
Observations 11054 11054 11054 11054 11054 11054 11054
R-squared 0.13 0.25 0.17 0.13 0.17 0.15 0.29

30
***, **, and * indicate significance at the 1, 5 and 10% levels respectively.
Table16 –Mediation of the effect of other characteristics (BAS value added, MCS3)
(1)
Education,
Family
Background
and Prior
Ability Only
(2)
(1) plus
Family
Interactions
(3)
(1) plus
Health &
well-being
(4)
(1) plus
Childcare
(5)
(1) plus
HLE
(6)
(1) plus
Parenting
Style/Rules
(7)
All
Controls
BAS Score (Age 3) 8.042*** 7.983*** 8.004*** 8.128*** 7.995*** 8.028*** 7.989***
Bracken (Age 3) 6.926*** 6.893*** 6.861*** 6.953*** 6.849*** 6.872*** 6.816***
SDQ Score (Age 3) 0.112 0.437 0.115 0.116 0.215 -0.017 0.339
SEP Quintile
2nd SEP quintile 0.135 0.071 0.129 0.011 0.119 -0.056 -0.17
3rd SEP quintile 0.063 -0.071 0.266 -0.032 -0.08 -0.21 -0.163
4th SEP quintile 1.006 0.838 1.256 0.754 0.917 0.61 0.6
Top SEP quintile 2.425** 2.314* 2.744** 2.263* 2.327* 1.967 2.206*
Parental Education
Mother NVQ level 1 0.834 0.488 0.727 0.895 0.877 0.665 0.522
Mother NVQ level 2 1.809* 1.329 1.544 1.728* 1.662* 1.484 0.89
Mother NVQ level 3 1.76 1.197 1.363 1.542 1.42 1.287 0.308
Mother NVQ level 4/5 4.721*** 4.114*** 4.207*** 4.387*** 4.221*** 4.190*** 2.910***
Mother, Other Quals. 1.391 1.277 1.582 1.431 0.982 1.284 1.144
Father NVQ level 1 0.362 0.351 1.064 0.441 0.363 0.331 1.024
Father NVQ level 2 0.999 0.986 1.917* 1.023 1.104 0.928 1.946*
Father NVQ level 3 1.996** 1.991** 2.880*** 2.004** 2.055** 1.853** 2.833***
Father NVQ level 4/5 3.648*** 3.601*** 4.287*** 3.626*** 3.449*** 3.485*** 4.016***
Father Other Quals. -9.146 -8.327 -7.995 -10.845 -8.906 -9.453 -9.171
Child Characteristics
Male Child 2.456*** 2.518*** 2.342*** 2.457*** 2.420*** 2.549*** 2.430***
Child's Age (months) -0.473* -0.468 -0.497* -0.564** -0.446 -0.424 -0.470*
Multiple Birth -2.282 -1.3 -2.585 -2.35 -2.635 -2.417 -2.267
Special Care Unit 0.709 0.724 0.062 0.764 0.756 0.714 0.115
Indian Child 0.883 1.35 1.562 0.833 1.765 1.401 2.979
Pakistani Child 0.077 0.582 1.232 0.183 0.188 0.473 2.082
Bangladeshi Child 4.478 4.879 4.903 4.743 4.95 4.809 6.233
Black Caribbean Child -7.604*** -7.141*** -7.752*** -7.580*** -6.531*** -6.562*** -5.534**
Black African Child -4.282* -3.934 -4.567* -4.098 -3.292 -3.718 -2.596
Other Ethnicity Child -3.603 -3.113 -2.982 -3.317 -3.313 -3.206 -1.781
Mixed Ethnicity Child -1.277 -1.217 -1.52 -1.158 -1.182 -1.061 -0.99
Family Characteristics
Only English at Home 8.579*** 8.127*** 8.728*** 8.368*** 8.603*** 8.663*** 8.142***
Mother worked (MCS1/ 2) 0.985 0.844 1.07 0.733 1.114 0.958 0.807
Father worked (MCS1/ 2) -0.453 -0.193 -0.229 -0.539 -0.453 -0.433 -0.513
Mother worked (MC3) -0.346 -0.46 -0.292 -0.617 -0.359 -0.403 -0.601
Mother worked (MC3) -0.299 -0.552 -0.396 -0.305 -0.146 -0.294 0.037
Mother's Age at birth 1.053*** 1.006** 0.964** 1.139*** 0.993** 1.041*** 0.950**
Mother's Age at birth Sq -0.013** -0.012* -0.011* -0.014** -0.012* -0.012* -0.011*
Lone Parent (MCS1) -0.576 -0.815 -1.662 -0.936 -1.082 -0.613 -2.581
Had baby in teens -0.606 -0.65 -0.45 -0.579 -0.578 -0.603 -0.418
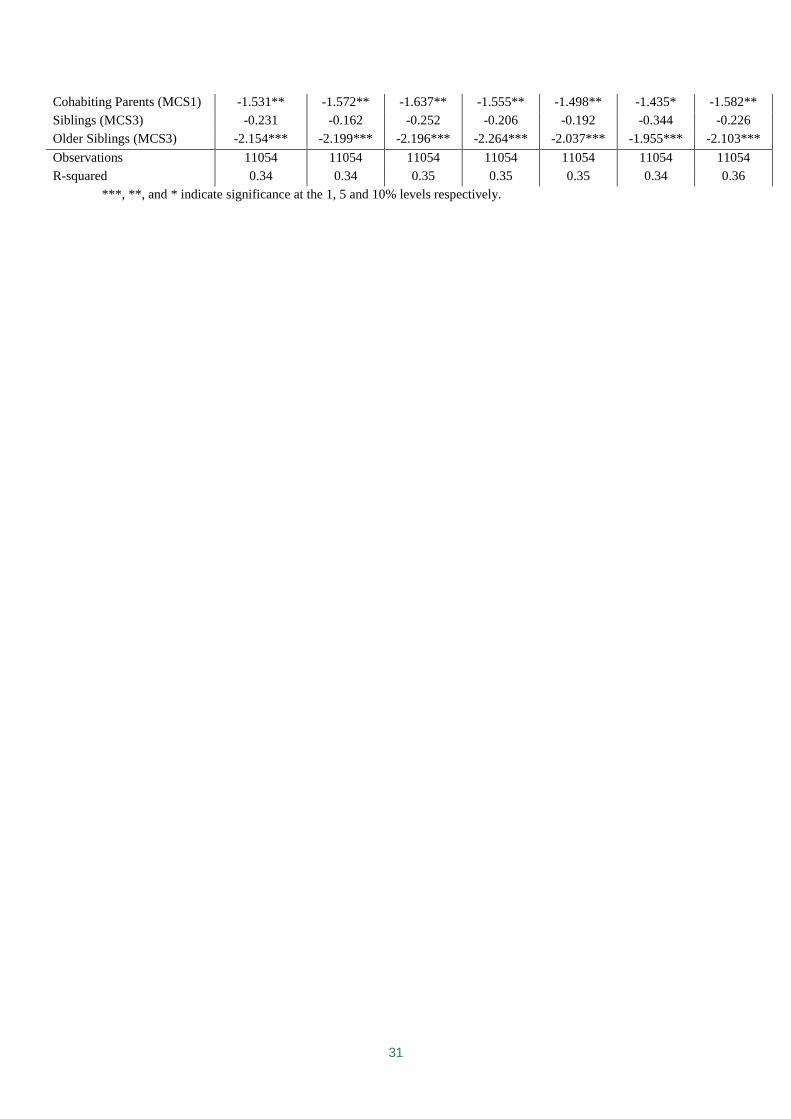
31
Cohabiting Parents (MCS1) -1.531** -1.572** -1.637** -1.555** -1.498** -1.435* -1.582**
Siblings (MCS3) -0.231 -0.162 -0.252 -0.206 -0.192 -0.344 -0.226
Older Siblings (MCS3) -2.154*** -2.199*** -2.196*** -2.264*** -2.037*** -1.955*** -2.103***
Observations 11054 11054 11054 11054 11054 11054 11054
R-squared 0.34 0.34 0.35 0.35 0.35 0.34 0.36
***, **, and * indicate significance at the 1, 5 and 10% levels respectively.

32
Table 17–Mediation of the effect of other characteristics (SDQ value added, MCS3)
(1)
Education,
Family
Background
and Prior
Ability Only
(2)
(1) plus
Family
Interactions
(3)
(1) plus
Health &
well-being
(4)
(1) plus
Childcare
(5)
(1) plus
HLE
(6)
(1) plus
Parenting
Style/Rules
(7)
All
Controls
BAS Score (Age 3) 0.841** 0.771** 0.827** 0.860** 0.712** 0.870*** 0.753**
Bracken (Age 3) 1.554*** 1.523*** 1.472*** 1.618*** 1.370*** 1.424*** 1.308***
SDQ Score (Age 3) 13.848*** 12.083*** 13.184*** 13.850*** 13.196*** 13.576*** 11.373***
SEP Quintile
2nd SEP quintile 1.486* 1.088 0.942 1.495* 1.086 1.229 0.428
3rd SEP quintile 2.064** 1.616* 1.004 2.167** 1.714* 1.54 0.578
4th SEP quintile 2.307** 1.659* 1.205 2.430** 1.686 1.566 0.324
Top SEP quintile 4.806*** 3.778*** 3.461*** 5.106*** 3.926*** 4.126*** 2.357*
Parental Education
Mother NVQ level 1 3.020** 2.858** 2.875** 3.053** 3.070*** 2.605** 2.568**
Mother NVQ level 2 4.056*** 4.070*** 3.670*** 4.029*** 3.822*** 3.348*** 3.255***
Mother NVQ level 3 4.565*** 4.703*** 4.145*** 4.621*** 4.168*** 3.687*** 3.636***
Mother NVQ level 4/5 5.610*** 6.222*** 5.013*** 5.777*** 5.142*** 4.738*** 4.870***
Mother, Other Quals. 3.685 3.921 4.332 3.686 3.564 3.941 4.53
Father NVQ level 1 0.755 0.314 1.626 0.686 0.408 0.748 1.211
Father NVQ level 2 1.296 0.796 2.075** 1.264 1.14 1.122 1.657*
Father NVQ level 3 0.85 0.354 1.647 0.978 0.584 0.568 1.211
Father NVQ level 4/5 1.388 1.201 2.090** 1.492* 1.246 1.053 1.912**
Father Other Quals. -3.634 -2.725 -3.518 -3.757 -3.775 -5.203 -3.993
Child Characteristics
Male Child -2.524*** -2.840*** -2.691*** -2.561*** -2.492*** -2.678*** -3.097***
Child's Age (months) 1.753*** 1.810*** 1.759*** 1.694*** 1.760*** 1.741*** 1.758***
Multiple Birth 1.804 3.536 3.097 1.641 4.304** 1.459 5.054**
Special Care Unit -1.334* -1.141 -0.31 -1.331* -1.273* -1.359* -0.088
Indian Child -2.292 -1.619 -1.741 -2.508 -2.124 -1.699 -1.31
Pakistani Child -7.394*** -6.089** -6.537*** -7.489*** -7.320*** -6.722*** -5.488**
Bangladeshi Child -3.715 -2.294 -2.731 -3.657 -3.902 -2.878 -1.243
Black Caribbean Child -1.496 -1.142 -0.957 -1.245 -1.74 -0.012 0.177
Black African Child -7.754*** -7.534*** -6.537*** -7.595*** -7.799*** -7.296*** -6.042***
Other Ethnicity Child -6.399 -3.529 -6.099 -6.367 -6.636* -5.478 -3.801
Mixed Ethnicity Child -1.97 -1.124 -1.47 -2.087 -1.513 -1.77 -0.615
Family Characteristics
Only English at Home -0.035 -0.89 -0.204 -0.129 -0.487 0.297 -0.677
Mother worked (MCS1/ 2) -0.643 -0.598 -0.618 -0.402 -0.677 -0.69 -0.481
Father worked (MCS1/ 2) 1.446* 1.171 1.089* 1.385** 1.388 1.265** 1.195
Mother worked (MC3) 0.067 -0.006 -0.663 -0.018 0.13 0.043 -0.422
Mother worked (MC3) 1.269** 1.478** 1.496* 1.405 1.638** 1.452* 1.625**
Mother's Age at birth 1.053*** 1.006** 0.964** 1.139*** 0.993** 1.041*** 0.950**
Mother's Age at birth Sq -0.013** -0.012* -0.011* -0.014** -0.012* -0.012* -0.011*
Lone Parent (MCS1) -0.576 -0.815 -1.662 -0.936 -1.082 -0.613 -2.581
Had baby in teens -0.606 -0.65 -0.45 -0.579 -0.578 -0.603 -0.418
Cohabiting Parents (MCS1) -1.531** -1.572** -1.637** -1.555** -1.498** -1.435* -1.582**

33
Siblings (MCS3) -0.107 -0.328 -0.192 -0.052 -0.048 -0.26 -0.403
Older Siblings (MCS3) 1.119** 1.094** 1.233** 1.004** 1.498*** 1.326*** 1.482***
Observations 11054 11054 11054 11054 11054 11054 11054
R-squared 0.36 0.38 0.37 0.36 0.37 0.36 0.4
***, **, and * indicate significance at the 1, 5 and 10% levels respectively.

34
Table 18–Determinants of Mediating Factors at age 3
Large Family
(3+ siblings)
Mother’s
age at birth
Mother-
child
relationship
problems
Highest
HLE
Quintile at
age 3
Parents
reads
every day
at age 3
Regular
bed
times at
age 3
SEP Quintile
2nd SEP quintile -0.100*** 1.786*** -0.020** 0.025 0.063*** 0.034***
3rd SEP quintile -0.181*** 3.155*** -0.033*** 0.036** 0.123*** 0.054***
4th SEP quintile -0.229*** 3.910*** -0.045*** 0.03 0.154*** 0.087***
Top SEP quintile -0.269*** 4.680*** -0.041*** 0.005 0.177*** 0.106***
Parental Education
Mother NVQ level 1 -0.069*** -0.923*** -0.009 0.028 0.041 0.030*
Mother NVQ level 2 -0.091*** -0.678*** -0.027*** 0.041** 0.098*** 0.053***
Mother NVQ level 3 -0.130*** -1.729*** -0.031*** 0.104*** 0.156*** 0.080***
Mother NVQ level 4/5 -0.146*** 0.014 -0.032*** 0.107*** 0.228*** 0.114***
Mother, Other Quals. -0.058 1.728*** -0.017 0.046 0.194*** -0.007
Father NVQ level 1 -0.003 -1.872*** -0.012 0.037 0.043 -0.007
Father NVQ level 2 -0.013 -0.492** 0.008 0.019 -0.003 0.004
Father NVQ level 3 0.001 -0.802*** 0.002 0.037** 0.049** 0.046***
Father NVQ level 4/5 0.011 -0.052 -0.006 0.055*** 0.115*** 0.066***
Father Other Quals. -0.153 -2.397 0 -0.105 0.12 -0.105
Child Characteristics
Male Child 0.005 0.018 0.021*** -0.088*** -0.033*** 0
Multiple Birth -0.059** 1.870*** -0.013 -0.055** -0.049 0.110***
Special Care Unit -0.045*** 0.193 0.012 -0.002 0.012 0.006
Indian Child 0.048 -1.559*** -0.037* 0.016 -0.249*** -0.109***
Pakistani Child 0.199*** -2.624*** 0.031 0.036 -0.082* -0.068*
Bangladeshi Child 0.268*** -2.362*** 0.052 -0.045 -0.212*** -0.086
Black Caribbean Child 0.036 2.091*** -0.001 -0.051 -0.204*** -0.125***
Black African Child 0.071 3.437*** 0.025 -0.107*** -0.360*** -0.242***
Other Ethnicity Child -0.026 0.597 -0.021 0.066 -0.117* -0.061
Mixed Ethnicity Child 0.009 0.472 -0.016 -0.011 -0.046 -0.031
Family Characteristics
Only English at Home 0.029 -0.044 0.014 0.013 0.047 0.027
Mother's Age at birth 0.074*** 0 0.001 -0.011 0.006
Mother's Age at birth Sq -0.001*** 0 0 0 0
Lone Parent (MCS1) -0.078*** -0.953*** -0.008 0.050** 0.028 -0.003
Had baby in teens -0.047 -9.125*** 0.031 0.021 0.013 -0.016
Cohabiting Parents (MCS1) -0.060*** -2.502*** -0.002 0.01 0 -0.038***
Observations 11054 11054 11054 11054 11054 11054
***, **, and * indicate significance at the 1, 5 and 10% levels respectively.

35
Table 19–Determinants of Health and Well Being Factors
Mother
depressed
Birth
weight
Birth weight
(+gestation)
SEP Quintile
2nd SEP quintile -0.044*** 0.041** 0.028*
3rd SEP quintile -0.065*** 0.070*** 0.039**
4th SEP quintile -0.078*** 0.060** 0.032
Top SEP quintile -0.098*** 0.080*** 0.044**
Parental Education
Mother NVQ level 1 0.021 0.046 0.016
Mother NVQ level 2 0.012 0.053** 0.033
Mother NVQ level 3 0.028* 0.073*** 0.029
Mother NVQ level 4/5 0.014 0.065** 0.024
Mother, Other Quals. 0.072 0.086 0.03
Father NVQ level 1 -0.003 0.012 0.001
Father NVQ level 2 -0.002 0.028 0.012
Father NVQ level 3 -0.019 0.044* 0.028
Father NVQ level 4/5 -0.016 0.051** 0.042**
Father Other Quals. 0 0.316 0.187
Child Characteristics
Male Child 0.006 0.140*** 0.138***
Multiple Birth -0.004 -0.896*** -0.438***
Special Care Unit 0.028** -0.536*** -0.065***
Indian Child 0.059* -0.388*** -0.326***
Pakistani Child 0.03 -0.226*** -0.200***
Bangladeshi Child -0.001 -0.249*** -0.272***
Black Caribbean Child 0.018 -0.255*** -0.115**
Black African Child -0.076** -0.015 -0.024
Other Ethnicity Child -0.031 -0.233*** -0.181***
Mixed Ethnicity Child -0.016 -0.137*** -0.113***
Family Characteristics
Only English at Home -0.017 0.028 0.038
Mother's Age at birth -0.010* -0.005 0.002
Mother's Age at birth Sq 0.000* 0 0
Lone Parent (MCS1) 0.017 -0.077*** -0.090***
Had baby in teens 0.002 -0.025 -0.027
Cohabiting Parents (MCS1) 0.014 -0.068*** -0.073***
Gestation
Gestation length (days) 0.066***
Above Squared -0.000***
Observations 11054 11054 11054
***, **, and * indicate significance at the 1, 5 and 10% levels respectively.
9.
However, as already stated, this method may be subject to an ordering bias, e.g. some of the role
played by the home-learning environment could be falsely attributed to parental education if these
two factors are correlated, as seems likely. Table shows the results of our second methodology for
explaining socio-economic differences in BAS scores at age 3, simultaneously controlling for all

36
observable characteristics, which is not subject to the same ordering bias as methodology 1 and
allows us to present results at a more detailed level. It is based on the full regression results shown
in Table 9.
We begin by showing the raw top-bottom and middle-bottom gaps in percentile ranks terms again,
and then show the amount that can be explained by all observable characteristics, both in average
percentile terms and as a percentage of the raw gap. It shows that 69% of the socio-economic gaps
in BAS scores at age 3 can be explained by differences in observable characteristics; whilst 31%
remains unexplained (this is necessarily equal to the total amount explained in the first
methodology). It then decomposes the 69% explained by all observable characteristics into how
much is explained by parental education, family background characteristics and our five groups of
variables representing the early childhood caring environment (as well as a separate group for
missing dummy variables). These results will not necessarily equal those found under the first
methodology. Within each group, we also further decompose the amount explained by each group
into the amount explained by individual (or very similar) variables. We observe that:
Parental Education explains about one sixth of the socio-economic gaps in BAS scores,
less than under the first methodology. This reflects differences in parental education
correlated with socio-economic position that cannot be explained by other factors in the
model. Also, part of the role we ascribed to parental education under the first methodology
should actually have been ascribed to family background characteristics, or measures of the
early childhood caring environment, that are correlated with parental education.
Family Background characteristics explain 25-28% of the socio-economic gaps in BAS
scores at age 3, more than was the case under the first methodology (probably because some
of its role was falsely ascribed to parental education). Looking at the detailed results, we see
that 14-16% of the gaps are explained by the fact that mothers of children from higher
quintiles are, on average, older than those from lower quintiles. Similarly, the fact that the
top quintiles contains greater proportions of working fathers and that these children have
fewer siblings explain 6-9% and 6-7% of the socio-economic gaps. The age of children
explains -8% to -11% of the gaps, which means that the poorer children must have been
tested at slightly later ages, since age has a positive effect on BAS percentiles.
Family Interactions explain 4-5% of the socio-economic gaps, with the largest single
amount being explained by greater levels of mother-child closeness among families in
higher quintile.
Health and Well-Being factors only explain about 2-3% of the gaps, with some positive
contributions (breast-feeding and birth-weight) being offset by some negative factors
(smoking before pregnancy and parental height/weight)
Childcare patterns only explain about 1-2% of the socio-economic gaps
The Home-Learning Environment explains one sixth of the socio-economic gaps, most of
which is done by the HLE index and reading frequency at age 3. This is much larger than
seemed to be the case under the first methodology and must result from some of its role
being falsely ascribed to parental education and/or family background.
In net terms, Parental Style/Rules explains very little of the socio-economic gaps at age 3
in BAS percentile ranks.

37
Therefore, this decomposition shows that over a quarter of the socio-economic gaps in BAS scores
at age 3 can be explained by differences in family background characteristics, mostly down to the
fact that in higher quintiles mothers are older, children have fewer siblings and fathers are more
likely to be in work. A sixth can be explained by differences remains related to parental education
and a further sixth by richer home-learning environments in higher quintile.
Age 3 - Bracken
Table 5 shows the results of our decomposition for Bracken scores (the full regression results are
shown in Table 9). It shows that all observable characteristics can explain 73% of the middle-
bottom gap and 71% of the top-bottom gap. In terms of the individual groups of variables, we
observe that:
Parental Education still explains 15% of the middle-bottom gap and 20% of the top-
bottom gap. This is similar to the amount of the BAS socio-economic gaps explained by
parental education.
Family Background characteristics explain 37% of the middle-bottom gap and 30% of the
top-bottom gap. Similarly to the BAS, the most important individual variables are found to
be the age of the mother at birth, number of siblings and whether the father was in work.
Family Interactions explain 4-6% of the socio-economic gaps in Bracken scores, with the
most important variables being those related to mother-child closeness.
Health and Well-Being factors explain very little of the socio-economic gaps in Bracken
scores, with some small positive contributions (breast-feeding, smoking during pregnancy)
and some small negative contributions (smoking before pregnancy, parental height/weight).
Childcare only seems to explain about 2% of the socio-economic differences in the
Bracken score.
The Home-Learning Environment explains around 15% of the socio-economic
differences in Bracken scores, with the HLE index and reading frequency explaining the
most.
Parental Style/Rules explain a further 3%, with regular bed time at age 3 playing the
largest individual role.
Therefore, the results of the decomposition suggest that 30% of the middle-bottom gap and over a
third of the top-bottom gap can be explained by differences in family background characteristics;
the most important individual variables being mother‟s age, number of siblings and whether the
father works. Differences in parental education and the home-learning environment each explain a
further 15-20% of the socio-economic gaps in the Bracken. This pattern of results is qualitatively
similar to that found for the BAS, with family background playing the largest role, followed by
parental education and the home-learning environment. The specific variables found to be important
are almost identical as well.
Age 5- BAS (Vocabulary) – Static model
Table 6 shows the results of our decomposition methodology for analysing the socio-economic
differences in BAS scores at age 5 (the full regression results are shown in Table 10). The four
columns under the heading “No controls for prior ability” show the results of our static
decomposition. Specifically, it shows that 87% of the middle-bottom gap and 77% of top-bottom
gap can be accounted for by differences in observable characteristics. The specific amounts
explained by different variables are as follows:

38
Parental Education explains about a quarter of the socio-economic gaps. This is more than
parental education explained in terms of BAS scores at age 3 under the decomposition
methodology.
Family Background characteristics explain a further 38% of the top-bottom gap, but 50%
of the middle-bottom gap. The most important individual variables were mother‟s age (15-
20% of the gaps), number of siblings (8%), whether the father was in work (3-4%) and
marital/partner status (6-9%). Only the latter was not important in explaining gaps at age 3.
Family Interactions explain about 3-5% of the socio-economic gaps in BAS scores at age
5, with the most important variables being those related to mother-child closeness. Again,
this is similar to what we found for BAS scores at age 3.
Health and Well-Being factors explain a negative amount of the gap (i.e. they increase it)
with positive contributions (from breast-feeding patterns) more than offset against negative
ones (smoking before pregnancy and parental height/weight).
Childcare only explains about 2% of the socio-economic gaps.
The Home-Learning Environment explains 8-9% of the socio-economic gaps.
Interestingly, this is solely down to differences in the home-learning environment and
reading frequency at age 3. The differences at age 5 are found to be unimportant.
Parenting Style/Rules make a further small contribution of 4-5%, with small contributions
from all of the individual variables.
Age 5 - BAS (Vocabulary) – Value added model
The last four columns of Table 6 show the results of our decomposition methodology when we also
include controls for prior cognitive ability and socio-emotional development (specifically, the
Strengths and Difficulties questionnaire). The full regression results on which this decomposition is
based are shown in Table 10. This shows that observable characteristics explain 92% of the top-
bottom gap and fully explain the middle-bottom gap. Specifically:
Prior cognitive ability explains the majority of both socio-economic gaps. It explains 51%
of the middle-bottom gap and 57% of the top-bottom gap.
Prior socio-emotional development, however, only explains 1% of the gaps.
Parental Education explains a further 14-17% of the socio-economic gaps.
Family Background characteristics explain a further 21% of the top-bottom gap and 27%
of the middle-bottom gap. The individual variables making the largest contributions are
mother‟s age at birth, marital/partner status and number of siblings. However, the
importance of mother‟s age at birth and number of siblings are halved as compared with the
static decomposition at age 5, suggesting that part of their impact at age 5 is via higher
levels of cognitive ability at age 3.
Family Interactions only explain a further 1% of the socio-economic gaps.
Health and Well-Being factors make a small negative contribution, overall. There are
positive contributions from breast-feeding patterns, but negative ones from smoking before
pregnancy and parental height/weight.
Childcare only contributes a further 1% to the socio-economic gap
The Home-Learning Environment hardly contributes anything at all. Since it was
important in the static decomposition, this suggests that differences in the home-learning
environment only explain gaps at age 5 via improving cognitive ability at age 3.
39
Parenting Style/Rules explain a further 3-4% of the gap, though no one variable appears to
be particularly important.
Socio-emotional development
We now move on to explaining socio-economic differences in a measure of socio-emotional
development, namely Strength and Difficulties (SDQ) scores. Again, we look at these both at ages 3
and 5.
Age 3
40
Table 7 shows the results of our decomposition methodology for explaining the socio-economic
gaps in SDQ scores at age 3 (the full regression results are shown in Table 9). It shows that the total
amount explained by all observable characteristics is 82% for the top-bottom gap and 75% for the
middle-bottom gap. Looking at the individual groups of factors, in sum and in detail, we find that:
Parental Education explains a sixth of the top-bottom gap and about a tenth of the middle-
bottom gap.
Family Background characteristics explain a further sixth of the socio-economic gaps in
SDQ scores. Similarly to the decompositions for cognitive outcomes, we find that the
largest contribution from a single variable comes from mother‟s age at birth. The next
largest contribution comes from martial/partner status.
Family Interactions explain 14-17% of the socio-economic gaps, with the largest single
contribution coming from measures of mother-child closeness.
Health and Well-Being factors explain a similar amount of 12-16%, with the largest
individual contributions coming from differences in breast-feeding patterns, smoking during
pregnancy and infant temperament at nine months.
Childcare again explains very little of the socio-economic gaps.
The Home-Learning Environment explains a little under a tenth of the socio-economic
gaps with similar contributions from the home-learning environment index and reading
frequency, and self-reported parental competency.
Parenting Style/Rules explains a further tenth of the socio-economic gaps in SDQ scores,
with largely equal contributions from each of the individual factors.
Therefore, the largest single contribution to the socio-economic gaps in socio-emotional
development at age 3 is found to be family background characteristics, mother‟s age at birth in
particular. This is similar to what was found for cognitive outcomes. However, measures of the
early childhood caring environment play a larger role in explaining socio-economic gaps in socio-
emotional development than for cognitive outcomes, family interactions and health and well-being
in particular, though parenting style/rules and the home-learning environment also play a noticeable
role.
Age 5 - Static model
Table 8 then shows the results of the results of our decomposition methodology for explaining
differences in socio-emotional development at age 5 (the full regression results are shown in Table
10). This is shown in the first four columns without controls for prior cognitive and socio-emotional
development. Taken together, all observable characteristics explain 84% of the middle-bottom gap
and 81% of the top-bottom gap. Looking at factors individually, we find that:
Parental Education still explain about a fifth of the socio-economic gaps.
Family Background characteristics explain around a fifth of the socio-economic gaps. The
individual variables that contribute the most are mother‟s age, marital/partner status and
parental working patterns.
Family Interactions contribute a little over one tenth, with contributions from both mother-
child closeness and parental harmony measures.
Health and Well-Being Factors contribute a little under a tenth, with the largest
contributions coming from breast-feeding patterns, smoking before pregnancy and infant
temperament.

41
Childcare make very little difference to the estimated socio-economic gaps
The Home-Learning Environment is estimated to explain about 10% of the socio-
economic gaps, with the largest contribution coming from self-reported parenting
competency.
Parenting Style/Rules is also estimated to contribute about 10% towards the socio-
economic gaps, with the largest contributions coming from regular bed times at age 5 and
regular meal times.
Age 5 - Value-added model
In the last four columns of Table 8 we add controls for prior cognitive and socio-emotional
development (the full regression results are shown in Table 10). It shows that observable
characteristics explain 96% of the middle-bottom gap and 90% of the top-bottom gap. The
following summarises the results for specific groups of variables:
Prior Cognitive Ability explains less than a tenth of the socio-economic gaps.
Prior Socio-emotional Development explains around two-fifths of the socio-economic
gaps.
Parental Education explains a further 14% of the socio-economic gaps, which is less than
the 15-19% without controls for prior ability in the static model.
Family Background characteristics explain around a tenth of the socio-economic gaps in
non-cognitive ability at age 5, with controls for prior ability. The largest single contribution
occurs via marital/partner status.
Family Interactions now explains only 4% of the socio-economic gap in the value-added
model as compared with 11-12% in the static model. The largest contribution comes from
the parental harmony variables.
Health and Well-Being factors now explain only a very small portion of the socio-
economic gap in the value-added model, as compared with the tenth in the static model.
Childcare still explains very little
The Home-Learning Environment explains 6-7% of the socio-economic gaps, compared
with 9-10% in the static model. The largest contribution here again comes from self-
reported parenting competency.
Parenting Style/Rules explains 5-6% in this value-added model, as compared with 9-11%
in the static model. Similarly though, the largest contributions come from regular bed times
at age 5 and regular meal times.
The pattern of the result is very similar to the static model, with family background characteristics
playing the largest role, followed by remaining effects of parental education. The measures of the
early childhood caring environment then explain a small portion each. However, all of the
contributions are reduced as compared with the static model. This suggests that a large element of
their effect on socio-economic gaps at age 5 works via differences in cognitive ability and socio-
emotional development at age 3, most likely via the latter given its relatively high importance in
explaining differences at age 5.
Summary of Results
Across both cognitive outcomes at age 3 and age 5, it is family background factors that explain the
largest portion of socio-economic differences. Looking at individual family background factors, it is

42
differences in mother‟s age, number of sibling and working patterns that are found to explain the
largest element of these socio-economic differences. The next largest contribution comes from
differences in parental education – this reflects the effects of parental education that do not work
through the early childhood caring environment, or anything else in the model. This is followed by
differences in the home-learning environment and reading frequency. Other factors, like family
interactions and parenting style/rules, only explain a small proportion of the socio-economic gaps.
In total, observable characteristics explain about 65-75% of the socio-economic gaps at age 3, and
77-87 % of socio-economic differences in cognitive outcomes at age 5.
When we also condition on prior cognitive ability and socio-emotional development, we find that
prior cognitive outcomes explain over 50% of the socio-economic differences at age 5, whilst prior
socio-emotional development explains very little, if anything. The only other factors that explain a
large proportion of the socio-economic gaps, after controlling for prior ability, are remaining effects
of parental education and family background (again, mother‟s age, number of siblings and
marital/partner status being most important). The influence of these items is much reduced
compared with the static model suggesting some of their impact occurs via their effect on cognitive
ability at age 3. The home-learning environment is found to be unimportant in this decomposition,
suggesting that it only explains age 5 outcomes through its influence on age 3 cognitive outcomes.
As was the case for cognitive ability, family background factors are estimated to make the largest
contribution to the socio-economic gaps in socio-emotional development at ages 3 and 5, with
mother‟s age at birth appearing to be the most important single variable again. The remaining
effects of parental education are the next most important factor in explaining socio-economic
differences. However, there is a also estimated to be a larger role for the measures of the early
childhood caring environment than there was for cognitive ability, with similar contributions at ages
3 and 5 from family interactions, health and well-being factors, the home-learning environment and
parenting style/rules. This suggests that the influences on socio-economic differences in socio-
emotional development are wider than they are for cognitive ability.
In the value-added model, prior socio-emotional development plays the biggest role in explaining
socio-economic differences, as might be expected. The contributions of the other factors are much
reduced, suggesting that some of their influence works via affecting prior socio-emotional
development and cognitive ability, though the influence of the latter is relatively small.
5. Mediation of other effects
In this section we briefly discuss the mediation of the gradient in child outcomes across other
characteristics, which include: parental education; child characteristics, such as gender and
ethnicity; and family characteristics, such as working patterns, mother‟s age at birth and lone parent
status. We do not investigate the mediation of these gradients in as much detail as we did for socio-
economic position.
The upper panel of

43
Table 11 shows the mediation of the gradient across quintiles of our socio-
economic position index for BAS scores at age 3. It is the same as that shown in
Table 33, except that it starts at column (3) where family background
characteristics are included and shows the coefficients on all SEP quintiles (a part
from the omitted category, the bottom quintile).
44
Table 11 also shows the mediation of the coefficients on parental education, child and family
characteristics. Table 12 to Table 17 then show the same for the other cognitive and socio-
emotional development at age 3 and 5
Parental education
Looking at the second panel of

45
Table 1, we observe that the gradient across mother‟s education, in terms of BAS scores at age 3,
evolves in a similar way as that across SEP quintiles as different groups of variables are added. The
biggest reductions in the gradient across mother‟s education is seen when measures of the home-
learning environment are added, though the reduction in the gradient is larger for mother‟s
education than it is for SEP quintiles. The next largest reductions are observed for health and well-
being factors. This pattern is then repeated for Bracken scores in Table 12, with the home-learning
environment reducing the gradient by most and by more than was the case for the SEP quintiles.
When we look at SDQ scores at age 3 in Table 13, the biggest reduction in the gradient across
mother‟s education occurs when health and well-being factors are controlled for, followed by the
home-learning environment and parenting style/rules. This is a slight contrast to the SEP gradient,
where the biggest reductions were observed when family interactions were added.
Table 14 then shows the gradients in BAS scores age 5. Here, we observe the biggest reductions
when we control for the home-learning environment and health and well-being factors (the same as
at age 3), whilst the biggest reductions in the SEP gradient occurs when the home-learning
environment and parenting style/rules are controlled for. There is a small reduction in the BAS
value-added gradient (Table 16) across mother‟s education when all groups of factors are added, but
the reductions tend to be small in value. When we look at SDQ scores at age 5 in Table 15, the
gradient across mother‟s education changes very little as different factors are controlled for.
However, in the value-added specification (Table 17), there is a noticeable reduction when
parenting style/rules are controlled for.
We can then go back to look at the evolving gradient across father‟s education as we control for
different groups of factors. For both cognitive outcomes at age 3, the pattern is similar to that for
mother‟s education, the biggest reductions in the coefficients on father‟s education result from the
addition of the home-learning environment and health and well-being factors. The pattern is again
similar for SDQ scores at age 3, with the biggest reductions occurring when we control for health
and well-being factors, followed by the home-learning environment and parenting style/rules.
There is slight difference with mother‟s education when looking at BAS scores at age 5, the home-
learning environment still reduces the gradient by the most, but health and well-being factors
actually slightly increase the gradient in father‟s education, as opposed to the reductions for
mother‟s education. The gradient in father‟s education in BAS value-added scores is little affected
by our groups of variables. Neither is there much change in the gradient for father‟s education in
terms of SDQ scores at age 5, both for the static and value-added specification.
Therefore, the gradient in parental education for cognitive outcomes at ages 3 and 5 is most reduced
by the addition of the home-learning environment – it also reduces the gradient in terms of SDQ
scores at age 3. Health and well-being factors reduce the gradient across cognitive outcomes at age
3 for both mother‟s and father‟s education. There is little change in the parental education gradients
when we examine SDQ scores at age 5.
Child Characteristics

46
Table 2 to Table 14 show that boys tend to have worse child outcomes at age 3 in terms of cognitive
outcomes and socio-emotional development. A part from a slight reduction when we control for the
home-learning environment, there is little change in this gap between boys and girls as we control
for different groups of factors. There is hardly any change at all in the effect of child‟s age either.
However, the negative effect of being a twin or triplet is reduced when we control for the home-
learning environment for both cognitive and non-cognitive outcomes. It is also reduced for
cognitive outcomes when we control for health and well-being factors. As might be expected, the
negative effect on child outcomes of having been in a special care unit just after birth is reduced by
controlling for health and well-being factors (critically including length of gestation and birth-
weight).
Moving on to examine child outcomes at age 5, we observe that the gap between boys and girls in
terms of BAS scores is much smaller than at age 3 and is statistically insignificant in all but one
specification. The value-added specification shows that this catch-up by boys cannot be readily
explained any of the groups of variables. However, boys do have lower SDQ scores than girls at age
5, which is slightly reduced when we control for the home-learning environment. Again, the effect
of child age is not readily explained by the groups of factors we control for. Similar to what we saw
at age 3, the negative effect of being a twin or triplet on BAS scores at age 5 is reduced when we
control for the home-learning environment and health and well-being factors. There is no significant
difference between the SDQ scores of single and multiple births at age 5. There is no significant
effect of being in a special care unit on child BAS scores at age 5. However, there is a significant
and negative effect on SDQ scores, which is reduced most by health and well-being factors.
Dearden and Sibieta (2010) examine the ethnic gradients in child outcomes at age 3 and 5 using the
same data. They find that “there are quite large ethnic gaps in early child cognitive development,
the gap to white children is particularly large for Pakistani and Bangladeshi children. However, they
also say that “once we take account of differences “traditional” mediating factors, such as family
background and individual demographics, these ethnic gaps in outcomes are much reduced. For
example, children from ethnic minority backgrounds seem to live in poorer households and have
parents that are less well educated and as a result have lower levels of cognitive development.”
They also find, as can be observed from the tables, that there is a role for other mediating factors,
particularly poor home-learning environments amongst Black African families.
Family Characteristics
The bottom panels of

47
Table to

48
Table show the mediation of other family characteristics as we control for different groups of
variables. It shows that children from households where only English is spoken at home have
significantly better cognitive outcomes at age 3. This gap is slightly reduced by the addition of
family interaction variables and measures of the home-learning environment. The same pattern
emerges age 5, though none of the variables explain the gaps in BAS value-added between ages 3
and 5. However, there is no significant gap in SDQ scores at age 3 or 5.
When looking at the effect of mother‟s working patterns up to age 3, we find few significant effects
on child outcomes at ages 3 and 5. In contrast, we find that having a father in work over the same
period has a positive effect on cognitive outcomes at age 3 (conditional on having a father in the
house). This positive effect is slightly reduced when we control for family interactions and health
and well-being factors, but is otherwise unchanged. There is then no significant effect of father‟s
working patterns on SDQ scores at age 3. Looking at age 5 outcomes, there is no significant effect
of father‟s working patterns on BAS scores at age 5, though there is a small, yet significant,
positive effect on SDQ scores at age 5. This is largely unchanged by the inclusion of other factors.
As we already knew, mother‟s age (at birth) is estimated to have a positive effect on all child
outcomes at ages 3 and 5. The negative and significant quadratic term in mother‟s age indicates that
the positive effect of mother‟s age is diminishing. Interestingly, the coefficients on mother‟s age are
largely unchanged when we control for other groups for all child outcomes at ages 3 and 5. This
means that the positive estimated effects of mother‟s age on child outcome occur via mechanisms
that are unobservable in the MCS data, which include: the richness of the home-learning
environment; length of gestation and birth-weight; regularity of bed or meal times; maternal
depression; and other factors. The effects of mother‟s age instead seem to be occurring via other,
unobservable mechanisms. This was also suggested by the relative importance of mother‟s age in
the decomposition analysis.
When we have controlled for socio-economic position, parental education and family background,
there is no significant effect of lone-parent status on any child outcomes at ages 3 or 5. This is an
important finding, it strongly suggests that the worse raw outcomes observed for children from
lone-parent families can largely be explained by their lower socio-economic position and their
parent‟s lower levels of education. The same is true of teen mother status, though we are controlling
for mother‟s age, meaning that there is no extra effect of being a teen-mother over and above the
effect of mother‟s age. There is also no significant effect of being a cohabiting couple on cognitive
outcomes at age 3, though there is a small, negative and significant effect on SDQ scores at age 3
(mostly explained by differences in family interactions). There is no significant estimated effect of
cohabitation status in terms of BAS scores at age 5 either, though there is again a small, negative
and significant effect on SDQ scores at age 5. Goodman and Greaves (2010) further investigate the
effects of cohabitation on child outcomes at ages 3 and 5.
Finally, we also estimate there to be a negative effect of the number of older siblings on cognitive
outcomes at age 3, the effect of younger siblings is not statistically significant. This older sibling
effect is slightly reduced by the richness of the home-learning environment, but otherwise is largely
unchanged as we control for different groups of factors. We also estimate there to be a negative
effect of older siblings on SDQ scores, though this is largely explained by differences in family
interactions. This pattern of results is mirrored at age 5 for both cognitive and non-cognitive
outcomes.

49
6. Determinants of factors
In this section we briefly discuss the determinants of some of the mediating factors that were found
to be important in explaining the socio-economic gradient in child outcomes.

50
Table 18 shows the determinants of these mediating factors at age 3 in terms of socio-economic
position, parental education and family background characteristics. We focus on pre-determined
factors at birth, thus we exclude child‟s age, parental working patterns and number of siblings at
later ages. In all cases, we simultaneously control for these pre-determined factors. Health and well-
being factors are examined separately in

51
Table19 with extra controls for length of gestation when examining the determinants of birth-
weight.
The first column of
52
Table 18 examines which factors predict whether a child lives in a large family (defined as three or
more siblings), simultaneously controlling for pre-determined factors. Socio-economic position
itself is estimated to reduce this probability, as is mother‟s highest qualification level (though not
father‟s education). Being a twin or triplet is estimated to reduce the probability of a child being in a
large family, as is being in a special care unit just after birth. Pakistani and Bangladeshi children are
more likely to live in a large family, controlling for other factors. Children with older mothers at
birth are less likely to come from large families, as are the children of lone parents and those from
cohabiting families.
The determinants of mother‟s age at birth are shown in the second column. Socio-economic position
and mother‟s education are both estimated to increase mother‟s age at birth. Father‟s education is
estimated to be negatively correlated with mother‟s age at birth, but only up to NVQ level 3. Twins
or triplets are more likely to have older mothers at birth – likely to be a case of reverse causation.
Indian, Pakistani and Bangladeshi children are less likely to have older mothers at birth, whilst
Black African and Black Caribbean children are more likely to have older mothers. Lone parents
and cohabiting couples are also estimated to be younger. Naturally, the dummy for being a teenage
mother is estimated to reduce mother‟s age.
Column (3) shows the determinants of the probability of having one or more mother-child
relationship problem. It shows that socio-economic position is estimated to reduce this probability,
as is mother‟s education (though, again, not father‟s education). Male children are estimated to have
a greater chance of mother-child relationship problems. Indian children are estimated to have a
lower chance of developing a mother-child relationship problem, as compared with white children.
There are no significant differences for all other ethnic minorities as compared with white children.
We show the determinants of being in the richest quintile of the home-learning environment (HLE)
index in Column (4). Here, socio-economic position is not estimated to significantly affect this
probability, controlling for other factors. However, more educated mothers are much more likely to
provide a rich HLE; father‟s education is estimated is also estimated to have a significant, positive
effect, though smaller. We also observe that boys are less likely to have a rich HLE, though it is not
clear in which direction causation runs in this case. Twins and triplets are also less likely to have a
rich HLE. Black African children are the only ethnic minority to have a lower probability of having
a rich HLE, as compared with white children. And lone parents are estimated to provide a richer
HLE than two-parent families.
In column (5) we focus on the determinants of reading to children every day. Here we observe that
both socio-economic position and mother‟s education increase the probability that children are read
to every day, as does father‟s education to a lesser extent. As with the overall HLE index, boys are
less likely to be read to every day. Indian, Bangladeshi, Black African and Black Caribbean are all
less likely to be read to every day than are white children.
The final column of
53
Table 18 shows factors than explain having regular bed times at age 3. Similarly to being read to
every day, socio-economic position and mother‟s education all have positive effect on the
probability of having regular bed times. Father‟s education is also estimated to have a positive
effect. Twins and triplets are also more likely to have a regular bed time at age 3. Indian, Pakistani,
Black African and Black Caribbean are also less likely to have a regular bed time than white
children. The children of cohabiting couple are also slightly less likely to be have regular bed times
at age 3.
In

54
Table19 we investigate the determinants of health and well-being factors. In column (1) we examine
the factors that explain the likelihood that mothers experience depression shortly after birth. It
shows that socio-economic position reduces this probability, but that there is little effect of parental
education. Mothers are also more likely to be depressed if their child was in a special care unit
shortly after birth. Mothers of Indian children are more likely to be depressed than those of white
children, though the mothers of Black African children are less likely. Older mothers are less likely
to be depressed, but the negative effects of age are diminishing.
In column (2) we investigate the predictors of birth-weight without controlling for length of
gestation, which is then added in column (3). We observe that socio-economic position is estimated
to increase birth-weights, with the effect being halved once we control for length of gestation.
Mother‟s education is only estimated to increase birth-weight when we don‟t control for gestation
length, thus the effects of mother‟s education work via length of gestation. Fathers education has a
small, positive effect with and without controls for gestation. Boys have higher birth-weights with
and without control for length of gestation. Twins and triplets have lower birth-weights without
controls for length of gestation, but the effect is halved once we do so – again, the effect of being a
twin or triplet on birth-weight partly works via length of gestation. Children who were in a special
care unit shortly after birth have lower birth-weights, though most of this can be largely explained
via length of gestation.
We then observe that all children from ethnic minorities have significantly lower birth-weights than
white children, the only exception is Black African children. When we control for length of
gestation most of these gaps are very slightly reduced, but are much reduced for Black Caribbean
children. We also find a negative effect of lone-parent status and cohabiting status, neither of which
can be explained by length of gestation.
7. Conclusions
In conclusion, we have confirmed that there are substantial differences in cognitive and socio-
emotional development between children from rich and poor backgrounds even at the age of 3, and
that this gap widens by the age of 5. Children from poor backgrounds also face much less
advantageous “early childhood caring environments” than children from better off families. For
example we have observed significant differences in poor children‟s and their mothers‟ health and
well-being and the home learning environment.
We also find that differences in the home learning environment at age 3 have an important role to
play in explaining why children from poorer backgrounds have lower levels of cognitive
development than children from better off families, explaining about a sixth of the gap. However, a
much a much bigger proportion of the socio-economic gap appears directly related to other aspects
of family background (such as parental education, mothers‟ age, and family size) that are not
mediated through the early childhood caring environment, and a significant element remains
explained.
It is noteworthy that it is the home-learning environment measured at age 3 that is found to be
important in explaining outcomes at ages 3 and 5, the latter working through its impact on cognitive
ability at age 3. The home-learning environment measured at age 5 is not estimated to impact on
cognitive outcomes at age 5, or thus the gap in cognitive outcomes at age 5. This stresses the
importance of early intervention. However, it is difficult to know with certainty whether
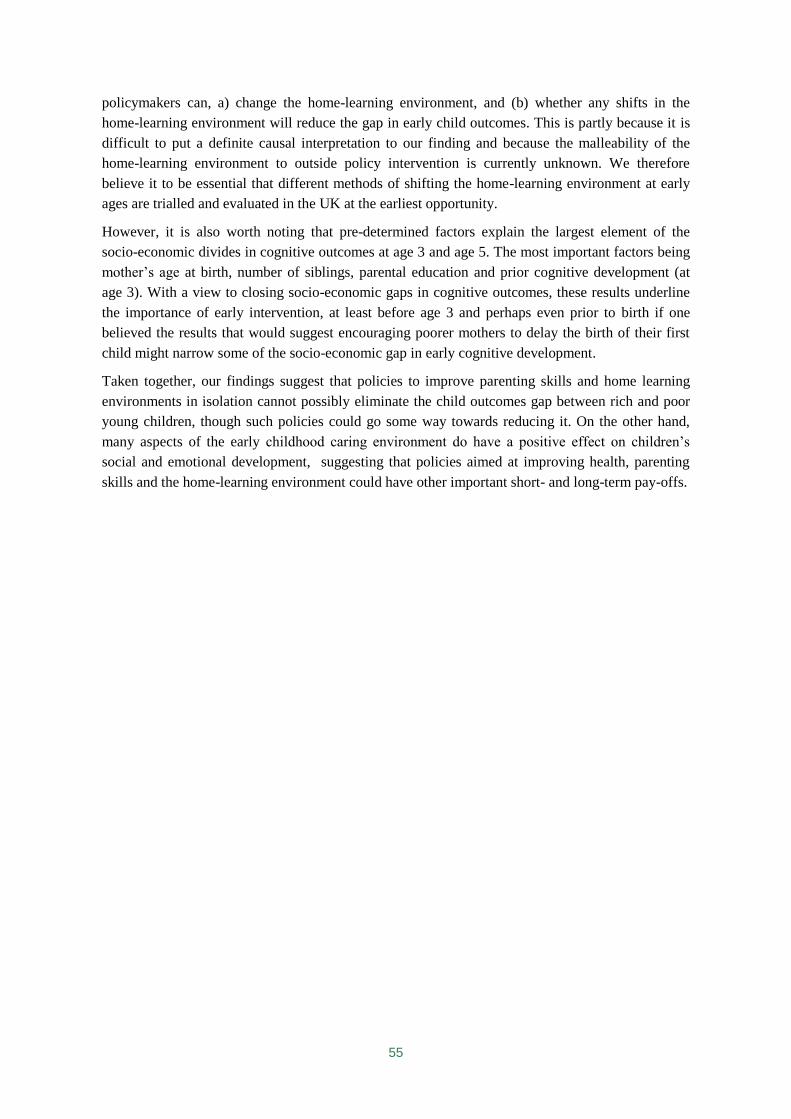
55
policymakers can, a) change the home-learning environment, and (b) whether any shifts in the
home-learning environment will reduce the gap in early child outcomes. This is partly because it is
difficult to put a definite causal interpretation to our finding and because the malleability of the
home-learning environment to outside policy intervention is currently unknown. We therefore
believe it to be essential that different methods of shifting the home-learning environment at early
ages are trialled and evaluated in the UK at the earliest opportunity.
However, it is also worth noting that pre-determined factors explain the largest element of the
socio-economic divides in cognitive outcomes at age 3 and age 5. The most important factors being
mother‟s age at birth, number of siblings, parental education and prior cognitive development (at
age 3). With a view to closing socio-economic gaps in cognitive outcomes, these results underline
the importance of early intervention, at least before age 3 and perhaps even prior to birth if one
believed the results that would suggest encouraging poorer mothers to delay the birth of their first
child might narrow some of the socio-economic gap in early cognitive development.
Taken together, our findings suggest that policies to improve parenting skills and home learning
environments in isolation cannot possibly eliminate the child outcomes gap between rich and poor
young children, though such policies could go some way towards reducing it. On the other hand,
many aspects of the early childhood caring environment do have a positive effect on children‟s
social and emotional development, suggesting that policies aimed at improving health, parenting
skills and the home-learning environment could have other important short- and long-term pay-offs.

56
References
Adler, N. E., Boyce, W. T., Chesney, M. A., Folkman S., and Syme, S. L. (1993), “Socioeconomic
inequalities in health: No easy solution”, Journal of the American Medical Association, 269, 3140-
3145.
Becker, G. and N. Tomes, (1986), “Human capital and the rise and fall of families”, Journal of
Labor Economics, 4(3), S1-S39.
Belfield, C.R., Nores, M., Barnett, S. and Schweinhart, L. (2006), "The High/Scope Perry Preschool
Program: Cost–Benefit Analysis Using Data from the Age-40 Followup," Journal of Human
Resources, University of Wisconsin Press, vol. 41(1).
Bornstein, M. (Ed.). (1995). Handbook of parenting. Hillsdale, NJ: Erlbaum.
Bradley, RH. Home environment and parenting. In Handbook of parenting. M. Bornstein, ed.
Hillsdale, NJ: Erlbaum, 1995.
Brooks-Gunn, J., & Duncan, G. (1997), “The effects of poverty on children and youth”, The Future
of Children, 7, 55- 71.
Brooks-Gunn,J., Duncan, GJ., Klebanov, P.K, and Sealand, N. (1993), “Do neighborhoods
influence child and adolescent behavior?” American Journal of Sociology , 99,2:335-95.
Brooks-Gunn, J., McCarton, C., Casey, P., McCormick, M., Bauer, C., Bernbaum, J., Tyson, J.,
Swanson, M., Bennett, F., Scott, D., Tonascia, J., & Meinert, C. (1994), “Early intervention in low
birth weight, premature infants: Results through age 5 years from the Infant Health and
Development Program”, Journal of the American Medical Association, 272(16), 1257-1262.
Burchinal, M. R., Campbell, F. A., Bryant, D. M., Wasik, B. H., & Ramey, C. T. (1997), “Early
intervention and mediating processes in cognitive performance of children of low-income African-
American families”, Child Development, 68(5), 935-954.
Carneiro, P. and J.J. Heckman, (2002), “The evidence on credit constraints in post-secondary
schooling”, Economic Journal, 112(482), 705-734.
Chowdry, H., Crawford, C. and Goodman, A. (2010), “The role of attitudes and behaviours in
explaining socio-economic differences in attainment at age 16”, IFS Working Paper W10/15.
Crawford, C., Goodman, A. and Joyce, R. (2010), “Explaining the socio-economic gradient in child
outcomes: the intergenerational transmission of cognitive skills”, IFS Working Papers , W10/16.
Dearden, L., Mesnard, A. and Shaw, J. (2006), “Ethnic differences in birth outcomes in England”,
Fiscal Studies, Vol. 27, No. 1, March 2006, pp. 17-46.
Duncan, G., & Brooks-Gunn, J. (Eds.). (1997), “Consequences of growing up poor“, New
York: Russell Sage Foundation.
Duncan, G., & Brooks-Gunn, J. (2000), “Family Poverty, Welfare Reform, and Child
Development”, Child Development, 71, 188-196.
Duncan, GJ., Brooks-Gunn, J., and Klebanov, P.K. (1994), “Economic deprivation and early-
childhood development”, Child Development, 65,2:296-318.

57
Garces, E., Thomas, D. and Currie, J. (2002), "Longer-Term Effects of Head Start," American
Economic Review, American Economic Association, vol. 92(4), pp 999-1012.
Goldstein, N. (1990), “Explaining socioeconomic differences in children's cognitive test
scores”,Working Paper No. H-90-1. Cambridge, MA: Malcolm Wiener Center for Social
Policy, John F Kennedy School of Government, Harvard University, 1990.
Goodman, A. and Gregg. P. (eds) (2010), “Poorer children's educational attainment: how
important are attitudes and behaviour?”, Joseph Rowntree Foundation
Gregg, P. and S. Machin, (1998), “Childhood disadvantage and success or failure in the youth
labour market” Centre for Economic Performance Discussion Paper 397.
Gregg, P. and Washbrook, E. (2010), “The socio-economic gradient in child outcomes: the role of
attitudes, behaviours and beliefs. The primary school years'”, CMPO Working Paper
Haveman, R. and B. Wolfe, (1995), “The determinants of children‟s attainments: A review of
methods and findings”, Journal of Economic Literature, 23, 1829-1878.
Hofferth, S., & Phillips, D. A. (1991), “Childcare policy research”, Journal of Social Issues,
47(2), 1-13.
Howes, C. (1988), “Relations between early child care and schooling”, Developmental
Psychology, 24(1), 53-57.
Korenman, S., Miller,J.E., and Sjaastad,J.E. Long-term poverty and child development in the
United States: Results from the National Longitudinal Survey of Youth. Children and Youth
Services Review (1995) 17,1/2:127-51.
Lazar, I., & Darlington, R. B. (1982), “Lasting effects of early education: A report from the
consortium for longitudinal studies”, Monographs of the Society for Research in Child
Development, 47(2-3, Serial No. 195).
Ludwig, J. and Miller, D.L. (2007), "Does Head Start Improve Children's Life Chances?
Evidence from a Regression Discontinuity Design," Quarterly Journal of Economics, MIT
Press, vol. 122(1), pp 159-208.
Mayer, S. (1997). What money can't buy: The effect of parental income on children's outcomes.
Cambridge, MA: Harvard University Press.
McLeod,J.D., and Shanahan, MJ, (1993), “Poverty, parenting and children's mental health”,
American Sociological Review (June 1993) 58,3:351-66.
NICHD Early Child Care Research Network. (1997), “The effects of infant child care on infant-
mother attachment security: Results of the NICHD study of early child care”, Child
Development, 68, 860-879.
NICHD Early Child Care Research Network. (1998), “Relations between family predictors and
child outcomes: Are they weaker for children in child care?” Developmental Psychology, 34(5),
1119-1128.\
Ramey, C. T., & Ramey, S. L. (1998), “Prevention of intellectual disabilities: Early
interventions to improve cognitive development”, Preventive Medicine, 27, 224-232.
Sylva, K, Melhuish, E., Sammons, P., Siraj-Blatchford, I., & Taggart, B. (2008), “Effective
Pre-school and Primary Education 3-11 Project (EPPE 3-11): Final Report from the Primary
Phase: Pre-school, School and Family Influences on Children‟s Development during Key Stage
2 (Age 7-11)”, London: Department for children, schools and families.

58
Tables and Figures
Table 1(a) – Cognitive ability at ages 3 and 5, by parents’ SEP
Proportion of children: SEP Q1 SEP Q2 SEP Q3 SEP Q4 SEP Q5
Bottom 40% at Age 3 (BAS) 59.0 48.7 38.7 32.0 26.4
Escape from bottom 40% by Age 5 (BAS) 25.7 25.7 32.8 42.4 53.0
Top 40% at Age 3 (BAS) 23.9 23.9 34.0 45.1 52.4
Drop out of top 40% by Age 5 (BAS) 57.0 57.0 49.2 40.7 33.8
Bottom 40% at Age 5 (BAS) 62.2 62.2 51.1 40.2 30.4
Top 40% at Age 5 (BAS) 21.9 21.9 31.0 41.5 52.2
Table 1(b) – Strengths and Difficulties at ages 3 and 5, by parents’ SEP
Proportion of children: SEP Q1 SEP Q2 SEP Q3 SEP Q4 SEP Q5
Bottom 40% at Age 3 58.6 46.2 36.2 30.8 24.6
Escape from bottom 40% by Age 5 20.2 26.0 28.9 33.5 39.1
Top 40% at Age 3 20.9 30.2 37.0 41.4 48.7
Drop out of top 40% by Age 5 59.6 46.3 40.2 35.0 29.9
Bottom 40% at Age 5 65.8 52.0 42.9 37.7 29.2
Top 40% at Age 5 19.5 29.8 36.4 41.3 50.2

59
Table 2 - Socio-economic differences in family and child characteristics/behaviours
SEP
Q1
(Low)
SEP
Q3
(Middle)
SEP
Q5
(High)
Gap
(High –
low)
Parental Education (MCS1)
Mother - no qualifications 32.8% 6.6% 0.9% -31.9 ppts
Mother NVQ level 1 15.8% 6.6% 1.1% -14.7 ppts
Mother NVQ level 2 35.0% 36.9% 14.0% -21.0 ppts
Mother NVQ level 3 9.8% 19.4% 11.5% 1.7 ppts
Mother NVQ level 4/5 6.6% 30.4% 72.6% 65.9 ppts
Mother, Other Qualifications 3.7% 1.4% 0.6% -3.1 ppts
Father - no qualifications 48.5% 18.6% 2.0% -46.6 ppts
Father NVQ level 1 11.7% 6.8% 1.3% -10.4 ppts
Father NVQ level 2 23.3% 31.2% 12.2% -11.2 ppts
Father NVQ level 3 10.4% 18.6% 11.6% 1.2 ppts
Father NVQ level 4/5 6.0% 24.8% 73.0% 66.9 ppts
Father Other Qualifications 0.0% 0.1% 0.0% 0.0 ppts
Child Characteristics
Male 48.4% 49.3% 49.9% 1.6 ppts
Child's Age at MCS3 (years) 5.21 5.19 5.21 -0.01
Multiple Birth 2.2% 2.5% 2.9% 0.7 ppts
Special Care Unit 9.0% 9.0% 9.8% 0.8 ppts
MCS1 White 84.2% 92.6% 94.5% 10.2 ppts
MCS1 Indian 1.0% 1.9% 1.4% 0.4 ppts
MCS1 Pakistani 3.6% 1.7% 0.2% -3.4 ppts
MCS1 Bangladeshi 1.4% 0.2% 0.0% -1.4 ppts
MCS1 Black Caribbean 2.0% 0.3% 0.3% -1.7 ppts
MCS1 Black African/Other 2.0% 0.5% 0.3% -1.7 ppts
MCS1 Other Ethnicity 0.7% 0.7% 0.7% 0.0 ppts
MCS1 Mixed 5.1% 2.1% 2.6% -2.5 ppts
Family Characteristics
Mother Age at MCS1 (years) 25.0 29.6 32.2 7.2
Mother worked at MCS1 or MCS2 31.5% 74.1% 80.9% 49.4 ppts
Mother worked at MCS3 29.5% 70.9% 74.2% 44.7 ppts
Father worked at MCS1 or MCS2 77.8% 98.9% 99.8% 22.0 ppts
Father worked at MCS3 47.6% 82.9% 93.9% 46.2 ppts
Only English Spoken at Home 90.0% 93.9% 94.8% 4.7 ppts
Lone parent at MCS1 36.8% 6.7% 0.9% -35.9 ppts
Teenage Mother 14.3% 1.3% 0.0% -14.3 ppts
Cohabiting at MCS1 33.8% 23.1% 12.3% -21.5 ppts
Lone Parent at MCS2 42.2% 8.8% 2.0% -40.2 ppts
Cohabiting at MCS2 24.4% 16.5% 8.0% -16.5 ppts
Lone Parent at MCS3 41.4% 11.3% 3.9% -37.6 ppts
Number of Siblings at MCS3 1.59 1.30 1.14 -0.45
Number of Older Siblings at MCS3 1.09 0.85 0.62 -0.47
Family Interactions
Mother-child relationship problems (#) 0.21 0.09 0.06 -0.14
Mother-child conflict problems (#) 2.04 1.80 1.74 -0.30
Interviewer assessed measure of closeness (#) 4.78 5.24 5.40 0.62

60
Parental Harmony 1 (scale) -0.25 -0.01 0.25 0.50 sds
Parental Harmony 2 (scale) -0.24 0.00 0.25 0.49 sds
Mother spends plenty of time with child - MCS2 78.9% 62.8% 51.5% -27.3 ppts
Father spends plenty of time with child - MCS2 32.9% 19.9% 13.6% -19.3 ppts
Health and Well-Being
Tried to Breast-Feed Child 51.8% 74.0% 89.8% 38.0 ppts
Age at which breast-feeding stopped (weeks) 9.90 13.48 16.77 6.88
Still breast-feeding at MCS1 11.0% 25.2% 38.6% 27.7 ppts
Mother alcohol consumption in pregnancy (units) 0.49 0.39 0.50 0.01
Mother alcohol consumption at wave 1 (units) 2.05 2.23 3.97 1.93
Number of cigarettes smoked by Mother during pregnancy 4.55 1.15 0.29 -4.27
Number of cigarettes smoked by mother before pregnancy 8.53 3.42 1.17 -7.36
Gestation Length in Days 276.1 277.5 277.5 1.4
Birth Weight (kg) 3.25 3.40 3.45 0.20
Infant Temperament Mood - MCS1 -0.03 0.05 -0.06 -0.03 sds
Infant Temperament Regularity – MCS1 -0.33 0.10 0.19 0.52 sds
Infant Temperament Adaptability - MCS1 -0.19 0.00 0.17 0.36 sds
Mother Suffered Post-Natal Depression 21.7% 11.0% 6.5% -15.2 ppts
Mother Height at Birth (cm) 163.13 164.20 165.46 2.33
Father Height at Birth (cm) 177.04 178.30 179.77 2.73
Mother Weight at Birth (kg) 62.72 64.95 64.11 1.39
Father Weight at Birth (kg) 79.70 83.69 83.90 4.19
Father Under-Weight 1.8% 0.3% 0.3% -1.4 ppts
Father Normal-Weight 35.7% 34.1% 41.4% 5.7 ppts
Father Over-Weight 24.9% 41.7% 47.3% 22.4 ppts
Father Obese 10.2% 11.7% 9.2% -1.0 ppts
Mother Under-Weight 8.9% 3.5% 2.5% -6.5 ppts
Mother Normal-Weight 55.3% 63.4% 71.7% 16.4 ppts
Mother Over-Weight 17.8% 20.0% 17.4% -0.4 ppts
Mother Obese 9.5% 10.0% 6.0% -3.5 ppts
Childcare
Has Been to Nursery School/Class MCS2 27.0% 22.3% 23.5% -3.5 ppts
Has Been to Playgroup MCS2 24.9% 30.2% 26.0% 1.1 ppts
Has Been to Pre-School MCS2 9.5% 18.6% 18.0% 8.4 ppts
Has Been to Childminder MCS2 3.4% 7.6% 11.1% 7.7 ppts
Has Been to Day Nursery or Crèche MCS2 7.0% 11.5% 22.9% 15.9 ppts
Has Been to Nursery School/Class MCS3 66.4% 53.3% 49.2% -17.3 ppts
Has Been to Playgroup MCS3 20.7% 25.5% 21.8% 1.1 ppts
Has Been to Pre-School MCS2 13.9% 28.5% 30.4% 16.4 ppts
Has Been to Childminder MCS3 2.8% 5.5% 5.4% 2.6 ppts
Has Been to Day Nursery or Crèche MCS3 6.2% 10.4% 20.0% 13.9 ppts
Home-Learning Environment
Bottom HLE Quintile at MCS2 31.7% 23.0% 17.5% -14.2 ppts
2nd HLE Quintile at MCS2 17.8% 18.2% 16.4% -1.4 ppts
3rd HLE Quintile at MCS2 19.0% 21.2% 23.0% 4.0 ppts
4th HLE Quintile at MCS2 17.0% 16.4% 20.8% 3.8 ppts
Top HLE Quintile at MCS2 14.4% 21.2% 22.3% 7.8 ppts
Read to Everyday at MCS2 42.0% 63.7% 79.0% 36.9 ppts
Read to Some Days at MCS2 46.2% 32.6% 19.8% -26.5 ppts
Bottom HLE Quintile at MCS3 27.7% 24.4% 18.5% -9.3 ppts
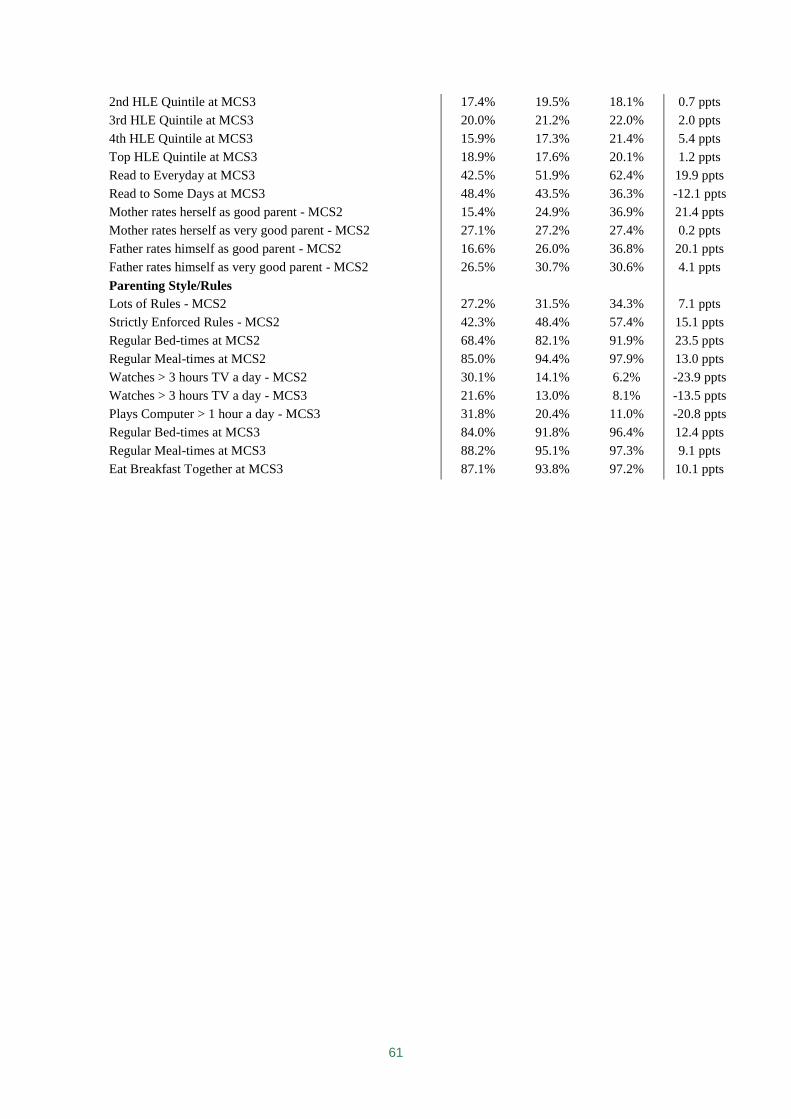
61
2nd HLE Quintile at MCS3 17.4% 19.5% 18.1% 0.7 ppts
3rd HLE Quintile at MCS3 20.0% 21.2% 22.0% 2.0 ppts
4th HLE Quintile at MCS3 15.9% 17.3% 21.4% 5.4 ppts
Top HLE Quintile at MCS3 18.9% 17.6% 20.1% 1.2 ppts
Read to Everyday at MCS3 42.5% 51.9% 62.4% 19.9 ppts
Read to Some Days at MCS3 48.4% 43.5% 36.3% -12.1 ppts
Mother rates herself as good parent - MCS2 15.4% 24.9% 36.9% 21.4 ppts
Mother rates herself as very good parent - MCS2 27.1% 27.2% 27.4% 0.2 ppts
Father rates himself as good parent - MCS2 16.6% 26.0% 36.8% 20.1 ppts
Father rates himself as very good parent - MCS2 26.5% 30.7% 30.6% 4.1 ppts
Parenting Style/Rules
Lots of Rules - MCS2 27.2% 31.5% 34.3% 7.1 ppts
Strictly Enforced Rules - MCS2 42.3% 48.4% 57.4% 15.1 ppts
Regular Bed-times at MCS2 68.4% 82.1% 91.9% 23.5 ppts
Regular Meal-times at MCS2 85.0% 94.4% 97.9% 13.0 ppts
Watches > 3 hours TV a day - MCS2 30.1% 14.1% 6.2% -23.9 ppts
Watches > 3 hours TV a day - MCS3 21.6% 13.0% 8.1% -13.5 ppts
Plays Computer > 1 hour a day - MCS3 31.8% 20.4% 11.0% -20.8 ppts
Regular Bed-times at MCS3 84.0% 91.8% 96.4% 12.4 ppts
Regular Meal-times at MCS3 88.2% 95.1% 97.3% 9.1 ppts
Eat Breakfast Together at MCS3 87.1% 93.8% 97.2% 10.1 ppts

62
Table 3 - Explaining the socio-economic gradient in cognitive ability at age 3 (BAS)
Remaining gap between bottom SEP quintile and: (1) (2) (3) (4) (5) (6) (7) (8) (9)
Middle SEP quintile 13.793*** 8.940*** 5.767*** 5.239*** 5.016*** 5.646*** 4.921*** 5.637*** 4.325***
As % of column (1) 100% 65% 42% 38% 36% 41% 36% 41% 31%
Top SEP quintile 22.723*** 14.900*** 9.629*** 8.956*** 8.609*** 9.642*** 8.347*** 9.349*** 7.645***
As % of column (1) 100% 66% 42% 39% 38% 42% 37% 41% 34%
Observations 11054 11054 11054 11054 11054 11054 11054 11054 11054
R-squared 0.08 0.1 0.22 0.22 0.22 0.22 0.24 0.22 0.25
Controls:
Parental education √ √ √ √ √ √ √ √
Family Background √ √ √ √ √ √ √
Family Interactions √ √
Health and Well-being √ √
Childcare √ √
Home-Learning Environment √ √
Parental Style/Rules √ √
Models also contain dummy variables for the second and fourth SEP quintiles (not shown).
***, **, and * indicate significance at the 1, 5 and 10% levels respectively.

63
Table 4 - Explaining socio-economic gaps in cognitive ability at age 3 (BAS)
Percentile point gap As % total gap
Q5-Q1 Q3-Q1 Q5-Q1 Q3-Q1
Raw Gap 22.72 13.79 100% 100%
Total: Explained 15.08 9.47 66% 69%
Total: Unexplained 7.64 4.33 34% 31%
Amount Explained by Groups of Factors:
Parental Education 3.68 1.97 16% 14%
Family Background 5.69 3.90 25% 28%
Gender -0.10 -0.06 0% 0%
Age of Child -1.83 -1.53 -8% -11%
Twin/Triplet 0.00 0.00 0% 0%
Special care unit after birth -0.01 0.00 0% 0%
Ethnicity 0.64 0.45 3% 3%
Only English spoken at home 0.54 0.45 2% 3%
Country of residence -0.06 0.00 0% 0%
Mother works 0.54 0.47 2% 3%
Father works 1.45 1.30 6% 9%
Mother's age at birth 3.24 2.25 14% 16%
Marital/Partner Status -0.37 -0.24 -2% -2%
Siblings 1.64 0.81 7% 6%
Family Interactions 0.88 0.70 4% 5%
Mother-child closeness 1.02 0.80 5% 6%
Parental Harmony 0.00 0.00 0% 0%
Parental time -0.14 -0.10 -1% -1%
Health and Well-Being 0.76 0.30 3% 2%
Breast-feeding 0.64 0.36 3% 3%
Alcohol consumption 0.12 0.02 1% 0%
Smoking before pregnancy -0.89 -0.60 -4% -4%
Smoking during pregnancy 0.78 0.60 3% 4%
Gestation Length -0.03 -0.04 0% 0%
Birth weight 0.58 0.44 3% 3%
Infant Temperament 0.16 -0.01 1% 0%
Maternal Depression -0.11 -0.07 0% -1%
Parental height/weight -0.49 -0.41 -2% -3%
Childcare 0.18 0.28 1% 2%
Home-Learning Environment 3.69 2.19 16% 16%
HLE and Reading at Age 3 2.72 1.66 12% 12%
Self-reported parental competence 0.97 0.53 4% 4%
Parenting Style/Rules -0.10 -0.12 0% -1%
Amount/strictness of rules 0.01 -0.01 0% 0%
Regular bed times at age 3 0.45 0.26 2% 2%
Regular meal times at age 3 -0.05 -0.04 0% 0%
Watches lots of TV at age 3 -0.51 -0.34 -2% -2%
Missing Dummies 0.30 0.26 1% 2%

Draft Interim report for JRF
64
Table 5 - Explaining socio-economic gaps in cognitive ability at age 3 (Bracken)
Percentile point gap As % total gap
Q5-Q1 Q3-Q1 Q5-Q1 Q3-Q1
Raw Gap 30.54 16.82 100% 100%
Total: Explained 21.56 12.31 71% 73%
Total: Unexplained 8.98 4.50 29% 27%
Amount Explained by Groups of Factors:
Parental Education 6.04 2.50 20% 15%
Family Background 9.05 6.23 30% 37%
Gender -0.08 -0.05 0% 0%
Age of Child -0.69 -0.57 -2% -3%
Twin/Triplet -0.02 -0.01 0% 0%
Special care unit after birth -0.01 0.00 0% 0%
Ethnicity 0.22 0.12 1% 1%
Only English spoken at home 0.32 0.26 1% 2%
Country of residence 0.03 -0.01 0% 0%
Mother works 0.46 0.40 2% 2%
Father works 1.16 1.04 4% 6%
Mother's age at birth 4.34 3.09 14% 18%
Marital/Partner Status 1.01 0.83 3% 5%
Siblings 2.30 1.13 8% 7%
Family Interactions 1.29 0.95 4% 6%
Mother-child closeness 1.00 0.78 3% 5%
Parental Harmony 0.03 0.01 0% 0%
Parental time 0.26 0.16 1% 1%
Health and Well-Being -0.60 -0.86 -2% -5%
Breast-feeding 0.92 0.46 3% 3%
Alcohol consumption 0.16 0.02 1% 0%
Smoking before pregnancy -0.87 -0.59 -3% -4%
Smoking during pregnancy 0.91 0.70 3% 4%
Gestation Length 0.08 0.08 0% 0%
Birth weight 0.16 0.12 1% 1%
Infant Temperament 0.28 0.15 1% 1%
Maternal Depression -0.22 -0.15 -1% -1%
Parental height/weight -2.02 -1.65 -7% -10%
Childcare 0.54 0.26 2% 2%
Home-Learning Environment 4.28 2.56 14% 15%
HLE and Reading at Age 3 3.13 1.98 10% 12%
Self-reported parental competence 1.15 0.58 4% 3%
Parenting Style/Rules 0.89 0.49 3% 3%
Amount/strictness of rules 0.19 0.07 1% 0%
Regular bed times at age 3 0.62 0.36 2% 2%
Regular meal times at age 3 0.20 0.15 1% 1%
Watches lots of TV at age 3 -0.12 -0.08 0% 0%
Missing Dummies 0.08 0.17 0% 1%

Child poverty and attitudes to education
Table 6 - Explaining socio-economic gaps in cognitive ability at age 5 (BAS)
No controls for prior ability Controlling for prior ability
Percentile point
gap As % total gap
Percentile point
gap As % total gap
Q5-Q1 Q3-Q1 Q5-Q1 Q3-Q1 Q5-Q1 Q3-Q1 Q5-Q1 Q3-Q1
Raw Gap 26.53 14.16 100% 100% 26.53 14.16 100% 100%
Total Explained 20.45 12.28 77% 87% 24.32 14.32 92% 101%
Total Unexplained 6.07 1.88 23% 13% 2.21 -0.16 8% -1%
Amount Explained by Groups of
Factors:
Prior Cognitive Ability 13.62 8.13 51% 57%
Prior Non-Cognitive Ability 0.27 0.18 1% 1%
Parental Education 7.00 3.21 26% 23% 4.40 2.01 17% 14%
Family Background 9.96 7.05 38% 50% 5.61 3.91 21% 28%
Gender -0.01 -0.01 0% 0% 0.04 0.02 0% 0%
Age of Child 0.01 0.05 0% 0% 0.01 0.04 0% 0%
Twin/Triplet -0.02 -0.01 0% 0% -0.01 -0.01 0% 0%
Special care unit after birth 0.00 0.00 0% 0% 0.00 0.00 0% 0%
Ethnicity 0.34 0.29 1% 2% 0.02 0.08 0% 1%
Only English spoken at home 0.62 0.51 2% 4% 0.39 0.32 1% 2%
Country of residence 0.05 0.03 0% 0% 0.08 0.04 0% 0%
Mother works 0.52 0.44 2% 3% 0.17 0.13 1% 1%
Father works 0.75 0.59 3% 4% -0.24 -0.22 -1% -2%
Mother's age at birth 4.09 2.84 15% 20% 2.56 1.77 10% 12%
Marital/Partner Status 1.52 1.23 6% 9% 1.51 1.18 6% 8%
Siblings 2.09 1.08 8% 8% 1.09 0.56 4% 4%
Family Interactions 0.82 0.64 3% 5% 0.15 0.14 1% 1%
Mother-child closeness 0.73 0.57 3% 4% 0.14 0.11 1% 1%
Parental Harmony 0.01 0.01 0% 0% -0.02 0.00 0% 0%
Parental time 0.08 0.06 0% 0% 0.03 0.03 0% 0%
Health and Well-Being -1.29 -1.15 -5% -8% -1.04 -0.83 -4% -6%
Breast-feeding 1.00 0.50 4% 4% 0.59 0.28 2% 2%
Alcohol consumption 0.16 0.07 1% 1% 0.11 0.07 0% 0%
Smoking before pregnancy -1.33 -0.90 -5% -6% -0.82 -0.56 -3% -4%
Smoking during pregnancy 0.30 0.22 1% 2% -0.04 -0.05 0% 0%
Gestation Length -0.07 -0.08 0% -1% -0.08 -0.09 0% -1%
Birth weight 0.32 0.25 1% 2% 0.13 0.10 0% 1%
Infant Temperament 0.45 0.30 2% 2% 0.29 0.23 1% 2%
Maternal Depression -0.06 -0.05 0% 0% 0.02 0.01 0% 0%
Parental height/weight -2.05 -1.46 -8% -10% -1.24 -0.82 -5% -6%
Childcare 0.44 0.29 2% 2% 0.20 0.13 1% 1%
Home-Learning Environment 2.10 1.22 8% 9% 0.17 0.02 1% 0%
HLE and Reading at Age 3 2.02 1.25 8% 9% 0.48 0.26 2% 2%
HLE and Reading at Age 5 0.04 0.03 0% 0% 0.10 0.04 0% 0%
Self-reported parental competence 0.04 -0.06 0% 0% -0.41 -0.28 -2% -2%

Draft Interim report for JRF
66
Parenting Style/Rules 1.17 0.69 4% 5% 0.85 0.50 3% 4%
Amount/strictness of rules 0.14 0.05 1% 0% 0.09 0.04 0% 0%
Regular bed times at age 3 0.28 0.16 1% 1% 0.03 0.02 0% 0%
Regular bed times at age 5 0.33 0.21 1% 1% 0.37 0.23 1% 2%
Regular meal times 0.31 0.22 1% 2% 0.07 0.05 0% 0%
Watches lots of TV/Computer 0.11 0.05 0% 0% 0.29 0.17 1% 1%
Missing Data 0.26 0.32 1% 2% 0.09 0.12 0% 1%

Child poverty and attitudes to education
Table 7 - Explaining socio-economic gaps in non-cognitive ability at age 3 (SDQ)
Percentile point gap As % total gap
Q5-Q1 Q3-Q1 Q5-Q1 Q3-Q1
Raw Gap 21.57 13.70 100% 100%
Total: Explained 17.74 10.34 82% 75%
Total: Unexplained 3.84 3.36 18% 25%
Amount Explained by Groups of Factors:
Parental Education 3.74 1.39 17% 10%
Family Background 3.36 2.33 16% 17%
Gender -0.06 -0.04 0% 0%
Age of Child -0.26 -0.22 -1% -2%
Twin/Triplet 0.02 0.01 0% 0%
Special care unit after birth -0.01 0.00 0% 0%
Ethnicity -0.22 -0.23 -1% -2%
Only English spoken at home 0.06 0.05 0% 0%
Country of residence -0.06 0.00 0% 0%
Mother works 0.18 0.15 1% 1%
Father works -0.67 -0.60 -3% -4%
Mother's age at birth 3.75 2.61 17% 19%
Marital/Partner Status 0.75 0.60 3% 4%
Siblings -0.12 0.00 -1% 0%
Family Interactions 3.05 2.30 14% 17%
Mother-child closeness 2.65 2.13 12% 16%
Parental Harmony 0.57 0.27 3% 2%
Parental time -0.17 -0.11 -1% -1%
Health and Well-Being 3.73 2.22 17% 16%
Breast-feeding 1.36 0.67 6% 5%
Alcohol consumption 0.07 0.01 0% 0%
Smoking before pregnancy 0.41 0.29 2% 2%
Smoking during pregnancy 0.75 0.59 3% 4%
Gestation Length 0.02 0.01 0% 0%
Birth weight 0.22 0.17 1% 1%
Infant Temperament 1.01 0.80 5% 6%
Maternal Depression 0.30 0.21 1% 2%
Parental height/weight -0.40 -0.53 -2% -4%
Childcare 0.13 -0.10 1% -1%
Home-Learning Environment 1.88 1.01 9% 7%
HLE and Reading at Age 3 0.70 0.43 3% 3%
Self-reported parental competence 1.18 0.58 5% 4%
Parenting Style/Rules 1.97 1.24 9% 9%
Amount/strictness of rules 0.21 0.08 1% 1%
Regular bed times at age 3 0.61 0.36 3% 3%
Regular meal times at age 3 0.53 0.38 2% 3%
Watches lots of TV at age 3 0.62 0.42 3% 3%
Missing Dummies -0.14 -0.06 -1% 0%

Draft Interim report for JRF
68
Table 8 - Explaining socio-economic gaps in non-cognitive ability at age 5 (SDQ)
Levels „Value-added‟
Percentile point
gap As % total gap
Percentile point
gap As % total gap
Q5-Q1 Q3-Q1 Q5-Q1 Q3-Q1 Q5-Q1 Q3-Q1 Q5-Q1 Q3-Q1
Raw Gap 23.40 14.37 100% 100% 23.40 14.37 100% 100%
Total Explained 19.04 12.09 81% 84% 21.05 13.79 90% 96%
Total Unexplained 4.37 2.28 19% 16% 2.36 0.58 10% 4%
Amount Explained by Groups of
Factors:
Prior Cognitive Ability 1.99 1.17 9% 8%
Prior Non-Cognitive Ability 9.17 6.21 39% 43%
Parental Education 4.90 2.55 21% 18% 3.32 1.96 14% 14%
Family Background 4.59 3.32 20% 23% 2.07 1.47 9% 10%
Gender -0.08 -0.05 0% 0% -0.05 -0.03 0% 0%
Age of Child -0.03 -0.15 0% -1% -0.03 -0.15 0% -1%
Twin/Triplet 0.02 0.01 0% 0% 0.03 0.01 0% 0%
Special care unit after birth -0.01 0.00 0% 0% 0.00 0.00 0% 0%
Ethnicity 0.24 0.12 1% 1% 0.31 0.22 1% 2%
Only English spoken at home 0.02 0.02 0% 0% -0.03 -0.03 0% 0%
Country of residence 0.01 0.01 0% 0% 0.04 0.01 0% 0%
Mother works 0.69 0.65 3% 5% 0.49 0.47 2% 3%
Father works 0.59 0.39 3% 3% 0.54 0.37 2% 3%
Mother's age at birth 1.82 1.10 8% 8% -0.01 -0.19 0% -1%
Marital/Partner Status 1.69 1.35 7% 9% 1.29 1.02 6% 7%
Siblings -0.38 -0.13 -2% -1% -0.51 -0.23 -2% -2%
Family Interactions 2.47 1.66 11% 12% 0.96 0.54 4% 4%
Mother-child closeness 1.55 1.25 7% 9% 0.30 0.25 1% 2%
Parental Harmony 1.40 0.68 6% 5% 1.11 0.54 5% 4%
Parental time -0.48 -0.27 -2% -2% -0.45 -0.25 -2% -2%
Health and Well-Being 1.81 0.97 8% 7% 0.38 0.15 2% 1%
Breast-feeding 0.84 0.39 4% 3% 0.17 0.06 1% 0%
Alcohol consumption -0.13 -0.07 -1% -1% -0.16 -0.08 -1% -1%
Smoking before pregnancy 0.76 0.53 3% 4% 0.75 0.51 3% 4%
Smoking during pregnancy 0.06 0.05 0% 0% -0.35 -0.27 -1% -2%
Gestation Length 0.04 0.04 0% 0% 0.04 0.03 0% 0%
Birth weight 0.27 0.21 1% 1% 0.16 0.13 1% 1%
Infant Temperament 0.91 0.71 4% 5% 0.47 0.38 2% 3%
Maternal Depression 0.56 0.40 2% 3% 0.40 0.28 2% 2%
Parental height/weight -1.51 -1.28 -6% -9% -1.10 -0.89 -5% -6%
Childcare -0.27 -0.14 -1% -1% -0.44 -0.18 -2% -1%
Home-Learning Environment 2.34 1.26 10% 9% 1.52 0.83 7% 6%
HLE and Reading at Age 3 0.49 0.35 2% 2% 0.03 0.05 0% 0%
HLE and Reading at Age 5 0.39 0.12 2% 1% 0.46 0.18 2% 1%
Self-reported parental competence 1.47 0.80 6% 6% 1.03 0.59 4% 4%

Child poverty and attitudes to education
Parenting Style/Rules 2.21 1.51 9% 11% 1.20 0.85 5% 6%
Amount/strictness of rules -0.03 -0.02 0% 0% -0.08 -0.04 0% 0%
Regular bed times at age 3 0.17 0.10 1% 1% -0.05 -0.03 0% 0%
Regular bed times at age 5 0.68 0.43 3% 3% 0.57 0.36 2% 3%
Regular meal times 1.01 0.73 4% 5% 0.58 0.41 2% 3%
Watches lots of TV/Computer 0.37 0.27 2% 2% 0.19 0.15 1% 1%
Missing Data 1.00 0.95 4% 7% 0.85 0.80 4% 6%

Draft Interim report for JRF
70
Table 9 – Full Specification Regression Results for BAS, Bracken and SDQ (age 3,
MCS2)
BAS Bracken SDQ
SEP Quintile
2nd SEP quintile 0.979 2.302** 1.601*
3rd SEP quintile 4.325*** 4.501*** 3.359***
4th SEP quintile 6.244*** 8.332*** 3.865***
Top SEP quintile 7.645*** 8.976*** 3.837***
Parental Education
Mother NVQ level 1 1.874 1.443 1.99
Mother NVQ level 2 3.332*** 2.628** 1.469
Mother NVQ level 3 3.324*** 2.497** 2.120*
Mother NVQ level 4/5 5.423*** 5.130*** 4.910***
Mother, Other Qualifications 0.891 2.977 5.024
Father NVQ level 1 -0.103 0.682 -2.072
Father NVQ level 2 0.556 -0.33 -0.519
Father NVQ level 3 1.179 2.787** 0.462
Father NVQ level 4/5 1.47 4.907*** 1.548
Father Other Qualifications 7.862** -15.179** -20.649
Child Characteristics
Male Child -6.572*** -4.842*** -3.974***
Child's Age (months/100) 2.613*** 0.978*** 0.378***
Multiple Birth -0.722 -3.434 2.465
Special Care Unit -1.801 -1.437 -0.903
MCS1 Indian Child -5.079* 0.795 -3.409
MCS1 Pakistani Child -8.867*** -5.373*** 0.019
MCS1 Bangladeshi Child -11.380*** -5.453 4.744
MCS1 Black Caribbean Child -8.142*** -4.408* -0.625
MCS1 Black African/Other Child -3.47 2.749 6.307**
MCS1 Other Ethnicity Child -9.801*** 6.944* 4.702
MCS1 Mixed Ethnicity Child -0.575 2.518 1.523
Family Characteristics
Only English at Home 11.444*** 6.809*** 1.332
Lives in Wales 0.72 -0.999 1.462**
Lives in Scotland 4.608*** 2.704** 0.629
Lives in Northern Ireland 4.924*** -2.522* 4.032***
Mother worked at one of waves 1.1 0.932 0.363
Father worked at one of waves 3.279** 2.620** -1.504
Mother's Age at birth 1.280*** 2.131*** 1.538***
Mother's Age at birth squared -0.015* -0.028*** -0.019**
Lone Parent at MCS1 1.325 -1.959 -2.576
Had baby in teens 0.17 0.737 -0.322
Two Cohabiting Parents at MCS1 1.396* 0.358 0.007
Got Married by MCS2 -0.271 -0.026 -2.140*
Split up by MCS2 -2.200* -0.959 0.414
New partner by MCS2 -1.456 -3.820** 1.907
Number of Siblings at MCS2 0.221 0.469 -1.337**
Number of Older Siblings at MCS2 -3.699*** -5.339*** 1.525**
Family Interactions
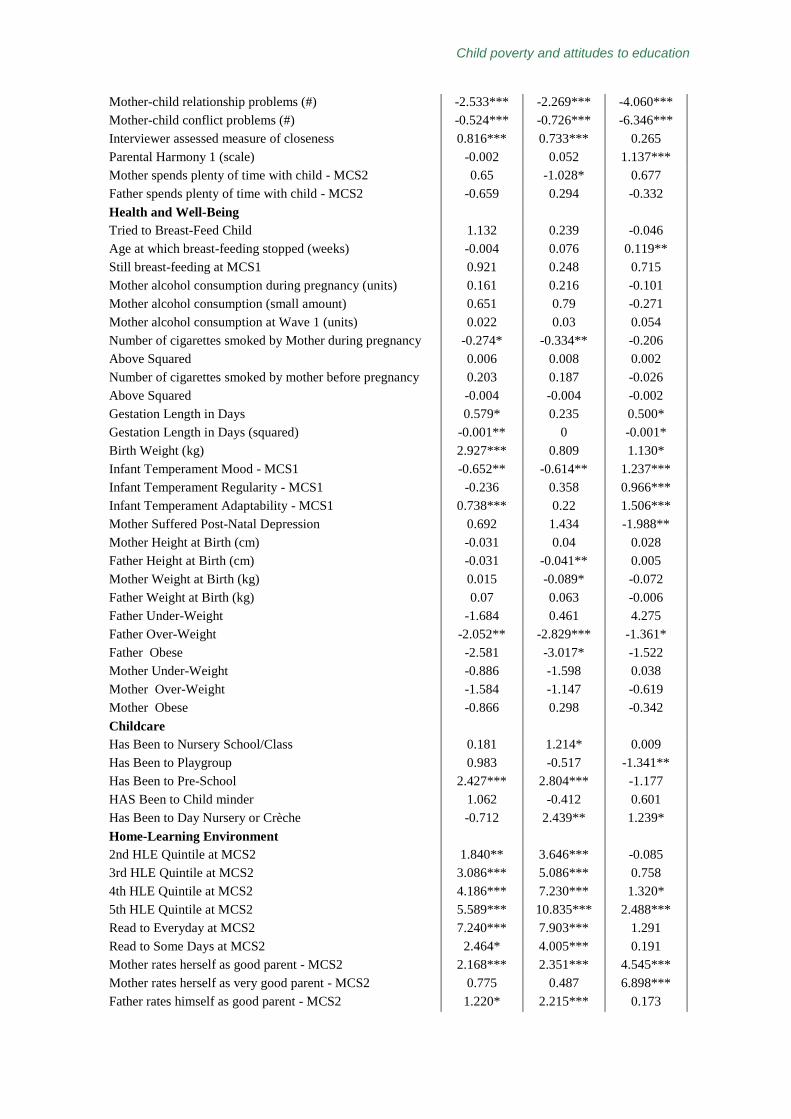
Child poverty and attitudes to education
Mother-child relationship problems (#) -2.533*** -2.269*** -4.060***
Mother-child conflict problems (#) -0.524*** -0.726*** -6.346***
Interviewer assessed measure of closeness 0.816*** 0.733*** 0.265
Parental Harmony 1 (scale) -0.002 0.052 1.137***
Mother spends plenty of time with child - MCS2 0.65 -1.028* 0.677
Father spends plenty of time with child - MCS2 -0.659 0.294 -0.332
Health and Well-Being
Tried to Breast-Feed Child 1.132 0.239 -0.046
Age at which breast-feeding stopped (weeks) -0.004 0.076 0.119**
Still breast-feeding at MCS1 0.921 0.248 0.715
Mother alcohol consumption during pregnancy (units) 0.161 0.216 -0.101
Mother alcohol consumption (small amount) 0.651 0.79 -0.271
Mother alcohol consumption at Wave 1 (units) 0.022 0.03 0.054
Number of cigarettes smoked by Mother during pregnancy -0.274* -0.334** -0.206
Above Squared 0.006 0.008 0.002
Number of cigarettes smoked by mother before pregnancy 0.203 0.187 -0.026
Above Squared -0.004 -0.004 -0.002
Gestation Length in Days 0.579* 0.235 0.500*
Gestation Length in Days (squared) -0.001** 0 -0.001*
Birth Weight (kg) 2.927*** 0.809 1.130*
Infant Temperament Mood - MCS1 -0.652** -0.614** 1.237***
Infant Temperament Regularity - MCS1 -0.236 0.358 0.966***
Infant Temperament Adaptability - MCS1 0.738*** 0.22 1.506***
Mother Suffered Post-Natal Depression 0.692 1.434 -1.988**
Mother Height at Birth (cm) -0.031 0.04 0.028
Father Height at Birth (cm) -0.031 -0.041** 0.005
Mother Weight at Birth (kg) 0.015 -0.089* -0.072
Father Weight at Birth (kg) 0.07 0.063 -0.006
Father Under-Weight -1.684 0.461 4.275
Father Over-Weight -2.052** -2.829*** -1.361*
Father Obese -2.581 -3.017* -1.522
Mother Under-Weight -0.886 -1.598 0.038
Mother Over-Weight -1.584 -1.147 -0.619
Mother Obese -0.866 0.298 -0.342
Childcare
Has Been to Nursery School/Class 0.181 1.214* 0.009
Has Been to Playgroup 0.983 -0.517 -1.341**
Has Been to Pre-School 2.427*** 2.804*** -1.177
HAS Been to Child minder 1.062 -0.412 0.601
Has Been to Day Nursery or Crèche -0.712 2.439** 1.239*
Home-Learning Environment
2nd HLE Quintile at MCS2 1.840** 3.646*** -0.085
3rd HLE Quintile at MCS2 3.086*** 5.086*** 0.758
4th HLE Quintile at MCS2 4.186*** 7.230*** 1.320*
5th HLE Quintile at MCS2 5.589*** 10.835*** 2.488***
Read to Everyday at MCS2 7.240*** 7.903*** 1.291
Read to Some Days at MCS2 2.464* 4.005*** 0.191
Mother rates herself as good parent - MCS2 2.168*** 2.351*** 4.545***
Mother rates herself as very good parent - MCS2 0.775 0.487 6.898***
Father rates himself as good parent - MCS2 1.220* 2.215*** 0.173

Draft Interim report for JRF
72
Father rates himself as very good parent - MCS2 1.217* 0.35 0.974
Parenting Style/Rules
Lots of Rules -0.813 -0.434 -0.049
Strictly Enforced Rules 0.446 1.431*** 1.421**
Regular Bed-times at MCS2 1.906*** 2.654*** 2.603***
Regular Meal-times at MCS2 -0.398 1.549 4.062***
Watches more than 3 hours of TV per day at MCS2 2.119*** 0.519 -2.603***
Observations 11054 11054 11054
R-Squared 0.25 0.29 0.36

Child poverty and attitudes to education
Table 10 – Full Specification Regression Results for BAS and SDQ (age 5, MCS3)
Levels Value-Added
BAS SDQ BAS SDQ
Prior Ability
Bracken (age 3) n/a n/a 6.816*** 1.308***
BAS (age 3) n/a n/a 7.989*** 0.753**
SDQ (age 3) n/a n/a 0.339 11.373***
SEP Quintile
2nd SEP quintile 0.727 0.119 -0.17 0.428
3rd SEP quintile 1.878* -0.08 -0.163 0.578
4th SEP quintile 4.079*** 0.917 0.6 0.324
Top SEP quintile 6.074*** 2.327* 2.206* 2.357*
Parental Education
Mother NVQ level 1 1.405 0.877 0.522 2.568**
Mother NVQ level 2 2.474** 1.662* 0.89 3.255***
Mother NVQ level 3 2.024 1.42 0.308 3.636***
Mother NVQ level 4/5 5.825*** 4.221*** 2.910*** 4.870***
Mother, Other Qualifications 1.43 0.982 1.144 4.53
Father NVQ level 1 1.399 0.363 1.024 1.211
Father NVQ level 2 2.001* 1.104 1.946* 1.657*
Father NVQ level 3 3.648*** 2.055** 2.833*** 1.211
Father NVQ level 4/5 5.618*** 3.449*** 4.016*** 1.912**
Father Other Qualifications -10.874 -8.906 -9.171 -3.993
Child Characteristics
Male Child -0.562 -5.108*** 2.430*** -3.097***
Child's Age (months/100) -0.551* 1.732*** -0.470* 1.758***
Multiple Birth -3.677 3.329 -2.267 5.054**
Special Care Unit -0.401 -0.814 0.115 -0.088
MCS1 Indian Child 1.732 -2.743 2.979 -1.31
MCS1 Pakistani Child -3.271 -6.404*** 2.082 -5.488**
MCS1 Bangladeshi Child -0.508 0.024 6.233 -1.243
MCS1 Black Caribbean Child -6.457** -6.211** -2.596 -6.042***
MCS1 Black African/Other Child -5.712** 3.539 -5.534** 0.177
MCS1 Other Ethnicity Child -3.139 -2.012 -1.781 -3.801
MCS1 Mixed Ethnicity Child -0.402 0.268 -0.99 -0.615
Family Characteristics
Mother's Age at birth 1.658*** -0.138 0.950** -0.965**
Mother's Age at birth squared -0.020*** 0.007 -0.011* 0.018**
Only English at Home 13.165*** 0.407 8.142*** -0.677
Lives in Wales -2.831*** -0.684 -3.492*** -1.470***
Lives in Scotland 2.800** 0.055 0.346 -0.585
Lives in Northern Ireland 0.942 0.183 -0.654 -1.374
Mother worked at one of waves 1.238 -0.411 0.807 -0.481
Mother worked at wave 3 0.983 1.538* -0.513 1.195
Father worked at one of waves 0.353 -0.771 -0.601 -0.422
Father worked at Wave 3 -0.198 1.994*** 0.037 1.625**
Lone Parent at MCS1 -2.825 -3.363 -2.581 -2.224
Had baby in teens 0.114 -1.163 -0.418 -0.769
Two Cohabiting Parents at MCS1 -0.969 -0.555 -1.582** -0.668

Draft Interim report for JRF
74
Got Married by MCS2 1.276 -1.234 1.223 -0.371
Split up by MCS2 -1.957 0.28 -2.690* 0.264
New partner by MCS2 0.383 0.54 1.923 0.327
Split up by MCS3 -1.849 -2.485 -0.203 -2.249
New partner by MCS3 1.122 -0.841 0.205 -1.641
Number of Siblings at MCS3 -0.455 -0.859 -0.226 -0.403
Number of Older Siblings at MCS3 -4.006*** 1.632*** -2.103*** 1.482***
Family Interactions
Mother-child relationship problems (#) 10.636** 2.306 7.174* 4.37
Mother-child conflict problems (#) -0.546 -7.477** 1.357 -6.195**
Interviewer assessed measure of closeness 1.977 3.894 2.559 2.633
Parental Harmony 1 (scale) -2.856*** -2.196*** -1.408*** 0.147
Parental Harmony 2 (scale) -0.143 -4.007*** 0.271 -1.370***
Mother spends plenty of time with child - MCS2 -3.455* -2.179 -3.215* -2.089
Father spends plenty of time with child - MCS2 -0.214 1.311 -1.006 -1.407
Health and Well-Being
Tried to Breast-Feed Child 0.332 -0.585 -0.047 -0.764
Age at which breast-feeding stopped (weeks) 0.082 0.105* 0.068 0.043
Still breast-feeding at MCS1 0.206 0.051 -0.251 0.107
Mother alcohol consumption during pregnancy (units) -0.014 0.239 -0.117 0.232*
Mother alcohol consumption (small amount) 1.688*** -1.108* 1.387** -1.227**
Mother alcohol consumption at Wave 1 (units) -0.023 0.003 -0.028 -0.008
Number of cigarettes smoked by Mother during pregnancy -0.2 0.01 -0.082 0.134
Number of cigarettes smoked by mother before pregnancy 0.276** -0.094 0.165 -0.123
Gestation Length in Days 0.493 0.352 0.22 0.177
Gestation Length in Days (squared) -0.001* -0.001 -0.001 0
Birth Weight (kg) 1.632** 1.390** 0.653 0.831
Infant Temperament Mood - MCS1 -0.372 0.724*** -0.126 0.315
Infant Temperament Regularity - MCS1 0.578** 1.052*** 0.523** 0.619**
Infant Temperament Adaptability - MCS1 0.366 1.053*** 0.041 0.442*
Mother Suffered Post-Natal Depression 0.426 -3.710*** -0.131 -2.634***
Mother Height at Birth (cm) 0.016 0.032 0.006 0.038
Father Height at Birth (cm) -0.033* -0.028 -0.009 -0.026
Mother Weight at Birth (kg) -0.023 -0.084* -0.002 -0.063
Father Weight at Birth (kg) 0.042 0.038 0.001 0.035
Father Under-Weight 2.339 3.714 2.596 2.221
Father Over-Weight -2.450*** -1.341 -1.119 -0.62
Father Obese -0.782 -2.459* 0.889 -1.474
Mother Under-Weight -0.489 -1.865 0.536 -1.727
Mother Over-Weight -0.158 -1.575* 0.208 -1.131
Mother Obese 1.292 0.603 1.303 1.236
Childcare
Has Been to Nursery School/Class (MCS2) -0.408 -0.278 -2.104*** -1.073*
Has Been to Playgroup (MCS2) -1.469* -1.684** -2.175*** -1.234*
Has Been to Pre-School (MCS2) -0.859 -0.017 -2.173** 0.306
Has Been to Childminder (MCS2) 1.706 -1.081 1.049 -1.207
Has Been to Day Nursery or Crèche (MCS2) 1.622 -0.015 0.393 -0.608
Has Been to Nursery School/Class (MCS3) -1.178 0.816 -0.165 1.444**
Has Been to Playgroup (MCS3) 1.258 1.824** 2.028** 1.775**
Has Been to Pre-School (MCS3) 0.707 0.171 0.743 -0.018
Child poverty and attitudes to education
Has Been to Childminder (MCS3) 1.777 0.441 2.653* 0.513
Has Been to Day Nursery or Crèche (MCS3) -1.866 -0.679 -0.391 -0.56
Home-Learning Environment
2nd HLE Quintile at MCS2 1.177 1.311 -0.455 1.254
3rd HLE Quintile at MCS2 1.389 -0.123 -0.713 -0.509
4th HLE Quintile at MCS2 2.311** 0.688 -0.644 0.014
5th HLE Quintile at MCS2 3.822*** 1.714* -0.553 0.476
Read to Everyday at MCS2 5.420*** 1.918 0.747 0.426
Read to Some Days at MCS2 1.533 1.35 -1.11 0.482
2nd HLE Quintile at MCS3 0.318 0.446 0.775 0.641
3rd HLE Quintile at MCS3 0.498 1.292 1.119 1.249
4th HLE Quintile at MCS3 -1.246 2.157** -0.779 1.649*
5th HLE Quintile at MCS3 -0.087 2.763*** 1.291 2.184**
Read to Everyday at MCS3 -0.178 1.668 -0.112 2.580**
Read to Some Days at MCS3 -1.094 1.031 -1.003 1.635
Mother rates herself as good parent - MCS3 1.365* 4.152*** 0.17 2.436***
Mother rates herself as very good parent - MCS3 -1.434* 5.259*** -2.031*** 2.991***
Father rates himself as good parent - MCS3 -0.367 0.956 -0.981 0.848
Father rates himself as very good parent - MCS3 -1.046 2.089*** -1.218* 1.874***
Parenting Style/Rules
Lots of Rules - MCS2 -0.347 -0.458 -0.06 -0.234
Strictly Enforced Rules - MCS2 1.117* 0.039 0.631 -0.443
Regular Bed-times at MCS2 1.186 0.716 0.139 -0.225
Regular Meal-times at MCS2 0.852 2.646*** 0.264 0.585
Watches > 3 hours TV a day - MCS2 0.375 -1.938** -0.196 -1.182
Watches > 3 hours TV a day - MCS3 0.211 -1.326 -0.045 -0.881
Plays Computer > 1 hour a day - MCS3 -1.092 1.300** -1.149* 1.013*
Regular Bed-times at MCS3 2.643** 5.530*** 2.979*** 4.621***
Regular Meal-times at MCS3 1.09 3.475*** 0.101 2.381**
Eat Breakfast Together at MCS3 1.019 3.501*** 0.247 2.816***
Observations 11054 11054 11054 11054
R-Squared 0.21 0.36 0.29 0.4

Draft Interim report for JRF
76
Table 11 – Mediation of other characteristics (BAS, MCS2)
(1)
Education &
Family
Background
Only
(2)
(1) plus
Family
Interactions
(3)
(1) plus
Health &
well-being
(4)
(1) plus
Childcare
(5)
(1) plus
HLE
(6)
(1) plus
Parenting
Style/Rules
(7)
All
Controls
SEP Quintile
2nd SEP quintile 2.066** 1.610* 1.564* 2.017** 1.503* 1.951** 0.979
3rd SEP quintile 5.767*** 5.239*** 5.016*** 5.646*** 4.921*** 5.637*** 4.325***
4th SEP quintile 7.867*** 7.280*** 7.054*** 7.802*** 6.778*** 7.664*** 6.244***
Top SEP quintile 9.629*** 8.956*** 8.609*** 9.642*** 8.347*** 9.349*** 7.645***
Parental Education
Mother NVQ level 1 3.155** 2.813** 2.578** 2.998** 2.721** 3.031** 1.874
Mother NVQ level 2 5.677*** 4.972*** 4.647*** 5.471*** 4.625*** 5.413*** 3.332***
Mother NVQ level 3 6.748*** 5.916*** 5.323*** 6.547*** 4.956*** 6.380*** 3.324***
Mother NVQ level 4/5 9.220*** 8.620*** 7.481*** 9.047*** 7.004*** 8.804*** 5.423***
Mother, Other Quals. 2.955 2.642 2.562 2.926 1.662 2.919 0.891
Father NVQ level 1 0.211 -0.109 0.874 0.069 -0.393 0.217 -0.103
Father NVQ level 2 0.645 0.466 1.079 0.464 0.371 0.563 0.556
Father NVQ level 3 1.679 1.525 1.966* 1.55 0.991 1.475 1.179
Father NVQ level 4/5 2.770*** 2.556*** 2.639** 2.681*** 1.617* 2.559*** 1.47
Father Other Quals. 5.975* 5.225 6.651* 6.404* 7.678*** 7.058** 7.862**
Child Characteristics
Male Child -6.944*** -6.749*** -7.448*** -6.881*** -6.188*** -6.953*** -6.572***
Child's Age (months) 2.591*** 2.611*** 2.607*** 2.555*** 2.617*** 2.584*** 2.613***
Multiple Birth -4.562** -4.039* -2.091 -4.605** -2.781 -4.859** -0.722
Special Care Unit -3.532*** -3.353*** -2.071* -3.551*** -3.362*** -3.518*** -1.801
Indian Child -8.613*** -8.108*** -6.909** -8.164*** -7.186*** -8.224*** -5.079*
Pakistani Child -12.068*** -11.213*** -10.275*** -11.547*** -11.358*** -11.642*** -8.867***
Bangladeshi Child -16.046*** -15.226*** -14.432*** -15.454*** -13.891*** -15.699*** -11.380***
Black Caribbean Child -6.990** -6.645* -7.078** -6.446* -4.428 -6.073* -3.47
Black African Child -10.554*** -10.222*** -10.047*** -10.153*** -9.378*** -10.093*** -8.142***
Other Ethnicity Child -11.919*** -11.256*** -10.945*** -11.486*** -11.050*** -11.737*** -9.801***
Mixed Ethnicity Child -1.438 -1.572 -1.207 -1.244 -1.044 -1.228 -0.575
Family Characteristics
Only English at Home 12.651*** 11.773*** 12.851*** 12.667*** 11.996*** 12.530*** 11.444***
Mother worked (MCS1/ 2) 0.674 0.882 0.788 0.749 0.84 0.686 1.1
Father worked (MCS1/ 2) 4.548*** 3.853*** 3.776*** 4.391*** 4.391*** 4.496*** 3.279**
Mother's Age at birth 1.345*** 1.311*** 1.365*** 1.278** 1.288*** 1.299*** 1.280***
Mother's Age at birth Sq -0.016* -0.015* -0.017* -0.015* -0.015* -0.015* -0.015*
Lone Parent (MCS1) 2.274 1.551 1.315 2.328 2.623 2.117 1.325
Had baby in teens 0.262 0.799 0.148 0.101 0.081 0.257 0.17
Cohabiting Parents (MCS1) 1.126 1.269 1.326 1.198 1.189 1.257 1.396*
Siblings (MCS2) -0.087 0.178 -0.188 -0.145 0.195 -0.218 0.221
Older Siblings (MCS2) -4.047*** -4.327*** -3.928*** -3.969*** -3.644*** -3.846*** -3.699***
Observations 11054 11054 11054 11054 11054 11054 11054
R-squared 0.22 0.22 0.22 0.22 0.24 0.22 0.25
***, **, and * indicate significance at the 1, 5 and 10% levels respectively.

Child poverty and attitudes to education
Table 12 – Mediation of other characteristics (Bracken, MCS2)
(1)
Education &
Family
Background
Only
(2)
(1) plus
Family
Interactions
(3)
(1) plus
Health &
well-being
(4)
(1) plus
Childcare
(5)
(1) plus
HLE
(6)
(1) plus
Parenting
Style/Rules
(7)
All
Controls
SEP Quintile
2nd SEP quintile 3.590*** 3.071*** 3.009*** 3.601*** 2.974*** 3.236*** 2.302**
3rd SEP quintile 6.533*** 5.800*** 5.613*** 6.391*** 5.601*** 5.966*** 4.501***
4th SEP quintile 10.771*** 9.869*** 9.816*** 10.580*** 9.609*** 10.013*** 8.332***
Top SEP quintile 12.055*** 10.953*** 10.864*** 11.729*** 10.739*** 11.142*** 8.976***
Parental Education
Mother NVQ level 1 2.944** 2.603** 2.259* 2.775** 2.306* 2.772** 1.443
Mother NVQ level 2 5.512*** 4.754*** 4.294*** 5.375*** 4.085*** 4.889*** 2.628**
Mother NVQ level 3 6.931*** 6.035*** 5.172*** 6.786*** 4.477*** 6.050*** 2.497**
Mother NVQ level 4/5 10.583*** 9.892*** 8.160*** 10.317*** 7.631*** 9.523*** 5.130***
Mother, Other Quals. 4.732 4.376 4.43 4.76 3.158 4.936 2.977
Father NVQ level 1 0.007 -0.413 2.026 -0.104 -0.904 0.004 0.682
Father NVQ level 2 -1.397 -1.565 0.35 -1.483 -1.892** -1.534 -0.33
Father NVQ level 3 2.320** 2.240** 3.907*** 2.201** 1.304 1.958* 2.787**
Father NVQ level 4/5 5.599*** 5.539*** 6.549*** 5.502*** 3.918*** 5.154*** 4.907***
Father Other Quals. -20.200** -20.936** -17.645* -19.696** -17.663*** -18.464** -15.179**
Child Characteristics
Male Child -6.116*** -5.884*** -6.212*** -6.037*** -4.913*** -6.107*** -4.842***
Child's Age (months) 1.021*** 1.022*** 1.032*** 0.948*** 1.053*** 1.002*** 0.978***
Multiple Birth -7.266*** -6.730*** -5.206** -7.269*** -5.140** -7.323*** -3.434
Special Care Unit -3.582*** -3.431*** -1.723* -3.608*** -3.333*** -3.571*** -1.437
Indian Child -1.66 -1.427 -0.982 -1.302 -0.035 -0.757 0.795
Pakistani Child -7.945*** -7.205*** -6.791*** -7.751*** -7.032*** -6.894*** -5.373***
Bangladeshi Child -9.584** -8.790** -9.456** -9.255** -6.584* -8.518** -5.453
Black Caribbean Child -1.495 -1.365 -1.611 -1.463 2.035 0.204 2.749
Black African Child -6.782** -6.638** -6.230** -6.651** -5.351* -6.276** -4.408*
Other Ethnicity Child 5.106 5.74 5.395 5.335 6.238* 5.959 6.944*
Mixed Ethnicity Child 2.188 1.949 1.97 2.366 2.593 2.398 2.518
Family Characteristics
Only English at Home 7.408*** 6.562*** 8.141*** 7.332*** 6.631*** 7.416*** 6.809***
Mother worked (MCS1/ 2) 1.114* 0.799 1.342** 0.943 1.301** 1.107* 0.932
Father worked (MCS1/ 2) 3.456** 3.047** 2.711* 3.406** 3.343** 3.265** 2.620**
Mother's Age at birth 2.201*** 2.176*** 2.309*** 2.116*** 2.117*** 2.100*** 2.131***
Mother's Age at birth Sq -0.029*** -0.029*** -0.031*** -0.028*** -0.028*** -0.027*** -0.028***
Lone Parent (MCS1) 0.893 0.559 -1.648 0.691 1.171 0.438 -1.959
Had baby in teens 0.826 1.388 0.789 0.753 0.5 0.961 0.737
Cohabiting Parents (MCS1) 0.392 0.519 0.324 0.416 0.434 0.597 0.358
Siblings (MCS2) 0.155 0.493 -0.044 0.072 0.525 0.029 0.469
Older Siblings (MCS2) -5.968*** -6.377*** -5.549*** -5.803*** -5.518*** -5.752*** -5.339***
Observations 11054 11054 11054 11054 11054 11054 11054
R-squared 0.23 0.24 0.25 0.24 0.27 0.24 0.29
***, **, and * indicate significance at the 1, 5 and 10% levels respectively.

Draft Interim report for JRF
78
Table 13 – Mediation of other characteristics (SDQ, MCS2)
(1)
Education &
Family
Background
Only
(2)
(1) plus
Family
Interactions
(3)
(1) plus
Health &
well-being
(4)
(1) plus
Childcare
(5)
(1) plus
HLE
(6)
(1) plus
Parenting
Style/Rules
(7)
All
Controls
SEP Quintile
2nd SEP quintile 5.206*** 2.935*** 3.464*** 5.271*** 4.375*** 4.546*** 1.601*
3rd SEP quintile 8.558*** 5.521*** 5.440*** 8.624*** 7.666*** 7.396*** 3.359***
4th SEP quintile 10.671*** 6.875*** 6.893*** 10.740*** 9.167*** 9.169*** 3.865***
Top SEP quintile 12.645*** 7.437*** 8.298*** 12.635*** 10.792*** 10.947*** 3.837***
Parental Education
Mother NVQ level 1 1.304 2.167 1.18 1.408 1.116 1.103 1.99
Mother NVQ level 2 2.078 2.744** 0.904 2.227* 1.43 1.122 1.469
Mother NVQ level 3 3.321** 4.281*** 1.676 3.504** 2.195 1.972 2.120*
Mother NVQ level 4/5 6.003*** 7.994*** 3.930*** 6.181*** 4.713*** 4.334*** 4.910***
Mother, Other Quals. 6.089* 4.93 6.070* 6.132* 5.536 6.438* 5.024
Father NVQ level 1 -1.086 -2.394 -0.811 -0.994 -1.506 -1.158 -2.072
Father NVQ level 2 0.102 -0.651 0.004 0.228 -0.178 -0.042 -0.519
Father NVQ level 3 1.361 0.688 1.273 1.456 0.721 0.922 0.462
Father NVQ level 4/5 2.545** 2.502*** 1.776 2.616** 2.056** 1.908* 1.548
Father Other Quals. -15.065 -21.802 -19.318 -15.226 -10.257 -12.804 -20.649
Child Characteristics
Male Child -4.810*** -4.179*** -4.919*** -4.839*** -4.003*** -4.753*** -3.974***
Child's Age (months) 0.468*** 0.389*** 0.477*** 0.463*** 0.461*** 0.440*** 0.378***
Multiple Birth -1.438 -2.455 1.009 -1.384 4.196* -1.498 2.465
Special Care Unit -3.409*** -2.465*** -1.28 -3.416*** -3.112*** -3.422*** -0.903
Indian Child -1.532 -4.517* -0.446 -1.809 -1.048 -0.264 -3.409
Pakistani Child -0.54 -0.776 0.619 -0.861 -0.406 0.966 0.019
Bangladeshi Child 6.47 5.834 5.38 6.088 5.718 8.148* 4.744
Black Caribbean Child 10.012** 5.734* 8.821** 9.643** 9.861** 12.626*** 6.307**
Black African Child 0.628 -1.1 1.618 0.358 0.332 1.389 -0.625
Other Ethnicity Child 4.666 4.684 5.1 4.39 4.534 6.235* 4.702
Mixed Ethnicity Child 2.361 1.122 2.62 2.222 2.994* 2.536 1.523
Family Characteristics
Only English at Home -1.048 0.638 -0.509 -1.045 -2.115 -0.853 1.332
Mother worked (MCS1/ 2) 0.787 0.377 0.659 0.802 0.926 0.727 0.363
Father worked (MCS1/ 2) 0.399 -0.827 -1.111 0.531 -0.018 0.045 -1.504
Mother's Age at birth 1.318** 1.459*** 1.363*** 1.338** 1.350** 1.184** 1.538***
Mother's Age at birth Sq -0.016* -0.017** -0.017* -0.016* -0.017* -0.013 -0.019**
Lone Parent (MCS1) -1.356 -2.133 -1.419 -1.313 -0.952 -2.128 -2.576
Had baby in teens -2.639 -0.461 -2.058 -2.553 -2.863 -2.319 -0.322
Cohabiting Parents (MCS1) -1.636* -0.135 -0.712 -1.664* -1.613* -1.365 0.007
Siblings (MCS2) -1.443** -1.127* -1.913*** -1.417** -1.248* -1.447** -1.337**
Older Siblings (MCS2) 2.104*** 0.716 2.881*** 2.070*** 2.386*** 2.246*** 1.525**
Observations 11054 11054 11054 11054 11054 11054 11054
R-squared 0.11 0.32 0.16 0.11 0.15 0.12 0.36
***, **, and * indicate significance at the 1, 5 and 10% levels respectively.

Child poverty and attitudes to education
Table 14 – Mediation of the effect of other characteristics (BAS, MCS3)
(1)
Education &
Family
Background
Only
(2)
(1) plus
Family
Interactions
(3)
(1) plus
Health &
well-being
(4)
(1) plus
Childcare
(5)
(1) plus
HLE
(6)
(1) plus
Parenting
Style/Rules
(7)
All
Controls
SEP Quintile
2nd SEP quintile 1.603* 1.308 1.314 1.491 1.302 1.228 0.727
3rd SEP quintile 3.041*** 2.616** 2.805** 2.871*** 2.444** 2.467** 1.878*
4th SEP quintile 5.492*** 4.977*** 5.301*** 5.222*** 4.838*** 4.685*** 4.079***
Top SEP quintile 7.580*** 7.032*** 7.334*** 7.341*** 6.863*** 6.652*** 6.074***
Parental Education
Mother NVQ level 1 2.650** 2.042 2.148 2.636** 2.312* 2.345* 1.405
Mother NVQ level 2 4.908*** 3.952*** 3.993*** 4.802*** 4.044*** 4.249*** 2.474**
Mother NVQ level 3 5.615*** 4.505*** 4.330*** 5.378*** 4.137*** 4.706*** 2.024
Mother NVQ level 4/5 10.120*** 9.124*** 8.469*** 9.743*** 8.238*** 9.061*** 5.825***
Mother, Other Quals. 2.615 2.368 2.707 2.6 1.465 2.572 1.43
Father NVQ level 1 0.434 0.163 2.034 0.472 0.062 0.456 1.399
Father NVQ level 2 0.589 0.465 2.291** 0.565 0.493 0.475 2.001*
Father NVQ level 3 2.645** 2.578** 4.220*** 2.566** 2.277** 2.342** 3.648***
Father NVQ level 4/5 5.511*** 5.395*** 6.616*** 5.432*** 4.609*** 5.159*** 5.618***
Father Other Quals. -13.081 -12.678 -11.12 -14.297 -11.465 -12.841 -10.874
Child Characteristics
Male Child -0.972 -0.811 -1.235** -0.941 -0.482 -0.833 -0.562
Child's Age (months) -0.568* -0.504 -0.602* -0.635** -0.587* -0.513 -0.551*
Multiple Birth -5.484*** -5.172* -4.439** -5.501*** -4.587** -5.703*** -3.677
Special Care Unit -0.895 -0.81 -0.534 -0.896 -0.739 -0.848 -0.401
Indian Child -2.105 -1.459 -0.649 -1.861 -0.406 -1.213 1.732
Pakistani Child -7.248*** -6.255*** -5.097** -6.856*** -6.709*** -6.222*** -3.271
Bangladeshi Child -4.945 -3.97 -3.718 -4.437 -3.277 -4 -0.508
Black Caribbean Child -9.998*** -9.240*** -9.937*** -9.795*** -7.473*** -8.231*** -5.712**
Black African Child -9.377*** -8.803*** -9.205*** -9.075*** -7.810*** -8.536*** -6.457**
Other Ethnicity Child -6.252* -5.341 -5.083 -5.847* -5.480* -5.42 -3.139
Mixed Ethnicity Child -1.027 -1.078 -1.224 -0.763 -0.743 -0.691 -0.402
Family Characteristics
Only English at Home 14.227*** 13.154*** 14.448*** 14.105*** 13.818*** 14.313*** 13.165***
Mother worked (MCS1/ 2) 1.399 1.208 1.573* 1.154 1.546* 1.366 1.238
Father worked (MCS1/ 2) -0.012 -0.202 0.703 0.599 0.803 0.59 0.983
Mother worked (MC3) 1.266 0.766 0.848 1.037 1.092 1.099 0.353
Mother worked (MC3) 0.619 0.711 -0.008 -0.111 0.024 -0.006 -0.198
Mother's Age at birth 1.801*** 1.771*** 1.712*** 1.840*** 1.722*** 1.728*** 1.658***
Mother's Age at birth Sq -0.022*** -0.022*** -0.021*** -0.023*** -0.021*** -0.021*** -0.020***
Lone Parent (MCS1) 0.489 -0.078 -1.933 0.204 0.006 0.358 -2.825
Had baby in teens -0.117 0.11 0.029 -0.097 -0.211 -0.117 0.114
Cohabiting Parents (MCS1) -0.969 -0.944 -1.09 -0.976 -0.882 -0.757 -0.969
Siblings (MCS3) -0.447 -0.323 -0.552 -0.464 -0.319 -0.633 -0.455
Older Siblings (MCS3) -4.453*** -4.581*** -4.336*** -4.481*** -4.064*** -4.132*** -4.006***
Observations 11054 11054 11054 11054 11054 11054 11054
R-squared 0.18 0.19 0.19 0.19 0.2 0.19 0.21
***, **, and * indicate significance at the 1, 5 and 10% levels respectively.

Draft Interim report for JRF
80
Table 15 – Mediation of other characteristics (SDQ, MCS3)
(1)
Education &
Family
Background
Only
(2)
(1) plus
Family
Interactions
(3)
(1) plus
Health &
well-being
(4)
(1) plus
Childcare
(5)
(1) plus
HLE
(6)
(1) plus
Parenting
Style/Rules
(7)
All
Controls
SEP Quintile
2nd SEP quintile 4.565*** 2.773*** 2.988*** 4.610*** 3.586*** 3.827*** 1.418
3rd SEP quintile 6.902*** 4.523*** 4.059*** 7.003*** 5.843*** 5.533*** 2.282**
4th SEP quintile 8.374*** 5.355*** 5.136*** 8.528*** 6.684*** 6.513*** 2.451**
Top SEP quintile 11.793*** 7.616*** 7.968*** 12.058*** 9.607*** 9.887*** 4.365***
Parental Education
Mother NVQ level 1 4.075*** 3.910*** 3.721*** 4.148*** 3.995*** 3.346** 3.348***
Mother NVQ level 2 6.084*** 5.876*** 4.883*** 6.128*** 5.285*** 4.562*** 4.125***
Mother NVQ level 3 7.312*** 7.227*** 5.806*** 7.459*** 6.000*** 5.380*** 4.761***
Mother NVQ level 4/5 9.623*** 10.363*** 7.610*** 9.884*** 8.028*** 7.511*** 7.072***
Mother, Other Quals. 7.035** 6.426** 7.541** 7.030** 6.431** 7.430** 6.890**
Father NVQ level 1 -0.368 -1.24 1.056 -0.383 -0.983 -0.369 0.083
Father NVQ level 2 0.892 0.11 1.958 0.907 0.591 0.602 1.233
Father NVQ level 3 1.278 0.488 2.273* 1.43 0.623 0.681 1.318
Father NVQ level 4/5 2.495** 2.194** 3.037*** 2.616** 1.925* 1.708* 2.481**
Father Other Quals. -11.156 -12.137 -12.149* -11.275 -8.694 -11.852 -11.919*
Child Characteristics
Male Child -5.441*** -5.101*** -5.538*** -5.495*** -4.815*** -5.499*** -5.108***
Child's Age (months) 1.717*** 1.814*** 1.700*** 1.673*** 1.706*** 1.732*** 1.732***
Multiple Birth 0.565 -0.086 3.15 0.438 5.756** 0.05 3.329
Special Care Unit -3.494*** -2.617*** -1.288 -3.530*** -3.204*** -3.459*** -0.814
Indian Child -3.474 -3.901 -2.232 -3.717 -2.844 -2.112 -2.743
Pakistani Child -9.310*** -7.854*** -7.691*** -9.445*** -8.823*** -7.544*** -6.404***
Bangladeshi Child -1.789 -1.025 -1.365 -1.819 -2.124 0.249 0.024
Black Caribbean Child -7.779** -8.187*** -6.079** -7.691** -7.844*** -6.694** -6.211**
Black African Child 3.502 1.502 3.306 3.634 3.304 6.669* 3.539
Other Ethnicity Child -4.288 -1.803 -3.94 -4.333 -4.559 -2.384 -2.012
Mixed Ethnicity Child -0.485 -0.379 0.007 -0.625 0.226 -0.131 0.268
Family Characteristics
Only English at Home 0.201 -0.114 0.314 0.13 -0.841 0.746 0.407
Mother worked (MCS1/ 2) -0.348 -0.514 -0.296 -0.092 -0.401 -0.444 -0.411
Father worked (MCS1/ 2) 2.019*** 1.932*** 2.332** 2.200** 2.535*** 1.975*** 1.994***
Mother's Age at birth 0.654 -0.036 -0.96 0.656 0.544 0.42 -0.771
Mother's Age at birth Sq 2.235** 1.462 1.573** 2.130*** 2.070** 2.169** 1.538*
Lone Parent (MCS1) -0.353 -0.122 -0.407 -0.375 -0.38 -0.402 -0.138
Had baby in teens 0.01 0.007 0.01 0.01 0.01 0.011 0.007
Cohabiting Parents (MCS1) -1.732 -2.899 -3.174 -1.389 -0.973 -1.774 -3.363
Siblings (MCS2) -2.349 -0.89 -1.877 -2.335 -2.965 -2.121 -1.163
Older Siblings (MCS2) -2.364** -0.69 -1.649* -2.243** -2.391*** -1.986** -0.555
Observations 11054 11054 11054 11054 11054 11054 11054
R-squared 0.13 0.25 0.17 0.13 0.17 0.15 0.29
***, **, and * indicate significance at the 1, 5 and 10% levels respectively.

Child poverty and attitudes to education
Table16 –Mediation of the effect of other characteristics (BAS value added, MCS3)
(1)
Education,
Family
Background
and Prior
Ability Only
(2)
(1) plus
Family
Interactions
(3)
(1) plus
Health &
well-being
(4)
(1) plus
Childcare
(5)
(1) plus
HLE
(6)
(1) plus
Parenting
Style/Rules
(7)
All
Controls
BAS Score (Age 3) 8.042*** 7.983*** 8.004*** 8.128*** 7.995*** 8.028*** 7.989***
Bracken (Age 3) 6.926*** 6.893*** 6.861*** 6.953*** 6.849*** 6.872*** 6.816***
SDQ Score (Age 3) 0.112 0.437 0.115 0.116 0.215 -0.017 0.339
SEP Quintile
2nd SEP quintile 0.135 0.071 0.129 0.011 0.119 -0.056 -0.17
3rd SEP quintile 0.063 -0.071 0.266 -0.032 -0.08 -0.21 -0.163
4th SEP quintile 1.006 0.838 1.256 0.754 0.917 0.61 0.6
Top SEP quintile 2.425** 2.314* 2.744** 2.263* 2.327* 1.967 2.206*
Parental Education
Mother NVQ level 1 0.834 0.488 0.727 0.895 0.877 0.665 0.522
Mother NVQ level 2 1.809* 1.329 1.544 1.728* 1.662* 1.484 0.89
Mother NVQ level 3 1.76 1.197 1.363 1.542 1.42 1.287 0.308
Mother NVQ level 4/5 4.721*** 4.114*** 4.207*** 4.387*** 4.221*** 4.190*** 2.910***
Mother, Other Quals. 1.391 1.277 1.582 1.431 0.982 1.284 1.144
Father NVQ level 1 0.362 0.351 1.064 0.441 0.363 0.331 1.024
Father NVQ level 2 0.999 0.986 1.917* 1.023 1.104 0.928 1.946*
Father NVQ level 3 1.996** 1.991** 2.880*** 2.004** 2.055** 1.853** 2.833***
Father NVQ level 4/5 3.648*** 3.601*** 4.287*** 3.626*** 3.449*** 3.485*** 4.016***
Father Other Quals. -9.146 -8.327 -7.995 -10.845 -8.906 -9.453 -9.171
Child Characteristics
Male Child 2.456*** 2.518*** 2.342*** 2.457*** 2.420*** 2.549*** 2.430***
Child's Age (months) -0.473* -0.468 -0.497* -0.564** -0.446 -0.424 -0.470*
Multiple Birth -2.282 -1.3 -2.585 -2.35 -2.635 -2.417 -2.267
Special Care Unit 0.709 0.724 0.062 0.764 0.756 0.714 0.115
Indian Child 0.883 1.35 1.562 0.833 1.765 1.401 2.979
Pakistani Child 0.077 0.582 1.232 0.183 0.188 0.473 2.082
Bangladeshi Child 4.478 4.879 4.903 4.743 4.95 4.809 6.233
Black Caribbean Child -7.604*** -7.141*** -7.752*** -7.580*** -6.531*** -6.562*** -5.534**
Black African Child -4.282* -3.934 -4.567* -4.098 -3.292 -3.718 -2.596
Other Ethnicity Child -3.603 -3.113 -2.982 -3.317 -3.313 -3.206 -1.781
Mixed Ethnicity Child -1.277 -1.217 -1.52 -1.158 -1.182 -1.061 -0.99
Family Characteristics
Only English at Home 8.579*** 8.127*** 8.728*** 8.368*** 8.603*** 8.663*** 8.142***
Mother worked (MCS1/ 2) 0.985 0.844 1.07 0.733 1.114 0.958 0.807
Father worked (MCS1/ 2) -0.453 -0.193 -0.229 -0.539 -0.453 -0.433 -0.513
Mother worked (MC3) -0.346 -0.46 -0.292 -0.617 -0.359 -0.403 -0.601
Mother worked (MC3) -0.299 -0.552 -0.396 -0.305 -0.146 -0.294 0.037
Mother's Age at birth 1.053*** 1.006** 0.964** 1.139*** 0.993** 1.041*** 0.950**
Mother's Age at birth Sq -0.013** -0.012* -0.011* -0.014** -0.012* -0.012* -0.011*
Lone Parent (MCS1) -0.576 -0.815 -1.662 -0.936 -1.082 -0.613 -2.581
Had baby in teens -0.606 -0.65 -0.45 -0.579 -0.578 -0.603 -0.418
Cohabiting Parents (MCS1) -1.531** -1.572** -1.637** -1.555** -1.498** -1.435* -1.582**

Draft Interim report for JRF
82
Siblings (MCS3) -0.231 -0.162 -0.252 -0.206 -0.192 -0.344 -0.226
Older Siblings (MCS3) -2.154*** -2.199*** -2.196*** -2.264*** -2.037*** -1.955*** -2.103***
Observations 11054 11054 11054 11054 11054 11054 11054
R-squared 0.34 0.34 0.35 0.35 0.35 0.34 0.36
***, **, and * indicate significance at the 1, 5 and 10% levels respectively.

Child poverty and attitudes to education
Table 17–Mediation of the effect of other characteristics (SDQ value added, MCS3)
(1)
Education,
Family
Background
and Prior
Ability Only
(2)
(1) plus
Family
Interactions
(3)
(1) plus
Health &
well-being
(4)
(1) plus
Childcare
(5)
(1) plus
HLE
(6)
(1) plus
Parenting
Style/Rules
(7)
All
Controls
BAS Score (Age 3) 0.841** 0.771** 0.827** 0.860** 0.712** 0.870*** 0.753**
Bracken (Age 3) 1.554*** 1.523*** 1.472*** 1.618*** 1.370*** 1.424*** 1.308***
SDQ Score (Age 3) 13.848*** 12.083*** 13.184*** 13.850*** 13.196*** 13.576*** 11.373***
SEP Quintile
2nd SEP quintile 1.486* 1.088 0.942 1.495* 1.086 1.229 0.428
3rd SEP quintile 2.064** 1.616* 1.004 2.167** 1.714* 1.54 0.578
4th SEP quintile 2.307** 1.659* 1.205 2.430** 1.686 1.566 0.324
Top SEP quintile 4.806*** 3.778*** 3.461*** 5.106*** 3.926*** 4.126*** 2.357*
Parental Education
Mother NVQ level 1 3.020** 2.858** 2.875** 3.053** 3.070*** 2.605** 2.568**
Mother NVQ level 2 4.056*** 4.070*** 3.670*** 4.029*** 3.822*** 3.348*** 3.255***
Mother NVQ level 3 4.565*** 4.703*** 4.145*** 4.621*** 4.168*** 3.687*** 3.636***
Mother NVQ level 4/5 5.610*** 6.222*** 5.013*** 5.777*** 5.142*** 4.738*** 4.870***
Mother, Other Quals. 3.685 3.921 4.332 3.686 3.564 3.941 4.53
Father NVQ level 1 0.755 0.314 1.626 0.686 0.408 0.748 1.211
Father NVQ level 2 1.296 0.796 2.075** 1.264 1.14 1.122 1.657*
Father NVQ level 3 0.85 0.354 1.647 0.978 0.584 0.568 1.211
Father NVQ level 4/5 1.388 1.201 2.090** 1.492* 1.246 1.053 1.912**
Father Other Quals. -3.634 -2.725 -3.518 -3.757 -3.775 -5.203 -3.993
Child Characteristics
Male Child -2.524*** -2.840*** -2.691*** -2.561*** -2.492*** -2.678*** -3.097***
Child's Age (months) 1.753*** 1.810*** 1.759*** 1.694*** 1.760*** 1.741*** 1.758***
Multiple Birth 1.804 3.536 3.097 1.641 4.304** 1.459 5.054**
Special Care Unit -1.334* -1.141 -0.31 -1.331* -1.273* -1.359* -0.088
Indian Child -2.292 -1.619 -1.741 -2.508 -2.124 -1.699 -1.31
Pakistani Child -7.394*** -6.089** -6.537*** -7.489*** -7.320*** -6.722*** -5.488**
Bangladeshi Child -3.715 -2.294 -2.731 -3.657 -3.902 -2.878 -1.243
Black Caribbean Child -1.496 -1.142 -0.957 -1.245 -1.74 -0.012 0.177
Black African Child -7.754*** -7.534*** -6.537*** -7.595*** -7.799*** -7.296*** -6.042***
Other Ethnicity Child -6.399 -3.529 -6.099 -6.367 -6.636* -5.478 -3.801
Mixed Ethnicity Child -1.97 -1.124 -1.47 -2.087 -1.513 -1.77 -0.615
Family Characteristics
Only English at Home -0.035 -0.89 -0.204 -0.129 -0.487 0.297 -0.677
Mother worked (MCS1/ 2) -0.643 -0.598 -0.618 -0.402 -0.677 -0.69 -0.481
Father worked (MCS1/ 2) 1.446* 1.171 1.089* 1.385** 1.388 1.265** 1.195
Mother worked (MC3) 0.067 -0.006 -0.663 -0.018 0.13 0.043 -0.422
Mother worked (MC3) 1.269** 1.478** 1.496* 1.405 1.638** 1.452* 1.625**
Mother's Age at birth 1.053*** 1.006** 0.964** 1.139*** 0.993** 1.041*** 0.950**
Mother's Age at birth Sq -0.013** -0.012* -0.011* -0.014** -0.012* -0.012* -0.011*
Lone Parent (MCS1) -0.576 -0.815 -1.662 -0.936 -1.082 -0.613 -2.581
Had baby in teens -0.606 -0.65 -0.45 -0.579 -0.578 -0.603 -0.418
Cohabiting Parents (MCS1) -1.531** -1.572** -1.637** -1.555** -1.498** -1.435* -1.582**
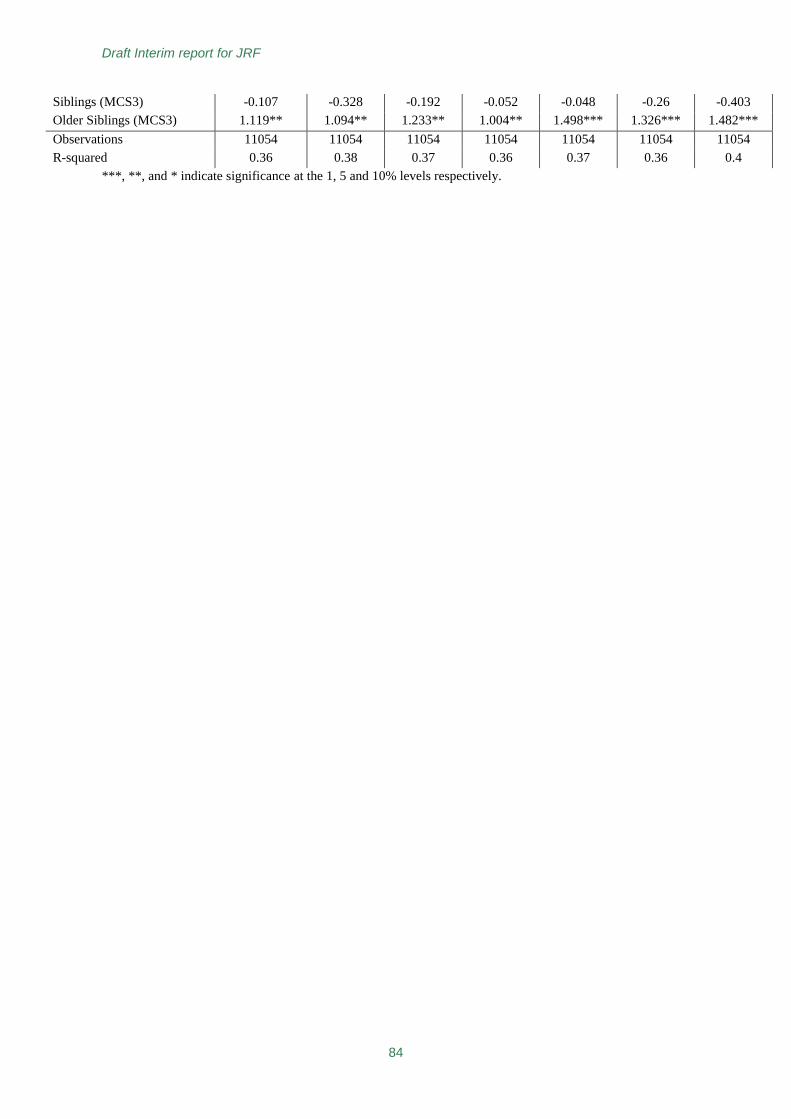
Draft Interim report for JRF
84
Siblings (MCS3) -0.107 -0.328 -0.192 -0.052 -0.048 -0.26 -0.403
Older Siblings (MCS3) 1.119** 1.094** 1.233** 1.004** 1.498*** 1.326*** 1.482***
Observations 11054 11054 11054 11054 11054 11054 11054
R-squared 0.36 0.38 0.37 0.36 0.37 0.36 0.4
***, **, and * indicate significance at the 1, 5 and 10% levels respectively.

Child poverty and attitudes to education
Table 18–Determinants of Mediating Factors at age 3
Large Family
(3+ siblings)
Mother’s
age at birth
Mother-
child
relationship
problems
Highest
HLE
Quintile at
age 3
Parents
reads
every day
at age 3
Regular
bed
times at
age 3
SEP Quintile
2nd SEP quintile -0.100*** 1.786*** -0.020** 0.025 0.063*** 0.034***
3rd SEP quintile -0.181*** 3.155*** -0.033*** 0.036** 0.123*** 0.054***
4th SEP quintile -0.229*** 3.910*** -0.045*** 0.03 0.154*** 0.087***
Top SEP quintile -0.269*** 4.680*** -0.041*** 0.005 0.177*** 0.106***
Parental Education
Mother NVQ level 1 -0.069*** -0.923*** -0.009 0.028 0.041 0.030*
Mother NVQ level 2 -0.091*** -0.678*** -0.027*** 0.041** 0.098*** 0.053***
Mother NVQ level 3 -0.130*** -1.729*** -0.031*** 0.104*** 0.156*** 0.080***
Mother NVQ level 4/5 -0.146*** 0.014 -0.032*** 0.107*** 0.228*** 0.114***
Mother, Other Quals. -0.058 1.728*** -0.017 0.046 0.194*** -0.007
Father NVQ level 1 -0.003 -1.872*** -0.012 0.037 0.043 -0.007
Father NVQ level 2 -0.013 -0.492** 0.008 0.019 -0.003 0.004
Father NVQ level 3 0.001 -0.802*** 0.002 0.037** 0.049** 0.046***
Father NVQ level 4/5 0.011 -0.052 -0.006 0.055*** 0.115*** 0.066***
Father Other Quals. -0.153 -2.397 0 -0.105 0.12 -0.105
Child Characteristics
Male Child 0.005 0.018 0.021*** -0.088*** -0.033*** 0
Multiple Birth -0.059** 1.870*** -0.013 -0.055** -0.049 0.110***
Special Care Unit -0.045*** 0.193 0.012 -0.002 0.012 0.006
Indian Child 0.048 -1.559*** -0.037* 0.016 -0.249*** -0.109***
Pakistani Child 0.199*** -2.624*** 0.031 0.036 -0.082* -0.068*
Bangladeshi Child 0.268*** -2.362*** 0.052 -0.045 -0.212*** -0.086
Black Caribbean Child 0.036 2.091*** -0.001 -0.051 -0.204*** -0.125***
Black African Child 0.071 3.437*** 0.025 -0.107*** -0.360*** -0.242***
Other Ethnicity Child -0.026 0.597 -0.021 0.066 -0.117* -0.061
Mixed Ethnicity Child 0.009 0.472 -0.016 -0.011 -0.046 -0.031
Family Characteristics
Only English at Home 0.029 -0.044 0.014 0.013 0.047 0.027
Mother's Age at birth 0.074*** 0 0.001 -0.011 0.006
Mother's Age at birth Sq -0.001*** 0 0 0 0
Lone Parent (MCS1) -0.078*** -0.953*** -0.008 0.050** 0.028 -0.003
Had baby in teens -0.047 -9.125*** 0.031 0.021 0.013 -0.016
Cohabiting Parents (MCS1) -0.060*** -2.502*** -0.002 0.01 0 -0.038***
Observations 11054 11054 11054 11054 11054 11054
***, **, and * indicate significance at the 1, 5 and 10% levels respectively.
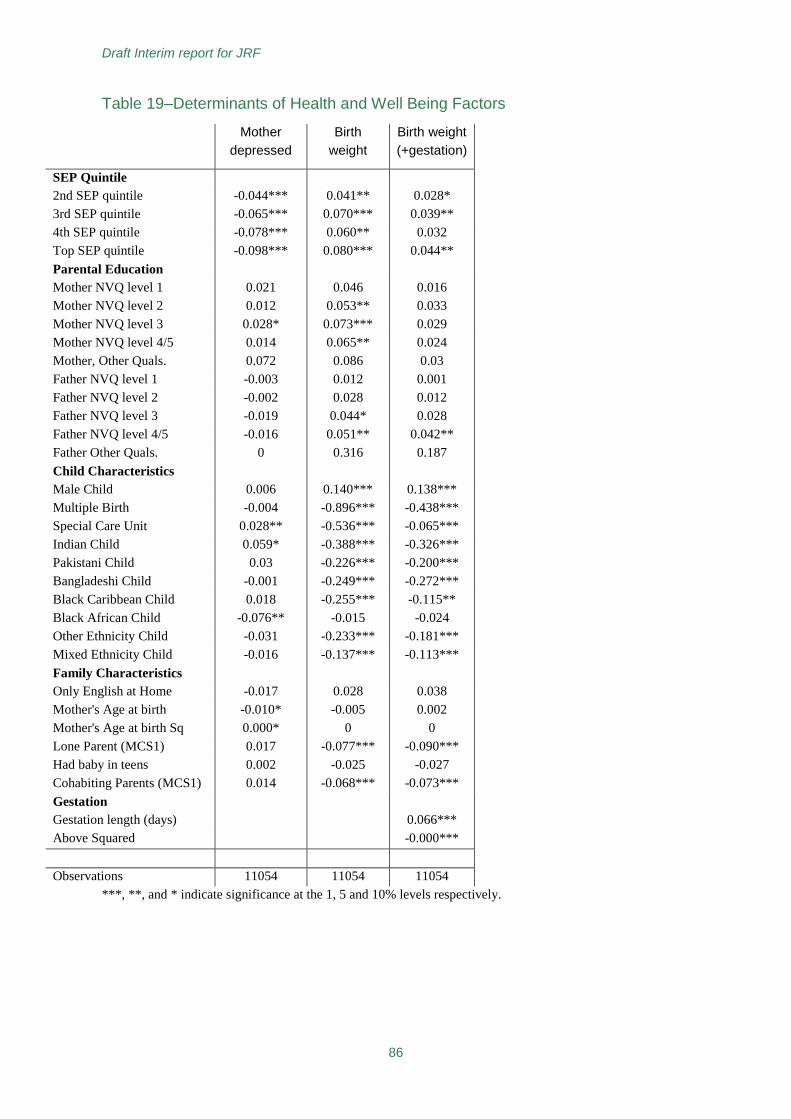
Draft Interim report for JRF
86
Table 19–Determinants of Health and Well Being Factors
Mother
depressed
Birth
weight
Birth weight
(+gestation)
SEP Quintile
2nd SEP quintile -0.044*** 0.041** 0.028*
3rd SEP quintile -0.065*** 0.070*** 0.039**
4th SEP quintile -0.078*** 0.060** 0.032
Top SEP quintile -0.098*** 0.080*** 0.044**
Parental Education
Mother NVQ level 1 0.021 0.046 0.016
Mother NVQ level 2 0.012 0.053** 0.033
Mother NVQ level 3 0.028* 0.073*** 0.029
Mother NVQ level 4/5 0.014 0.065** 0.024
Mother, Other Quals. 0.072 0.086 0.03
Father NVQ level 1 -0.003 0.012 0.001
Father NVQ level 2 -0.002 0.028 0.012
Father NVQ level 3 -0.019 0.044* 0.028
Father NVQ level 4/5 -0.016 0.051** 0.042**
Father Other Quals. 0 0.316 0.187
Child Characteristics
Male Child 0.006 0.140*** 0.138***
Multiple Birth -0.004 -0.896*** -0.438***
Special Care Unit 0.028** -0.536*** -0.065***
Indian Child 0.059* -0.388*** -0.326***
Pakistani Child 0.03 -0.226*** -0.200***
Bangladeshi Child -0.001 -0.249*** -0.272***
Black Caribbean Child 0.018 -0.255*** -0.115**
Black African Child -0.076** -0.015 -0.024
Other Ethnicity Child -0.031 -0.233*** -0.181***
Mixed Ethnicity Child -0.016 -0.137*** -0.113***
Family Characteristics
Only English at Home -0.017 0.028 0.038
Mother's Age at birth -0.010* -0.005 0.002
Mother's Age at birth Sq 0.000* 0 0
Lone Parent (MCS1) 0.017 -0.077*** -0.090***
Had baby in teens 0.002 -0.025 -0.027
Cohabiting Parents (MCS1) 0.014 -0.068*** -0.073***
Gestation
Gestation length (days) 0.066***
Above Squared -0.000***
Observations 11054 11054 11054
***, **, and * indicate significance at the 1, 5 and 10% levels respectively.