The Society of Thoracic Surgeons Risk Model for Operative ... · The Society of Thoracic Surgeons...
32
1 ATS-2012-350140-R1 The Society of Thoracic Surgeons Risk Model for Operative Mortality after Multiple Valve Surgery J. Scott Rankin MD 1 , Xia He MS 2 , Sean M. O’Brien PhD 2 , Jeffrey P. Jacobs MD 3 , Karl F. Welke MD 4 , Giovanni Filardo PhD MPH 5 , Cynthia M. Shewan PhD 6 , David M. Shahian MD 7 1 Centennial Medical Center, Vanderbilt University, Nashville, TN 2 Duke Clinical Research Institute, Durham, NC 3 The Congenital Heart Institute of Florida (CHIF), All Children’s Hospital, University of South Florida, Tampa, FL 4 Seattle Children's Hospital and the University of Washington School of Medicine, Seattle, WA 5 Inst.forHealth Care Research and Improvement, Baylor Health Care System, Dallas, TX 6 The Society of Thoracic Surgeons, Chicago, IL 7 Massachusetts General Hospital, Harvard Medical School, Boston, MA Running Head: Multiple Valve Risk Model Keywords: Cardiac Valve Surgery; Statistical Risk Modeling; Outcome Assessment Abstract Word Count = 250 Text Word Count = 3,247 Table I + Figure 1 Word Count (minus Appendix Tables) = 1,085 Total Word Count = 4,332 Tables + Figures = 2 Appendix Tables A, B, C, D, and E are available on the STS website and also can be downloaded from: http://www.jsrmd.com/ftp/Final_MUV_Model.pdf Address correspondence to: J. Scott Rankin MD, (615) 969-1543, [email protected]
Transcript of The Society of Thoracic Surgeons Risk Model for Operative ... · The Society of Thoracic Surgeons...
1
ATS-2012-350140-R1
The Society of Thoracic Surgeons Risk Model for Operative Mortality after Multiple Valve Surgery
J. Scott Rankin MD1, Xia He MS2, Sean M. O’Brien PhD2, Jeffrey P. Jacobs MD3, Karl F. Welke MD4, Giovanni Filardo PhD MPH5,
Cynthia M. Shewan PhD6, David M. Shahian MD7
1Centennial Medical Center, Vanderbilt University, Nashville, TN 2Duke Clinical Research Institute, Durham, NC 3The Congenital Heart Institute of Florida (CHIF), All Children’s Hospital, University of South Florida, Tampa, FL 4Seattle Children's Hospital and the University of Washington School of Medicine, Seattle, WA 5Inst.forHealth Care Research and Improvement, Baylor Health Care System, Dallas, TX 6 The Society of Thoracic Surgeons, Chicago, IL 7Massachusetts General Hospital, Harvard Medical School, Boston, MA Running Head: Multiple Valve Risk Model Keywords: Cardiac Valve Surgery; Statistical Risk Modeling; Outcome Assessment Abstract Word Count = 250 Text Word Count = 3,247 Table I + Figure 1 Word Count (minus Appendix Tables) = 1,085 Total Word Count = 4,332 Tables + Figures = 2 Appendix Tables A, B, C, D, and E are available on the STS website and also can be downloaded from: http://www.jsrmd.com/ftp/Final_MUV_Model.pdf Address correspondence to: J. Scott Rankin MD, (615) 969-1543, [email protected]
2
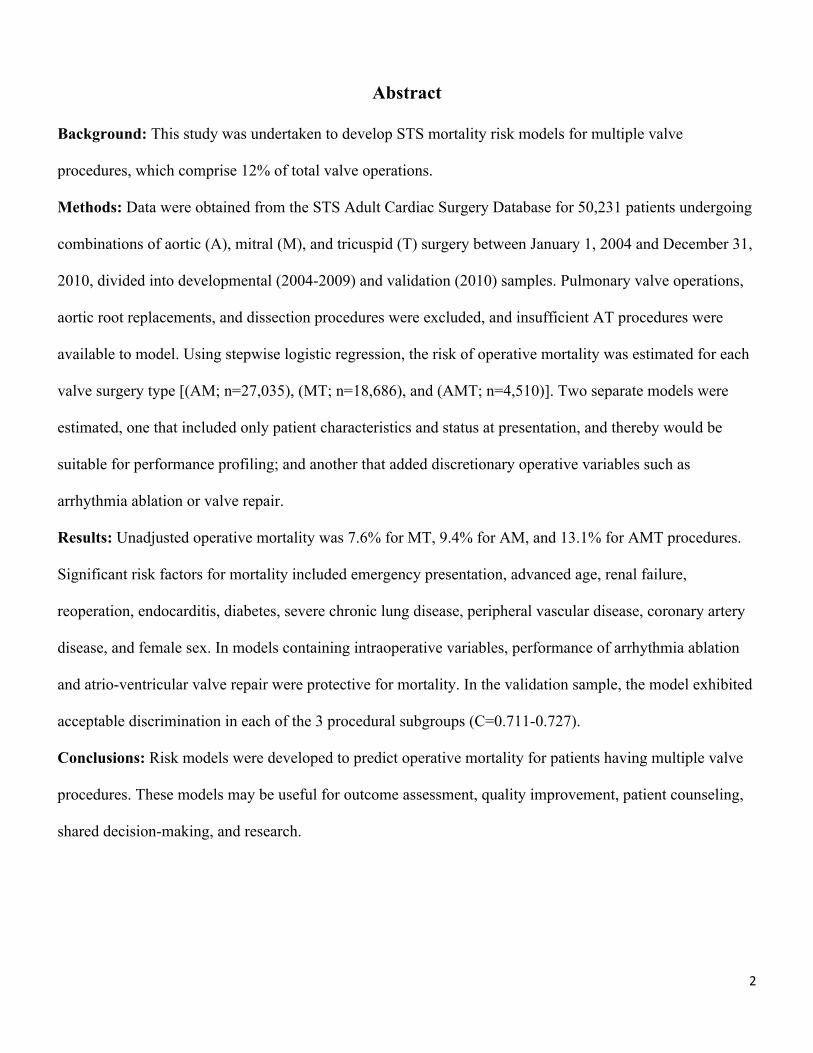
Abstract
Background: This study was undertaken to develop STS mortality risk models for multiple valve
procedures, which comprise 12% of total valve operations.
Methods: Data were obtained from the STS Adult Cardiac Surgery Database for 50,231 patients undergoing
combinations of aortic (A), mitral (M), and tricuspid (T) surgery between January 1, 2004 and December 31,
2010, divided into developmental (2004-2009) and validation (2010) samples. Pulmonary valve operations,
aortic root replacements, and dissection procedures were excluded, and insufficient AT procedures were
available to model. Using stepwise logistic regression, the risk of operative mortality was estimated for each
valve surgery type [(AM; n=27,035), (MT; n=18,686), and (AMT; n=4,510)]. Two separate models were
estimated, one that included only patient characteristics and status at presentation, and thereby would be
suitable for performance profiling; and another that added discretionary operative variables such as
arrhythmia ablation or valve repair.
Results: Unadjusted operative mortality was 7.6% for MT, 9.4% for AM, and 13.1% for AMT procedures.
Significant risk factors for mortality included emergency presentation, advanced age, renal failure,
reoperation, endocarditis, diabetes, severe chronic lung disease, peripheral vascular disease, coronary artery
disease, and female sex. In models containing intraoperative variables, performance of arrhythmia ablation
and atrio-ventricular valve repair were protective for mortality. In the validation sample, the model exhibited
acceptable discrimination in each of the 3 procedural subgroups (C=0.711-0.727).
Conclusions: Risk models were developed to predict operative mortality for patients having multiple valve
procedures. These models may be useful for outcome assessment, quality improvement, patient counseling,
shared decision-making, and research.

3
Introduction
The Society of Thoracic Surgeons (STS) has developed risk prediction models for various types of
cardiac surgery that have been useful for quality assessment and improvement, patient counseling, and
research (1-4). However, models currently are unavailable for procedures involving combinations of aortic
(A), mitral (M), and tricuspid (T) valves. Although multiple valve (MUV) surgery comprises only 12% of
valve procedures, MUV mortality is more than twice that of single valve operations and accounts for up to a
third of operative deaths after valve surgery (5,6). A risk model for MUV operative mortality would enable
benchmark comparisons among STS participants (usually cardiac surgical groups or hospital departments)
and facilitate shared decision-making with patients. Accordingly, the goal of this study was to develop a risk
model for operative mortality associated with MUV procedures within the STS Adult Cardiac Surgery
Database (STS-ACSD).
Methods
This study was approved by the Duke University Institutional Review Board.
Patient Population
The population consisted of 50,231 adult patients aged 20 to 100 years who underwent MUV surgery
in North America between January 1, 2004, and December 31, 2010. Data were collected using STS-ACSD
versions 2.52 and 2.61. Patients who received one of the following 3 MUV combinations were included:
aortic-mitral (AM; n=27,035), mitral-tricuspid (MT; n=18,686), and triple valve procedures (AMT;
n=4,510). Only 1,768 aortic-tricuspid procedures (AT) were recorded (180 deaths), and this group was
excluded because of insufficient sample size. Patients having concomitant coronary bypass grafting (CABG),
ventricular assist device, or arrhythmia surgery were included in the study. Patients having pulmonary valve
surgery, aortic root reconstruction, or repair of aortic dissection were excluded, as were patients who
underwent surgery for left ventricular aneurysm, ventricular or atrial septal defect, other congenital lesions,
the Batista procedure, surgical ventricular restoration, transmyocardial revascularization, cardiac trauma,

4
cardiac transplant, aortic aneurysm, carotid endarterectomy, and other vascular, thoracic, or non-cardiac
procedures not listed on the data collection form. The final study population comprised 50,231 patient
operations from 970 STS participating provider groups (Appendix Table A).
Modeling Approach
MUV risk models were developed by clinicians and statisticians of the STS Quality Measurement
Task Force (QMTF). The endpoint was operative mortality, defined as: death during the same
hospitalization as surgery, regardless of timing or within 30 days of surgery regardless of venue. Because of
the large number of MUV patients in the STS-ACSD, sample sizes were adequate to develop separate
models for each of the 3 MUV categories. This decision was based on the concept that, when adequate
patients are available, relatively homogeneous categories produce models with better calibration and greater
face validity (4). For each type of MUV surgery, separate models were developed using only preoperative
variables (Preoperative models) and the combinations of preoperative and intraoperative variables
(Preoperative + Intraoperative models). Preoperative models included only those patient characteristics
present prior to the operation and are thus suitable for assessing STS ACSD participant performance.
Preoperative + Intraoperative models included additional information about discretionary aspects of the
procedure, such as arrhythmia ablation or valve repair versus replacement. Preoperative + Intraoperative
models allow risk estimates to be customized based on knowledge of the planned procedure. As noted in the
discussion section, readers are cautioned against using the Preoperative + Intraoperative model to estimate an
individual patient’s risk hypothetically under two different treatment options, as the observed difference in
risk may be partly explained by crossover or selection bias (7,8). As in previous models, all standard STS
candidate variables were assessed (www.sts.org), and multivariable logistic regression analyses were utilized
with stepwise forward selection of variables. The resulting models also included certain risk factors that were
forced into the models. Time trends were addressed by including surgery date as a candidate covariate. Lists
of candidate covariates and methods of modeling the continuous variables are given in Appendix Table B.

5
Overall, 6 models were generated (3 valve populations x 2 models [Preoperative and Preoperative +
Intraoperative]). The 2004-2009 study period sample was used to develop the 6 models, which then were
validated with data from MUV patients operated during 2010. Model variables were selected by the QMTF
surgeon panel and initially included all important covariates from previous STS risk models (1-4). Decisions
were made after reviewing stepwise model selection, with the goal of significantly reducing the pool of
candidate predictors based on clinical knowledge. Missing data were rare and were imputed as described
previously (4). Multiple imputation was not used for these analyses because of the low rate of missing data
and because the method of imputation had minimal impact in previous STS risk model analyses.
Evaluation of Models
Calibration was assessed graphically by plotting observed versus predicted event rates within deciles
of predicted risk in the validation sample. Discrimination was evaluated by determining the c-statistic, also
known as the area under the receiver operating characteristic (ROC) curve. After choosing variables and
assessing model fit, development and validation samples subsequently were combined, and the final model
coefficients were estimated using the combined (development plus validation) data set.
Results
Baseline characteristics of the 3 populations are shown in Appendix Table A. Status at presentation
was non-elective in about 40% of cases. Patients requiring AM surgery were more often male and were more
likely to have coronary artery disease compared to other valve combinations. Two-thirds of all MUV patients
had congestive heart failure, and among those, nearly 80% were in NYHA Class III-IV. History of previous
valve surgery increased from AM to MT to AMT. Treated or active endocarditis was common (6-12%), with
the highest incidence in the AM group. Overall, about 80% of MUV patients had moderate to severe mitral
insufficiency, and 20% had mitral stenosis. Among patients undergoing tricuspid procedures, the incidence
of moderate to severe tricuspid insufficiency was more than 80%. Approximately 60% of AM and AMT
patients had aortic stenosis, and more than half had moderate to severe aortic insufficiency. Atrial fibrillation

6
was present in half of MT and AMT patients, but only 30% of AM. Only about half of all MUV patients
with preoperative atrial fibrillation received ablation procedures. MT and AMT patients underwent CABG
less frequently (both about 29% versus 38% for AM; p<0.001). MT and AMT patients had tricuspid repairs
in 95% of cases, whereas repair procedures were performed in only 40-50% of patients undergoing mitral
surgery. Aortic valve repair was performed in about 2% of aortic valve cases. Average unadjusted operative
mortalities were: MT 7.6%, AM 9.4%, and AMT 13.1%.
Estimated odds ratios for Preoperative and Preoperative + Intraoperative models are shown in Table
1. The magnitude and ranking of risk factors were similar for all 3 procedural types, with emergency
presentation, advanced age, dialysis-dependent renal failure, reoperation, and endocarditis having the highest
odds ratios. Other important risk factors included female gender, insulin-dependent diabetes, severe chronic
lung disease, peripheral vascular disease, immunosuppression, and concomitant CABG. In the MT group,
recent myocardial infarction also was an important predictor. In Preoperative + Intraoperative models,
ablation procedures for atrial fibrillation were associated with reduced operative mortality in AM and AMT
subgroups, and replacement (versus repair) of mitral or tricuspid valves was associated with increased risk-
adjusted mortality in all 3 procedural categories (although few tricuspid replacement patients existed in this
more recent data set).
When the models fitted with the 2004-2009 developmental sample were validated with the 2010
cohort, each was well calibrated (Figure 1). The average absolute difference between observed versus
predicted death rates across the decile categories ranged from 1% for AM patients to 4% for AMT. A slight
tendency existed for the models to over-predict risk in the highest decile. In the validation sample, the c-
indices of the models ranged from 0.702 for AMT Preoperative to 0.727 for MT Preoperative +
Intraoperative. Individual c-indices are shown in Figure 1. Data from the full model for Preoperative and
Preoperative + Intraoperative analyses are given in Appendix Table C, and stepwise regression coefficients

7
are shown in Appendix Table D. Finally, definitions of variables appearing in the final stepwise models are
given in Appendix Table E.
Discussion
The development of MUV surgery risk models was guided by several observations. First, MUV
mortality is more than twice that for single valve operations, and MUV cases contribute up to a third of total
deaths after valve surgery (5). Furthermore, although risk-adjusted mortalities for all valve procedures have
been progressively improving, MUV mortality rates are falling faster than those of single valves (5,6).
Because of the improving results, the present study was based on the most recent 6 years of available
procedures (2004-2010) and will provide surgeons and patients with the most contemporary estimates of
MUV risk. Finally, two types of models were developed, one of which used Preoperative variables only and
was thus appropriate for profiling. The other model type, containing both Preoperative + Intraoperative
variables, allowed more precise estimates of risk for a particular planned procedure on a specific patient.
Baseline patient characteristics are important determinants of outcome following valve surgery,
especially MUV procedures. Accounting for a particular provider’s distribution of patient risk factors is
critical in fairly assessing performance, since “expected” outcomes can vary widely depending on severity of
patient illness. In a previous study (6), observed STS operative mortality was less than 1% for single or
MUV cases with age < 65 years, elective presentation, and EF > 0.40. If only those 3 risk factors were
reversed (age > 65 years, urgent presentation, and EF < 0.40), single valve mortality increased to 10.7%, and
MUV mortality to 16.5%. If additional risk factors, such as renal failure and endocarditis, were involved (9,
10), “expected” mortalities could become quite high, and overall provider results could be impacted
significantly. These data emphasize the importance of risk models in evaluating outcomes with increasing
complexity of patient illness.
In this study, predictors of mortality were similar across MUV groups. Non-elective presentation was
strongly associated with mortality and has been shown in other reports to be increasing in frequency (5,11).
8
Other important risk factors included advanced age, renal failure/dialysis, hemodynamic instability, and
reoperation. While studies have shown valve reoperation generally to be safe (12-14), reoperative valve
surgery (single or MUV) in the STS registry is associated with substantially increased risk. This finding
emphasizes the importance of designing MUV procedures that minimize the need for reoperation, such as
avoiding tissue valves in younger patients. In the AM and AMT Preoperative + Intraoperative models,
patients undergoing arrhythmia ablation procedures (15-17) had lower predicted mortality risk than patients
not receiving these procedures. Similarly, patients undergoing repair instead of replacement of the mitral or
tricuspid valves had lower predicted risk than patients undergoing valve replacement. Because of undefined
treatment selection biases and possible confounding variables, these data should be interpretted with caution
at this time, pending future research. However, these results are consistent with previous studies showing
improved results with repair of mitral, tricuspid, and aortic valves (18-21), and preliminary reports of repair
of all valves during MUV are showing low operative mortality (22-24). Further investigations of MUV
repair procedures seem indicated, perhaps involving examination of subgroups and linked data registries (25)
to assess longer-term outcomes.
Limitations
All risk models are imperfect representations of reality. Although STS risk models are based on
excellent data and large sample sizes, unmeasured confounding variables and treatment selection biases can
be present and may degrade the accuracy of risk estimates for some patients. Within the STS-ACSD,
participation remains voluntary, and the possibility exists that higher performing hospitals were more likely
to participate during earlier years. However, as the percentage of participating hospitals in North America
now approaches 95%, this consideration is less relevant. The risk models developed in this paper can be
useful for informing patients about surgical risk, but a proper interpretation is paramount. Predicted risk
estimates should be viewed as statistical averages derived from historical populations of patients with similar
measured risk factors undergoing similar procedures. An individual’s true risk may differ from the statistical

9
estimate, because of individual-specific factors not included in the statistical model. Readers are cautioned
against using the Preoperative + Intraoperative model to estimate an individual patient’s risk hypothetically
under two different treatment options. Because treatments were not randomized, the apparent difference in
risk for two treatments may reflect differences in unmeasured risk factors not included in the statistical
model.
Conclusions
Six new STS risk models were developed for operative mortality after MUV surgery, and the models
were well calibrated with acceptable discrimination. Models containing only preoperative variables were
estimated for profiling, and separate models including both preoperative variables and discretionary
intraoperative factors (e.g., valve repair vs replacement, atrial ablation vs no ablation) were developed that
provided more tailored estimates of mortality based on the specific planned procedure. Information derived
from these models may be useful for accreditation, regulatory compliance, reimbursement, selective
referrals, quality improvement, clinical research, and patient counseling.
References
1. Shahian DM, Edwards FH. The Society of Thoracic Surgeons 2008 cardiac surgery risk models:
Introduction. Ann Thorac Surg 2009;88:1.
2. Shahian DM, O'Brien SM, Filardo G, et al. The Society of Thoracic Surgeons 2008 cardiac surgery risk
models: Part 1 coronary artery bypass grafting surgery. Ann Thorac Surg 2009;88:2-22.
3. O'Brien SM, Shahian DM, Filardo G, et al. The Society of Thoracic Surgeons 2008 cardiac surgery risk
models: Part 2 isolated valve surgery. Ann Thorac Surg 2009;88:23-42.
4. Shahian DM, O'Brien SM, Filardo G, et al. The Society of Thoracic Surgeons 2008 cardiac surgery risk
models: Part 3 valve plus coronary artery bypass grafting surgery. Ann Thorac Surg 2009;88:43-62.
5. Lee R, Li S, Rankin JS, et al. Fifteen-year outcome trends for valve surgery in North America. Ann Thorac
Surg 2011;91:677-684.

10
6. Vassileva CM, Li S, O’Brien SM, et al. Outcome characteristics of multiple valve surgery: Comparison to
single valves. Submitted for publication.
7. Jones RH. Intraoperative crossover: The well-kept surgical secret to apparent surgical success. J Am Coll
Cardiol 2005;45:1529-1531.
8. Moss RR, Humphries KH, Goa M, et al. Outcome of mitral valve repair or replacement: A comparison by
propensity score analysis. Circulation 2003;108:II-90-II-97.
9. Rankin JS, Milford-Beland S, Edwards FH, et al. The risk of endocarditis surgery in dialysis-dependent
renal failure. J Heart Valve Dis 2007;16:617-622.
10. Garrido-Olivares L, David TE, Maganti M, et al. Effect of preoperative non–dialysis-dependent renal
dysfunction on isolated aortic and mitral valve surgery: A propensity score analysis. J Thorac Cardiovasc
Surg 2011;142:155-161.
11. Rankin JS, Hammill BG, O’Brien SM, et al. Determinants of operative mortality in valvular heart
surgery. J Thorac Cardiovasc Surg 2006;131:547-557.
12. Jaussaud N, Gariboldi V, Giorgi R, et al. Risk of reoperation for aortic bioprosthesis dysfunction. J Heart
Valve Dis 2009;18:256-261.
13. Zegdi R, Sleilaty G, Latrémouille C, et al. Reoperation for failure of mitral valve repair in degenerative
disease: a single-center experience. Ann Thorac Surg 2008;86:1480-1484.
14. Suri RM, Schaff HV, Dearani JA, et al. Recurrent mitral regurgitation after repair: should the mitral
valve be re-repaired? J Thorac Cardiovasc Surg 2006;132:1390-1397.
15. Damiano RJ, Schwartz FH, Bailey MS, et al. The Cox maze IV procedure: Predictors of late recurrence.
J Thorac Cardiovasc Surgery 2011; 141:113-121.
16. Gammie JS, Haddad MH, Milford-Beland S, et al. Atrial fibrillation correction surgery: Lessons from
The Society of Thoracic Surgeons National Cardiac Database. Ann Thorac Surg 2008;85:909-915.

11
17. Lee R, McCarthy PM, Wang EC, et al. Mid-term survival in patients treated for atrial fibrillation: A
propensity matched comparison to patients without a history of atrial fibrillation. J Thorac Cardiovasc Surg
2012;143:1341-1351.
18. Talwar S, Mathur A, Choudhary SK, et al. Aortic valve replacement with mitral valve repair compared
with combined aortic and mitral valve replacement. Ann Thorac Surg 2007;84:1219-1225.
19. Gillinov AM, Blackstone EH, Cosgrove DM, et al. Mitral valve repair with aortic valve replacement is
superior to double valve replacement. J Thorac Cardiovasc Surg 2003;125:1372-1387.
20. Gammie JS, Sheng S, Giffith BP, et al. Trends in mitral valve surgery in the United States: Results from
The Society of Thoracic Surgeons adult cardiac surgery database. Ann Thorac Surg2009;87:1431-1437.
21. Aicher D, Fries R, Rodionycheva S, et al. Aortic valve repair leads to a low incidence of valve-related
complications. Eur J Cardiothorac Surg 2010;37:127-132.
22. Aicher D, Kunihara T, Asano M, et al. Simultaneous aortic and mitral valve repair. Abstract presented at
Society of Heart Valve Disease meeting, Barcelona, Spain, June 2011, JHVD, submitted.
23. Rankin JS, Rankin HB, Myers PR. Techniques and results of multiple valve repair. Abstract presented at
Society of Heart Valve Disease meeting, Barcelona, Spain, June 2011, JHVD, submitted.
http://www.jsrmd.com/ftp/70_TRMUVR.ppt
24. Vohra H, Whistance R, De Kerchove L, et al. Long-term outcome of valve repair for concomitant aortic
and mitral insufficiency: Setting a new standard of care. Abstract presented at the European Association for
Cardio-Thoracic Surgery meeting, Barcelona Spain, October 2012, EJCTS, submitted.
25. Jacobs JP, Edwards FH, Shahian DM, et al. Successful linking of the Society of Thoracic Surgeons
Database to Social Security Data to examine survival after cardiac operations. Ann Thorac Surg 2011;92:32-
39.

12
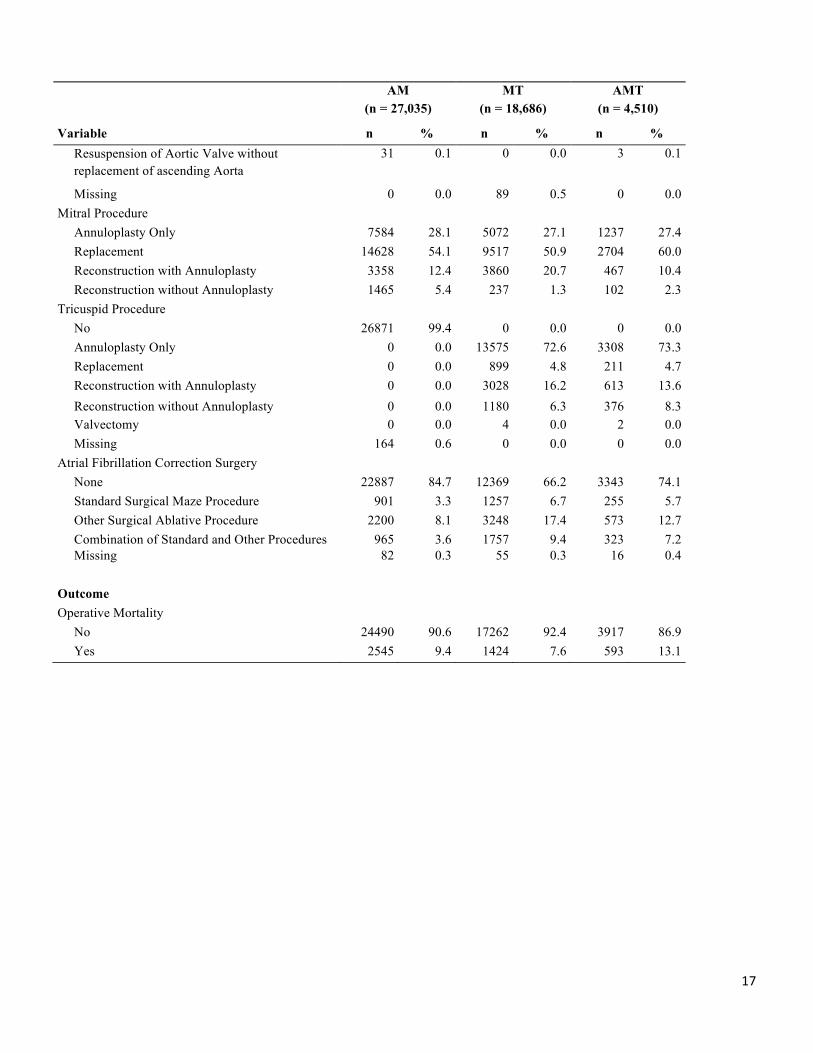
Appendix Table A. Distribution of Risk Factors, Operative Factors, and Mortality Outcomes in AM, MT and AMT Study Population, (2004-2010) AM MT AMT (n = 27,035) (n = 18,686) (n = 4,510)
Variable n % n % n % Demographics
Age, years <50 2767 10.2 2026 10.8 463 10.3 50 – 59 3837 14.2 2769 14.8 619 13.7 60 – 69 6310 23.3 4506 24.1 996 22.1 ≥70 14121 52.2 9385 50.2 2432 53.9
Median Age, years (25th, 75th)
70 (60, 78) 70 ( 59,
77) 71
70 (59, 77) 71 (60, 78) Sex Male 15058 55.7 6853 36.7 1892 42.0 Female 11974 44.3 11832 63.3 2615 58.0 Missing 3 0.0 1 0.0 3 0.1 Race/Ethnicity Caucasian 22165 82.0 14192 75.9 3532 78.3 Black 2306 8.5 2533 13.6 485 10.8 Hispanic 1227 4.5 853 4.6 209 4.6 Asian 528 2.0 486 2.6 132 2.9 Other 703 2.6 560 3.0 138 3.1 Missing 106 0.4 62 0.3 14 0.3 Risk Factors Body Surface Area (BSA), m2 <1.50 1166 4.3 1037 5.5 241 5.3 1.50 – 1.74 6272 23.2 5649 30.2 1344 29.8 1.75 – 1.99 10465 38.7 6986 37.4 1746 38.7 ≥2.00 9059 33.5 4959 26.5 1165 25.8 Missing 73 0.3 55 0.3 14 0.3 Diabetes No Diabetes 19858 73.5 13871 74.2 3340 74.1 Diabetes, noninsulin 4893 18.1 3154 16.9 788 17.5 Diabetes, insulin 2221 8.2 1602 8.6 369 8.2 Diabetes, other treatment 8 0.0 5 0.0 2 0.0 Diabetes, missing Treatment 25 0.1 29 0.2 7 0.2 Missing 30 0.1 25 0.1 4 0.1 Hypertension No 7048 26.1 5041 27.0 1291 28.6 Yes 19962 73.8 13627 72.9 3217 71.3 Missing 25 0.1 18 0.1 2 0.0 Renal Function Creatinine <1.00 mg/dL 9018 33.4 6463 34.6 1435 31.8 Creatinine 1.00 – 1.49 mg/dL 12543 46.4 8300 44.4 1999 44.3

13
AM MT AMT (n = 27,035) (n = 18,686) (n = 4,510)
Variable n % n % n % Creatinine 1.50 – 2.00 mg/dL 2896 10.7 2090 11.2 536 11.9 Creatinine 2.00 – 2.50 mg/dL 677 2.5 575 3.1 159 3.5 Creatinine ≥2.5 mg/dL 467 1.7 347 1.9 90 2.0 Dialysis 1309 4.8 838 4.5 272 6.0 Missing 125 0.5 73 0.4 19 0.4 Chronic Lung Disease (CLD) None 19444 71.9 13350 71.4 3259 72.3 Mild 3808 14.1 2618 14.0 602 13.3 Moderate 2180 8.1 1509 8.1 376 8.3 Severe 1473 5.4 1117 6.0 254 5.6 Missing 130 0.5 92 0.5 19 0.4 Peripheral Vascular Disease (PVD) No 23704 87.7 16733 89.5 3987 88.4 Yes 3290 12.2 1922 10.3 519 11.5 Missing 41 0.2 31 0.2 4 0.1 Cerebrovascular Disease (CVD) No 22285 82.4 15682 83.9 3721 82.5 Yes 4714 17.4 2973 15.9 784 17.4 Missing 36 0.1 31 0.2 5 0.1 Cerebrovascular Accident (CVA) No CVA 24372 90.1 16891 90.4 4047 89.7 Remote CVA (> 2 weeks) 2341 8.7 1659 8.9 424 9.4 Recent CVA (≤ 2 weeks) 230 0.9 73 0.4 28 0.6 CVA - Missing Timing 17 0.1 9 0.0 4 0.1 Missing 75 0.3 54 0.3 7 0.2 Endocarditis No Endocarditis 23750 87.8 17637 94.4 4099 90.9 Treated Endocarditis 1284 4.7 529 2.8 199 4.4 Active Endocarditis 1945 7.2 473 2.5 202 4.5 Endocarditis - Missing Type 17 0.1 6 0.0 3 0.1 Missing 39 0.1 41 0.2 7 0.2 Immunosuppressive Treatment No 25763 95.3 17959 96.1 4296 95.3 Yes 1223 4.5 688 3.7 206 4.6 Missing 49 0.2 39 0.2 8 0.2 Previous Cardiovascular Interventions Previous Coronary Artery BypassSurgery No 24260 89.7 16394 87.7 3960 87.8 Yes 2713 10.0 2235 12.0 537 11.9 Missing 62 0.2 57 0.3 13 0.3 Previous Valve Surgery No 24403 90.3 15739 84.2 3712 82.3
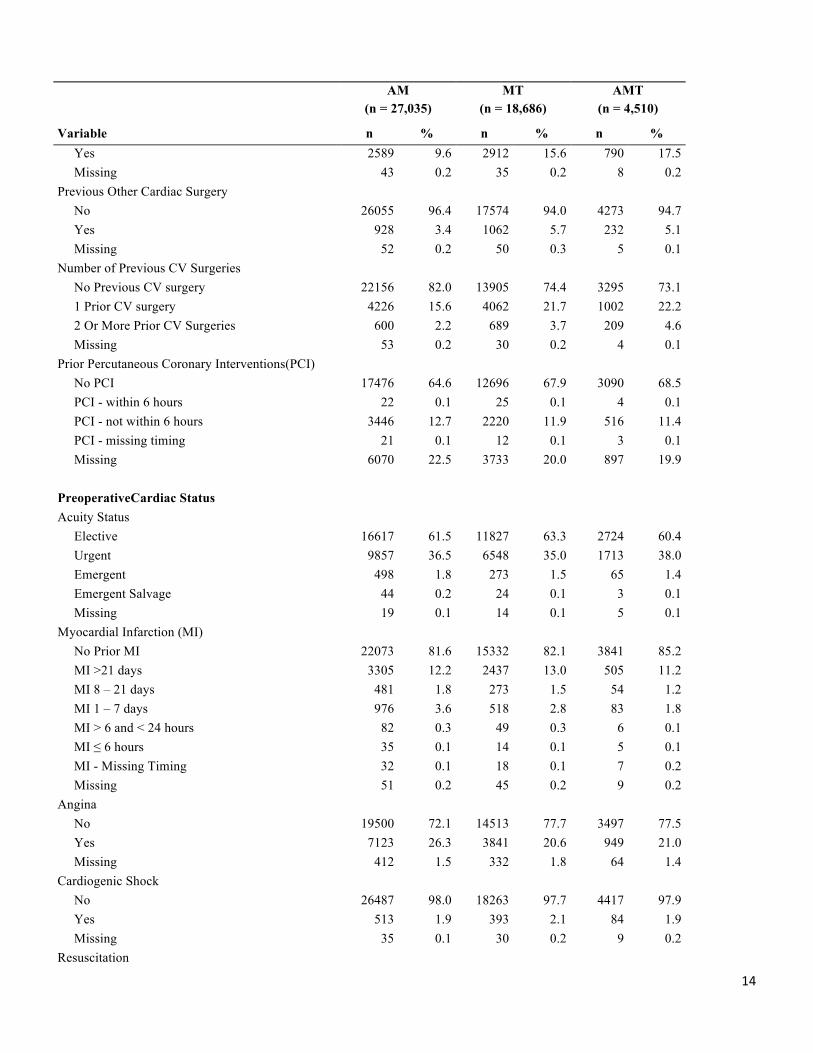
14
AM MT AMT (n = 27,035) (n = 18,686) (n = 4,510)
Variable n % n % n % Yes 2589 9.6 2912 15.6 790 17.5 Missing 43 0.2 35 0.2 8 0.2 Previous Other Cardiac Surgery No 26055 96.4 17574 94.0 4273 94.7 Yes 928 3.4 1062 5.7 232 5.1 Missing 52 0.2 50 0.3 5 0.1 Number of Previous CV Surgeries No Previous CV surgery 22156 82.0 13905 74.4 3295 73.1 1 Prior CV surgery 4226 15.6 4062 21.7 1002 22.2 2 Or More Prior CV Surgeries 600 2.2 689 3.7 209 4.6 Missing 53 0.2 30 0.2 4 0.1 Prior Percutaneous Coronary Interventions(PCI) No PCI 17476 64.6 12696 67.9 3090 68.5 PCI - within 6 hours 22 0.1 25 0.1 4 0.1 PCI - not within 6 hours 3446 12.7 2220 11.9 516 11.4 PCI - missing timing 21 0.1 12 0.1 3 0.1 Missing 6070 22.5 3733 20.0 897 19.9 PreoperativeCardiac Status Acuity Status Elective 16617 61.5 11827 63.3 2724 60.4 Urgent 9857 36.5 6548 35.0 1713 38.0 Emergent 498 1.8 273 1.5 65 1.4 Emergent Salvage 44 0.2 24 0.1 3 0.1 Missing 19 0.1 14 0.1 5 0.1 Myocardial Infarction (MI) No Prior MI 22073 81.6 15332 82.1 3841 85.2 MI >21 days 3305 12.2 2437 13.0 505 11.2 MI 8 – 21 days 481 1.8 273 1.5 54 1.2 MI 1 – 7 days 976 3.6 518 2.8 83 1.8 MI > 6 and < 24 hours 82 0.3 49 0.3 6 0.1 MI ≤ 6 hours 35 0.1 14 0.1 5 0.1 MI - Missing Timing 32 0.1 18 0.1 7 0.2 Missing 51 0.2 45 0.2 9 0.2 Angina No 19500 72.1 14513 77.7 3497 77.5 Yes 7123 26.3 3841 20.6 949 21.0 Missing 412 1.5 332 1.8 64 1.4 Cardiogenic Shock No 26487 98.0 18263 97.7 4417 97.9 Yes 513 1.9 393 2.1 84 1.9 Missing 35 0.1 30 0.2 9 0.2 Resuscitation

15
AM MT AMT (n = 27,035) (n = 18,686) (n = 4,510)
Variable n % n % n % No 26820 99.2 18543 99.2 4478 99.3 Yes 166 0.6 101 0.5 21 0.5 Missing 49 0.2 42 0.2 11 0.2 Arrhythmia No Arrhythmia 17321 64.1 7436 39.8 1937 42.9 Atrial Fibrillation/Flutter 8117 30.0 9980 53.4 2277 50.5 Heart Block 363 1.3 167 0.9 50 1.1 Sustained Ventricular Tachycardia or Ventricular Fibrillation
272 1.0 180 1.0 50 1.1
Multiple Types 141 0.5 143 0.8 37 0.8 Arrhythmia - None of Above Types 690 2.6 709 3.8 144 3.2 Arrhythmia - Missing Type 89 0.3 41 0.2 9 0.2 Missing 42 0.2 30 0.2 6 0.1 PreoperativeIntra-Aortic Balloon Pump (IABP)
No 26507 98.0 18023 96.5 4427 98.2 Yes 495 1.8 634 3.4 81 1.8 Missing 33 0.1 29 0.2 2 0.0 Congestive Heart Failure (CHF) No 11001 40.7 6260 33.5 1366 30.3 Yes 16000 59.2 12401 66.4 3142 69.7 Missing 34 0.1 25 0.1 2 0.0 New York Heart Association Class (%CHF) I 531 3.3 353 2.8 81 2.6 II 3135 19.6 2296 18.5 507 16.1 III 7457 46.6 6029 48.6 1522 48.4 IV 4550 28.4 3479 28.1 980 31.2 Missing 327 2.0 244 2.0 52 1.7 Number of Diseased Coronary Vessels None 13989 51.7 11011 58.9 2625 58.2 One 4430 16.4 2521 13.5 718 15.9 Two 3442 12.7 1881 10.1 462 10.2 Three 4963 18.4 3105 16.6 671 14.9 Missing 211 0.8 168 0.9 34 0.8 Left Main Disease ≥ 50% No 24941 92.3 17454 93.4 4233 93.9 Yes 1870 6.9 1071 5.7 238 5.3 Missing 224 0.8 161 0.9 39 0.9 Ejection Fraction, % <25 1175 4.3 1018 5.4 236 5.2 25 – 34 2580 9.5 1754 9.4 413 9.2 35 – 44 3808 14.1 2601 13.9 663 14.7 45 – 54 5380 19.9 3931 21.0 926 20.5 ≥ 55 12776 47.3 8616 46.1 2085 46.2

16
AM MT AMT (n = 27,035) (n = 18,686) (n = 4,510)
Variable n % n % n % Missing 1316 4.9 766 4.1 187 4.1 Aortic Stenosis No 10018 37.1 17864 95.6 1797 39.8 Yes 16884 62.5 623 3.3 2695 59.8 Missing 133 0.5 199 1.1 18 0.4 Mitral Stenosis No 20772 76.8 15005 80.3 3279 72.7 Yes 6067 22.4 3478 18.6 1203 26.7 Missing 196 0.7 203 1.1 28 0.6 Aortic Insufficiency None 6147 22.7 11814 63.2 834 18.5 Trivial 1905 7.0 2535 13.6 302 6.7 Mild 4493 16.6 2633 14.1 749 16.6 Moderate 6680 24.7 662 3.5 1358 30.1 Severe 7009 25.9 89 0.5 1165 25.8 N/A 616 2.3 748 4.0 81 1.8 Missing 185 0.7 205 1.1 21 0.5 Mitral Insufficiency None 2209 8.2 793 4.2 254 5.6 Trivial 693 2.6 243 1.3 99 2.2 Mild 2880 10.7 781 4.2 378 8.4 Moderate 8508 31.5 3165 16.9 1294 28.7 Severe 12314 45.5 13511 72.3 2438 54.1 N/A 333 1.2 129 0.7 39 0.9 Missing 98 0.4 64 0.3 8 0.2 Tricuspid Insufficiency None 12325 45.6 1518 8.1 342 7.6 Trivial 2768 10.2 238 1.3 74 1.6 Mild 5995 22.2 1495 8.0 429 9.5 Moderate 3600 13.3 6679 35.7 1634 36.2 Severe 730 2.7 8400 45.0 1961 43.5 N/A 1295 4.8 269 1.4 54 1.2 Missing 322 1.2 87 0.5 16 0.4 Operative Concomitant CABG Surgery No 16700 61.8 13341 71.4 3177 70.4 Yes 10319 38.2 5333 28.5 1332 29.5 Missing 16 0.1 12 0.1 1 0.0 Aortic Procedure No 0 0.0 18597 99.5 0 0.0 Replacement 26455 97.9 0 0.0 4389 97.3 Repair/Reconstruction 549 2.0 0 0.0 118 2.6
17
AM MT AMT (n = 27,035) (n = 18,686) (n = 4,510)
Variable n % n % n % Resuspension of Aortic Valve without replacement of ascending Aorta
31 0.1 0 0.0 3 0.1
Missing 0 0.0 89 0.5 0 0.0 Mitral Procedure Annuloplasty Only 7584 28.1 5072 27.1 1237 27.4 Replacement 14628 54.1 9517 50.9 2704 60.0 Reconstruction with Annuloplasty 3358 12.4 3860 20.7 467 10.4 Reconstruction without Annuloplasty 1465 5.4 237 1.3 102 2.3 Tricuspid Procedure No 26871 99.4 0 0.0 0 0.0 Annuloplasty Only 0 0.0 13575 72.6 3308 73.3 Replacement 0 0.0 899 4.8 211 4.7 Reconstruction with Annuloplasty 0 0.0 3028 16.2 613 13.6 Reconstruction without Annuloplasty 0 0.0 1180 6.3 376 8.3 Valvectomy 0 0.0 4 0.0 2 0.0 Missing 164 0.6 0 0.0 0 0.0 Atrial Fibrillation Correction Surgery None 22887 84.7 12369 66.2 3343 74.1 Standard Surgical Maze Procedure 901 3.3 1257 6.7 255 5.7 Other Surgical Ablative Procedure 2200 8.1 3248 17.4 573 12.7 Combination of Standard and Other Procedures 965 3.6 1757 9.4 323 7.2 Missing 82 0.3 55 0.3 16 0.4 Outcome Operative Mortality No 24490 90.6 17262 92.4 3917 86.9 Yes 2545 9.4 1424 7.6 593 13.1

18
Appendix Table B. Candidate Variables and Coding Preop Preop + Intraop
AM MT AMT AM MT AMT
Age ü1 ü1 ü2 ü1 ü1 ü2
Ejection fraction3 ü ü ü ü ü ü
Creatinine4 ü5 ü5 ü6 ü5 ü5 ü6
Number of prior CV operations (0, 1, 2 or more) ü ü ü ü ü ü
Date of surgery ü7 ü7 ü7 ü7 ü7 ü7
Dialysis ü ü ü ü ü ü
Concomitant CABG ü ü ü ü ü ü
CHF (yes, NYHA IV; yes, not NYHA IV; no) ü ü ü ü ü ü
Diabetes (yes, insulin; yes, non-‐insulin; no) ü ü ü ü ü ü
Preoperative IABP or inotropes ü ü ü ü ü ü
Active Infections endocarditis ü ü ü ü ü ü
Aortic insufficiency (at least moderate) ü ü ü ü ü ü
Mitral insufficiency (at least moderate) ü ü ü ü ü ü
Tricuspid insufficiency (at least moderate) ü ü ü ü ü ü
Aortic stenosis ü ü ü ü ü ü
Mitral stenosis ü ü ü ü ü ü
Peripheral vascular disease ü ü ü ü ü ü
Body surface area8 ü ü ü ü ü ü
Chronic lung disease (none, mild, moderate, severe) ü ü ü9 ü ü ü9
Interaction of sex and body surface area ü ü ü ü
Interaction of age and prior CV operations ü ü ü ü
Interaction of age and emergent status ü ü ü ü

19
Immunosuppressive treatment ü ü ü ü
Prior MI (>21 days, 1-‐21 days, >6 and <24 hours, ≤6 hours, none) ü ü ü ü
Cerebrovascular disease (yes, prior CVA; yes, no prior CVA; no) ü ü ü ü
Race/ethnicity (Black; Hispanic; Asian; White/Other) ü ü ü ü
Hypertension ü ü ü ü
PCI within 6 hours ü ü ü ü
Left main disease ü ü ü ü
Number of diseased vessels10 ü ü ü ü
Unstable angina without recent MI within 7 days ü ü ü ü
Female sex ü ü ü ü
Cardiogenic shock ü ü ü ü
Status (elective, urgent, emergent, salvage) ü ü ü ü
Status/Shock (elective; urgent; emergent or salvage or shock) ü ü
Atrial fibrillation ü ü ü
Atrial fibrillation/ablation (afib, ablation; afib, no ablation procedure; no afib) ü ü ü
Type of aortic procedure (repair, replacement) ü ü
Type of mitral procedure (repair, replacement) ü ü ü
Type of tricuspid procedure (repair, replacement) ü ü
Interaction of types of aortic and mitral procedures (repair, replacement) ü
Interaction of types of mitral and tricuspid procedures (repair, replacement) ü
(1) Modeled as piecewise-‐linear with possible slope changes at 50 and 70. (2) Modeled as linear. Values < 40 and > 85 are mapped to those values, respectively. (3) Modeled as linear. Values > 50 are mapped to 50. (4) Values <0.5 and >5.0 are mapped to those values, respectively. Creatinine is set to 2.5 for patients on dialysis. (5) Modeled as piecewise-‐linear with possible slope changes at 1.0 and 1.5. (6) Modeled as linear. (7) Number of days since start of study period; linear. (8) Modeled as quadratic polynomial. Values < 1.4 and > 2.6 are mapped to those values, respectively. All values are then centered by subtracting 1.8 from values after mapping. (9) ‘None’ and ‘mild’ are collapsed as the reference level. (10) Linear with values: 1 = zero or one diseased vessel, 2 = two diseased vessels, and 3 = three diseased vessels Afib = preoperative atrial fibrillation; AM = aortic-‐mitral; AMT = aortic-‐mitral-‐tricuspid; CHF = congestive heart failure; CV = cardiovascular; CVA = cerebrovascular accident (stroke); CVD = cerebrovascular disease; EF = ejection fraction; IABP = intra-‐aortic balloon pump; MI = myocardial infarction; MT = mitral-‐tricuspid; NYHA = New York Heat Association.

20
Table 1: Estimated Odds Ratios for Final Stepwise Models in AM, MT and AMT Populations
Variable AM Preop MT Preop AMT Preop AM
Preop+Intraop MT
Preop+Intraop AMT
Preop+Intraop
EF, per 10 percent decrease NS 1.08 (1.01, 1.15) NS NS 1.11 (1.04, 1.19) NS
CHF and NYHA class (versus no CHF)
CHF, not NYHA IV 1.14 (1.02, 1.27) (ref) (ref) 1.13 (1.01, 1.26) (ref) (ref)
CHF, NYHA IV 1.75 (1.51, 2.01) 1.56 (1.33, 1.83) 1.72 (1.35, 2.18) 1.72 (1.50, 1.98) 1.55 (1.33, 1.81) 1.69 (1.33, 2.14)
Age, yearsa
60 versus 50 1.38 (1.31, 1.46) 1.39 (1.30, 1.50) 1.19 (1.09, 1.30) 1.40 (1.32, 1.47) 1.34 (1.27, 1.43) 1.23 (1.13, 1.34)
70 versus 50 1.90 (1.70, 2.12) 1.94 (1.68, 2.25) 1.42 (1.19, 1.69) 1.95 (1.75, 2.18) 1.81 (1.60, 2.03) 1.51 (1.27, 1.79)
80 versus 50 2.62 (2.22, 3.09) 2.71 (2.17, 3.38) 1.69 (1.30, 2.20) 2.72 (2.31, 3.21) 2.43 (2.03, 2.90) 1.85 (1.43, 2.39)
Dialysis and creatinine
Creatinine 1.50 versus 1.00 1.60 (1.41, 1.82) 1.65 (1.45, 1.88) 1.30 (1.20, 1.39) 1.60 (1.40, 1.82) 1.62 (1.43, 1.84) 1.30 (1.20, 1.40)
Creatinine 2.00 versus 1.00 1.77 (1.57, 1.99) 1.95 (1.72, 2.21) 1.68 (1.45, 1.94) 1.76 (1.56, 1.98) 1.91 (1.68, 2.17) 1.68 (1.45, 1.95)
Creatinine 2.50 versus 1.00 1.95 (1.70, 2.23) 2.30 (1.95, 2.71) 2.17 (1.74, 2.71) 1.94 (1.69, 2.23) 2.25 (1.91, 2.65) 2.18 (1.74, 2.72)
Dialysis versus no dialysis and creatinine = 2.50 1.46 (1.22, 1.75) 1.75 (1.37, 2.23) NS 1.43 (1.19, 1.73) 1.70 (1.33, 2.16) NS
Status (versus elective)
Urgent 1.09 (0.98, 1.22) 1.41 (1.21, 1.65) 1.23 (1.01, 1.48) 1.09 (0.98, 1.21) 1.37 (1.17, 1.60) 1.22 (1.01, 1.48)
Emergent 2.05 (1.50, 2.78) 2.68 (1.87, 3.84)c NC 2.03 (1.50, 2.76) 2.60 (1.82, 3.71)c NC
Salvage 3.91 (2.21, 6.91) 2.68 (1.87, 3.84)c NC 3.88 (2.18, 6.91) 2.60 (1.82, 3.71)c NC
Emergent/Salvage/Shock NC NC 2.64 (1.65, 4.24) NC NC 2.62 (1.65, 4.18)
Female (at BSA=1.8m2) versus Male (at BSA=2.0m2) 1.58 (1.44, 1.72) NS NC 1.53 (1.40, 1.66) NS NC
Concomitant CABG procedure 1.54 (1.40, 1.70) 1.33 (1.16, 1.51) 1.48 (1.23, 1.77) 1.56 (1.42, 1.71) 1.34 (1.17, 1.53) 1.51 (1.26, 1.81)
Reoperation (versus no previous CV operation)b 2.22 (1.78, 2.76) 2.04 (1.58, 2.64) 1.52 (1.25, 1.84) 2.20 (1.77, 2.74) 1.48 (1.29, 1.71) 1.45 (1.19, 1.77)
Chronic lung disease (versus none)
Mild-Moderate 1.14 (1.02, 1.27) (ref) (ref) 1.14 (1.03, 1.27) (ref) (ref)
Severe 1.60 (1.35, 1.90) 1.41 (1.16, 1.71) 1.58 (1.15, 2.18) 1.60 (1.35, 1.89) 1.42 (1.17, 1.72) 1.54 (1.11, 2.12)

21
Variable AM Preop MT Preop AMT Preop AM
Preop+Intraop MT
Preop+Intraop AMT
Preop+Intraop
Diabetes (versus no diabetes)
Diabetes, non-insulin 1.13 (1.01, 1.27) 1.26 (1.10, 1.43)c (ref) 1.15 (1.02, 1.28) 1.26 (1.11, 1.43)c (ref)
Diabetes, insulin 1.44 (1.24, 1.66) 1.26 (1.10, 1.43)c 1.53 (1.14, 2.06) 1.43 (1.24, 1.65) 1.26 (1.11, 1.43)c 1.52 (1.13, 2.04)
Pre-op IABP or inotrope 1.61 (1.37, 1.90) 1.34 (1.10, 1.63) NS 1.61 (1.37, 1.89) NS NS
Immunosuppressive treatment 1.48 (1.24, 1.76) 1.43 (1.13, 1.82) NC 1.47 (1.23, 1.76) 1.45 (1.14, 1.83) NC
Active Infections endocarditis 1.95 (1.63, 2.33) NS NS 1.77 (1.48, 2.11) NS NS
Aortic insufficiency (≥ moderate) 0.92 (0.83, 1.01) 1.31 (1.02, 1.69) NS 0.92 (0.84, 1.02) 1.29 (0.99, 1.66) NS
Mitral insufficiency (≥ moderate) NS 0.79 (0.66, 0.95) NS NS 0.79 (0.66, 0.93) NS
Tricuspid insufficiency (≥ moderate) 1.19 (1.06, 1.34) NS NS 1.19 (1.06, 1.34) NS NS
Aortic stenosis 1.21 (1.08, 1.36) NS NS 1.25 (1.12, 1.39) NS NS
Mitral stenosis 1.31 (1.19, 1.45) 1.25 (1.06, 1.46) NS NS NS NS
Peripheral vascular disease 1.27 (1.13, 1.44) 1.24 (1.05, 1.47) NS 1.28 (1.13, 1.45) 1.23 (1.04, 1.45) NS
MI (vs. MI > 21 days or no MI)
1-21 days 1.25 (1.07, 1.46)c (ref) NC 1.29 (1.10, 1.51)c 1.37 (1.11, 1.71) NC
< 1 day 1.25 (1.07, 1.46)c 2.71 (1.41, 5.22) NC 1.29 (1.10, 1.51)c 3.06 (1.58, 5.93) NC
BSA, m2
1.6 versus 2.0 in male 1.44 (1.24, 1.67) 1.51 (1.34, 1.69) NS 1.43 (1.23, 1.66) 1.48 (1.32, 1.66) NS
1.8 versus 2.0 in male 1.11 (1.04, 1.18) 1.15 (1.09, 1.21) NS 1.10 (1.04, 1.18) 1.14 (1.08, 1.20) NS
2.2 versus 2.0 in male 1.05 (0.99, 1.12) 1.00 (0.92, 1.09) NS 1.06 (0.99, 1.13) 1.01 (0.93, 1.09) NS
1.6 versus 1.8 in female 1.12 (1.05, 1.20) 1.32 (1.22, 1.42) NS 1.12 (1.04, 1.19) 1.30 (1.21, 1.40) NS
2.0 versus 1.8 in female 1.04 (0.98, 1.11) 0.87 (0.83, 0.92) NS 1.05 (0.99, 1.11) 0.88 (0.84, 0.92) NS
2.2 versus 1.8 in female 1.27 (1.10, 1.45) 0.88 (0.78, 0.99) NS 1.28 (1.12, 1.47) 0.89 (0.79, 1.00) NS
Surgery date, per half-year increase 0.98 (0.97, 0.99) 0.97 (0.96, 0.99) NS 0.98 (0.97, 0.99) 0.97 (0.96, 0.99) NS
CVD (versus No CVD) NS 1.28 (1.11, 1.49) NC NS 1.28 (1.11, 1.49) NC
Cardiogenic shock NS 1.67 (1.23, 2.27) NC NS 1.81 (1.36, 2.42) NC

22
Variable AM Preop MT Preop AMT Preop AM
Preop+Intraop MT
Preop+Intraop AMT
Preop+Intraop
Expanded Covariates:
Afib ablation (in patients with preop afib)d NC NC NC 0.85 (0.73, 0.98) NS 0.77 (0.60, 0.99)
Aortic and mitral procedures
Both valves replaced (versus at least 1 repair) NC NC NC 1.68 (1.52, 1.86) NC NC
Mitral and tricuspid procedures (versus repair, repair)
Mitral repair, tricuspid replacement NC NC NC NC 1.60 (1.25, 2.05) NC
Mitral replacement, tricuspid repair NC NC NC NC 1.45 (1.26, 1.67) NC
Mitral replacement, tricuspid replacement NC NC NC NC 2.32 (1.73, 3.11) NC
Mitral procedure (versus repair)
Mitral replacement NC NC NC NC NC 1.41 (1.16, 1.71) Interaction in both AM models and MT preop model not shown in the table: age and any reoperation. aReported odds ratio for age represents effect in patients without prior operations, in models with interaction between age and any reoperation. bReported odds ratio for reoperation represents effect in patients 50 years old, in models with interaction between age and any reoperation. cOdds ratios for two adjacent categories are identical because categories were collapsed during model development dThe afib/ablation variable is modeled as 3 categories (afib, ablation; afib, no ablation procedure; no afib) and the first 2 categories were collapsed during selection and so the reported odds ratio is also the OR for afib with ablation vs. no afib. (ref) indicates subgroup is merged into the reference level during model development Afib = preoperative atrial fibrillation; AM = aortic-mitral; BSA = body surface area; AMT = aortic-mitral-tricuspid; CHF = congestive heart failure; CV = cardiovascular; CVD = cerebrovascular disease; EF = ejection fraction; IABP = intra-aortic balloon pump; MI = myocardial infarction; MT = mitral-tricuspid; NC = not a candidate; NS = not selected in the model; NYHA = New York Heat Association.
23
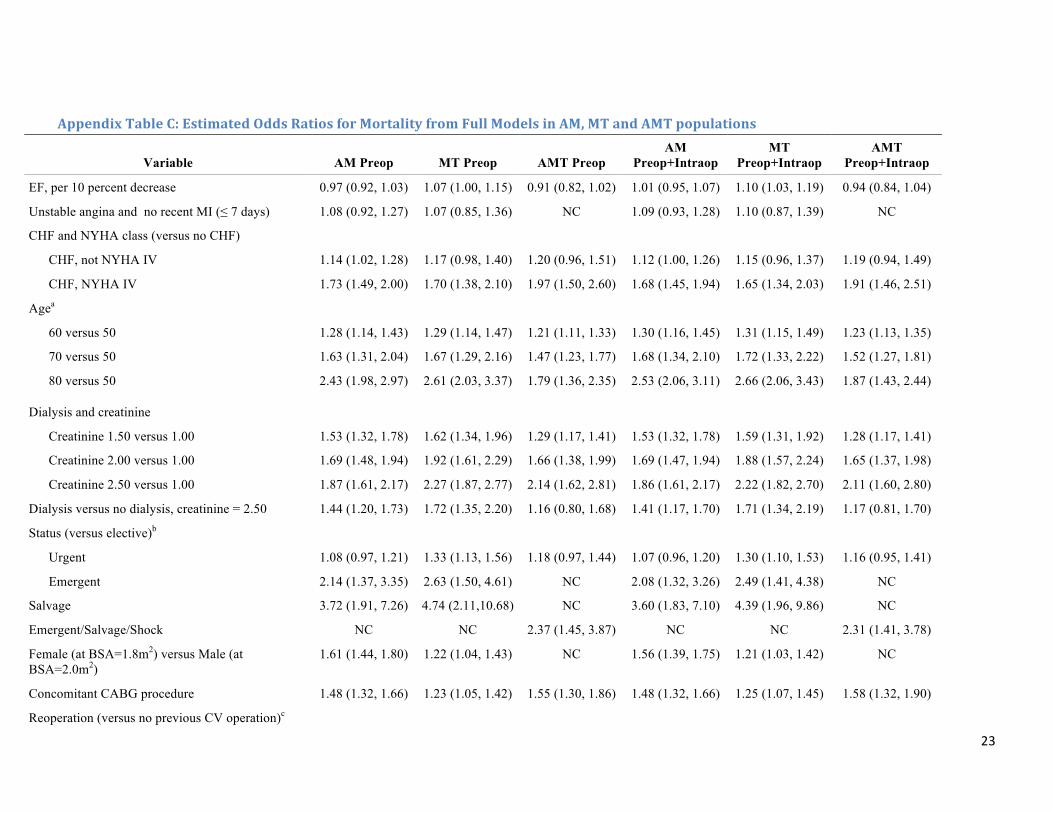
Appendix Table C: Estimated Odds Ratios for Mortality from Full Models in AM, MT and AMT populations
Variable AM Preop MT Preop AMT Preop AM
Preop+Intraop MT
Preop+Intraop AMT
Preop+Intraop
EF, per 10 percent decrease 0.97 (0.92, 1.03) 1.07 (1.00, 1.15) 0.91 (0.82, 1.02) 1.01 (0.95, 1.07) 1.10 (1.03, 1.19) 0.94 (0.84, 1.04)
Unstable angina and no recent MI (≤ 7 days) 1.08 (0.92, 1.27) 1.07 (0.85, 1.36) NC 1.09 (0.93, 1.28) 1.10 (0.87, 1.39) NC
CHF and NYHA class (versus no CHF)
CHF, not NYHA IV 1.14 (1.02, 1.28) 1.17 (0.98, 1.40) 1.20 (0.96, 1.51) 1.12 (1.00, 1.26) 1.15 (0.96, 1.37) 1.19 (0.94, 1.49)
CHF, NYHA IV 1.73 (1.49, 2.00) 1.70 (1.38, 2.10) 1.97 (1.50, 2.60) 1.68 (1.45, 1.94) 1.65 (1.34, 2.03) 1.91 (1.46, 2.51)
Agea
60 versus 50 1.28 (1.14, 1.43) 1.29 (1.14, 1.47) 1.21 (1.11, 1.33) 1.30 (1.16, 1.45) 1.31 (1.15, 1.49) 1.23 (1.13, 1.35)
70 versus 50 1.63 (1.31, 2.04) 1.67 (1.29, 2.16) 1.47 (1.23, 1.77) 1.68 (1.34, 2.10) 1.72 (1.33, 2.22) 1.52 (1.27, 1.81)
80 versus 50 2.43 (1.98, 2.97) 2.61 (2.03, 3.37) 1.79 (1.36, 2.35) 2.53 (2.06, 3.11) 2.66 (2.06, 3.43) 1.87 (1.43, 2.44)
Dialysis and creatinine
Creatinine 1.50 versus 1.00 1.53 (1.32, 1.78) 1.62 (1.34, 1.96) 1.29 (1.17, 1.41) 1.53 (1.32, 1.78) 1.59 (1.31, 1.92) 1.28 (1.17, 1.41)
Creatinine 2.00 versus 1.00 1.69 (1.48, 1.94) 1.92 (1.61, 2.29) 1.66 (1.38, 1.99) 1.69 (1.47, 1.94) 1.88 (1.57, 2.24) 1.65 (1.37, 1.98)
Creatinine 2.50 versus 1.00 1.87 (1.61, 2.17) 2.27 (1.87, 2.77) 2.14 (1.62, 2.81) 1.86 (1.61, 2.17) 2.22 (1.82, 2.70) 2.11 (1.60, 2.80)
Dialysis versus no dialysis, creatinine = 2.50 1.44 (1.20, 1.73) 1.72 (1.35, 2.20) 1.16 (0.80, 1.68) 1.41 (1.17, 1.70) 1.71 (1.34, 2.19) 1.17 (0.81, 1.70)
Status (versus elective)b
Urgent 1.08 (0.97, 1.21) 1.33 (1.13, 1.56) 1.18 (0.97, 1.44) 1.07 (0.96, 1.20) 1.30 (1.10, 1.53) 1.16 (0.95, 1.41)
Emergent 2.14 (1.37, 3.35) 2.63 (1.50, 4.61) NC 2.08 (1.32, 3.26) 2.49 (1.41, 4.38) NC
Salvage 3.72 (1.91, 7.26) 4.74 (2.11,10.68) NC 3.60 (1.83, 7.10) 4.39 (1.96, 9.86) NC
Emergent/Salvage/Shock NC NC 2.37 (1.45, 3.87) NC NC 2.31 (1.41, 3.78)
Female (at BSA=1.8m2) versus Male (at BSA=2.0m2)
1.61 (1.44, 1.80) 1.22 (1.04, 1.43) NC 1.56 (1.39, 1.75) 1.21 (1.03, 1.42) NC
Concomitant CABG procedure 1.48 (1.32, 1.66) 1.23 (1.05, 1.42) 1.55 (1.30, 1.86) 1.48 (1.32, 1.66) 1.25 (1.07, 1.45) 1.58 (1.32, 1.90)
Reoperation (versus no previous CV operation)c

24
Variable AM Preop MT Preop AMT Preop AM
Preop+Intraop MT
Preop+Intraop AMT
Preop+Intraop
1 previous operation 2.14 (1.71, 2.68) 1.97 (1.51, 2.56) 1.45 (1.17, 1.79) 2.10 (1.68, 2.63) 1.79 (1.37, 2.33) 1.37 (1.10, 1.71)
2 or more previous operations 2.60 (1.93, 3.51) 2.18 (1.59, 3.00) 1.56 (1.10, 2.21) 2.55 (1.88, 3.45) 1.89 (1.36, 2.62) 1.45 (1.02, 2.04)
Chronic lung disease (versus none)
Mild 1.14 (1.01, 1.29) 1.02 (0.84, 1.23) (ref) 1.14 (1.01, 1.29) 1.01 (0.83, 1.22) (ref)
Moderate 1.15 (0.98, 1.34) 1.23 (0.99, 1.52) 1.28 (0.94, 1.73) 1.15 (0.98, 1.35) 1.20 (0.97, 1.50) 1.26 (0.93, 1.71)
Severe 1.62 (1.37, 1.93) 1.45 (1.19, 1.77) 1.61 (1.16, 2.23) 1.61 (1.36, 1.91) 1.44 (1.18, 1.75) 1.57 (1.14, 2.18)
Diabetes (versus no diabetes)
Diabetes, non-insulin 1.13 (1.01, 1.26) 1.12 (0.96, 1.31) 1.06 (0.83, 1.34) 1.13 (1.01, 1.27) 1.12 (0.96, 1.30) 1.05 (0.83, 1.33)
Diabetes, insulin 1.43 (1.24, 1.65) 1.37 (1.13, 1.66) 1.53 (1.14, 2.06) 1.42 (1.23, 1.64) 1.38 (1.14, 1.67) 1.52 (1.12, 2.06)
Pre-op IABP or Inotrope 1.54 (1.29, 1.83) 1.31 (1.08, 1.60) 1.18 (0.82, 1.70) 1.52 (1.28, 1.81) 1.28 (1.05, 1.56) 1.17 (0.81, 1.69)
Immunosuppressive treatment 1.49 (1.24, 1.78) 1.39 (1.09, 1.76) NC 1.47 (1.23, 1.77) 1.41 (1.11, 1.78) NC
Active Infections endocarditis 1.94 (1.62, 2.33) 1.36 (0.99, 1.87) 1.20 (0.79, 1.81) 1.82 (1.52, 2.19) 1.23 (0.90, 1.69) 1.14 (0.75, 1.74)
Aortic insufficiency (≥ moderate) 0.93 (0.84, 1.02) 1.31 (1.02, 1.68) 0.84 (0.69, 1.03) 0.93 (0.85, 1.03) 1.28 (1.00, 1.65) 0.84 (0.68, 1.03)
Mitral insufficiency (≥ moderate) 0.98 (0.88, 1.09) 0.80 (0.67, 0.96) 0.86 (0.66, 1.11) 0.96 (0.86, 1.07) 0.82 (0.69, 0.99) 0.86 (0.66, 1.12)
Tricuspid insufficiency (≥ moderate) 1.19 (1.06, 1.34) 1.01 (0.87, 1.17) 0.99 (0.78, 1.26) 1.19 (1.06, 1.34) 1.02 (0.87, 1.18) 1.00 (0.78, 1.27)
Aortic stenosis 1.22 (1.09, 1.36) 1.18 (0.90, 1.55) 0.94 (0.75, 1.18) 1.23 (1.11, 1.38) 1.14 (0.87, 1.50) 0.95 (0.75, 1.20)
Mitral stenosis 1.31 (1.18, 1.45) 1.25 (1.06, 1.47) 1.15 (0.93, 1.43) 1.10 (0.98, 1.23) 1.12 (0.94, 1.33) 1.04 (0.83, 1.31)
Peripheral vascular disease 1.27 (1.12, 1.44) 1.20 (1.02, 1.43) 1.07 (0.82, 1.39) 1.28 (1.12, 1.45) 1.20 (1.01, 1.42) 1.07 (0.82, 1.39)
MI (versus MI > 21 days or no MI)
1-21 days 1.21 (1.03, 1.42) 1.27 (1.02, 1.59) NC 1.23 (1.05, 1.46) 1.30 (1.04, 1.63) NC
> 6 and <24 hrs 1.75 (1.04, 2.94) 3.62 (1.68, 7.80) NC 1.79 (1.07, 2.99) 3.76 (1.74, 8.12) NC
≤6 hrs 1.65 (0.66, 4.13) 1.31 (0.38, 4.48) NC 1.81 (0.73, 4.51) 1.25 (0.37, 4.17) NC
BSA, m2
1.6 versus 2.0 in male 1.49 (1.23, 1.80) 1.51 (1.10, 2.07) NC 1.47 (1.21, 1.78) 1.50 (1.09, 2.05) NC
1.8 versus 2.0 in male 1.12 (1.04, 1.21) 1.16 (1.03, 1.30) NC 1.11 (1.04, 1.20) 1.15 (1.02, 1.29) NC

25
Variable AM Preop MT Preop AMT Preop AM
Preop+Intraop MT
Preop+Intraop AMT
Preop+Intraop
2.2 versus 2.0 in male 1.05 (0.99, 1.13) 0.98 (0.87, 1.10) NC 1.06 (1.00, 1.14) 0.98 (0.88, 1.10) NC
1.6 versus 1.8 in female 1.11 (1.02, 1.20) 1.26 (1.15, 1.38) NC 1.11 (1.02, 1.20) 1.25 (1.14, 1.36) NC
2.0 versus 1.8 in female 1.04 (0.97, 1.10) 0.95 (0.88, 1.03) NC 1.04 (0.98, 1.11) 0.96 (0.89, 1.04) NC
2.2 versus 1.8 in female 1.23 (1.05, 1.45) 1.09 (0.89, 1.34) NC 1.25 (1.06, 1.47) 1.10 (0.89, 1.35) NC
1.6 versus 2.0 NC NC 1.31 (1.09, 1.58) NC NC 1.29 (1.07, 1.56)
1.8 versus 2.0 NC NC 1.07 (0.99, 1.16) NC NC 1.06 (0.98, 1.15)
2.2 versus 2.0 NC NC 1.07 (0.95, 1.20) NC NC 1.07 (0.95, 1.21)
Surgery date, per half-year increase 0.98 (0.96, 0.99) 0.97 (0.96, 0.99) 0.99 (0.96, 1.02) 0.98 (0.97, 0.99) 0.97 (0.96, 0.99) 0.99 (0.96, 1.02)
CVD/CVA (versus No CVD)
CVD without CVA 0.95 (0.82, 1.11) 1.20 (0.97, 1.47) NC 0.95 (0.82, 1.10) 1.21 (0.99, 1.49) NC
CVD with CVA 0.94 (0.81, 1.08) 1.32 (1.11, 1.57) NC 0.94 (0.81, 1.08) 1.31 (1.10, 1.57) NC
Race and Ethnicity (versus Caucasian/other/missing)
Hispanic 1.11 (0.88, 1.39) 1.02 (0.76, 1.36) NC 1.10 (0.87, 1.38) 1.00 (0.75, 1.34) NC
Black 1.03 (0.87, 1.21) 0.83 (0.69, 1.00) NC 1.02 (0.87, 1.21) 0.82 (0.68, 0.99) NC
Asian 0.96 (0.67, 1.36) 1.36 (1.05, 1.77) NC 0.94 (0.66, 1.33) 1.31 (1.01, 1.72) NC
Hypertension 1.11 (0.98, 1.25) 0.99 (0.86, 1.14) NC 1.12 (0.99, 1.26) 1.01 (0.88, 1.16) NC
Number of Diseased Vessels 1.04 (0.97, 1.11) 1.07 (0.98, 1.18) NC 1.05 (0.98, 1.13) 1.10 (1.00, 1.20) NC
Cardiogenic Shock 1.33 (1.00, 1.77) 1.54 (1.13, 2.09) NC 1.34 (1.01, 1.78) 1.52 (1.11, 2.07) NC
PCI ≤ 6 hours 0.75 (0.21, 2.61) 1.66 (0.55, 4.97) NC 0.78 (0.24, 2.53) 1.67 (0.54, 5.16) NC
Left main disease 1.09 (0.92, 1.29) 0.99 (0.79, 1.25) NC 1.09 (0.93, 1.29) 1.00 (0.79, 1.26) NC
Afib 1.03 (0.94, 1.14) 0.97 (0.85, 1.10) 0.98 (0.82, 1.17) NC NC NC
Expanded Covariates:
Afib without ablation (versus no Afib) NC NC NC 1.09 (0.97, 1.21) 1.01 (0.86, 1.18) 1.10 (0.90, 1.34)

26
Variable AM Preop MT Preop AMT Preop AM
Preop+Intraop MT
Preop+Intraop AMT
Preop+Intraop
Afib ablation vs. no ablation (in Afib patients) NC NC NC 0.81 (0.68, 0.95) 0.90 (0.76, 1.06) 0.72 (0.55, 0.96)
Aortic and Mitral procedures (versus repair, repair)
Aortic repair, Mitral replacement NC NC NC 0.76 (0.37, 1.59) NC NC
Aortic replacement, Mitral repair NC NC NC 0.79 (0.52, 1.21) NC NC
Aortic replacement, Mitral replacement NC NC NC 1.32 (0.86, 2.01) NC NC
Mitral and Tricuspid procedures (versus repair, repair)
Mitral repair, Tricuspid replacement NC NC NC NC 2.24 (1.39, 3.60) NC
Mitral replacement, Tricuspid repair NC NC NC NC 1.42 (1.22, 1.65) NC
Mitral replacement, Tricuspid replacement NC NC NC NC 2.05 (1.50, 2.81) NC
Aortic, Mitral and Tricuspid procedures
Aortic replacement (versus repair) NC NC NC NC NC 0.87 (0.47, 1.60)
Mitral replacement (versus repair) NC NC NC NC NC 1.28 (1.03, 1.59)
Tricuspid replacement (versus repair) NC NC NC NC NC 1.31 (0.92, 1.88) aReported odds ratio for age represents effect in patients whose status were elective and without prior operations. bReported odds ratio for emergent status represents effect in patients 50 years old. cReported odds ratio for reoperation represents effect in patients 50 years old. (ref) indicates subgroup is merged into the reference as the candidate variables are defined.
Afib = preoperative atrial fibrillation; AM = aortic-mitral; BSA = body surface area; AMT = aortic-mitral-tricuspid; CHF = congestive heart failure; CV = cardiovascular; CVA = cerebrovascular accident (stroke); CVD = cerebrovascular disease; EF = ejection fraction; IABP = intra-aortic balloon pump; MI = myocardial infarction; MT = mitral-tricuspid; NC = not a candidate; NYHA = New York Heat Association.

27
Appendix Table D: Regression Coefficients of Final Stepwise Models Preop Preop + Intraop
AM MT AMT AM MT AMT
Intercept -‐4.515051 -‐5.299773 -‐4. 388223 -‐4.754703 -‐5.325053 -‐4.735681
Active Infections endocarditis 0.665872 NS NS 0.569136 NS NA
Afib ablation NC NC NC -‐0.164310 NS -‐0.262531
Age by reoperation function -‐0.014497 -‐0.013014 NC -‐0.015201 NC NC
Age function 1 NC NC 0.017561 NC NC 0.020484
Age function 2 0.032137 0.033223 NC 0.033377 0.029530 NC
Aortic and mitral replacements NC NC NC 0.520321 NC NC
Aortic insufficiency, at least moderate -‐0.084596 0.270068 NS -‐0.081360 0.250907 NS
Aortic stenosis 0.191954 NS NS 0.222723 NS NS
BSA function 1 -‐0.913553 -‐1.022723 NS -‐0.885707 -‐0.980693 NS
BSA function 2 1.922609 1.726040 NS 1.947127 1.697886 NS
CHF and NYHA IV 0.556843 0.446420 0.543116 0.542992 0.436354 0.526573
CHF but not NYHA IV 0.130967 NS NS 0.123779 NS NS
Chronic lung disease, mild or moderate 0.131439 NS NS 0.134322 NS NS
Chronic lung disease, severe 0.471134 0.341147 0.459010 0.467877 0.351191 0.431054
Concomitant CABG 0.432559 0.282039 0.388643 0.442838 0.293072 0.410346
Creatinine function 1 NS 1.006715 0.517765 NS 0.964149 0.519512
Creatinine function 2 0.944258 NS NC 0.938136 NS NC
Creatinine function 3 -‐0.748339 -‐0.677222 NC -‐0.743395 -‐0.634013 NC
CVD NS 0.249567 NC NS 0.250440 NC
Diabetes, insulin 0.361806 0.228334 0.425895 0.357971 0.229544 0.413794
Diabetes, non-‐insulin 0.125724 0.228334 NS 0.135430 0.229544 NS
Dialysis 0.378615 0.557590 NS 0.360251 0.528482 NS

28
Ejection fraction function NS -‐0.007388 NS NS -‐0.010457 NS
Female 0.349015 NS NC 0.322833 NS NC
Female by BSA function 1 0.736923 NS NC 0.726381 NS NC
Immunosuppressive treatment 0.389429 0.359168 NC 0.386145 0.369129 NC
Mitral insufficiency, at least moderate NS -‐0.232722 NS NS -‐0.242037 NS
Mitral replacement NC NC NC NS 0.372739 0.341860
Mitral stenosis 0.271795 0.219442 NS NS NS NS
Preoperative IABP or Inotrope 0.477936 0.291596 NS 0.477381 NS NS
Prior CV operation 0.796906 0.713775 0.414991 0.789676 0.395824 0.370365
Prior MI 1 to 21 days 0.224411 NS NC 0.256165 0.317806 NC
Prior MI <24 hours 0.224411 0.998745 NC 0.256165 1.119814 NC
PVD 0.242246 0.216727 NS 0.249515 0.206665 NS
Cardiogenic shock NS 0.512578 NC NS 0.593779 NC
Status, emergent 0.716239 0.985924 NC 0.709347 0.955014 NC
Status, emergent or salvage or shock NC NC 0.878336 NC NC 0.871090
Status, salvage 1.362575 0.985924 NC 1.355095 0.955014 NC
Status, urgent 0.089696 0.343576 0.195183 0.083647 0.313965 0.189849
Tricuspid insufficiency, at least moderate 0.176221 NS NS 0.173983 NS NS
Tricuspid replacement NC NC NC NC 0.469732 NS
Afib = preoperative atrial fibrillation; AM = aortic-‐mitral; BSA = body surface area; AMT = aortic-‐mitral-‐tricuspid; CHF = congestive heart failure; CV = cardiovascular;CVD = cerebrovascular disease; EF = ejection fraction; IABP = intra-‐aortic balloon pump; MI = myocardial infarction; MT = mitral-‐tricuspid; NC = not a candidate; NS = not selected in the model; NYHA = New York Heat Association; PVD = peripheral vascular disease.

29
Appendix Table E: Definitions of Variables Appearing in Final Stepwise Models
Variable Definition
Intercept = 1 for all patients
Active Infections endocarditis = 1 if patient has active endocarditis, = 0 otherwise
Afib/ablation = 1 if patient had afib symptoms within 2 weeks and their operation includes an afib ablation procedure, = 0 otherwise
Age by reoperation function = Age function 2 if patient had at least 1 prior CV operation, = 0 otherwise
Age function 1 = max(min(age,85),40)
Age function 2 = max(age function 1 -‐ 50, 0)
Aortic and mitral replacements = 1 if patient’s aortic and mitral procedures are replacements, = 0 otherwise
Aortic insufficiency, at least moderate = 1 if patient has at least moderate aortic insufficiency, = 0 otherwise
Aortic stenosis = 1 if patient has aortic stenosis, = 0 otherwise
BSA function 1 = max(min(BSA,2.6),1.4) -‐ 1.8
BSA function 2 = (BSA function 1) x (BSA function 1)
CHF and NYHA IV = 1 if patient has CHF and is NYHA class IV, = 0 otherwise
CHF but not NYHA IV = 1 if patient has CHF and is not NYHA class IV, = 0 otherwise
Chronic lung disease, mild or moderate = 1 if patient has mild or moderate chronic lung disease, = 0 otherwise
Chronic lung disease, severe = 1 if patient has severe chronic lung disease, = 0 otherwise
Concomitant CABG = 1 if operation includes CABG, = 0 otherwise
Creatinine function 1 = min(max(creatinine, 0.5), 5.0) if patient is not on dialysis, = 2.5 otherwise
Creatinine function 2 = max(creatinine function 1-‐1.0, 0)
Creatinine function 3 = max(creatinine function 1-‐1.5, 0)
CVD = 1 if patient has history of cerebrovascular disease, = 0 otherwise
Diabetes, insulin = 1 if patient has diabetes treated by insulin, = 0 otherwise
Diabetes, non-‐insulin = 1 if patient has diabetes not treated by insulin, = 0 otherwise
Dialysis = 1 if patient requires dialysis preoperatively, = 0 otherwise
Ejection fraction function = min(ejection fraction-‐50, 0)

30
Female = 1 if patient is female, = 0 otherwise
Female by BSA function 1 = BSA function 1 if female, = 0 otherwise
Immunosuppressive treatment = 1 if patient was given immunosuppressive therapy within 30 days of operation,
= 0 otherwise
Mitral insufficiency, at least moderate = 1 if patient has at least moderate mitral insufficiency, = 0 otherwise
Mitral replacement = 1 if patient’s mitral procedure is a replacement, = 0 otherwise
Mitral stenosis = 1 if patient has mitral stenosis, = 0 otherwise
Preoperative IABP or Inotrope = 1 if patient requires IABP or inotropes preoperatively, = 0 otherwise
Prior CV operation = 1 if patient has had at least 1 prior cardiovascular operation, = 0 otherwise
Prior MI <24 hours = 1 if history of MI <24 hours prior to operation, = 0 otherwise
Prior MI 1 to 21 days = 1 if history of MI 1 to 21 days prior to operation, = 0 otherwise
PVD = 1 if patient has peripheral vascular disease, = 0 otherwise
Cardiogenic shock = 1 if patient was in shock at time of procedure, = 0 otherwise
Status, emergent = 1 if status is emergent, = 0 otherwise
Status, emergent or salvage or shock = 1 if status is emergent or salvage or patient was in shock at time of procedure,
= 0 otherwise
Status, salvage = 1 if status is salvage, = 0 otherwise
Status, urgent = 1 if status is urgent, = 0 otherwise
Tricuspid insufficiency, at least moderate = 1 if patient has at least moderate tricuspid insufficiency, = 0 otherwise
Tricuspid replacement = 1 if patient’s tricuspid procedure is a replacement, = 0 otherwise
Afib = preoperative atrial fibrillation; AM = aortic-‐mitral; BSA = body surface area; AMT = aortic-‐mitral-‐tricuspid; CHF = congestive heart failure; CV = cardiovascular;CVD = cerebrovascular disease; EF = ejection fraction; IABP = intra-‐aortic balloon pump; MI = myocardial infarction; MT = mitral-‐tricuspid; NA = variance not applicable to this model; NYHA = New York Heat Association; PVD = peripheral vascular disease.

31
Figure and Figure Legend
Figure 1: Calibration curves for AM, MT, and AMT analyses. “Preoperative” models are on the left, and “Preoperative + Intraoperative” models on the right.

32
Abbreviations
A = Aortic
ACSD = Adult Cardiac Surgery Database
CABG = Coronary Artery Bypass Grafting
EF = Ejection Fraction
M = Mitral
MUV = Multiple Valve
NYHA = New York Heart Association
QMTF = Quality Measurement Task Force
ROC = Receiver Operating Characteristic
STS = Society of Thoracic Surgeons
T = Tricuspid