The Social Security Administration’s Youth Transition ... YTD Report...The Social Security...
194
The Social Security Administration’s Youth Transition Demonstration Projects: Interim Report on Broadened Horizons, Brighter Futures December 3, 2012 Thomas Fraker Todd Honeycutt Arif Mamun Michelle Manno John Martinez Bonnie O’Day Debbie Reed Allison Thompkins
-
Upload
truonghanh -
Category
Documents
-
view
213 -
download
0
Transcript of The Social Security Administration’s Youth Transition ... YTD Report...The Social Security...

The Social Security
Administration’s Youth Transition
Demonstration Projects: Interim
Report on Broadened Horizons,
Brighter Futures
December 3, 2012
Thomas Fraker Todd Honeycutt Arif Mamun Michelle Manno John Martinez Bonnie O’Day Debbie Reed Allison Thompkins

Contract Number: SS00-05-60084
Mathematica Reference Number: 06209.125
Submitted to: Social Security Administration Office of Program Development and Research 500 E St., SW, Room 905 Washington, DC 20254 Telephone: (202) 358-6509 Facsimile: (202) 358-6505 Project Officer: Joyanne Cobb
Submitted by: Mathematica Policy Research 1100 1st Street, NE 12th Floor Washington, DC 20002-4221 Telephone: (202) 484-9220 Facsimile: (202) 863-1763 Project Director: Thomas Fraker
The Social Security
Administration’s Youth
Transition Demonstration
Projects: Interim Report on
Broadened Horizons, Brighter
Futures
December 3, 2012
Thomas Fraker Todd Honeycutt Arif Mamun Michelle Manno John Martinez Bonnie O’Day Debbie Reed Allison Thompkins


v
CONTENTS
ACRONYMS ................................................................................................................ xv
EXECUTIVE SUMMARY ............................................................................................... xvii
I INTRODUCTION ............................................................................................. 1
A. The YTD Conceptual Framework .............................................................. 2
B. The YTD Evaluation ................................................................................. 5
C. The Broadened Horizons, Brighter Futures Project ................................... 7
D. Research Objectives for this Report ......................................................... 8
II STUDY DESIGN, METHODS, AND DATA SOURCES .......................................... 11
A. Impact Analysis ..................................................................................... 11
1. Outcome Measures ......................................................................... 11 2. Sample Selection and Recruitment .................................................. 14 3. Data Sources and Analytic Sample .................................................. 17 4. Estimating Overall Impacts ............................................................. 21 5. Estimating Subgroup Impacts ......................................................... 22 6. Other Analytic Considerations ........................................................ 23
B. Process Analysis .................................................................................... 24
1. Analytic Approach .......................................................................... 24 2. Data Sources and Sample ................................................................ 25
III IMPLEMENTATION OF BROADENED HORIZONS, BRIGHTER FUTURES .............. 29
A. Overview of the Sponsoring Organization and Its Partners ..................... 29
B. Local Context and Infrastructure ........................................................... 31
1. County Socioeconomic Characteristics ............................................ 31 2. Existing Services for People with Disabilities ................................... 31 3. Gaps in Existing Services ................................................................ 33
C. Organization and Staffing of BHBF ......................................................... 34
Interim Report on Broadened Horizons, Brighter Futures Contents
vi
III (continued)
D. BHBF Services ........................................................................................ 36
1. Enrollment ...................................................................................... 36 2. Person-Centered Planning .............................................................. 38 3. Benefits Planning and Financial Literacy .......................................... 39 4. Career Preparation .......................................................................... 40 5. Case Management .......................................................................... 40 6. Work-Based Experiences and Job Development ............................... 41 7. Follow-Up Services ......................................................................... 42
E. Enrollment in BHBF ................................................................................ 43
1. Enrolling Youth in Project Services .................................................. 43 2. Characteristics of Participants and Non-Participants ....................... 45
F. Receipt of BHBF Services ........................................................................ 47
1. PCP Development ........................................................................... 47 2. Types of Services Received ............................................................. 48 3. The Timing of Services ................................................................... 55 4. The Intensity of Services ................................................................. 56
G. Changes in Service Receipt over Time .................................................... 58
H. Youth Satisfaction with Services ............................................................. 60
I. Summary and Implementation Lessons and Challenges ......................... 61
IV IMPACTS ON USE OF EMPLOYMENT SERVICES AND OTHER SERVICES ............. 65
A. BHBF Increased the Use of Employment Services .................................... 66
B. BHBF Led to Increases in the Amount of All Services Used ...................... 68
C. BHBF Did Not Increase Understanding of the Relationship Between Benefits and Employment ...................................................................... 70
D. BHBF Had Mixed Impacts on the Types of Service Providers Used ........... 73
E. Impacts on the Use of Employment Services Did Not Vary Across Subgroups ............................................................................................. 75
V IMPACTS ON EMPLOYMENT AND EARNINGS .................................................. 77
A. BHBF Increased Paid Employment .......................................................... 77
B. BHBF Had Some Positive Impacts on Hours of Work and Earnings ........... 81
Interim Report on Broadened Horizons, Brighter Futures Contents
vii
V (continued)
C. BHBF Had Small Impacts on Job Characteristics ...................................... 85
D. The Impact on Employment Was Consistent Across Subgroups .............. 87
E. Descriptive Analysis of Job Characteristics and Job Search Activities ...... 88
VI IMPACTS ON EDUCATION ............................................................................. 91
A. BHBF Had No Impact on Education Outcomes ........................................ 91
B. BHBF Had No Impact on Education for Key Subgroups............................ 93
VII IMPACTS ON YOUTH INCOME, SSA BENEFITS, AND RELATED OUTCOMES ...... 95
A. BHBF Increased the Amount of Youth Income and the Fraction of Income from Earnings ........................................................................... 95
B. BHBF Had Little Impact on the Use of SSA Work Incentives ................... 100
C. BHBF Had No Impacts on Health Insurance Coverage or Receipt of Public Assistance ................................................................................. 101
D. BHBF’s Impact on Youth Income Did Not Vary by Subgroup ................. 103
VIII IMPACTS ON ATTITUDES AND EXPECTATIONS ............................................ 105
A. BHBF Had No Impact on Goals for Future Work and Earnings ............... 106
B. BHBF Had No Impacts on Independence, Decision Making, and Social Interactions ............................................................................... 109
C. BHBF Had No Impact on Goals for Future Work and Earnings for Any Subgroup...................................................................................... 109
IX EXPLORATORY ANALYSES OF IMPACTS ON TRAINING AND PRODUCTIVE ACTIVITIES ................................................................................................. 113
A. BHBF Had Positive Impacts on Training ................................................ 113
B. BHBF Had a Positive Impact on Participation in Productive Activities ..... 115
X CONCLUSION ............................................................................................. 117
REFERENCES ............................................................................................................. 119
APPENDIX A: ADDITIONAL ANALYSES AND TECHNICAL DISCUSSION
APPENDIX B: THE SSA WAIVERS FOR YTD


ix
TABLES
ES.1 Estimated Impacts of BHBF on the Use of Services ................................. xxi
ES.2 Estimated Impacts of BHBF on Employment and Other Key Outcomes in the Year Following Random Assignment .......................... xxii
II.1 Primary and Supplementary Outcomes................................................... 13
II.2 Baseline Characteristics of Analytic Sample ............................................ 19
II.3 Sample Size by Subgroup ...................................................................... 23
II.4 Data Sources for the Process Analysis .................................................... 27
III.1 Characteristics of the Service Environment for BHBF .............................. 32
III.2 Staff Efforts to Enroll Treatment Group Members in BHBF ...................... 44
III.3 Baseline Characteristics of Treatment Group Members Who Did/Did Not Participate in BHBF ............................................................. 46
III.4 Receipt of BHBF Services ........................................................................ 49
III.5 Percentage of BHBF Participants Who Used SSA Work Incentives and Waivers ........................................................................................... 51
III.6 Timing of BHBF Services ........................................................................ 56
III.7 Intensity of BHBF Services ...................................................................... 57
III.8 Use of BHBF Services by Random Assignment Cohort ............................. 59
III.9 Satisfaction with BHBF Services Among Participants ............................... 61
IV.1 Use of Employment-Promoting Services and Non-Employment Services ................................................................................................. 67
IV.2 Amount of Services Used and Unmet Service Needs ............................... 69
IV.3 Knowledge and Sources of Information on SSA Requirements and Work Incentives ..................................................................................... 72
IV.4 Use of Services, by Type of Provider ...................................................... 74
IV.5 Use of Any Employment-Promoting Service, by Subgroup ...................... 76
V.1 Employment and Number of Jobs .......................................................... 78
V.2 Total Hours Worked ............................................................................... 82
V.3 Earnings from Employment .................................................................... 84

Interim Report on Broadened Horizons, Brighter Futures Tables
x
V.4 Job Tenure, Hours of Work, Hourly Wage, and Benefits in the Primary Paid Job .................................................................................... 86
V.5 Ever Employed in Paid Job During the First Year After Random Assignment, by Subgroup ...................................................................... 88
V.6 Types of Paid Jobs Most Frequently Reported by Treatment Group Members with Paid Employment ............................................................ 89
VI.1 Educational Progress ............................................................................. 92
VI.2 School Enrollment or Completion of High School, by Subgroup .............. 94
VII.1 Youth Total Income ............................................................................... 96
VII.2 Receipt and Amount of SSA Benefits) ..................................................... 98
VII.3 Use of SSA Work Incentives .................................................................. 101
VII.4 Health Insurance Coverage and Receipt of Other Public Assistance ........................................................................................... 102
VII.5 Youth Total Income—Earnings and SSA Benefits, by Subgroup ............. 103
VIII.1 Expectations and Self-Efficacy ............................................................. 107
VIII.2 Independent Activities, Decision Making, and Social Interactions ......... 110
VIII.3 Goals Include Working and Earning Enough to Stop Receiving Social Security Benefits, by Subgroup ................................................... 111
IX.1 Participation in Training Programs ....................................................... 114
IX.2 Composite Measure of Participation in Productive Activities ................. 115
A.1 Characteristics, by Enrollment in the Evaluation ....................................A.2
A.2 Additional Baseline Characteristics of the Analytic Sample ....................A.4
A.3 Baseline Characteristics of the Research Sample ...................................A.6
A.4 Control Variables for Regression-Adjusted Analysis of Impacts ............A.8
A.5 Descriptive Statistics on Outcomes by Treatment Status and Unadjusted Estimated Impacts ..............................................................A.9
A.6 Difference in Simple Means Versus Regression-Adjusted Means for Primary Outcomes .........................................................................A.21
A.7 Baseline Characteristics for Respondents and Non-Respondents ........A.22
A.8 Annual SSA Benefit Receipt for Respondents and Non-Respondents ......................................................................................A.24

Interim Report on Broadened Horizons, Brighter Futures Tables
xi
A.9 Impacts on Outcomes Measured with Administrative Records, Respondent and Full Sample ...............................................................A.25
A.10 Average SSA Benefit Amount, by Months Before and After Random Assignment ..........................................................................A.29
A.11 Impact on Use of Employment Services, for Additional Subgroups ......A.32
A.12 Impact on Ever Employed in a Paid Job, for Additional Subgroups .......A.33
A.13 Impact on Ever Enrolled in School or Has Completed High School, for Additional Subgroups ....................................................................A.34
A.14 Impact on Income, for Additional Subgroups ......................................A.35
A.15 Impact on Goals Include Working and Earning Enough to Stop Receiving Social Security Benefits, for Additional Subgroups ...............A.36
A.16 Self-Efficacy .......................................................................................A.39

xiii
FIGURES
I.1 Conceptual Framework for SSA’s YTD Projects ......................................... 3
II.1 Intake Flow Diagram for Broadened Horizons, Brighter Futures .............. 16
III.1 Participant Flow Through BHBF .............................................................. 37
V.1 Employment Rate, by Month Following Random Assignment .................. 80
V.2 Cumulative Employment Rate, by Month Following Random Assignment ........................................................................................... 81
V.3 Hours Worked per Week, by Month Following Random Assignment ........................................................................................... 83
V.4 Earnings, by Month Following Random Assignment ............................... 85
VII.1 Youth Income by Month Following Random Assignment ........................ 97
VII.2 SSA Benefit Amount by Month Following Random Assignment ............... 99
A.1 Average SSA Benefit Amount by Months Before and After Random Assignment ........................................................................................A.28
A.2 Any SSA Benefit Receipt, by Months Before and After Random Assignment ........................................................................................A.30


xv
ACRONYMS
ADD = attention deficit disorder
APD = Agency for Persons with Disabilities
AWIC = area work incentives coordinator
BHBF = Broadened Horizons, Brighter Futures
BLS = Bureau of Labor Statistics
BOND = Benefit Offset National Demonstration
CDB = Childhood Disability Benefits
CDR = continuing disability review
CEDS = community employment development specialist
CPI-W = consumer price index for urban wage earners and clerical workers
DI = Social Security Disability Insurance
DVR = Division of Vocational Rehabilitation
EIE = earned income exclusion
ETO = Efforts-to-Outcomes, a management information system
GED = general educational development (or general equivalency diploma)
HSC = Human Services Coalition
IDA = individual development account
IEP = individualized education program
M-DCPS = Miami-Dade County Public Schools
MEF = Master Earnings File
NBS = National Beneficiary Survey
NDI = National Disability Institute
OCS = Office of Community Services
OLS = ordinary least squares
PASS = plan for achieving self-support

Interim Report on Broadened Horizons, Brighter Futures Acronyms
xvi
PCP = person-centered planning (or plan)
PSE = Partners for Self-Employment
RA = random assignment
SEIE = student earned income exclusion
SNAP = Supplemental Nutrition Assistance Program
SSA = Social Security Administration
SSI = Supplemental Security Income
TANF = Temporary Assistance for Needy Families
TRF = Ticket Research File
WIPA = Work Incentives Planning and Assistance (grant or project)
YTD = Youth Transition Demonstration

xvii
EXECUTIVE SUMMARY
The Youth Transition Demonstration (YTD) is a large-scale demonstration and evaluation sponsored by the Social Security Administration (SSA) to improve understanding of how to help youth with disabilities reach their full economic potential. In particular, SSA is interested in testing promising approaches for helping young people with disabilities become more self-sufficient and less reliant on disability benefits. The YTD conceptual framework, which was based on best practices in facilitating youth transition, specified that the six projects that participated in the evaluation provide employment services (emphasizing paid competitive employment), benefits counseling, links to services available in the community, and other assistance to youth with disabilities and their families. Additionally, the youth who received those services were eligible for SSA waivers of certain benefit program rules, which allowed them to retain more of their disability benefits and health insurance while they worked for pay. Using a rigorous random assignment methodology, the YTD evaluation team is assessing whether these services and incentives were effective in helping youth with disabilities achieve greater independence and economic self-sufficiency.1
In this report, we present first-year evaluation findings for Broadened Horizons, Brighter Futures (BHBF), which served youth ages 16 through 22 in Miami-Dade County, Florida, who were Social Security disability beneficiaries. While it will take several more years before we fully observe the transitions that the participants in this study make to adult life, early data from the evaluation provide rich information on how BHBF operated and the differences it made in key outcomes for youth. Specifically, the report includes findings from our process analysis of BHBF, including a description of the program model, and documentation of how the project was implemented and services were delivered. The report also includes impact findings, based on data collected 12 months after youth entered the evaluation, on the use of services, paid employment, educational progress, income from earnings and benefits, and attitudes and expectations.
The earliest of the evaluation projects began operations in 2006 and ended in 2009. The latest started in 2008 and ended in 2012.
In brief, we learned that BHBF was well implemented and had statistically significant impacts on several important outcomes during the year following random assignment. Through the process analysis, we learned that BHBF enrolled 84 percent of eligible youth as participants in the project and provided all of the participants with at least some services. We also found that those services conformed to the YTD program model and focused on person-centered planning, employment, financial literacy, benefits planning, and case management to resolve barriers to employment. On average, enrollees received 29 hours of services, just under half of which were employment related, such as the development of work experiences, job placement, and job coaching. The impact analysis found that youth who had been given the opportunity to participate in BHBF were more likely to have used services to promote employment and to have been employed for pay than in the absence of the intervention. BHBF also had a positive impact on youth income from earnings and benefits, combined. However, the project had no impacts on youth expectations for the future or a composite measure of school enrollment or high school completion.
1 In 2005, under SSA contract #SS00-05-60084, Mathematica Policy Research, a nonpartisan firm that conducts policy research and surveys, and its partner organizations, MDRC and TransCen, Inc., were awarded a contract to design and conduct the YTD evaluation and provide technical assistance to projects as they developed and implemented their interventions. The evaluation is advised by a technical working group consisting of young adults with disabilities, providers of services to teenagers and young adults with disabilities, policy researchers, academics, and representatives of federal agencies other than SSA.

Interim Report on Broadened Horizons, Brighter Futures Executive Summary
xviii
The Youth Transition Demonstration Evaluation
The target population for the YTD evaluation was youth ages 14 through 25 who either were receiving SSA disability benefits or at risk of receiving them in the future.2
We gathered information from a variety of sources to inform the findings in this report. We obtained information about project operations and the service environment through reviews of project documents, site visits, interviews with managers and staff, and focus group discussions with participating youth. We also examined data on enrollment of youth and service provision in BHBF’s management information system, Efforts-to-Outcomes (ETO). Data for the impact analysis came from a 12-month follow-up survey and SSA administrative records. The survey focused on outcomes such as service use, employment, earnings, education, and attitudes and expectations. SSA administrative records provided data on benefits and the use of SSA work incentives and waivers. We also collected baseline data on the period immediately prior to random assignment through a survey and SSA administrative records. The comprehensive final report on the YTD evaluation, scheduled for 2014, will use data from a survey conducted 36 months after random assignment and SSA administrative records to assess more completely the transition process and the extent to which BHBF and the other five random assignment YTD projects improved transition outcomes.
The evaluation is based on a rigorous random assignment design. Youth who agreed to participate in the evaluation were assigned at random to a treatment or control group. Youth in the treatment group were eligible to receive YTD services in addition to the SSA waivers, while those in the control group could receive only those services available in their communities, independent of the YTD initiative. The evaluation sought to enroll approximately 880 youth in each of the six project sites.
The BHBF Project
The Florida regional office of ServiceSource, a private, nonprofit organization that has served individuals with disabilities in the state since 1959, administered BHBF. The project sought to maximize economic self-sufficiency and independence for youth with severe disabilities by improving their employment outcomes. To promote this goal, the staff of BHBF provided participating youth with person-centered planning, customized employment services, benefits counseling, financial literacy training, and access to individual development accounts. They also provided participants with case management services, including referrals to other organizations for services that BHBF could not provide directly. As the project matured, case management services became more sharply focused on reducing barriers to employment.
The executive director of ServiceSource’s Florida regional office had administrative responsibility for BHBF as the project director. A full-time BHBF project manager was responsible for the day-to-day operations of BHBF, including the hiring and supervision of project staff and coordination with other service providers. A third member of the BHBF administrative team was in charge of the project’s management information system. At any point in time, between 9 and 11 project line staff located in two geographically separated offices delivered services directly to participants. Early in the project, the line staff consisted of one employment specialist, five community employment development specialists, and three benefits planners. Two additional employment specialists were added subsequently. The employment specialists focused on contacting employers and helping youth find jobs. The community employment development specialists
2 The YTD projects could opt to serve a segment of the full YTD target age range. BHBF exercised this option, choosing to serve individuals ages 16 to 22.

Interim Report on Broadened Horizons, Brighter Futures Executive Summary
xix
enrolled youth as participants in the project, conducted person-centered planning with them, provided employment-related services, and referred participants to other providers for ancillary services. The benefits specialists provided counseling to BHBF participants and their families on disability benefits, including the use of the SSA waivers for YTD, as well as other types of benefits.
From lists of beneficiaries provided by SSA, Mathematica identified youth who satisfied the BHBF age criteria and resided in Miami-Dade County. We conducted outreach to those youth and recruited them into the study, starting in March 2008 and ending in September 2010. Upon completing the baseline interview and providing written consent, we admitted the youth into the evaluation’s research sample. Mathematica randomly assigned members of the research sample to the evaluation’s treatment or control groups at approximately a six-to-five ratio, resulting in 460 treatment cases and 399 control cases.
The average age of the youth in the research sample at the time of random assignment was 19 years. This sample was 60 percent male, 52 percent black, and 42 percent Hispanic (of any race). For 64 percent of the youth in the research sample, the primary disabling condition recorded in SSA files was either learning disabilities or cognitive/developmental disabilities. Slightly more than half of the youth were enrolled in school at the time of random assignment, and about one in five had worked for pay during the prior year.
BHBF staff obtained signed application forms for 388 of the 460 randomly assigned treatment group members, which meant that those youth were formally enrolled in project services. Youth who did not provide signed application forms were ineligible for project services and the SSA waivers. The initial enrollment was in April 2008 and the final in September 2010. Enrollees were eligible for 18 months of project services, but the project continued to serve many of them well past that point.3
Implementation Findings for BHBF
The project ended in March 2012.
BHBF delivered at least some services to every youth who enrolled in the project, and the intensity of the services was high. Our analysis of data from the project’s case management system, ETO, revealed that 99 percent of participating youth received both employment and benefits planning services. A similarly large proportion of participants, 96 percent, received case management services from the project. Consistent with the absence of a distinct emphasis on education in the BHBF design, a somewhat smaller proportion of participants, 84 percent, received education services. These services were delivered quickly: the average elapsed times between enrollment and the first and second service contacts were 6 days and 14 days, respectively. During the initial 15 months following random assignment, the average BHBF participant received 49 contacts from project staff, for a total of 29 hours of services. Employment services accounted for nearly half of all service hours and benefits planning services for over a fourth of them.
BHBF’s services became more sharply focused on employment, especially paid competitive employment, as the project matured. During the project’s initial year, staff focused their efforts on general case management and pre-employment services. These may have crowded out the delivery of services more narrowly designed to help participants have paid employment experiences. Beginning early in the project’s second year, the focus of services began to shift to job development
3 Youth who enrolled in YTD project services are eligible for the SSA waivers for four years following random
assignment, or until age 22, whichever comes later. All waiver eligibility is scheduled to cease in September 2013.
Interim Report on Broadened Horizons, Brighter Futures Executive Summary
xx
through outreach to employers and the placement of youth in paid competitive jobs. This shift was prompted by technical assistance and facilitated by the use of ETO. TransCen, Inc., a subcontractor to Mathematica on the YTD evaluation, ramped up its already intense technical assistance to BHBF in the areas of job development, customized employment, and job placement. Concurrently, with assistance from the YTD evaluation team, BHBF management and staff began to use ETO more analytically and systematically to record and monitor the types and quantities of services that staff were delivering to participating youth, and to track placements in paid competitive jobs. By the time the project ended, more than 50 percent of the participants had held competitive paid jobs at some point during their involvement in the project, as recorded by staff in ETO.
The development of customized jobs for participants with especially challenging barriers to employment was a relatively weak aspect of BHBF. The “customized employment” approach to job placement, which often requires considerable experience to master, was new to most project staff. BHBF designated a specific staff member to work with such participants. TransCen provided training and encouragement to implement customized employment, which entailed negotiating with prospective employers to “carve out” new combinations of work responsibilities for project participants. Nevertheless, BHBF typically placed its participants with especially challenging barriers to employment in standard jobs for which there were existing openings. While this approach was somewhat successful, greater use of customized employment might have resulted in the placement of more such youth in jobs.
First- Year Impact Findings for BHBF
We estimated the impacts of BHBF on outcomes in five domains: (1) employment-promoting services, (2) paid employment, (3) educational progress, (4) youth income, and (5) attitudes and expectations. Within each domain, we analyzed one primary outcome and a number of secondary outcomes. The results for the primary outcomes are the basis for our principal conclusions regarding the project’s impacts in the year following random assignment.
Impacts on the Use of Services
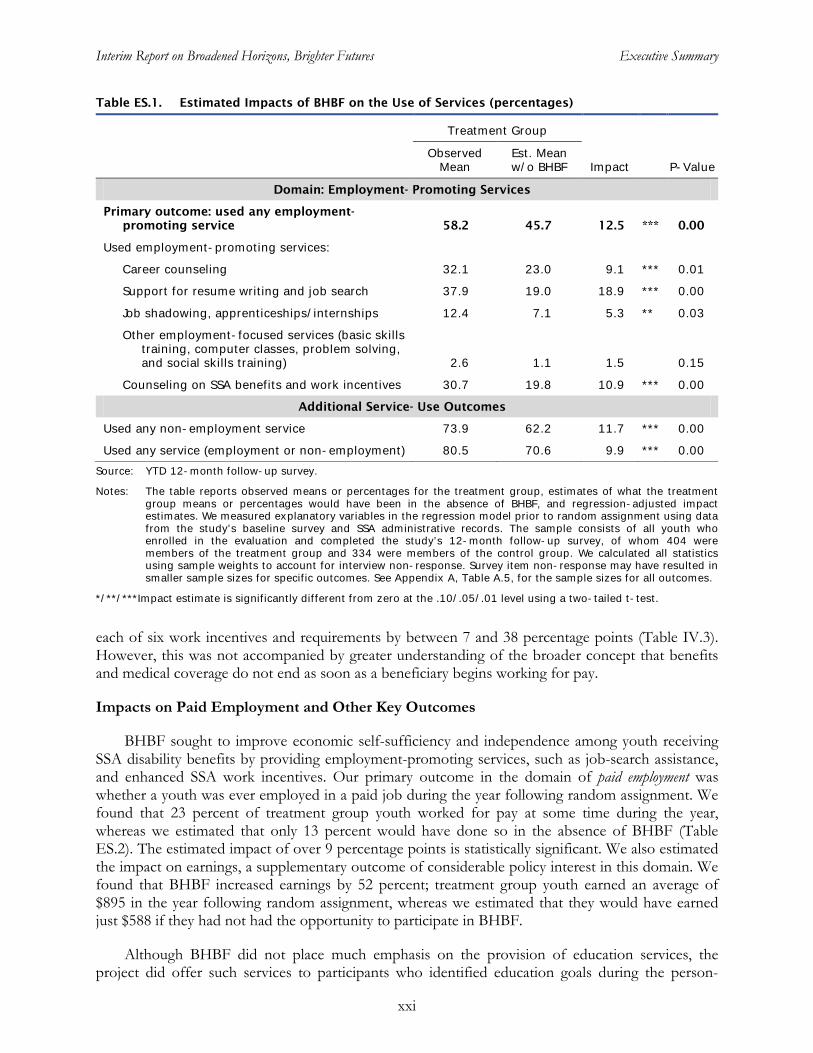
Consistent with the YTD conceptual framework, BHBF increased the use of employment-promoting services by youth with disabilities. Nearly six in ten treatment group youth reported having used any employment-promoting service in the year following random assignment (Table ES.1). We estimated that, in the absence of BHBF, less than half of these youth would have used any such service. The impact of BHBF was a 13 percentage point increase in the use of employment-promoting services. This overall impact was a product of impacts on the use of a number of specific types of employment services. The largest of these impacts were on support for resume writing and job search activities (19 percentage points) and benefits counseling (11 percentage points).
BHBF also increased participation in non-employment services, such as discussions about the youth’s interests and plans for the future, by 12 percentage points (Table ES.1). Considering all types of services, 81 percent of treatment group members reported having used any employment or non-employment service. In the absence of BHBF, we estimated that 71 percent of them would have used any service. BHBF thus increased the share of youth using any service by ten percentage points.
The previously mentioned positive impact of BHBF on the use of benefits counseling services appears to have been reflected in greater knowledge of SSA work incentives and requirements among treatment group members. We estimated that BHBF significantly increased awareness of
Interim Report on Broadened Horizons, Brighter Futures Executive Summary
xxi
Table ES.1. Estimated Impacts of BHBF on the Use of Services (percentages)
Treatment Group
Observed
Mean Est. Mean w/o BHBF Impact P-Value
Domain: Employment- Promoting Services
Primary outcome: used any employment-promoting service 58.2 45.7 12.5 *** 0.00
Used employment-promoting services:
Career counseling 32.1 23.0 9.1 *** 0.01
Support for resume writing and job search 37.9 19.0 18.9 *** 0.00
Job shadowing, apprenticeships/internships 12.4 7.1 5.3 ** 0.03
Other employment-focused services (basic skills training, computer classes, problem solving, and social skills training) 2.6 1.1 1.5 0.15
Counseling on SSA benefits and work incentives 30.7 19.8 10.9 *** 0.00
Additional Service- Use Outcomes
Used any non-employment service 73.9 62.2 11.7 *** 0.00
Used any service (employment or non-employment) 80.5 70.6 9.9 *** 0.00 Source: YTD 12-month follow-up survey.
Notes: The table reports observed means or percentages for the treatment group, estimates of what the treatment group means or percentages would have been in the absence of BHBF, and regression-adjusted impact estimates. We measured explanatory variables in the regression model prior to random assignment using data from the study’s baseline survey and SSA administrative records. The sample consists of all youth who enrolled in the evaluation and completed the study’s 12-month follow-up survey, of whom 404 were members of the treatment group and 334 were members of the control group. We calculated all statistics using sample weights to account for interview non-response. Survey item non-response may have resulted in smaller sample sizes for specific outcomes. See Appendix A, Table A.5, for the sample sizes for all outcomes.
*/**/***Impact estimate is significantly different from zero at the .10/.05/.01 level using a two-tailed t-test.
each of six work incentives and requirements by between 7 and 38 percentage points (Table IV.3). However, this was not accompanied by greater understanding of the broader concept that benefits and medical coverage do not end as soon as a beneficiary begins working for pay.
Impacts on Paid Employment and Other Key Outcomes
BHBF sought to improve economic self-sufficiency and independence among youth receiving SSA disability benefits by providing employment-promoting services, such as job-search assistance, and enhanced SSA work incentives. Our primary outcome in the domain of paid employment was whether a youth was ever employed in a paid job during the year following random assignment. We found that 23 percent of treatment group youth worked for pay at some time during the year, whereas we estimated that only 13 percent would have done so in the absence of BHBF (Table ES.2). The estimated impact of over 9 percentage points is statistically significant. We also estimated the impact on earnings, a supplementary outcome of considerable policy interest in this domain. We found that BHBF increased earnings by 52 percent; treatment group youth earned an average of $895 in the year following random assignment, whereas we estimated that they would have earned just $588 if they had not had the opportunity to participate in BHBF.
Although BHBF did not place much emphasis on the provision of education services, the project did offer such services to participants who identified education goals during the person-

Interim Report on Broadened Horizons, Brighter Futures Executive Summary
xxii
Table ES.2. Estimated Impacts of BHBF on Employment and Other Key Outcomes in the Year Following Random Assignment (percentages, unless otherwise noted)
Treatment Group
Observed
Mean Est. Mean w/o BHBF Impact P-Value
Domain: Paid Employment
Primary outcome: ever employed in paid job 22.8 13.4 9.4 *** 0.00
Total earningsa, b $895 $588 $306 * 0.07
Domain: Educational Progress
Primary outcome: ever enrolled in school, or had completed high school by the end of the year 81.6 84.0 - 2.5 0.37
Domain: Youth Income
Primary outcome: total income (earnings and SSA benefits)a, b $6,762 $6,388 $424 * 0.07
Number of months of benefit receipt 9.5 8.9 0.6 ** 0.01
Total SSA benefit amount $5,766 $5,455 $312 ** 0.04
Domain: Attitudes and Expectations
Primary outcome: youth agrees that personal goals include working and earning enough to stop receiving Social Security benefits 70.1 72.2 - 2.2 0.59
Sources: YTD 12-month follow-up survey and SSA administrative records.
Notes: The table reports observed means or percentages for the treatment group, estimates of what the treatment group means or percentages would have been in the absence of BHBF, and regression-adjusted impact estimates. We measured explanatory variables in the regression model prior to random assignment using data from the study’s baseline survey and SSA administrative records. For the two outcomes specific to SSA benefits (benefit receipt and benefit amount), the sample consists of all youth who enrolled in the evaluation (less 9 who died during the year following random assignment), of whom 454 were members of the treatment group and 396 were members of the control group. For all other outcomes, the sample consists of all youth who enrolled in the evaluation and completed the study’s 12-month follow-up survey, of whom 404 were members of the treatment group and 334 were members of the control group. We calculated statistics for the survey-based outcomes using sample weights to account for interview non-response. Survey item non-response may have resulted in smaller sample sizes for specific outcomes. See Appendix A, Table A.5, for the sample sizes for all outcomes.
aFor these outcomes, item non-response occurred conditionally, depending on the values of other measures in the follow-up survey. The rate of missing data is 4.6 percent for both earnings and income. We used a multiple imputation procedure to assign values when they were missing. See Appendix A, Section E, for more information on this procedure. bThe average includes youth who were not employed during the year following random assignment.
*/**/***Impact estimate is significantly different from zero at the .10/.05/.01 level using a two-tailed t-test.
centered planning process or subsequently requested such services. In the domain of educational progress, we estimated that 82 percent of the treatment group members either had completed high school by the time of the survey or been enrolled in school during the previous year (the primary outcome in this domain), but that BHBF was not a significant determinant of that percentage.
In the domain of youth income, we found that BHBF had a positive impact on the primary outcome: total youth income from earnings and SSA benefits (combined) during the year following random assignment. The impact of $424 per year represents an increase of seven percent over the income that treatment group youth would have received if they had not had the opportunity to participate in BHBF. We have noted that the project had a positive impact on earnings. It also had
Interim Report on Broadened Horizons, Brighter Futures Executive Summary
xxiii
statistically significant positive impacts on the amount of disability benefits received by youth during the year following random assignment and on the number of months of recipiency.
Finally, we found that BHBF had no impact on the primary outcome in the domain of attitudes and expectations. Table ES.2 shows that seven in ten treatment group youth agreed that their personal goals included working and earning enough to stop receiving disability benefits. However, we estimated that this proportion essentially would have been the same in the absence of the intervention.
Conclusion
BHBF delivered a statistically significant supplement to the services that youth with disabilities in Miami-Dade County received from other sources. On average, participants in the intervention received 29 hours of BHBF services of all types, of which nearly half were designed to directly improve employment outcomes, in keeping with the purpose of the project. Although BHBF staff provided employment services over the full life of the project, they were especially focused on developing work experiences for participating youth and placing them in paid competitive jobs during the second half of the project’s period of performance. Our impact analysis revealed that the rate of employment in paid jobs by treatment group members during the year following random assignment was significantly higher, by nine percentage points, than it would have been in the absence of the project. This was accompanied by a seven percent increase in total income from earnings and benefits. However, the intervention had no impacts on primary outcomes in the domains of educational progress and expectations. Whether these findings of short-term impacts will prove to be precursors of longer-term impacts, in the form of higher earnings and lower benefits resulting in higher total income, will be assessed in subsequent analyses of additional follow-up data.
It is important to recognize that this report has presented interim impact estimates based on data pertaining to the first year in the evaluation’s multiyear follow-up period. More than half of the youth in the research sample were still in school during that period and so had limited opportunities to work and achieve other milestones of independence. Furthermore, the BHBF participants still were eligible to receive follow-on project services at the time they completed the 12-month interview. Interim evaluation findings from the other five random assignment YTD projects will enable us to extend the initial assessments presented in this report. Interim reports on three of those projects were completed in 2011, while the interim reports on the remaining two projects, along with this report on BHBF, will be completed in 2012. As planned, the projects vary in the mix and intensity of services while broadly adhering to the YTD program model. We thus expect that the full set of six interim evaluation reports will provide SSA with a better understanding of the challenges that youth with disabilities face in transitioning to employment and independence and the specific types of interventions that might assist more of them to succeed. Furthermore, the YTD evaluation’s comprehensive final report will present impact estimates based on 36 months of follow-up data from all six of the random assignment projects. Our analyses of those data may reveal longer-term impacts of BHBF in addition to the short-term impacts reported here.


1
I. INTRODUCTION
Youth with disabilities often face a particularly difficult transition to adulthood. In addition to the host of issues facing all transition-age youth, those with disabilities face special challenges related to health, social isolation, service needs, and lack of access to supports. These challenges complicate their planning for education, work, and adult life in general. Many of these youth experience poor educational and employment outcomes, high risk of dependency on public benefits, and a lifetime of poverty. Despite broad recognition of these challenges and poor outcomes (Loprest and Wittenburg 2005, 2007), little is known about how best to help transitioning youth with disabilities improve their employment and earnings opportunities in adulthood.
To understand more fully how to help youth with disabilities reach their economic potential, the Social Security Administration (SSA) initiated the Youth Transition Demonstration (YTD) evaluation. The purpose of the evaluation is to find and test the most promising service strategies for helping youth with disabilities maximize their economic self-sufficiency as they transition from school to work. SSA also is interested in testing the effectiveness of altering certain benefit program rules as an incentive to encourage youth with disabilities to initiate work or increase their work activity to increase earnings. The target population for YTD is youth ages 14 to 25 who currently receive SSA disability benefits or are at risk of receiving such benefits.4
Using a rigorous random assignment methodology, the YTD evaluation examines the extent to which the various work-promoting services and incentives help youth with disabilities achieve greater economic self-sufficiency as they transition to adulthood.
5
As part of the YTD evaluation, Mathematica Policy Research and its subcontractors are conducting site-specific interim studies to examine implementation of the intervention and assess the short-term impacts during the year after youth were offered demonstration services. In this report, we present the first set of findings for the Broadened Horizons, Brighter Futures (BHBF)
Under YTD, SSA (with input from the evaluation contractor) selected six project sites for evaluation based on their adoption of promising strategies to support youth with disabilities. The earliest of these projects began operations in 2006 and ended in 2009. The latest started in 2008 and ended in 2012. The YTD projects focused on youth empowerment, self-sufficiency, employment, and earnings, and provided employment services, benefits counseling, links to services in the broader community, and other family and youth supports. In addition, SSA provided special waivers for YTD to improve work incentives by allowing participating youth to retain more of their disability benefits and health insurance in the short term while they worked or engaged in work-based experiences.
4 The SSA disability population eligible for YTD included beneficiaries of the following programs: child and adult
Supplemental Security Income (SSI), Social Security Disability Insurance (DI), and Childhood Disability Benefits (CDB). SSI is a means-tested program in which eligibility is based on severe functional limitations (for child SSI benefits) or a medically determined disability that prevents substantial gainful employment (for adult SSI benefits). DI beneficiaries are individuals with an earnings history and a disability that prevents substantial gainful employment. CDB beneficiaries must be age 18 or older, have a disabling condition with an onset before age 22, and a parent receiving Social Security benefits (see Rangarajan et al. 2009a, pp. 18–19).
5 Under SSA contract #SS00-05-60084, Mathematica Policy Research, a nonpartisan firm that conducts policy research and surveys, assembled a multidisciplinary team, including key partner organizations MDRC and TransCen, Inc., to design and conduct the YTD evaluation and provide technical assistance to the projects as they developed and implemented their YTD interventions. The YTD project is advised by a technical working group that has reviewed the evaluation design (Rangarajan et al. 2009a).
Interim Report on Broadened Horizons, Brighter Futures Chapter I: Introduction
2
YTD project in Miami-Dade County, Florida. We provide both a detailed explanation of the BHBF intervention and an in-depth discussion of how this project was implemented, including its fidelity to the intended demonstration model. We also provide estimates of the impacts of the project on the receipt of services by youth and short-term outcomes, such as increased participation in paid employment, advancement in education, higher income from earnings and benefits, and a stronger sense of self-efficacy. In this evaluation’s comprehensive final report, we will assess longer-term effects of this and the other five random assignment YTD projects on the transition to adult life, particularly in terms of improved employment and income.
We begin the report with an introduction to the YTD initiative, the YTD evaluation, and the BHBF project. In Chapter II, we describe our approach to conducting the process and impact analyses, including data sources, samples, key measures, and our analytic methodology. In Chapter III, we present the analysis of program implementation. In Chapters IV through IX, we present the short-term impacts on outcomes such as service use, employment, educational experiences, income, and youths’ expectations about the future. We present our conclusions from this interim research in Chapter X. In Appendices A, we present supplementary analyses and technical discussion. In Appendix B, we provide descriptions of the SSA waivers for YTD.
A. The YTD Conceptual Framework
The YTD evaluation is testing whether the provision of services and new work incentives to youth with disabilities can help young people overcome the barriers they face during their transition to adulthood. Many youth with disabilities, particularly those whose impairments are sufficiently severe to qualify them for SSA disability benefits, do not reach their full potential and instead experience high rates of unemployment, poverty, and incarceration (Loprest and Wittenburg 2007). Youth with disabilities may benefit from interventions designed to reduce the barriers they face in transitioning to adulthood.
In designing the YTD intervention, we identified several barriers to successful transitions and then drew on the existing evidence to determine promising means of addressing those barriers. In particular, earlier demonstration projects provided evidence about what has worked for serving people similar to YTD youth.6
The YTD intervention design was informed by a conceptual framework (Figure I.1) based on the research evidence and informed by SSA’s goals for the intervention. The transitions to adulthood made by youth with disabilities are shaped by the youths’ characteristics and their social, educational, and employment environments. However, several barriers may inhibit those transitions. The YTD intervention is intended to address the barriers and work within the environment of each demonstration site to facilitate better transitions.
We also drew on the Guideposts for Success, developed by the National Collaborative on Workforce and Disability for Youth (2005). In the YTD evaluation design report (Rangarajan et al. 2009a), we summarize the research evidence that forms the basis of the demonstration.
6 The U.S. Department of Labor’s Structured Training and Employment Transitional Services demonstration and
SSA’s Transitional Employment Training Demonstration provided valuable evidence for the design of the YTD intervention (Rangarajan et al. 2009a).

Interim Report on Broadened Horizons, Brighter Futures Chapter I: Introduction
3
Figure I.1. Conceptual Framework for SSA’s YTD Projects
Short Term Employment-promoting activities
Paid employment
Total income from earnings and benefits
Attitudes and expectations
Education
Longer Term Paid employment and earnings Total income from earnings and benefits Engagement in productive activities Reduced contact with the justice system Self-determination
Key Outcomes
Transition Efforts by
Youth
Transition Environment • Youth characteristics and assets • Schools, special education,
postsecondary education, and training • VR, TTW, and WIA programs • Mental health and MR/DD systems • SSA disability benefit programs • Health care delivery & financing systems • Community-based service providers • Employers and economic climate
YTD Intervention Components • Individualized work-based
experiences • Youth empowerment • Family supports • System linkages • Social and health services • SSA waivers to encourage work • Benefits counseling
Barriers • Low expectations for working and self-
sufficiency • Lack of access to employment services
and work-based experiences • Uncoordinated handoff to adult services • Inadequate access to social and health
services • Financial disincentives to work • Lack of knowledge about how benefits
change when a person works
Youth with disabilities face many barriers that can affect the success of their transition to adulthood. Some of these are the product of youths’ perceptions of their impairments and opportunities, which can lead to low expectations about working and self-sufficiency. Low expectations can, in turn, lead to marginalization, isolation, and diminished expectations about a youth’s abilities among family members, teachers, and employers. Other barriers arise because youth do not identify or obtain appropriate support services, and a lack of high-quality employment services and opportunities for work-based experiences can create barriers to successful entry into the adult labor market (Mank et al. 2003; Wehman 2006). Furthermore, youth with disabilities may have to deal with school support systems that have significant gaps in both student services and critical linkages to adult services. The latter can lead to an uncoordinated handoff to adult services. Program rules that often reduce cash benefits with a rise in earnings or result in possible redetermination of a youth’s status as disabled may create financial disincentives to work. Finally, lack of knowledge about work incentives in SSA benefit programs and the interaction of work experiences, benefits, and SSA incentives can inhibit beneficiaries’ interest in pursuing employment. Together, these barriers can lead to significant challenges in navigating the transition to adulthood successfully.
As shown in Figure I.1, the YTD projects were designed to address each of these barriers by providing services and financial incentives directly to youth with disabilities and their families. As described in the conceptual model, the key components of the projects—services and incentives—included work experiences, youth empowerment, family support, system linkages, social and health services, SSA waivers to encourage work, and benefits counseling. Although the YTD projects were not intended to bring about systems change, they may have improved the transition environment

Interim Report on Broadened Horizons, Brighter Futures Chapter I: Introduction
4
indirectly. For example, the YTD project in Colorado was based in One-Stop Workforce Centers, where through their daily activities the project staff demonstrated strategies for delivering employment services to youth with disabilities for the broader staff at the Workforce Centers (Martinez et al. 2008). The YTD evaluation does not test this potentially indirect effect (shown by the dashed arrow in the conceptual framework).
YTD was intended to help youth become as economically self-sufficient as possible as they transitioned to adulthood. Work-based experiences were a core component of the YTD intervention, and the YTD model stressed the importance of paid employment experiences. The projects offered a range of work-based service options, including career exploration, job shadowing, volunteer work, internships, apprenticeships, and paid employment. These experiences helped youth learn workplace skills and identify the career preferences, workplace supports, and accommodations that may be essential to employment success. The YTD intervention’s various options were designed to address the lack of access to employment services and paid work experiences faced by youth with disabilities. In addition, recognizing that education is an important determinant of future work success, some YTD projects, including BHBF, supported educational goals, such as completing high school, obtaining a general educational development (GED) credential, and enrolling in postsecondary education.
By emphasizing youth empowerment—the acquisition of skills and knowledge that enable youth to control their life choices—the YTD intervention addressed youths’ low expectations associated with working and self-sufficiency. Empowerment is critical to choices about participation in services that will influence youths’ education, employment, and career directions. The YTD projects facilitated empowerment by involving youth in developing person-centered plans for services that promote success in future goals. Through this process, the YTD projects identified the key barriers relevant to each youth and specified steps for addressing them.
Another important component of the YTD intervention was the provision of support to families so that they would be better able to encourage and guide their youth in making appropriate choices about work, education, and services. Such support helped families address the barriers of low expectations and inadequate access to social and health services. In addition, to address the barriers resulting from uncoordinated service environments and inadequate access to services, the intervention emphasized linkages between systems, particularly those between academic coursework and work-based experiences, and effective coordination of social and health services after school exit.
To enhance work incentives, the YTD projects also provided SSA waivers of disability program regulations. One barrier faced by youth is the disincentive to work due to SSA program rules that reduce benefits as earnings rise, effectively reducing the extent to which employment financially benefits youth with disabilities. In response, the waivers for YTD encouraged paid employment by allowing youth to keep more of their benefits while working and earning.
• Under the earned income exclusion (EIE), SSI benefits are reduced by $1 for every $2 earned above a base amount. An important SSA waiver for YTD made the EIE more generous, so that benefits were reduced by only $1 for every $4 earned above a base amount.

Interim Report on Broadened Horizons, Brighter Futures Chapter I: Introduction
5
• For the student earned income exclusion (SEIE), which disregards up to $1,700 per month (in 2012) of a student’s earnings for those age 21 and younger, a waiver extended the earnings exclusion to all youth participating in YTD who attended school, regardless of age.
• For youth who were determined ineligible for disability insurance for medical reasons based on a continuing disability review (CDR) or age-18 medical redetermination, a waiver delayed the cessation of benefits for the duration of the other waivers.
In addition to the above waivers, SSA provided YTD participants with enhanced incentives for investing in self-sufficiency goals and accumulating savings. For youth with approved plans for achieving self-sufficiency goals (known as the “plan for achieving self-support,” or PASS), SSA disregarded the funds used for the PASS activities from eligibility determination and adjusted benefits to compensate partially for these expenses. The YTD waiver expanded eligible PASS activities to include postsecondary education and career exploration. Finally, SSA encouraged asset accumulation in federally funded individual development accounts (IDAs) by not including any beneficiary deposits in the calculation of earned income that would reduce benefits and disregarding matching deposits, account balances, and interest earned from eligibility determinations. For YTD participants, these exclusions were extended to IDAs that are not federally funded. In Appendix B, we provide more complete descriptions of the five SSA waivers for YTD.
Finally, the YTD intervention provided benefits counseling to compensate for the lack of information about benefits and clarify the relationship between benefits and work. YTD benefits counseling assisted youth and their families in understanding the complexity of work incentives under SSA program rules and informed them about SSA’s waivers for YTD.
The YTD evaluation team identified the key intervention components deemed best practices and required all projects to consider these components as part of their service models. TransCen, Inc. provided the projects with training and technical assistance on the implementation of the components. However, each project enjoyed the flexibility to customize its approach to service delivery in the manner determined to be most effective in improving outcomes for youth. It also should be noted that the components were delivered within the existing transition environment, and the projects, to varying degrees, leveraged services available in their communities. For these reasons, the projects differed in their service models and implementation, which in turn may have led to differential impacts on youth outcomes.
B. The YTD Evaluation
In addition to informing the interventions, the conceptual framework for YTD (Figure I.1) guides the evaluation. The evaluation assesses whether eligible youth offered YTD services achieve improved short- and longer-term outcomes relative to eligible youth not offered the services. In the short term, as examined in this and other interim reports on the YTD projects, we assess whether the planned intervention was delivered; the impact of YTD on service use; and short-term impacts on employment, earnings, education, income, and expectations. In the longer term, we will examine whether YTD affected key markers of a successful transition to adult life: employment, earnings, income, engagement in productive activities, reduced contact with the justice system, and self-determination.
The YTD evaluation design called for six projects to be selected for participation in the national impact evaluation. The projects were required to meet four key criteria. First, they had to offer high-

Interim Report on Broadened Horizons, Brighter Futures Chapter I: Introduction
6
quality intervention services expected to improve self-sufficiency. Second, as a group, the sites had to reflect a mix of service strategies and target populations. Third, they had to demonstrate their ability and willingness to participate in a random assignment evaluation. Finally, they had to be sufficiently large to serve 400 youth over a two- to three-year period because the evaluation required that this many youth be served to have sufficient statistical power to assess whether the intervention was effective.
In 2003, SSA entered into cooperative agreements with seven organizations to implement YTD projects that emphasized employment and youth empowerment. In 2006, SSA selected three of the seven projects for the random assignment evaluation.7
Also in 2006, the evaluation team conducted a nationwide search for potential new YTD projects by reaching out to organizations that either were operating strong transition programs or had the capacity to do so and met the evaluation requirements of an adequately sized target population and a willingness to implement random assignment. That search resulted in the selection of five organizations in fall 2006 to run pilot programs in 2007. Based on recommendations from the evaluation team, in November 2007 SSA selected three of the five organizations to implement their interventions fully and participate in the national impact study: these were the Florida regional office of Service Source; St. Luke’s House in Montgomery County, Maryland; and the Human Resources Development Foundation, Inc. in West Virginia.
The choice of projects, based on recommendations from the evaluation team, included those with the capacity to serve the large number of youth required by the evaluation and a willingness to use a random assignment design. The projects were the Youth WINS project in Colorado; the Transition WORKS project in Erie County, New York; and the City University of New York’s Youth Transition Demonstration Project in Bronx County, New York.
8
The YTD evaluation is based on a multicomponent design, to provide strong evidence on the extent to which the intervention led to intended changes in the transition outcomes of youth. The process analysis examines the implementation of YTD in the six projects and considers how well the intended intervention was delivered. The impact analysis is based on a rigorous random assignment design. The target number of voluntarily enrolled youth for each site was between 840 and 880, with approximately 55 percent randomly assigned to a treatment group and the remainder assigned to the control group. Youth in the treatment group could receive YTD services as well as the SSA waivers, while those in the control group could receive only those services available in their communities, independent of the YTD initiative. Finally, the pending cost analysis of the evaluation will examine the costs of the intervention components so as to assess the potential benefits and costs of scaling up implementation of the intervention.
Descriptions of all six random assignment YTD projects can be found in Martinez et al. (2008).
Information for the evaluation comes from a wide range of data sources. We rely on program documents, site visits, interviews with managers and staff, and focus groups with youth and parents to examine the program service model, implementation, and participation. We also examine service
7 Among the four original YTD projects that did not participate in the random assignment evaluation, two (located
in Iowa and Maryland) ceased operations in 2007 and two others (in California and Mississippi) continued providing services through 2009. Descriptions of the seven original YTD projects can be found in Martinez et al. (2010).
8 SSA funding for the two pilot projects (located in Vermont and Washington) not selected into the random assignment evaluation ceased on December 31, 2007.
Interim Report on Broadened Horizons, Brighter Futures Chapter I: Introduction
7
provision data from the evaluation’s management information system, which was used by each project. Data for the impact analysis come from baseline and follow-up surveys and SSA administrative records. The follow-up surveys gather information on youth and family characteristics, as well as outcome measures, such as service use, employment, earnings, and attitudes and expectations. We are conducting the follow-up surveys at one year and three years following random assignment. The administrative records provide information on earnings and benefits and a small number of individual characteristics, covering a period ranging from one year before to three to four years after random assignment.
C. The Broadened Horizons, Brighter Futures Project
The Florida regional office of ServiceSource, based in Clearwater, administered BHBF. Henceforth in this report, “ServiceSource” refers to this office.9
ServiceSource directly delivered many BHBF services but also had formal and informal arrangements with partner organizations to provide additional services central to the intervention. For instance, ServiceSource contracted with the Human Services Coalition for the development of informational materials and instruction on financial literacy, as well as connections with community organizations that administer individual development accounts. ServiceSource partnered with the National Disability Institute for customized training for BHBF’s benefits specialists. ServiceSource had an informal relationship with Miami-Dade County Public Schools to allow BHBF staff to be involved in developing individualized education programs and help coordinate the transition from school-based to adult services. ServiceSource had a cooperative agreement with the Florida Division of Vocational Rehabilitation to refer all BHBF participants to the agency. Through the project’s informal relationships with the South Florida Workforce Investment Board and the Business Leadership Network of Miami-Dade County, BHBF participants could access job listings, the summer youth employment program, and other employment opportunities. In addition, BHBF drew on an informal network of community service providers that offered social and health services through which participants and their families can work toward independence.
ServiceSource is a private, nonprofit organization that has provided services to individuals with disabilities throughout Florida since 1959 and has served Miami-Dade County since 1990. The key components of the BHBF approach to promoting the economic self-sufficiency of youth with disabilities were customized employment services, benefits counseling, financial literacy training, and IDAs. BHBF served youth ages 16 to 22 who received SSA disability benefits and lived in Miami-Dade County. (Although the YTD demonstration targeted youth ages 14 to 25, sites were given the option of targeting a subset of the full age range.)
In Miami-Dade County, as in four of the other five YTD sites, SSA provided Mathematica with lists of Social Security beneficiaries from which to draw a random sample of eligible youth for BHBF. Mathematica conducted outreach to and recruited sample members for the study. The recruitment process extended from April 2008 until September 2010, when we obtained the target number (880) of baseline interviews and written consents for participation in the evaluation. After the initial outreach, the baseline interviews, and grants of consent, Mathematica randomly assigned youth to the treatment or control groups. BHBF began enrolling treatment group youth in project services in April 2008. Services terminated and the project formally ended in March 2012.
9 The Florida regional office of ServiceSource went by the name “Abilities, Inc. of Florida” at the outset of BHBF.
Its name was changed on July 1, 2011.

Interim Report on Broadened Horizons, Brighter Futures Chapter I: Introduction
8
Following random assignment, the staff of BHBF reached out to each youth in the treatment group and conducted an enrollment meeting. During that meeting, each youth was informed about BHBF services and the YTD waivers, basic information about the youth was collected, and enrollment forms were signed. Each youth was considered as enrolled in project services upon successful completion of the enrollment meeting; treatment group youth who did not have a signed enrollment form were not eligible for either project services or the waivers. After the enrollment meeting, BHBF community employment development specialists (CEDS) worked with participants to identify their employment goals and the additional education that might be necessary to attain them. Through a person-centered planning process, the CEDS helped to empower the participants to develop individualized plans for achieving their goals (see Chapter III for a description of person-centered planning). Benefits specialists provided participants and families with information on SSA benefits and waivers, and assisted families in obtaining ancillary benefits, such as medical coverage, housing subsidies, and tax credits. BHBF staff offered participants career preparation activities and general case management services, such as help arranging for child care and transportation. Perhaps most central to its mission, BHBF offered youth various work-based experiences, with an emphasis on paid competitive employment but also including job shadowing, volunteer experiences, internships, and summer youth employment.
BHBF participants were eligible to receive project services for 18 months; however, many of them continued to receive services over the full life of the project.10
D. Research Objectives for this Report
In Chapter III, we provide a fuller description of the BHBF project, the intended sequence of services for a youth who enrolled in the project, the roles of the BHBF staff members and their partners, and the services that participants actually received.
In this interim report, we examine the services that BHBF provided, assess how they were delivered and their fidelity to the proposed service model, and identify the successes and challenges associated with implementation. This analysis, known as process analysis, provides critical information for future replication or adoption of promising practices and informs policy by providing evidence of what is needed to implement programs similar to BHBF. The process analysis also improves our understanding of major impacts (or the lack thereof) by examining factors such as the fidelity of implementation to the proposed design, who participated in project activities, the intensity of services received, and challenges faced by the project.
Building on the process analysis, we examine whether BHBF improved short-run outcomes for youth 12 months after random assignment. If the project succeeded in engaging youth in services, we would expect that youth randomly selected to have the opportunity to participate in BHBF (treatment group members) would have higher levels of service use than youth ineligible for BHBF (control group members). Engaging youth in work-related activities through employment services is of particular importance for YTD, and we would expect to find an impact of BHBF on receipt of such services. We also would expect youth to take advantage of at least some of the SSA waivers within the first year. Furthermore, all YTD sites emphasized youth empowerment and individual goal setting; thus, we would expect some measures of youth empowerment, such as future expectations, to improve within the first year.
10 Youth who enrolled in YTD project services are eligible for the SSA waivers for four years past random
assignment or until the youth reach age 22, whichever comes later. All waiver eligibility ceases after September 2013.

Interim Report on Broadened Horizons, Brighter Futures Chapter I: Introduction
9
Given that the YTD program model emphasized paid employment and that all YTD project sites were required to adopt an employment focus, it is important to examine short-term impacts on paid employment, earnings, and benefits. All YTD projects made some effort to place youth in employment. In light of this, the short-run impacts on employment-related measures reflect both participation in the YTD projects and the outcomes resulting from that participation. Indeed, more substantial employment impacts beyond project placements may not be subject to immediate influence, especially for youth who are under age 18 or in school. Hence, while we examine employment outcomes as part of this interim report, we will focus more attention on them in subsequent reports.
BHBF was among a subset of YTD projects that also provided education services. For youth seeking to pursue education, BHBF provided educational counseling, assistance with support services, enrollment assistance, help in preparing for education planning meetings, and other education services. Since education services are a component of the BHBF service model, we also examine the short-term impact on youths’ educational progress.
Before turning to the process and impact analyses, we describe our evaluation approach in Chapter II, including key outcome measures, data sources and analysis samples, and our approaches to conducting the process and impact analyses.


11
II. STUDY DESIGN, METHODS, AND DATA SOURCES
Rigorous assessment of the impacts of the YTD projects is a central component of the YTD evaluation. An experimental design, often considered the gold standard for evaluations, allows us to infer with a high degree of certainty whether the projects had any impacts on youth. As important as it is to estimate project impacts, it is also critical to describe the process by which YTD services were delivered so that others considering the development of similar interventions will benefit from an understanding of both the context for interpreting project impacts and the information on project implementation successes and challenges. In this chapter, we describe our approach to conducting the impact and process analyses.
A. Impact Analysis
One of the hallmarks of the YTD evaluation is that it is based on a rigorous random assignment design. Youth identified as eligible for the evaluation are randomly assigned either to the treatment or the control group; the treatment group is eligible to receive YTD services and the SSA waivers for YTD, while the control group has no access to YTD services or waivers but may use other services available in the community. Random assignment should lead to the creation of two groups with virtually identical pre-intervention experiences and characteristics. As a result, any observed differences in outcomes for the two groups over time may be attributed with a known degree of certainty to the effects of the program.
It should be noted that participation by youth in the evaluation was voluntary. Therefore, we expect that youth particularly interested in receiving employment-related services were more likely to have volunteered to participate. As a result, youth assigned to the control group and not eligible for YTD services might have been likely to seek similar types of services elsewhere in the community. Hence, the impacts of interest to the evaluation are the effects of the YTD interventions relative to other services in the community that youth may have used, rather than a counterfactual environment of “no services.” The impact analysis in this interim report examines whether BHBF was effective in improving the short-term outcomes of those youth offered project services and the SSA waivers for YTD, covering the period up to one year following random assignment.
1. Outcome Measures
As detailed in the conceptual framework for the YTD intervention and evaluation in Chapter I (Figure I.1), by providing expanded services and waiving certain disability program rules, BHBF was expected to promote work and improve other outcomes for youth. If BHBF succeeded in implementing YTD services and waivers, the most immediate impacts of the intervention should be reflected by youth randomly assigned to the treatment group showing increased use of employment-promoting services, more work-related experiences, and more paid employment. We would also expect to observe treatment group youth having greater income resulting from increased employment, more use of SSA work incentives as a consequence of the waivers, greater educational progress, and more positive attitudes and expectations about the future.11
11 In the intermediate and longer terms, we would expect treatment group youth to increase their employment and
earnings, have higher income, reduce risky behaviors, demonstrate greater self-determination and self-efficacy, and move toward independent living. The longer-term outcomes will cover a period from three to four years following random assignment for youth in the study and will be based on data from the 36-month follow-up survey and administrative records.

Interim Report on Broadened Horizons, Brighter Futures Chapter II: Study Design
12
Information on these short-term impacts is based on data from the YTD evaluation’s 12-month follow-up survey as well as administrative data on benefit receipt and use of SSA work incentives. In the 12-month survey, we gathered a large volume of information on outcomes for different aspects of youths’ lives, particularly participation in a variety of services, educational progress, work-related experiences, understanding of work incentives, and expectations about the future.
While all of the above outcomes are important, and it is useful to assess the intervention’s impacts on each one, we must be mindful of the statistical problem of “multiple comparisons.”12 This problem arises when we estimate impacts on a large number of outcomes such that at least a few of the estimates likely will be statistically significant by chance, even if no true impacts occurred. For example, if we were to examine 50 independent outcomes, we would expect to find statistically significant impacts (at the ten percent level of statistical significance) for five outcomes simply by chance, even in the absence of any true impacts. We addressed the problem by specifying, a priori, a small number of primary outcomes. We chose five domains or areas in which we expected to see program impacts and identified a primary outcome to be tested in each domain.13
Guided by the YTD conceptual framework, our evaluation design report identified the primary domains and outcomes to be examined in our impact analyses (Rangarajan et al. 2009a). In Table II.1, we show the domains for which we expected BHBF to have short-term impacts and describe the primary outcomes examined as part of each domain. In this table, we also describe the supplementary outcomes related to these domains.
Our goal was to be as parsimonious as possible in defining the domains and primary outcomes while capturing the major areas in which the intervention might produce impacts. The primary outcomes were the basis for the tests of our main hypotheses. In addition, we examined a number of supplementary outcomes to help explain impacts on the primary outcomes. Even if we did not find a statistically significant impact on a primary outcome, we examined the related supplementary outcomes to enhance our understanding of the lack of impact on the primary outcome. In addition, we considered whether there was a pattern of impacts on the supplementary outcomes that suggested the project may have had an impact that our primary outcome measure did not capture. We highlighted the findings for the supplementary outcomes only if we found statistically significant impacts on the primary outcomes.
• Employment-promoting services. Through individualized employment-related services and case management support, BHBF was expected to improve youths’ employability. The primary outcome measure in the domain of employment-promoting services is whether a youth received any such services. This composite measure indicates whether the youth received career counseling, support for resume writing and job search activities, job shadowing and apprenticeships, other employment services, and counseling on SSA benefits and work incentives during the year following random assignment.
12 This discussion, and our approach to addressing the multiple comparisons problem, are summarized from
Schochet (2008). 13 We specified all outcomes a priori in an analysis plan (Rangarajan et al. 2009b). However, we determined the
specific measures for some outcomes after examining distributions in the data and the extent of missing information (with treatment and control groups combined). For example, we specified in the analysis plan that we would examine the degree of employment. Subsequently, based on preliminary data analysis of the full sample (treatment and control cases combined), we determined that “ever employed on a paid job in the year following random assignment” was the best measure of the degree of employment.
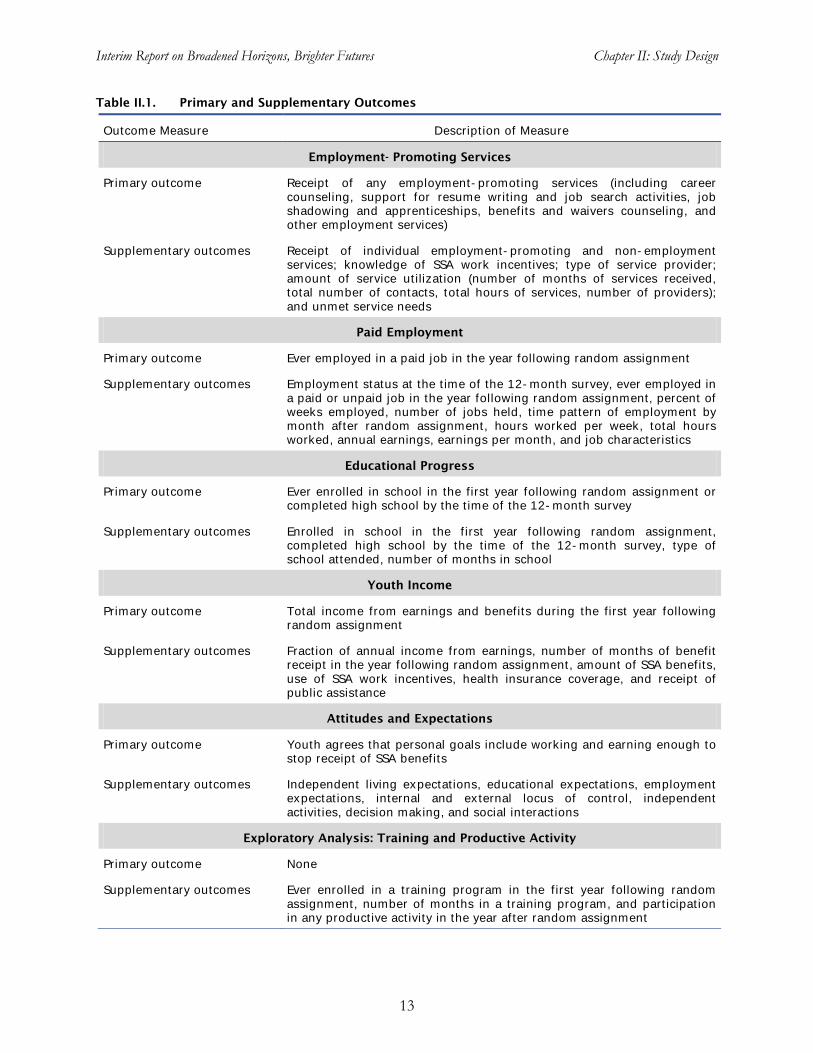
Interim Report on Broadened Horizons, Brighter Futures Chapter II: Study Design
13
Table II.1. Primary and Supplementary Outcomes
Outcome Measure Description of Measure
Employment- Promoting Services
Primary outcome Receipt of any employment-promoting services (including career counseling, support for resume writing and job search activities, job shadowing and apprenticeships, benefits and waivers counseling, and other employment services)
Supplementary outcomes Receipt of individual employment-promoting and non-employment services; knowledge of SSA work incentives; type of service provider; amount of service utilization (number of months of services received, total number of contacts, total hours of services, number of providers); and unmet service needs
Paid Employment
Primary outcome Ever employed in a paid job in the year following random assignment
Supplementary outcomes Employment status at the time of the 12-month survey, ever employed in a paid or unpaid job in the year following random assignment, percent of weeks employed, number of jobs held, time pattern of employment by month after random assignment, hours worked per week, total hours worked, annual earnings, earnings per month, and job characteristics
Educational Progress
Primary outcome Ever enrolled in school in the first year following random assignment or completed high school by the time of the 12-month survey
Supplementary outcomes Enrolled in school in the first year following random assignment, completed high school by the time of the 12-month survey, type of school attended, number of months in school
Youth Income
Primary outcome Total income from earnings and benefits during the first year following random assignment
Supplementary outcomes Fraction of annual income from earnings, number of months of benefit receipt in the year following random assignment, amount of SSA benefits, use of SSA work incentives, health insurance coverage, and receipt of public assistance
Attitudes and Expectations
Primary outcome Youth agrees that personal goals include working and earning enough to stop receipt of SSA benefits
Supplementary outcomes Independent living expectations, educational expectations, employment expectations, internal and external locus of control, independent activities, decision making, and social interactions
Exploratory Analysis: Training and Productive Activity
Primary outcome None
Supplementary outcomes Ever enrolled in a training program in the first year following random assignment, number of months in a training program, and participation in any productive activity in the year after random assignment

Interim Report on Broadened Horizons, Brighter Futures Chapter II: Study Design
14
• Paid employment. One of the core service components of the YTD initiative was to help youth find paid employment in the short term and put them on a path to consistent paid employment in the longer term. Hence, paid employment was an important domain for the evaluation. The primary outcome in the domain is whether a youth was ever employed on a paid job in the year following random assignment. Paid employment in the year following random assignment is, in part, a measure of receipt of services, as the YTD interventions are intended to emphasize experiences in paid employment.
• Educational progress. Although BHBF did not have an explicit goal of increasing educational attainment, project staff did provide educational counseling and other education services to youth who sought to further their education. Furthermore, education is a key short-term outcome in the YTD conceptual framework. Thus, one of the important outcomes for examination is a composite measure of enrollment in school at any time during the year following random assignment or completion of high school by the time of the 12-month survey.14
• Youth income. The YTD initiative was expected to improve the income of participants by increasing earnings and offering work incentives that permitted youth to retain more of their benefits as their earnings increased. Thus, one of the important outcomes for examination is total income received by youth from earnings and SSA disability benefits in the first year following random assignment.
• Attitudes and expectations. BHBF sought to promote independence and self-sufficiency among participants through person-centered planning. The project also offered life skills training, covering such topics as goal setting, decision making, and self-esteem. Thus, BHBF was expected to improve outcomes related to youths’ attitudes and beliefs about themselves. The primary outcome for the attitudes and expectations domain was whether youth agreed with the statement that their “personal goals include working and earning enough to stop receiving SSA benefits.”
• Exploratory analysis: training and productive activity. As a supplementary analysis, we explored whether BHBF had an impact on job training activities. We also estimated its impact on a composite measure of productive activities, including enrollment in school, job training, paid employment, and unpaid employment.
2. Sample Selection and Recruitment
BHBF targeted youth ages 16 through 22 who received SSI, DI, or CDB. The sampling frame for the YTD evaluation was Social Security disability beneficiaries who were in the target age range and lived in Miami-Dade County. All youth in the sampling frame (and in the research sample that we drew from the sampling frame) were on the SSA benefit rolls at the time of data extraction; however, a small percentage was not in “current pay” status. Subsequent analysis of benefit records showed that six percent of youth in the research sample did not receive benefits in the year prior to random assignment. These youth were considered to be at high risk of returning to “current pay” status in the future. With this caveat, we refer to the members of the research sample as “beneficiaries.”
14 Our measure of enrollment in school includes even brief periods of enrollment to capture participation in
education regardless of the duration of participation. As a supplementary measure, we also examine the number of months of enrollment.

Interim Report on Broadened Horizons, Brighter Futures Chapter II: Study Design
15
Mathematica conducted outreach and recruited eligible youth into the study. During a 30-month recruitment period, from April 2008 through September 2010, Mathematica randomly selected 5,573 eligible youth from beneficiary rolls provided by SSA (Figure II.1).15 After receiving informed consent orally, we conducted baseline interviews with 35 percent of the youth (1,955).16
We were able to enroll a broad group of disability beneficiaries in the evaluation. While there were some differences between enrollees and non-enrollees, overall those differences were not large (based on data from administrative records; Appendix A, Table A.1).
Of those who completed the baseline interview, 54 percent returned completed consent forms (guardian consent was required for minor youth). Among youth with signed consent forms, 83 percent agreed to participate in the evaluation, for a total enrollment of 880 youth in the evaluation.
17
Of the 880 youth recruited into the evaluation, 859 were randomly assigned: 460 to a treatment group whose members were eligible to enroll in the BHBF and 399 to a control group. The remaining 21 youth who provided written consent had siblings already in the evaluation. These youth automatically were assigned to the same groups (13 treatment and 8 control) as their siblings and were not part of the research sample for the BHBF evaluation.
In particular, although differences between enrollees and non-enrollees were statistically significant for 8 of 12 baseline characteristics for which we conducted tests, the overall differences were not large. For example, enrollees were less likely to have had earnings in the prior year and, on average, their earnings were lower than those of non-enrollees. As a result of their self-selection into or out of the evaluation, enrollees and non-enrollees may also have differed on unobserved characteristics, such as motivation to work in the future. However, the impact estimates are not affected by these baseline differences because both treatment and control groups included exclusively youth who had enrolled in the evaluation.
Following random assignment, BHBF staff were responsible for enrolling treatment group members in the project and providing them with services. In Chapter III, we provide a detailed description of the enrollment effort. The enrollment target was 83 percent, or 382 of the 460 youth who had been randomly assigned to the treatment group. Project staff ultimately enrolled 388 of these youth as participants in BHBF.18
15 SSA provided Mathematica with lists of youth who were disability beneficiaries in the program catchment areas.
The lists, which constituted the sampling frame for the evaluation, were updated periodically to capture new entrants. Mathematica randomly sorted the lists into survey replicates containing ten eligible beneficiaries each. Each replicate was a random sample of the frame. We gradually released the replicates for purposes of baseline interviewing and gathering written informed consent to participate in the evaluation.
Throughout this study, we use the term “participants” to refer to these youth in the treatment group who participated in BHBF services.
16 Of the 3,618 youth with whom we could not conduct interviews, 12 percent refused to participate in the survey. The rest were “unlocatable” (38 percent; we were unable to reach them by using the information in SSA files or additional contact information drawn from publicly available sources); found to be ineligible (35 percent; they had moved out of the target county, were no longer age eligible, or were deceased); or still in some stage of contact attempts when the survey concluded (15 percent).
17 Youth were considered “enrolled” in the evaluation once they completed the baseline survey and signed a consent form agreeing to participate in the evaluation.
18 BHBF staff also enrolled 12 of the 13 non-research treatment group youth, resulting in a total of 400 participants in the project.

Interim Report on Broadened Horizons, Brighter Futures Chapter II: Study Design
16
Figure II.1. Intake Flow Diagram for Broadened Horizons, Brighter Futures
Sampling frame
Released sample5,573
Non-respondent(N=3,618)
Completed baselineinterview(N=1,955)
65% 35%
46% 54%
Did not signconsent form
(N=897)
Signed consentform
(N=1,058)
17% 83%
Negative consent(N=178)
Affirmative consent:evaluation enrollee
(N=880)
Non-researchsample (siblings)
(N=21)
Random assignment
46% 54%
Outreach byBHBF
16% 84%
Non-participant(N=72)
Participant(N=388)
2% 98%
Control group(N=399)
Treatment group(N=460)
Research sample(N=859)
Evaluation non-enrollee(N=4,693)
Interim Report on Broadened Horizons, Brighter Futures Chapter II: Study Design
17
3. Data Sources and Analytic Sample
Data Sources. The impact analysis relied on both survey and administrative data from SSA records. We collected survey data at baseline (just before random assignment and the receipt of written consent for enrollment in the evaluation) and at 12 months following random assignment. We collected the data primarily through interviews with the youth, although we obtained some information from both the youth and the parent or guardian (satisfaction with YTD services and future expectations).19
The baseline survey was conducted as part of the evaluation’s sample intake process over the period from March 2008 through July 2010. The survey consistently collected data on demographic characteristics and personal and family background for all youth enrolled in the evaluation (both treatment and control groups). The baseline survey was the principal source of the control variables in the regression models used to improve the precision of impact estimates and control for observable pre-existing differences between the two groups. It also was a source for variables that identified subgroups of youth for examination.
In addition, for youth under age 18, we obtained some information only from the parent or guardian (school enrollment, service utilization, knowledge of SSA waivers). If the youth was unable to respond to questions, we asked the parent or guardian for the relevant information. Below, we briefly discuss the various data sources used in this interim impact report; we provide a more detailed discussion of these sources in the evaluation’s data collection and survey plan (Rangarajan et al. 2007).
The first of two follow-up surveys of evaluation enrollees began in April 2009, 12 months after the first evaluation enrollee was randomly assigned. We collected follow-up data through November 2011 for 404 of the 460 youth in the treatment group and 334 of the 399 youth in the control group (response rates of 88 percent and 84 percent, respectively).20
In addition to survey data, we relied on data from SSA administrative files for the impact analysis. SSA benefits and use of work incentives are of particular interest to the agency for understanding program implementation and assessing program savings. We obtained benefit information from the Ticket Research File (TRF), which includes information on receipt of any disability benefits, type of benefits received, and monthly dollar amount of benefits received (Hildebrand et al. 2010).
The follow-up survey gathered information on outcomes for the year following random assignment that may have been affected by participation in BHBF, such as receipt of employment-related services, understanding of SSA work incentives, employment, education, and measures reflecting youth attitudes and expectations. For some outcomes, such as employment and receipt of services, the survey information covers the entire period following random assignment. For other outcomes, such as living arrangements and educational attainment, the survey information is specific to the time of the follow-up interview.
21
19 In the impact analysis chapters, we provide details on the sources of information for specific outcome variables.
We also used information from SSA records on the use of SSA work
20 As discussed in Section A.6 of this chapter, we found that follow-up survey non-respondents differed from respondents to some extent. However, given high overall response rates, we found only modest differences in conclusions based on impact estimates for the respondent sample relative to the full sample when we examined impacts on benefits and work incentive outcomes for these groups based on SSA administrative data, which are available for all youth (Appendix A, Table A.9).
21 The TRF is an ongoing data extraction and file creation effort that originally was undertaken to support the evaluation of SSA’s Ticket to Work program, which provides SSA beneficiaries with vouchers (“Tickets”) that can be used to obtain employment services from Employment Networks of their choice. To support the YTD evaluation, the
(continued)

Interim Report on Broadened Horizons, Brighter Futures Chapter II: Study Design
18
incentives. In addition, we used data from the SSA Master Earnings File (MEF) to assess earnings of various sample groups in the year before random assignment.22
Analytic Sample. We treated as our main sample for the interim impact analysis the 738 randomly assigned evaluation enrollees who completed the 12-month follow-up survey, which provided information on many of our primary outcomes. We refer to this sample as the “analytic sample.” However, we also have a larger sample of all randomly assigned evaluation enrollees for whom we have follow-up data on benefits and use of SSA work incentives from administrative records. We refer to this sample as the “research sample.” For outcomes obtained from administrative records—measures of SSA benefits and the use of work incentives—we report impact analysis results based on the research sample, the larger of the two samples.
Finally, for all evaluation enrollees, we used information from SSA records on gender, age, language, primary disabling condition, and representative payee type.
23
We compared the baseline characteristics of treatment and control group members in the analytic sample to assess their equivalence at the time of random assignment. In all, we examined 50 characteristics. (We report 32 characteristics in Table II.2 and the rest in Appendix A, Table A.2.
For these outcomes, we found only modest differences in the impact analysis results when, in a methodological investigation, we limited the analysis to the smaller sample of youth who had completed the 12-month survey (Appendix A, Table A.9).
24
(continued) TRF was expanded to include SSI beneficiaries as young as ten years old. Previously, the minimum age for inclusion in the file was 18.
) We found that the two groups were highly similar with respect to most characteristics, including demographics, school attendance, living arrangements, health status, expectations about the future, and duration of benefit entitlement. However, we did find differences between the two groups, most notably in several measures of family socioeconomic status. Among the treatment group youth, there was a higher share whose mothers had completed high school: 70 percent, compared with 61 percent for control group youth. However, treatment group youth were less likely to report that their fathers were currently employed: 55 percent, compared with 66 percent for control group youth. These differences in maternal education and paternal employment are statistically significant at the five percent level. We also found that treatment group youth were eight percentage points less likely to have received job training in the last year and five percentage points less likely to have worked as a volunteer in the last year (these differences are statistically significant at the five percent level and the ten percent level, respectively). Finally, we found that treatment group youth received a
22 Post-random assignment data from the MEF were not available for the research sample in time to be analyzed for this interim report. We will present estimates of impacts on annual earnings as measured in the MEF in the comprehensive final report on all of the random assignment YTD projects. For this report, we used information from SSA records on whether youth reported monthly earnings to SSA following random assignment to help understand the findings on the use of SSA work incentives.
23 The full research sample for the impact analysis of outcomes measured in administrative records consisted of the 859 youth who enrolled in the evaluation and were randomly assigned to treatment or control status, less nine youth who had died as of the one-year anniversary of their random assignment, for a total of 850 youth (454 treatment and 396 control youth).
24 Table II.2 reports the baseline characteristics we identified as most likely to affect outcomes, plus any characteristics we examined that showed a statistically significant difference between the treatment and control groups at baseline.

Interim Report on Broadened Horizons, Brighter Futures Chapter II: Study Design
19
Table II.2. Baseline Characteristics of Analytic Sample (percentages, unless otherwise noted)
All Treatment Control Difference P-Value
Baseline Survey Data
Demographic Characteristics Race 0.72
White 37.1 36.3 38.0 -1.7 Blacka 51.0 50.9 51.1 -0.2 American Indian/AK/HI/Pacific Islander 2.2 2.5 1.9 0.6 Asian 0.7 1.1 0.3 0.8 Other or unknown 9.0 9.2 8.8 0.4
Hispanic 42.9 41.8 44.1 -2.3 0.55 Primarily speaks English at home 76.9 76.4 77.5 -1.1 0.73
Education School Attendance 0.54
Does not attend schoola 43.3 42.1 44.7 -2.6 Attends regular high school 33.2 32.8 33.8 -1.0 Attends special high school 7.4 7.0 7.7 -0.7 Attends other school 16.1 18.1 13.8 4.2
Employment Received job training in last year a 25.6 22.0 29.8 -7.9 ** 0.02 Worked as volunteer in last year a 15.3 12.8 18.1 -5.3 * 0.06 Worked for pay in last yeara 18.6 19.3 17.8 1.4 0.64 Worked for pay in last month 7.8 7.7 8.0 -0.4 0.85 Never worked for pay at baseline 65.8 64.7 67.1 -2.4 0.52
Living Arrangements and Household Composition Living Arrangementsa 0.57
Two-parent family 28.6 26.9 30.7 -3.7 Single-parent family 62.5 63.6 61.3 2.3 Group home 1.2 0.9 1.7 -0.8 Other institution 3.0 3.3 2.6 0.7 Lives alone or with friends 4.6 5.3 3.8 1.5
Average number of people in household 4.1 4.1 4.0 0.1 0.64 Lives with others with disabilities 40.2 40.9 39.4 1.4 0.71
Family Socioeconomic Status Annual Income 0.57
Less than $10,000 38.2 40.1 35.9 4.2 $10,000–$24,999 38.8 37.4 40.5 -3.1 $25,000 or more 23.0 22.5 23.5 -1.0
Parents' Education Mother high school graduatea 65.6 69.7 61.1 8.6 ** 0.02 Father high school graduate 65.2 63.9 66.8 -2.9 0.49
Parents' Employment Status Mother employed 44.3 44.6 43.9 0.7 0.86 Father employeda 60.1 55.2 65.7 -10.5 ** 0.02
Self-Reported Health Statusa 0.70 Excellent 21.6 22.9 20.2 2.7 Very good/good 55.9 54.8 57.1 -2.3 Fair/poor 22.5 22.3 22.7 -0.3
Assistance Reading, hearing, speaking, or walking aidsa 16.6 18.5 14.4 4.2 0.15 Help with personal care needsa 20.8 20.5 21.2 -0.7 0.82
Expectations About the Future Expects to live independently (w/ or w/o help)a 68.0 68.6 67.4 1.3 0.76 Expects to continue education 87.9 88.7 87.0 1.7 0.55 Expects to work at least part-time for pay 90.5 90.1 90.9 -0.7 0.78

Interim Report on Broadened Horizons, Brighter Futures Chapter II: Study Design
20
All Treatment Control Difference P-Value
Administrative Data
Demographic Characteristics Malea 60.0 59.7 60.4 -0.6 0.87 Age in Yearsa 0.79
14–17 19.8 19.8 19.8 0.0 18–21 68.4 67.6 69.3 -1.7 22–25 11.8 12.6 10.8 1.7 Average age (years) 19.1 19.2 19.1 0.0 0.76
Benefits SSA Beneficiary Status
SSI (only or concurrent with CDB or DI) a 96.9 96.6 97.3 -0.7 0.60 Duration of benefit entitlement (years) a 8.7 8.7 8.8 0.0 0.92 Benefit amount in year before month of RA ($) 6,311 6,148 6,499 -351 * 0.06
Disability Primary Disabling Condition (SSA data) a 0.44
Mental illness 16.4 16.5 16.3 0.3 Cognitive/developmental disability 43.8 42.3 45.5 -3.3 Learning disability/ADD 20.8 21.4 20.2 1.2 Physical disability 13.7 13.0 14.4 -1.4 Speech, hearing, visual impairment 5.3 6.8 3.6 3.2
Duration of disability (years) 9.1 9.1 9.2 -0.1 0.76
Earnings in year before year of RA ($) 853 882 818 65 0.76
Sample Size 738 404 334
Sources: YTD baseline survey and SSA administrative records.
Notes: We weighted statistics to adjust for non-response to the 12-month survey. Baseline survey item non-response may have resulted in smaller sample sizes for some characteristics than indicated at the bottom of the table. Missing information on primary disabling condition and duration of disability resulted in a smaller sample sizes for these characteristics than shown at the bottom of the table.
a We included these characteristics in the regression models for the impact analysis. In addition, the regression models include indicators for cohort of random assignment and North Miami residence. For outcomes in the income domain, the regression models include the amount of SSA benefits received in the year before random assignment.
RA = random assignment
*/**/***Treatment-control difference is statistically different from zero at the .10/.05/.01 level using either a two-tailed t-test or a chi-square test.
lower average SSA benefit amount in the year prior to random assignment (the difference is statistically significant at the ten percent level).25
The degree of difference between the treatment and control groups is similar to what we would expect based on chance alone. For example, of the 50 baseline characteristics we investigated, we would expect two or three to be statistically different at the five percent significance level or lower, and about five characteristics to be statistically different at the ten percent significance level or lower. We found statistically significant differences for three characteristics at the five percent significance level and for two additional characteristics at the ten percent significance level.
25 We also compared the baseline characteristics of the treatment and control groups in the full research sample,
regardless of whether they responded to the 12-month survey (see Appendix A, Table A.3). This analysis was based on all 859 youth randomly assigned to the treatment or control groups, including the nine youth who died during the year following random assignment. In general, the patterns were largely similar to those shown in Table II.2.

Interim Report on Broadened Horizons, Brighter Futures Chapter II: Study Design
21
4. Estimating Overall Impacts
Although well-executed random assignment ensures that a simple comparison of mean values of outcomes will yield unbiased estimates of program impacts, we estimated regression-adjusted impacts to increase the precision of the estimates. In addition, the regression-adjustment approach allowed us to control for chance differences in baseline characteristics between treatment and control group members, which may be correlated with outcome measures. We estimated ordinary least squares regression models for continuous outcome measures, logistic regressions for binary outcomes, and multinomial logit models for categorical outcomes. We estimated impacts for all youth in the analytic sample, without any exclusions. In particular, we included all treatment group members in the analytic sample, regardless of whether they participated in BHBF.
The impact estimates address the policy question: “What were the effects of BHBF on eligible youth who were interested in the project and were offered the opportunity to participate in it?” The impacts reflect both the decisions of those who were offered the opportunity but declined to participate in project services and the effects of BHBF on those who accepted the offer of services. Youth in the treatment group who declined to participate are a self-selected subset of treatment group youth who are likely to have different baseline characteristics, on average, than BHBF participants. If these youth were excluded from the analysis, the control group would no longer provide a valid basis for comparison with the participant subsample.
Our regression models used 19 distinct variables or sets of related variables to control for baseline characteristics believed to be correlated with the outcomes of interest.26 An important consideration in selecting the control variables was the need to adjust for any pre-existing differences at baseline between the treatment and control groups. We also used as controls (1) variables believed or known to have strong behavioral relationships with the outcome measures (for example, work experience or education); (2) variables that could be used to target intervention services to youth for whom they would have the greatest impacts (for example, age and school enrollment); and (3) variables related to the enrollment cohort or timing of random assignment.27
To provide context for interpreting the impact estimates, we report the estimates and observed means for the treatment group. We decided to report the treatment group means (rather than the observed control group means) because we judged them to be of greater interest to readers. To illustrate the expected treatment group experience in the absence of BHBF, we show the observed treatment group means less the regression-adjusted impact estimates and refer to these as the “estimated treatment group means in the absence of BHBF.” Where we observe significant program impacts and want to describe their magnitudes in proportional terms, we use the estimated treatment group means in the absence of BHBF as our base. For almost all outcome measures, the estimated
26 We list the control variables in the impact regression models in Table A.4 of Appendix A. Most of the variables
also appear in Table II.2, where they are designated by an “a” superscript. In addition to the control variables in Table II.2, the regression models include indicators for residence in North Miami and random assignment cohort. To keep Table II.2 brief, we present these and additional baseline characteristics in Table A.2 of Appendix A.
27 We excluded from the main model one variable with a statistically significant treatment-control difference in Table II.2: “benefit amount in year prior to RA.” This variable is likely to be highly correlated with other variables in the model. However, for the income domain, we included this variable because it is a strong predictor of the primary outcome, which is calculated as earnings plus SSA benefits. We verified that inclusion of this variable in the model would not change the nature of our findings in the other outcome domains.

Interim Report on Broadened Horizons, Brighter Futures Chapter II: Study Design
22
treatment group means in the absence of BHBF do not differ substantially from the estimated control group means.28
We tested the sensitivity of the estimated impact on the primary outcome in each domain to the use of either the regression adjustment or a comparison of simple means (Appendix A, Table A.6) and found that the impact estimates were robust with respect to the particular estimation approach, with one exception. The absolute sizes and proportional magnitudes of the impact estimates were very similar when we estimated using regression adjustment or simple means, except for the impact estimates for income. For income, the regression-adjusted impact estimates were substantially larger ($424 versus $96). The regression-adjusted model is preferred because it controls for differences between the treatment and control groups in the amount of benefits received before random assignment. The amount of benefits received before random assignment is a strong predictor of income, which is defined as earnings plus SSA benefits in the year after random assignment.
5. Estimating Subgroup Impacts
In addition to the impacts of BHBF on outcomes for all eligible youth, we were interested in estimating whether the project had different impacts on different types of youth. The subgroup analysis examined whether the intervention worked better for some youth versus others. Subgroup analysis can inform decisions about targeting scarce resources to specific groups. However, the limited size of the analytic sample (738 youth) meant that, for some subgroups, the sample sizes were insufficient to test for meaningful differences between them. Further, to be responsive to the multiple comparisons problem, we minimized the number of subgroups for which we would estimate impacts on primary outcomes and also identified them prior to the analysis.
In our design report, which we prepared before conducting the impact analysis, we identified several baseline characteristics defining the subgroups that might be expected to experience different impacts of YTD: youth under age 18, youth enrolled in school, and youth experienced in working for pay (Rangarajan et al. 2009a). For example, we might expect to see larger employment impacts on older or out-of-school youth—as opposed to younger or in-school youth—and youth with at least some paid work experience. In addition, the expectations of youth who did not work for pay in the year before random assignment might have been more malleable than those of older youth and those with work experience. In addition to these three subgroups identified in our design report, for BHBF, we also conducted the impact analysis by random assignment cohort because our process analysis suggested that the BHBF intervention may have been different for those entering the program after June 2009 (see Chapter III for details). In Section G of Appendix A, we discuss impact estimates for several other (exploratory) subgroups.
In Table II.3, we describe the sample sizes of the subgroups selected for analysis. To estimate subgroup impacts, we modified the regression models to include the interaction of the treatment status indicator with specific subgroup indicator variables. For each subgroup, we conducted tests to determine the statistical significance of the subgroup impact estimates and whether the impact estimates across the subgroups differed significantly from each other.
28 Outcomes related to SSA benefits (including income) are an exception (see Section C of Appendix A for further
discussion). We show the observed control group means for all outcomes in each domain in Table A.5 of Appendix A, along with the observed treatment group means.
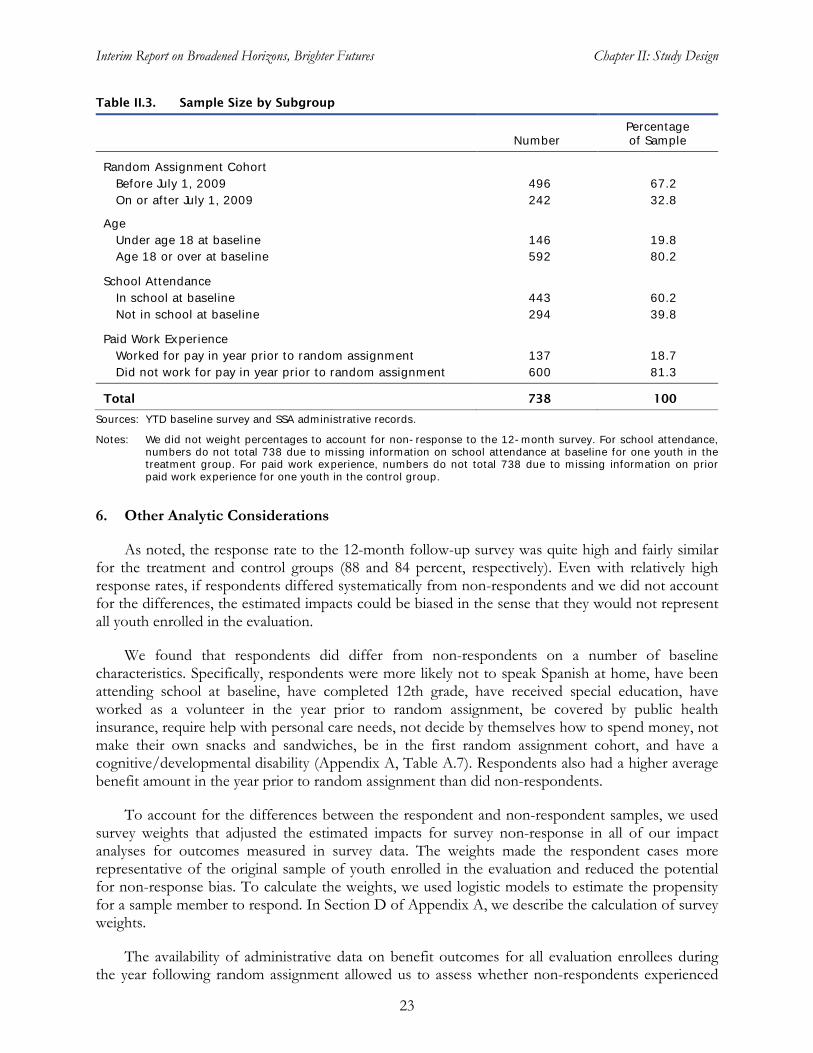
Interim Report on Broadened Horizons, Brighter Futures Chapter II: Study Design
23
Table II.3. Sample Size by Subgroup
Number Percentage of Sample
Random Assignment Cohort Before July 1, 2009 496 67.2 On or after July 1, 2009 242 32.8
Age Under age 18 at baseline 146 19.8 Age 18 or over at baseline 592 80.2
School Attendance In school at baseline 443 60.2 Not in school at baseline 294 39.8
Paid Work Experience Worked for pay in year prior to random assignment 137 18.7 Did not work for pay in year prior to random assignment 600 81.3
Total 738 100
Sources: YTD baseline survey and SSA administrative records.
Notes: We did not weight percentages to account for non-response to the 12-month survey. For school attendance, numbers do not total 738 due to missing information on school attendance at baseline for one youth in the treatment group. For paid work experience, numbers do not total 738 due to missing information on prior paid work experience for one youth in the control group.
6. Other Analytic Considerations
As noted, the response rate to the 12-month follow-up survey was quite high and fairly similar for the treatment and control groups (88 and 84 percent, respectively). Even with relatively high response rates, if respondents differed systematically from non-respondents and we did not account for the differences, the estimated impacts could be biased in the sense that they would not represent all youth enrolled in the evaluation.
We found that respondents did differ from non-respondents on a number of baseline characteristics. Specifically, respondents were more likely not to speak Spanish at home, have been attending school at baseline, have completed 12th grade, have received special education, have worked as a volunteer in the year prior to random assignment, be covered by public health insurance, require help with personal care needs, not decide by themselves how to spend money, not make their own snacks and sandwiches, be in the first random assignment cohort, and have a cognitive/developmental disability (Appendix A, Table A.7). Respondents also had a higher average benefit amount in the year prior to random assignment than did non-respondents.
To account for the differences between the respondent and non-respondent samples, we used survey weights that adjusted the estimated impacts for survey non-response in all of our impact analyses for outcomes measured in survey data. The weights made the respondent cases more representative of the original sample of youth enrolled in the evaluation and reduced the potential for non-response bias. To calculate the weights, we used logistic models to estimate the propensity for a sample member to respond. In Section D of Appendix A, we describe the calculation of survey weights.
The availability of administrative data on benefit outcomes for all evaluation enrollees during the year following random assignment allowed us to assess whether non-respondents experienced
Interim Report on Broadened Horizons, Brighter Futures Chapter II: Study Design
24
changes in their benefits after random assignment that may have been correlated with non-response status (Appendix A, Table A.8). We found that non-respondents were more likely than respondents to have stopped receiving benefits during the year following random assignment. However, using administrative data on SSA disability benefit receipt, benefit amount, and use of SSA work incentives, we estimated impacts for both the 12-month survey respondents and the full research sample and found only modest differences in the estimated impacts (Appendix A, Table A.9). Overall, the results suggest that non-response to the 12-month follow-up survey did not introduce substantial bias in the estimated impacts—not surprising, given the high response rate of 87 percent.
For most of the control variables in our regression models, only a few observations had missing information, and we replaced any missing information with the mean value from the non-missing observations. For three control variables (dummy variables for “mother completed high school,” “father employed,” and “youth expects to live independently”) for which values were missing for more than five percent of the observations, we included dummy variables in our regression models to indicate that the values were missing.
For outcome measures, we typically excluded observations with missing information from analyses of those outcomes. However, for some outcome measures, information was non-randomly missing; that is, missing conditional on the values of other measures. For example, for youth who reported that they did not work for pay during the year following random assignment, earnings in that year are known to be zero. Thus, missing information on earnings could arise only for youth who worked for pay during the year. Excluding observations with missing information on earnings would exclude only youth who worked, leading to an underestimate of average earnings. For outcomes measures for which information was missing conditional on another outcome, we used a multiple imputation procedure.29
B. Process Analysis
In Section E of Appendix A, we provide a full description of our approach to dealing with missing information for control variables and outcome measures.
In the process analysis, we addressed the question: Did the demonstration test the intervention the YTD evaluation set out to test? In other words, were BHBF services provided with fidelity to the YTD service model and, if not, why not? We also examined descriptive information essential to any program replication efforts. In particular, we considered the major aspects of service delivery, along with background on BHBF and the local context and service environment in which BHBF operated. In addition, we examined the enrollment process, project implementation, service utilization, and youth satisfaction with services. Below, we describe our broad analytic approach to conducting the process analysis, followed by the data sources for this analysis.
1. Analytic Approach
Our approach to the process analysis was driven by the theory of change presented in the conceptual framework for YTD (Figure I.1). The analysis examined whether the BHBF intervention included all of the core components shown in the conceptual framework and emphasized particular components of the design. We examined the extent to which BHBF staff members were able to
29 We used a multiple imputation procedure for measures of the amount of services received, monthly employment rates, employment intensity, earnings, employment tenure, employment benefits, income, and expectations of future employment. For nearly all of these variables, no more than 6 percent of observations had missing data. The only exceptions were the amount of services received (13 to 15 percent of youth were missing data) and future employment expectations (26 percent were missing the youth response and 29 percent were missing the parent response).

Interim Report on Broadened Horizons, Brighter Futures Chapter II: Study Design
25
deliver services related to the core components and the successes and challenges they faced in doing so. We considered whether the barriers to successful transition in Miami-Dade County differed from those in the conceptual framework and how the intervention interacted with the environment and community service providers to shape youth transitions.
To ensure that we captured several perspectives on key issues, we used a systematic approach to gather information from a variety of sources. We started by identifying the key domains or areas in which we wanted to obtain information and the types of information we needed for each domain. We then developed a source grid that identified the sources that could provide reliable information for each domain of interest. The sources included interviews with program operators, direct service staff, program managers, and staff at other related community organizations. They also encompassed published statistics about the local environment (such as the unemployment rate) and administrative data from the BHBF management information system, Efforts-to-Outcomes (ETO); program observations; and case file reviews. In addition, we gathered information from youth via focus group discussions. We developed a set of standard protocols to ensure that we covered all key items and collected data in a uniform fashion. The protocols included open-ended sections to capture information about unexpected challenges or successes. (For a detailed description of our analytic approach to conducting the process analysis, see Rangarajan et al. 2009a.)
The use of more than one perspective on key domains was a central element of our process analysis. To verify and analyze key questions, we assessed the extent to which multiple respondents suggested the same types of input and insights, and how often they reported different experiences. The different perspectives might reflect information obtained from (1) different sources by the same informants (information provided by staff during site visit interviews vs. information staff entered into ETO while delivering services); (2) staff in different agencies (for example, BHBF staff at ServiceSource vs. staff of other agencies participating in the project); or (3) staff at different levels within an organization. The different perspectives provided a fuller understanding of implementation issues.
2. Data Sources and Sample
We tapped a wide range of qualitative and quantitative data sources to inform the process analysis, gathering qualitative data from interviews and focus group discussions during site visits to the project and obtaining quantitative data primarily from ETO. Project document reviews and ongoing communications with project management also informed the analysis.
The analysis of BHBF’s implementation relied primarily on qualitative data collected during site visits. The evaluation team assigned to BHBF made four site visits to Miami-Dade County to study the project and interview staff and partners. The first visit, in September 2008, supported an early assessment of BHBF enrollment activities and the implementation of services (O’Day et al. 2009). The second visit, in May 2009, was not primarily for evaluation purposes but rather to underscore the need for emphasis on employment services and the placement of participants in paid jobs, consistent with the YTD conceptual framework. During the third and fourth visits, in September/October 2009 and May 2011, the evaluation team systematically gathered data for assessing project operations. During each of these latter visits, the team conducted interviews with BHBF staff, either individually or in groups, and reviewed participant case files. In addition, during the May 2011 visit, the team interviewed key community partners and conducted four focus group discussions with BHBF participants. Finally, the evaluation team engaged in biweekly telephone conversations with project management (SSA participated in every other call) and reviewed project documents, such as monthly management reports and quarterly reports to SSA.

Interim Report on Broadened Horizons, Brighter Futures Chapter II: Study Design
26
As mentioned in Chapter I, given that SSA wanted to ensure that all YTD projects delivered strong services, it provided funding through the evaluation contract for a technical assistance provider, TransCen, to help the projects design and implement services and make certain that all recommended components were included in the projects’ service approaches. As an integral part of the evaluation, TransCen helped BHBF implement the core employment-focused components and integrate them into the project’s intervention; it delivered other technical assistance as needed. The evaluation team met regularly with TransCen to learn about project-specific issues and challenges. Information obtained from these meetings also fed into the process analysis and helped the evaluation team understand the project’s successes and challenges.
The process analysis relied heavily on quantitative data from the BHBF management information system. As part of the YTD evaluation, each project was provided with ETO, which served as a case management tool for project line staff and a management tool for project managers, and provided information for the evaluation on services delivered. Process analysis data on enrollment activities and service utilization came from ETO. Staff members used ETO to record outreach efforts related to enrolling youth in BHBF and information related to the provision of services to or on behalf of enrolled youth. Services included individualized services, such as assistance in preparing a resume, and group services, such as conducting a job fair. Staff also entered information on services provided on behalf of youth, such as contacting a community partner to arrange services for a specific youth. Staff time on the project not directed to helping specific youth was not included in ETO (for example, meeting with community partners to discuss service needs for YTD youth generally). In addition, staff time provided on behalf of youth but not involving the delivery of services was not included in ETO (for example, time spent travelling to meet with a youth.30
We used the ETO data to address critical questions related to enrollment efforts, participant take-up of project services, type and level of services, and other service delivery issues. The sample for the analysis of enrollment included all youth randomly assigned to receive an offer of BHBF services (that is, all treatment group members), while the sample for the analysis of service utilization included just those treatment group youth who enrolled in BHBF (about 84 percent of all treatment group youth). We had 15 months of ETO data available (through December 2011). As part of the process analysis, we also assessed the use of ETO by project staff and addressed its strengths and limitations in tracking services.
The process analysis relied on ETO data to describe service utilization among youth in the treatment group who had participated in BHBF. In contrast, the impact analysis of service utilization used data from the 12-month follow-up survey to compare service utilization among treatment and control group youth. For several reasons, data from the survey are not directly comparable to ETO data. For example, ETO may provide more complete data on service utilization because the data were entered by project staff at the time of service delivery, whereas the follow-up data rely on youths’ recall of services received. Furthermore, ETO data reflect staff time spent on services with or on behalf of a specific youth. In contrast, youth reports in the survey data did not include efforts made on their behalf when the efforts did not directly involve them (such as calls made by BHBF
30 Our analysis suggests that, in some cases, certain services were improperly omitted from ETO by YTD project
staff at all six of the random assignment sites (see O’Day et al. 2009 for information on the quality of ETO data for BHBF approximately six months after the start of project operations). Problems occurred despite the evaluation team’s delivery of substantial technical assistance to site staff on the use of ETO. Information to correct past omissions was not available. However, additional technical assistance was provided to reduce improper omissions going forward.

Interim Report on Broadened Horizons, Brighter Futures Chapter II: Study Design
27
staff to potential employers). In addition, our analysis of ETO data covered 15 months following random assignment, whereas our analysis of the follow-up survey covered 12 months after random assignment. On the other hand, the follow-up survey data could reflect services not captured in ETO because youth reports of service receipt included services provided by organizations or programs other than BHBF, whereas ETO captured BHBF services only.
We used data from the baseline survey to provide information on the characteristics of the youth the project intended to serve, allowing us to develop useful descriptions of the target population and those who enrolled in project services. We compared the baseline characteristics of treatment group youth who participated in BHBF with the baseline characteristics of treatment group youth who were offered the opportunity to receive project services but chose not to participate, using the baseline survey data and SSA administrative data on earnings and benefits. Finally, data from the 12-month follow-up survey provided information on participants’ satisfaction with project services. Table II.4 summarizes the key sources of data for the process analysis of BHBF.
Table II.4. Data Sources for the Process Analysis
Methodology Time Period Number of Observations Nature of Information
Site visits: BHBF staff interviewsa
9/2008 9/2009 5/2011
8 staff, 4 managers 9 staff, 3 managers 9 staff, 3 managers
BHBF service delivery
Site visits: partner interviews
9/2008 9/2009 5/2011
representatives of 2 partner organizations representatives of 4 provider organizations; representatives of 2 partner organizations representative of 1 provider organization
BHBF partnerships Other services in the county; BHBF partnerships Other services in the county
Site visits: focus groups 5/2011 20 BHBF participants Services received and satisfaction
Efforts-to-Outcomes (ETO)
15 months after RA 460 treatment group members
BHBF enrollment efforts and results
Efforts-to-Outcomes (ETO)
15 months after RA 388 BHBF participants Service efforts
YTD baseline survey 12 months before RA 460 treatment cases Background information
YTD 12-month survey 12 months after RA 304 BHBF participants who responded to the survey
Satisfaction with BHBF services
SSA administrative records 12 months before month of RA
460 treatment cases Benefits
SSA administrative records Year before year of RA
460 treatment cases Earnings
SSA administrative records 12 months after RA 388 BHBF participants (less 5 deceased participants)
Use of SSA waivers and work incentives
aTwo researchers and two research assistants conducted each of the site visits; however, an additional research assistant joined the team on the third visit to help with focus group discussions.
RA = random assignment


29
III. IMPLEMENTATION OF BROADENED HORIZONS, BRIGHTER FUTURES
BHBF sought to promote the economic self-sufficiency of youth with disabilities by providing them with customized employment services, benefits counseling, and (through its relationships with partners) individual development accounts (IDAs) and financial literacy training. The project staff assisted participants in obtaining competitive employment based on their individual interests, skills, and desires, primarily through customized job placements. BHBF served 388 randomly assigned youth who were 16 through 22 years old at enrollment, all of whom lived in Miami-Dade County and received Social Security disability benefits. Community employment development specialists (CEDS), employment specialists, and benefits specialists provided the services, which were delivered in individual or small group formats, supplemented by workshops, conferences, and job fairs. The project’s services were enhanced by formal and informal ties with other service providers, including Miami-Dade County Public Schools (M-DCPS) and the Florida Division of Vocational Rehabilitation (DVR), which also provided transition services to youth enrolled in BHBF.
The project staff members were located in two offices, one in North Miami and the other in the southern part of Miami-Dade County. The CEDS were the core personnel providing services to BHBF participants. They enrolled youth as participants in the project, began the person-centered planning (PCP) process with participants and their families, referred participants to the benefits specialists, coordinated social services, and provided employment services. The employment specialists focused exclusively on contacting employers and helping youth find employment. The benefits specialists provided intensive benefits counseling and advisement to BHBF participants and their families, and assisted youth in developing IDAs and using other SSA waivers for YTD.
This chapter describes youth enrollment in BHBF and staff efforts to provide services, including person centered planning, benefits counseling, career preparation, work-based experiences, post-placement follow-up, and case management. In the initial sections of this chapter, we provide an overview of the local environment in which BHBF operated, outline key partnerships, and describe project services. This information is derived from public statistics; a previous YTD report on BHBF; documentation provided by BHBF; and interviews with BHBF staff, partner agencies, and community agencies. In later sections, we present findings from field visits and statistics from the project’s management information system on the enrollment of youth in BHBF, the implementation of the intervention, and the use of services by enrolled youth. We end the chapter with conclusions and lessons learned that may be useful for similar projects.
A. Overview of the Sponsoring Organization and Its Partners
The Florida regional office of ServiceSource, based in Clearwater, was the lead agency for the BHBF YTD project. ServiceSource has served individuals with disabilities in Florida since 1959 and individuals with disabilities in Miami-Dade County since 1990. It is one of four affiliates of the ServiceSource Network, headquartered in Alexandria, Virginia, that share resources, expertise, and best practices in serving individuals with disabilities. ServiceSource manages a variety of projects in Florida, including a Work Incentives Planning and Assistance (WIPA) project,31
31 WIPA projects provide beneficiaries with information about and assistance in using SSA work incentives. SSA
funds 102 WIPA projects throughout the country.
and participates in

Interim Report on Broadened Horizons, Brighter Futures Chapter III: Implementation of BHBF
30
the Benefit Offset National Demonstration (BOND).32
BHBF was initiated on a pilot basis in January 2007 to demonstrate its ability to enroll youth and deliver services. The pilot represented a new effort on the part of ServcieSource to serve youth. During the year-long pilot phase, BHBF enrolled and served 21 youth. Also during this phase, ServiceSource modified the intervention by expanding the eligible population from the original target group of in-school youth to include out-of-school youth and increasing the project’s capacity to deliver benefits planning services. BHBF was one of three YTD pilot projects selected by SSA in November 2007 for full implementation from April 2008 through March 2012.
ServiceSource is also an Employment Network under the Ticket to Work Program, which enables it to receive payments from SSA for Social Security disability beneficiaries whom it has helped to find and keep employment.
Beginning during the pilot phase and continuing through full implementation, ServiceSource initiated and fostered strong working relationships with a number of national and local service providers, which significantly enhanced BHBF. Most notable among these partner organizations were the National Disability Institute (NDI) and the Human Services Coalition (HSC), with which ServiceSource executed memoranda of understanding formalizing their roles in BHBF. NDI promotes income and asset development for people with disabilities. During the first 18 months of full project operation, NDI provided training to BHBF staff on public benefits specific to Florida that may be relevant to youth with disabilities. The training covered state-specific policies and the relationship between resource limits and continued eligibility for various benefits. HSC is a Miami-based human services agency that provides economic opportunities to individuals with the goal of helping them and their communities to escape poverty. Through its Prosperity Campaign, HSC provides financial literacy training, tax preparation assistance, and linkages with other anti-poverty programs to low- and middle-income Miami residents. For BHBF, HSC developed informational materials and curricula, delivered training to participants on financial literacy, and provided training to project staff on state and local programs for low-income people. HSC also sponsored annual prosperity fairs for service providers, BHBF participants, and their families. The purpose of these fairs was to link youth and families with services and benefits for low-income people. HSC also connected BHBF participants with community organizations in Miami-Dade County that administered IDAs.33
In addition to its formal arrangements with NDI and HSC, BHBF had informal relationships with several agencies that serve youth with disabilities in Miami-Dade County. Through the project’s relationships with M-DCPS and DVR, BHBF staff participated in transition planning for specific
These organizations, which included the YWCA and Partners for Self-Employment (PSE), blended public and private funds to provide IDAs with a $2 for $1 match. Each organization established permissible goals for the IDA per the requirements of their funding sources; these goals varied by organization and included purchasing a home, starting or expanding a business, paying for postsecondary education, and buying an automobile.
32 BOND is a national random assignment demonstration to test whether allowing individuals to retain $1 of SSDI
benefits for $2 of earnings increases employment and decreases reliance on SSDI benefits. ServiceSource provides work incentives counseling and employment counseling under the demonstration.
33 IDAs are matched savings accounts in which participants who meet certain criteria (such as having low financial assets) save earned income and receive matching funds pursuant to any of several prescribed goals. The program is administered by the Office of Community Services (OCS) within the Administration of Children and Families, U.S. Department of Health and Human Services. OCS awards grants to nonprofit entities and state, local, and tribal governments to administer IDA projects. Grantees must acquire an equal share of non-federal funds to support the program. Grantees account for the federal grant funds and the non-federal cash in special accounts called Project Reserve Funds, from which they support program costs and provide funds to match participant IDA savings.

Interim Report on Broadened Horizons, Brighter Futures Chapter III: Implementation of BHBF
31
participants to ensure that they received the services to which they were entitled from these agencies and to coordinate the delivery of all services to those youth. Also, through the project’s informal relationships with the South Florida Workforce Investment Board and the Business Leadership Network of Miami-Dade County, BHBF participants were able to access job listings, the summer youth employment program, and other employment opportunities.
TransCen, Inc., under subcontract to Mathematica, provided training and technical assistance to all of the YTD projects, including BHBF. TransCen trained project staff on outreach to employers for job development, individualized and customized employment services, benefits planning, case management, and re-engagement of uninvolved participants. TransCen staff also helped the CEDS and employment specialists develop strategies and tools for PCP and networking with employers to identify employment opportunities for youth. TransCen delivered training and technical assistance through annual YTD conferences, site visits, monthly conference calls with staff from all YTD projects, and telephone calls directly with BHBF staff.
B. Local Context and Infrastructure
1. County Socioeconomic Characteristics
BHBF operated in a large urban county with significant multicultural influences. Of Miami-Dade County’s 2.5 million residents, nearly three-quarters (72 percent) speak a language other than English at home (Table III.1). The population of Miami-Dade County has less education and income than do the populations of Florida and the entire United States. Just 77 percent of adult residents of the county have graduated from high school, compared with more than 85 percent of adults in Florida and the United States. The county’s median household income ($40,219) is below that of the state ($44,409) and fully 20 percent below that of the country as a whole ($50,046). Twenty percent of residents have incomes below the federal poverty level, which exceeds the poverty rates for both the state and the nation. The poverty rate among county residents with disabilities is substantially higher (30 percent). Among county residents, about 15,000 children under 18 years of age and 126,000 adults age 18 or older receive SSI benefits. Tourism has traditionally been and remains the principle industry in Miami-Dade County; however, the county’s economy is becoming more diversified, due in large measure to the growth in international trade and banking.34
2. Existing Services for People with Disabilities
The tourism industry was hit especially hard by the national economic recession that began late in 2007.
Below we briefly describe some of the services available to youth in Miami-Dade County, including those provided by M-DCPS, DVR, and the Agency for Persons with Disabilities (APD).
M-DCPS is the fourth largest public school district in the U.S. and is distinguished by a high degree of cultural diversity and a high proportion of students from low-income families. Of the 344,000 students in the district, an estimated 49,000 students with disabilities are enrolled in exceptional education (often referred to as special education). The district is divided into six regions, each with approximately six high schools. M-DCPS has three transition coordinators who, along with exceptional education teachers and the high school exceptional education resource specialists (for mainstreamed students), coordinate the transition process for students with disabilities. This
34 See http://www.city-data.com/us-cities/The-South/Miami-Economy.html.
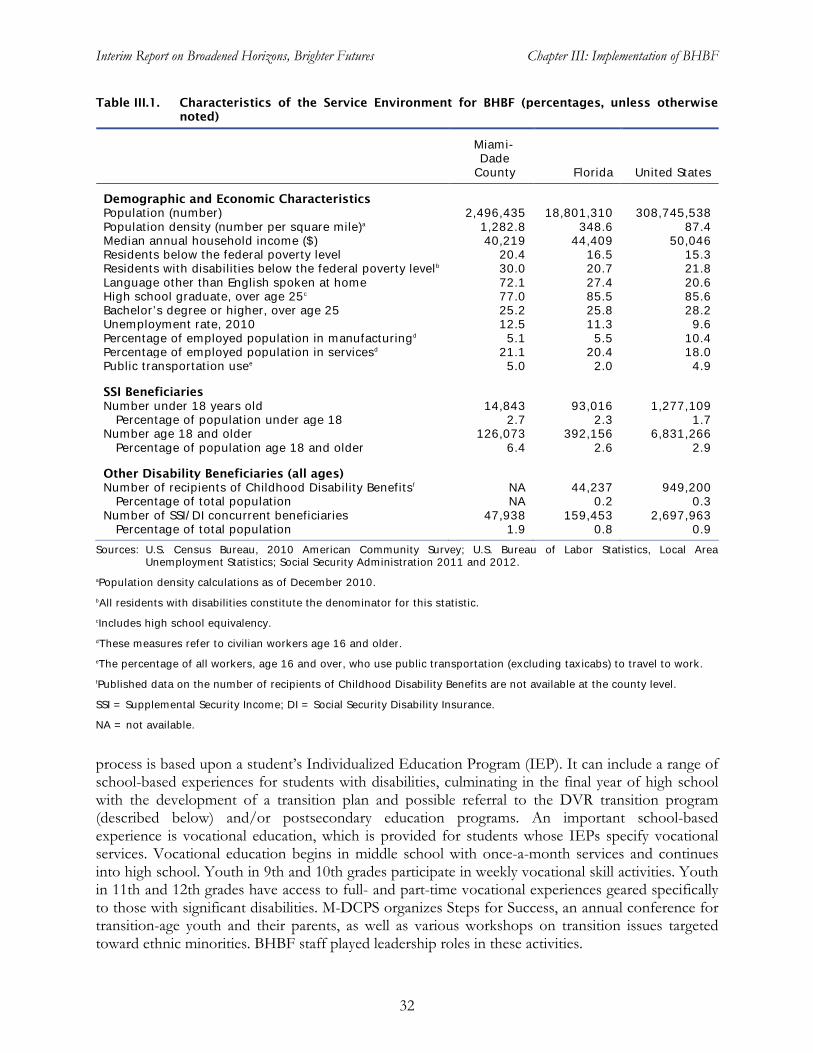
Interim Report on Broadened Horizons, Brighter Futures Chapter III: Implementation of BHBF
32
Table III.1. Characteristics of the Service Environment for BHBF (percentages, unless otherwise noted)
Miami-Dade
County Florida United States
Demographic and Economic Characteristics Population (number) 2,496,435 18,801,310 308,745,538 Population density (number per square mile)a 1,282.8 348.6 87.4 Median annual household income ($) 40,219 44,409 50,046 Residents below the federal poverty level 20.4 16.5 15.3 Residents with disabilities below the federal poverty levelb 30.0 20.7 21.8 Language other than English spoken at home 72.1 27.4 20.6 High school graduate, over age 25c 77.0 85.5 85.6 Bachelor’s degree or higher, over age 25 25.2 25.8 28.2 Unemployment rate, 2010 12.5 11.3 9.6 Percentage of employed population in manufacturingd 5.1 5.5 10.4 Percentage of employed population in servicesd 21.1 20.4 18.0 Public transportation usee 5.0 2.0 4.9
SSI Beneficiaries Number under 18 years old 14,843 93,016 1,277,109
Percentage of population under age 18 2.7 2.3 1.7 Number age 18 and older 126,073 392,156 6,831,266
Percentage of population age 18 and older 6.4 2.6 2.9
Other Disability Beneficiaries (all ages) Number of recipients of Childhood Disability Benefitsf NA 44,237 949,200
Percentage of total population NA 0.2 0.3 Number of SSI/DI concurrent beneficiaries 47,938 159,453 2,697,963
Percentage of total population 1.9 0.8 0.9 Sources: U.S. Census Bureau, 2010 American Community Survey; U.S. Bureau of Labor Statistics, Local Area
Unemployment Statistics; Social Security Administration 2011 and 2012. aPopulation density calculations as of December 2010. bAll residents with disabilities constitute the denominator for this statistic. cIncludes high school equivalency. dThese measures refer to civilian workers age 16 and older. eThe percentage of all workers, age 16 and over, who use public transportation (excluding taxicabs) to travel to work. fPublished data on the number of recipients of Childhood Disability Benefits are not available at the county level.
SSI = Supplemental Security Income; DI = Social Security Disability Insurance.
NA = not available.
process is based upon a student’s Individualized Education Program (IEP). It can include a range of school-based experiences for students with disabilities, culminating in the final year of high school with the development of a transition plan and possible referral to the DVR transition program (described below) and/or postsecondary education programs. An important school-based experience is vocational education, which is provided for students whose IEPs specify vocational services. Vocational education begins in middle school with once-a-month services and continues into high school. Youth in 9th and 10th grades participate in weekly vocational skill activities. Youth in 11th and 12th grades have access to full- and part-time vocational experiences geared specifically to those with significant disabilities. M-DCPS organizes Steps for Success, an annual conference for transition-age youth and their parents, as well as various workshops on transition issues targeted toward ethnic minorities. BHBF staff played leadership roles in these activities.

Interim Report on Broadened Horizons, Brighter Futures Chapter III: Implementation of BHBF
33
The Florida DVR’s transition unit for Miami-Dade County has a presence in each of the public high schools. As reported by DVR staff, this unit employed four regular counselors, three senior counselors, and four technicians in 2009 and served 1,154 youth, with 1,373 additional youth waiting for services.35
APD provides services to assist Floridians with developmental disabilities to live, learn, and work in their communities. It uses federal and state funds, including Medicaid waiver services funds, to provide habilitation, residential treatment, independent living, employment, and other services to individuals with developmental disabilities. Through formal service authorizations, individuals are assigned to service levels or “tiers” that govern the type and amount of services they may receive.
DVR involvement in the transition process is not required for all youth; rather, it is dependent on the goals specified in a student’s IEP and typically occurs during his or her final two years of high school. DVR also has counselors that serve working-age individuals with disabilities throughout the county, offering clients financial support for education and training, vocational assessments, and purchase of assistive technology or other equipment. The Florida DVR received stimulus funds under the American Recovery and Reinvestment Act in 2009. According to DVR staff, the agency designated these funds for on-the-job training for clients who were not ready for paid work.
3. Gaps in Existing Services
While the services described above were potentially available to youth with disabilities and their families and make Miami-Dade County look like a service-rich county, BHBF staff and representatives of service providers we interviewed told us that the services often were fragmented and uncoordinated, and many agencies had waiting lists for youth to receive services. Managers of several agencies that serve youth reported serving few youth with disabilities other than those referred by BHBF. BHBF staff explained that the waiting lists at some agencies in effect during most of the BHBF project required that applications for services be submitted much earlier for the youth so that they could receive services promoting smooth transitions to higher education, independent living, or employment. Absent a designated service broker, a youth with disabilities easily could fall through the gaps in Miami-Dade County’s poorly integrated system and receive few or no services.
Although M-DCPS initiates some vocational education in middle school, serious transition planning for students with disabilities does not begin until the spring semester of their final year in high school—too late for effective planning of post-school services (Johnson et al. 2002). During interviews in 2008 and 2009, M-DCPS transition coordinators told us that their large caseloads, averaging 500 seniors, made it difficult for them to provide the in-depth services that youth needed for successful transitions.
BHBF staff reported that services through DVR also proved difficult to access for some youth. In August 2008, five months after BHBF began providing services under full implementation, DVR adopted an order of selection because it had limited resources to serve those in need of vocational services. Upon application, persons seeking services from DVR were assessed to determine the
35 Data on the number of M-DCPS 12th grade students with IEPs—the potential population in need of transition services from DVR—are not readily available. In the 2009-2010 school year, 38,000 (11 percent) of the 346,000 pre-kindergarten to 12th grade students enrolled in M-DCPS had IEPs. Assuming a consistent ratio across grades, about 2,500 students (11 percent of the 23,000 12th grade students) would have had IEPs and been in need of transition services from DVR. (Data are from the Florida Department of Education, Education Information and Accountability Services (2012).

Interim Report on Broadened Horizons, Brighter Futures Chapter III: Implementation of BHBF
34
severity of their disabilities and assigned a service priority, ranging from category one for individuals with the most significant disabilities to category three for individuals with less significant disabilities. Most SSI and DI beneficiaries automatically were classified as category one or two; BHBF staff worked with DVR to have YTD participants classified as category one. However, even category one applicants were placed on a waiting list, with an expected waiting time for services of about six months, according to BHBF staff. By May 2010, project staff reported that participants no longer had to spend time on a waiting list before receiving DVR-funded services, as DVR had successfully reduced the number of individuals waiting for services. BHBF staff reported, however, that funding for rehabilitation services, such as higher education, supported employment, on-the-job training and equipment and supplies beneficiaries needed for employment, often was difficult to access.
BHBF staff reported that youth who needed APD services also had to wait to receive services, sometimes for five to ten years, depending upon the specific services needed. Once individuals were determined eligible they sometimes had difficulty in obtaining the level of service they need. For example, an individual who lived at home and received APD services may have found it difficult to obtain approval for additional services needed to live independently in the community.
C. Organization and Staffing of BHBF
BHBF’s target population was youth ages 16 through 22 receiving Social Security disability benefits and residing in Miami-Dade County at the time of enrollment in the evaluation. Mathematica recruited into the evaluation only those youth on SSA-generated lists of SSI, DI, and CDB beneficiaries. To better deliver services, BHBF divided the county into north and south regions, each served by its own office. About two-thirds of the project participants were served out of the south office and one-third out of the north office.
The ServiceSource executive director, based in Clearwater, Florida (approximately 270 miles from Miami-Dade county), had overall responsibility for BHBF as its project director. He was responsible for overall project oversight, including supervision of the project manager, partner subcontracts, and all required reporting and documentation. His role was to ensure that the project operated smoothly and achieved its objectives. A full-time BHBF project manager, based in Miami-Dade County, was responsible for the day-to-day operations of BHBF, including staff training and supervision, case reviews, and coordination with formal project partners and other service providers. An ETO site administrator, based in Clearwater, spent about 50 percent of his time throughout most of the project’s period of performance offering supplemental training to BHBF staff on ETO, monitoring ETO to ensure accuracy of the data, and resolving ETO problems. He also worked with the project manager to produce ETO reports for monitoring the delivery of services and employment outcomes.
At the beginning of the project, five CEDS and three benefits specialists provided services directly to youth. A ninth staff member, designated as an employment specialist, was added in mid-2008. This additional staff member was needed to provide a sharper focus on connecting youth with employers. Among the original eight staff, three of the CEDS and two of the benefits specialists worked in the south office and the rest worked in the north office. The employment specialist was based in the south office, but also worked with youth in the north office. Low staff turnover provided consistency for the project and minimized the need for hiring and training new employees. Of the first nine staff members, seven remained with the project through February 2012. In the final year of the project, management sought to hire additional employment specialists to further sharpen the focus on employment. However, this proved to be difficult and time-consuming due to a

Interim Report on Broadened Horizons, Brighter Futures Chapter III: Implementation of BHBF
35
scarcity of applicants experienced in interacting with employers. Two well-qualified individuals were eventually hired as employment specialists in September 2011 and were based in the north office.
BHBF staff had varying qualifications and training. The CEDS and benefits specialists had Master’s Degrees in human services fields and/or at least two years experience providing services to individuals with disabilities. The employment specialists had direct experience working with employers to create employment opportunities for youth with disabilities. The project manager trained the CEDS and employment specialists internally. Each of the benefits specialists completed a four-day training program through Virginia Commonwealth University on the delivery of benefits planning services and became certified Community Work Incentives Coordinators.
The CEDS provided the core set of BHBF services to participants, while the employment specialists focused on job placement and related follow-up services. Each CEDS enrolled treatment group members as participants in the project, conducted PCP with participants and their families, referred participants to the benefits specialists, coordinated social services, and provided employment services. Employment services included vocational preparation, assistance with finding jobs, and follow-up services. These staff also contacted employers to identify job opportunities for youth. While the CEDS offered an array of PCP, service coordination, and employment services, the employment specialists focused entirely on employer outreach, job placement, and placement follow-up services. When a youth was ready for employment, but a job had not yet been identified, the CEDS met with the youth and the employment specialist to identify potential job opportunities. The employment specialist then provided intensive job search assistance and employer connections to these job-ready youth, while the CEDS provided any necessary case management services. Each CEDS had a relatively stable caseload of roughly 50 active participants during the most intense part of the demonstration, while the employment specialist (just one at that time) worked with an ever-changing group of 20 to 30 participants, depending on the number who were job ready.
The benefits specialists provided benefits planning services to BHBF participants and their families, and assisted youth in developing IDAs and using the other SSA waivers for YTD (Appendix B). These staff provided individualized counseling on benefits and waivers, interfaced on participants’ behalf with SSA field office staff and the south Florida Area Work Incentive Coordinator (AWIC; an employee of SSA who serves a specific geographic area as an expert on SSA work incentives and employment support programs), and assisted participants and their families in applying for other benefits, such as food stamps and subsidized housing. During the last 18 months of the project, BHBF management reduced the number of benefits specialists from three to two as more participants completed the benefits planning process. Each of these specialists had an active caseload of about 60 participants throughout the life of the project. The benefits specialists communicated frequently with the CEDS regarding participants that they served jointly.
At the outset of the project, the project director and project manager held weekly telephone meetings to discuss BHBF progress and issues. These meetings became less frequent as the project matured, however, and the conversations tended to focus on specific critical issues rather than on more general operations. The geographic distance of the ServiceSource Florida Regional Office headquarters in Clearwater from the BHBF offices in Miami limited the in-person contact between senior management and BHBF staff. Both the project director and the project manager reported to us that it would have been beneficial for the project director to have had greater ongoing involvement in BHBF. For example, the project director could have provided the project manager with more direct support on management issues related to the project’s shift toward more intensive employment services. With more direct oversight, the project director might have seen more opportunities to help staff improve the services they delivered to participants.

Interim Report on Broadened Horizons, Brighter Futures Chapter III: Implementation of BHBF
36
The project manager had strong relationships with her staff. She used various communication mechanisms, including monthly group meetings at the south office with the entire project staff. She also met with staff individually each month. She conducted case reviews with individual staff and groups of staff at each office, and routinely communicated with staff about participants in difficult or unusual circumstances. Although based in the south office, she visited the north office at least monthly.
The project manager worked very closely with the ETO site administrator to ensure quality data entry on service efforts and employment outcomes into ETO by project staff. These two individuals monitored ETO reports to ensure that staff were providing high levels of employment services, contacting all participants frequently, and achieving desired employment outcomes for the youth they served. To be more directly involved in ETO activities, the ETO site administrator visited the BHBF offices at least once per month to review ETO data and provide training to staff on data entry, report generation, and use of the system to manage caseloads.
D. BHBF Services
In this section, we describe the services that BHBF provided to youth with disabilities in Miami-Dade County. Figure III.1 shows the flow of project services as planned for BHBF. Starting with the outreach process and the enrollment interview, the CEDS worked with youth to identify their employment and/or education goals and service needs, and empower them through a PCP process.36 During their enrollment interviews, youth received an overview of project services and the SSA waivers for YTD. Youth who formally enrolled in the project were referred to benefits specialists, who met with them to explain their benefits and how they could use the waivers and standard SSA work incentives to support employment. The CEDS engaged participants in various assessments, resume writing, job tours, and unpaid work experiences. They either assisted participants in identifying jobs, or referred them to employment specialists for this assistance. They also encouraged and supported participants who desired to complete high school or enroll in postsecondary education or training programs. Both the CEDS and the benefits specialists attempted to involve family members in enrollment interviews, as well as throughout the delivery of project services; however, family involvement was not central to BHBF.37
1. Enrollment
Participants who achieved paid employment were offered financial literacy training and assistance in implementing IDAs by HSC and its partners, the YWCA and PSE. The formal and informal relationships that BHBF established with other partner organizations helped project staff to link participants with additional employment, transition, and social and health services to support their attainment of employment and independence.
After randomly assigning a youth to the evaluation’s treatment group, Mathematica used the ETO data system to transfer basic information about the youth, including name and contact information, to BHBF. Upon receipt of this information, the project manager assigned the youth to
36 We use “PCP” to refer to both the person-centered planning process and the product of that process, a person-centered
plan. 37 During our interviews with them, several BHBF staff members recommended that family involvement be a
stronger component of future employment-focused interventions for youth with disabilities. The YTD project operated by the City University of New York included a number of service components explicitly designed for parents and other family members (Fraker et al. 2011).
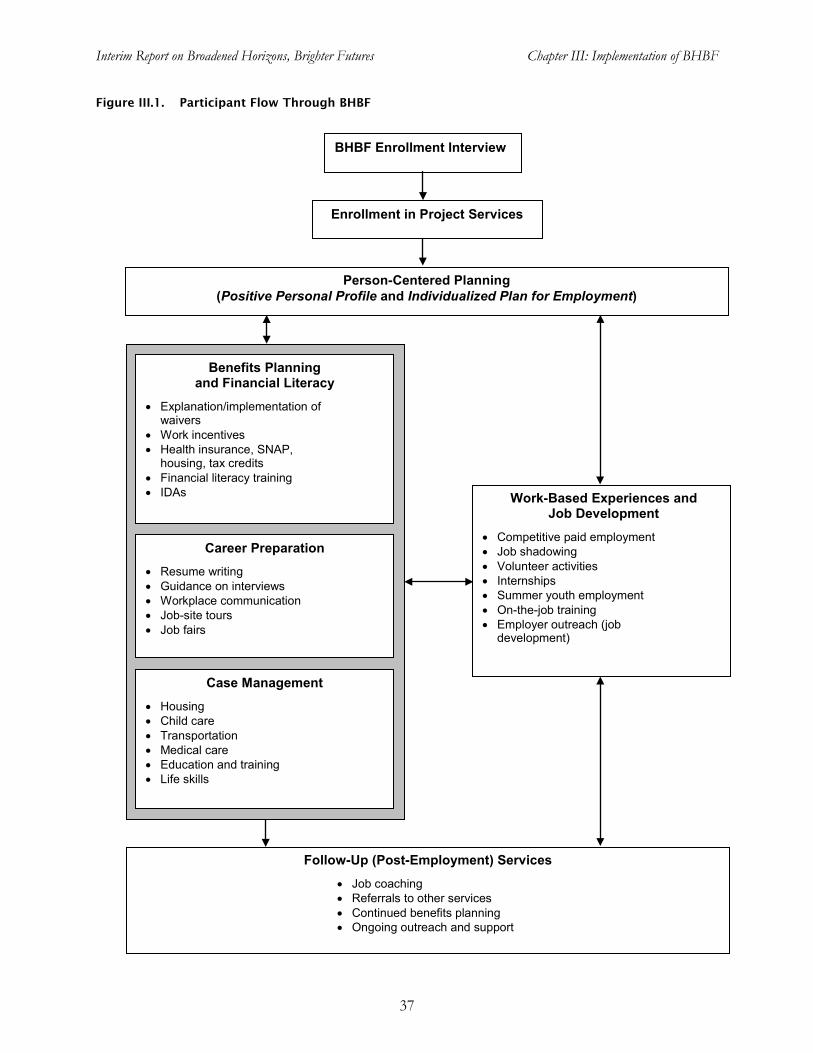
Interim Report on Broadened Horizons, Brighter Futures Chapter III: Implementation of BHBF
37
Figure III.1. Participant Flow Through BHBF
Follow-Up (Post-Employment) Services
• Job coaching • Referrals to other services • Continued benefits planning • Ongoing outreach and support
Benefits Planning and Financial Literacy
• Explanation/implementation of waivers
• Work incentives • Health insurance, SNAP,
housing, tax credits • Financial literacy training • IDAs
Enrollment in Project Services
Work-Based Experiences and Job Development
• Competitive paid employment • Job shadowing • Volunteer activities • Internships • Summer youth employment • On-the-job training • Employer outreach (job
development)
Person-Centered Planning (Positive Personal Profile and Individualized Plan for Employment)
Career Preparation • Resume writing • Guidance on interviews • Workplace communication • Job-site tours • Job fairs
Case Management
• Housing • Child care • Transportation • Medical care • Education and training • Life skills
BHBF Enrollment Interview

Interim Report on Broadened Horizons, Brighter Futures Chapter III: Implementation of BHBF
38
both a CEDS and a benefits specialist, based on staff caseloads, language preference, and proximity of the youth’s residence to the two BHBF offices. Sometimes other factors, such as gender, also were considered.
Enrollment took place in four phases between April 2008 and September 2010. The assigned CEDS contacted the youth by telephone to schedule an enrollment interview, which typically was conducted in either the youth’s home or a BHBF office. The CEDS in the south office preferred to conduct the interview in the home so they could observe the family situation and dynamics. In addition, this approach often provided more privacy for the interview, as the south office had a fully open floor plan. The north office served a geographically smaller area with better public transportation for youth to use for attending project meetings and events. The CEDS in that office preferred to conduct the enrollment interview in the office to save on their own travel time and promote integration into the project and independence by the youth. During the interview, the CEDS completed the BHBF enrollment process with the youth, which consisted of (1) gathering supplemental data (not available from ETO) on the youth, (2) orally describing BHBF services and the SSA waivers for YTD, (3) providing written descriptions of the services and waivers, and (4) obtaining youth and/or parent signatures on various enrollment forms. Following the interview, the CEDS entered the information thus obtained into ETO and completed the steps required by the system to classify the youth as formally enrolled in BHBF.
2. Person-Centered Planning
PCP typically commenced during the enrollment interview unless the youth or family felt it would be too difficult to begin planning at that time due to fatigue or a schedule conflict. Through this self-discovery process, which was designed to foster empowerment and self-direction, the youth identified his or her goals in such areas as education, employment, and independent living. A formal element of the process was the completion of a positive personal profile listing the youth’s strengths, interests, abilities, and preferences. Following the discovery activities, the participant and CEDS completed another formal element of PCP, which was the development of an individualized plan for employment. This plan specified the youth’s employment goals and outlined the steps required to reach them, taking into account the youth’s interests, abilities, needs, and experiences. According to the CEDS with whom we spoke during our site visits to BHBF, most youth did not have clear employment goals at the time of enrollment but established them through PCP. For example, one participant’s PCP included a note that he enjoyed making desserts, and his individualized plan for employment specified the goal of becoming a baker.
Although PCP focused on participating youth, the CEDS explained that they tried to involve parents and other family members in the process to gain their support for the employment goals in the plans. They described how some parents facilitated their children’s participation in BHBF by encouraging them to pursue employment and providing transportation to job interviews and other project activities. Others questioned whether their children were capable of employment and greater independence, and were concerned about the potential loss of benefits if they were to obtain paid jobs. Some required their children to care for younger siblings or elderly family members, thus making it harder for them to participate in BHBF and hold jobs. Finally, some parents did not want their children to pursue employment while they were still in school, as they feared that doing so might reduce the likelihood that their children would succeed academically.
BHBF staff members felt that the development of strong, trusting relationships with participants and their families was critical to their success in the project. Some CEDS had multiple PCP meetings to gain more time with youth and demonstrate their commitment to them. To build

Interim Report on Broadened Horizons, Brighter Futures Chapter III: Implementation of BHBF
39
rapport with parents, CEDS sometimes provided services not directly related to the employment of their children, such as helping a mother apply for SNAP (the Special Nutrition Assistance Program, formerly known as food stamps) benefits. According to the CEDS, parents recognized that BHBF was different from other programs because of the commitment by the project staff to the families and their willingness to meet with the participants and their parents during evenings and on weekends.
3. Benefits Planning and Financial Literacy
A BHBF participant’s assigned benefits specialist typically initiated one-on-one benefits planning within a month of the youth’s enrollment in the project. This began with a more complete explanation of the five SSA waivers for YTD than the CEDS provided during the enrollment interview, as well as explanations of SSA’s standard work incentives and reporting requirements for earnings. The benefits specialist then conducted a benefits assessment for the youth, detailing the benefits received, other sources of income, and employment goals (from the individualized plan for employment). The specialist requested a benefits planning query from the SSA field office to verify benefits and any past earnings that may affect future benefits. The specialist used this information to determine which waivers and work incentives might be appropriate for the participant and assess possible eligibility for additional benefits, such as SNAP. To supplement the one-on-one benefits planning, BHBF held periodic benefits planning workshops for participants and their families. The workshops provided further encouragement for employment, underscoring the higher levels of income that participants could attain through earnings combined with the use of SSA work incentives and waivers.
Benefits planning services continued throughout a youth’s involvement in BHBF. Upon learning that a participant had found employment, the CEDS informed the assigned benefits specialist so he or she could work with the youth to implement the SSA waivers, assess the potential for using other work incentives, and underscore the importance of complying with SSA’s reporting requirements. This proactive contact helped to allay fears about the loss of benefits and prevent overpayments caused by failure to report earnings to SSA. Implementing the waivers was somewhat difficult in the first year of the project because SSA field office staff were unfamiliar with them. BHBF staff did reach out to their SSA counterparts to inform them about the waivers, however. Complementing that outreach, the SSA AWIC for south Florida provided training to field office staff on the waivers and to BHBF staff on the procedures used to implement them. Furthermore, each field office in Miami-Dade County designated a staff member to serve as a liaison to BHBF, which helped ensure that the waivers were applied correctly. The two organizations collaborated on several “YTD Days” in SSA field offices, during which the liaisons met with BHBF participants and benefits specialists to answer questions and address problems with benefits.
HSC conducted two financial literacy workshops annually for BHBF participants and their families. Each workshop consisted of two concurrent sessions—one for youth and one for parents. These sessions, which lasted several hours, covered such topics as budgeting, establishing a savings account, tax credits, and such local resources as housing subsidies. The workshops also provided a general introduction to IDAs, along with specific information on two agencies in Miami-Dade County that offered them. BHBF benefits specialists followed up with youth after the workshops as well as after they became employed to assess their interest in IDAs. Interested youth were referred to the IDA agencies.
BHBF formed partnerships with the YWCA and PSE to offer IDAs to project participants. IDA programs provided two-to-one matches of funds deposited in IDAs by account holders, up to
Interim Report on Broadened Horizons, Brighter Futures Chapter III: Implementation of BHBF
40
$2,000 deposited per year by an individual or $4,000 by a household, for a maximum of two years. To qualify for an IDA, an individual had to be at least 18 years old, attend eight two-hour training sessions within one year, have earned income, and make monthly deposits of $20 or more. BHBF benefits specialists worked with staff of the IDA agencies and the referred youth to develop savings plans that specified the monthly savings amounts and the goals for how the accumulated funds would be used. Only certain goals were permissible, and these varied by agency. The YWCA allowed accumulated IDA funds to be used to start a business, buy or repair a home, acquire additional education, or purchase an automobile for transportation to work. In contrast, PSE allowed IDA funds to be used only to start a business or purchase a home.38
Initially, all BHBF participants who aspired to open IDAs responded to the training requirement by enrolling in IDA classes the YWCA conducted in its own facility. However, transportation problems and the rapid pace of the classes made it difficult for many of the youth to participate, according to the benefits specialists. To remedy these problems, the YWCA designated an instructor to hold special classes at the BHBF offices for project participants. The BHBF benefits specialists reported that these classes were successful, but they were discontinued when the YWCA lost its IDA funding in 2009. Subsequently, BHBF referred all of its participants who wished to open IDAs to PSE for the required training, supplied in a self-paced format on a CD. Although the benefits specialists provided encouragement and support for the PSE training, few BHBF participants actually completed it. For those youth who did complete the training provided by either agency, the benefits specialists provided assistance in making deposits into the accounts, reporting earnings to SSA, and other required record keeping.
4. Career Preparation
BHBF staff, most notably the CEDS, provided participants with career preparation services and related activities. These included assisting with resume preparation, providing guidance on interviewing for jobs, discussing appropriate attire for interviews and employment, exploring the tradeoffs between working for someone else versus self-employment, and reviewing appropriate workplace communication and body language. The staff typically delivered these services through one-on-one interactions with participants, but occasionally they covered many of the same topics through job preparation workshops. During the first half of the project, participants often began the career preparation process by using Career Cruising, an interactive interest assessment tool that matches the user’s interests with potential careers. (See http://www.careercruising.com.) During the second half of the project, BHBF de-emphasized this tool in favor of such activities as mock interviews and job site tours. The CEDS also instructed participants on job search strategies, including how to use job fairs, Internet websites, newspaper job listings, flyers, bulletin boards, community agencies, and networking. In addition, BHBF cooperated with other agencies in organizing job and agency fairs, which gave participants opportunities to learn about careers and jobs by meeting and speaking with employers in a relatively low-stress environment.
5. Case Management
BHBF participants had a multitude of health and social service needs in areas such as housing, child care, transportation, medical care, and education and training, which BHBF addressed through case management. Staff initially identified the service needs of participating youth and their families
38 Through PSE, a resident of the city of Miami also could have a goal of using funds accumulated in an IDA to
purchase a computer; however, no BHBF participant used this option.
Interim Report on Broadened Horizons, Brighter Futures Chapter III: Implementation of BHBF
41
through the PCP process and continuously reassessed those needs during participants’ involvement in the project. The CEDS provided training in various life skills areas, such as goal setting, decision making, time management, interpersonal and social skills, self-esteem, management of relationships, and physical and mental health issues via workshops and one-on-one counseling. BHBF staff assembled an inventory of community agencies to which they could refer participants for services that would meet their specific needs, sharing new resources with each other during weekly staff meetings. Early in the project, the CEDS routinely accompanied youth to meetings with service providers to ensure that they actually received the needed services. This occurred less frequently with the passage of time, however, as connections between BHBF and those agencies solidified and the CEDS increasingly focused on helping participants find employment. Meanwhile, benefits specialists took over many of the case management tasks that the CEDS had conducted earlier in the project.
To help BHBF participants obtain the supports they needed to pursue their goals for employment and education, BHBF staff referred many of them to DVR and accompanied them to their appointments. About half of BHBF participants were referred to DVR, but case reviews conducted in 2009 and 2011 revealed that DVR provided few of them with services. Even among those found eligible for DVR services, results were mixed—some received adequate services while others had difficulty in obtaining job training, interpreters, assistive technologies, and other services.
BHBF staff provided limited education services to project participants. Staff assisted in-school youth by providing counseling and advice on vocational or postsecondary education and referred youth to college disability offices or other programs that provided education supports to youth with disabilities. For high school youth, staff participated in IEP and transition meetings, assisted transition coordinators with referrals to DVR and other agencies, and met with youth and families to explain adult services. They referred youth to GED classes and sometimes advocated for them to obtain the supports they needed to complete their GED. Although many youth set goals to obtain a GED or advanced education, few were able to achieve them because they were unable to obtain financial assistance or other supports. According to staff, youth opted to forego education and focused instead on employment and the more immediate gratification of a paycheck.
6. Work-Based Experiences and Job Development
Consistent with the YTD conceptual framework (Figure I.1), BHBF’s primary service objective was to ensure that project participants had work-based experiences compatible with their individual interests, skills, and abilities. Foremost among those experiences was paid employment in a competitive setting; however, during its first year, the project did not consistently deliver services well aligned with that goal. Rather, BHBF staff primarily delivered case management services, which included linking participants to a broad range of services and supports from other providers.
Because of the low levels of employment services and placements in paid jobs that BHBF staff had recorded in ETO through the spring 2009, members of the YTD technical assistance and evaluation team met with the project management and staff in May 2009 to encourage them to sharpen the focus of services on competitive paid employment. To facilitate this effort, TransCen intensified its already substantial provision of technical support to BHBF on job development and job placement. The management of BHBF set specific numeric monthly goals at both the project and individual staff member levels for contacts with prospective employers and job placements for participants. Project staff responded by strongly increasing their emphasis on employment, meeting management’s goals, and pressing ahead to set and meet yet higher goals. By the time the project
Interim Report on Broadened Horizons, Brighter Futures Chapter III: Implementation of BHBF
42
ended, 54 percent of the participants had worked in competitive paid jobs at some point during their involvement in BHBF, as recorded by project staff in ETO.
BHBF arranged a variety of work-based experiences for its participants, with the ultimate goal of helping them to obtain competitive paid jobs. These included job shadowing, volunteer activities, internships, summer youth employment, and on-the-job training. The CEDS and employment specialists encouraged youth with little work experience to participate in volunteer activities and internships to gain the social and work-related skills necessary for successful employment. For example, staff arranged internships for a number of participants with a national hotel chain with a strong Miami presence; several of these led to competitive paid jobs. Work experiences for participants who were still in school typically were arranged for the summer or outside of usual school hours.
Job development—outreach to employers for the purpose of identifying jobs for BHBF participants—intensified over the life of the project, although those efforts varied considerably across the project staff. TransCen provided CEDS and employment specialists with training and technical assistance for reaching out to employers and conducting informational interviews. TransCen staff conducted several site visits in which they held mock interviews with employers and provided feedback to staff on these interviews. This helped to focus the staff’s efforts on understanding employers’ needs and building long-term relationships with them, rather than approaching them for immediate job placements. TransCen also advised staff on working with those youth with the most severe disabilities who appeared difficult to place in employment. Despite this intensive training and technical assistance, some CEDS remained uncomfortable with reaching out to employers and developing jobs for their participants. The project manager modified her recruiting approach during the latter half of the project to seek staff with specific experience working with employers. Some of these new staff were assigned to the employment specialist role.
One designated employment specialist at BHBF was directly responsible for identifying employment opportunities for job-ready BHBF participants during the first two years of the project. He spent approximately half of his time working directly with employers. This substantially exceeded the amount of time that a typical CEDS spent with employers. The CEDS referred their job-ready youth to the employment specialist, who helped the participants to find suitable employment. Two additional employment specialists were hired in September 2011 to assist with these duties.
Although staff efforts on employment and job placements were monitored throughout the project, TransCen and Mathematica intensified the emphasis on these activities during the last half of the project. During the spring of 2010, the YTD evaluation and technical assistance teams created monitoring reports based on ETO data, which showed service efforts and first-time employment outcomes from both the participant and staff perspectives. BHBF management met on a monthly basis with representatives of SSA and the YTD evaluation and technical assistance teams to review these reports, identify issues related to employment, and track progress toward project goals.
7. Follow-Up Services
After participants had obtained employment, BHBF staff provided them with follow-up services to ensure that they were successful and retained their jobs. The CEDS or employment specialists contacted youth frequently during the first few weeks of their employment to make sure things were going smoothly. The CEDS provided short-term job coaching when necessary and referred youth to such providers as DVR and APD for those who needed longer-term job coaching

Interim Report on Broadened Horizons, Brighter Futures Chapter III: Implementation of BHBF
43
or other services to remain employed. As noted earlier, BHBF benefits specialists met with youth who had become employed to review SSA work incentives and the waivers for YTD and to remind them of the requirements for reporting earnings to SSA.
BHBF imposed no formal limitation on the amount of time that individual youth could receive services; however, project staff did close the cases of some youth who had obtained and maintained employment or had met other goals and were determined to have no ongoing need for project services. They also closed the cases of some youth who could not be contacted after multiple attempts, were in prison, had moved out of the project’s service delivery area, or could not be served for other reasons. Staff continued to reach out to and support youth whose cases had not been closed until the project ended in March 2012, regardless of when they had enrolled. Thus, while all youth received at least 18 months of services, some youth may have received up to 36 months of services. This practice allowed staff to assist some participants with second or third job placements and others—especially hard-to-serve-youth—with initial placements during the final year of the project.
E. Enrollment in BHBF
The effort to recruit youth into the BHBF evaluation and enroll them in project services began in April 2008 and ended in September 2010. As a result of that effort, 880 youth consented to participate in the evaluation. A total of 460 of the consenting youth were randomly assigned to the evaluation’s treatment group.39
1. Enrolling Youth in Project Services
BHBF staff enrolled 388, or 84 percent of these youth, as participants in project services.
As it randomly assigned youth to the treatment group, the YTD evaluation team sent contact information on those youth, as well as selected information about them from the baseline survey, to BHBF via ETO. BHBF staff reached out to the youth very quickly to enroll them as participants in project services. In Table III.2, we show that the median elapsed time between random assignment and the first contact by BHBF staff was just 2 days. Staff made contact with 95 percent of treatment group members within the first 7 days following random assignment. These findings corroborate staff reports that they moved very quickly to contact youth by telephone after receiving notice that the youth had been assigned to the treatment group. Following the initial contact, it typically required less than 2 weeks to enroll a youth in BHBF. For those who eventually enrolled (“participants”), the median duration between the first contact and enrollment was 12 days, while the median number of days from random assignment to enrollment was 15 days.
The BHBF staff devoted considerable effort to enrolling treatment group youth in project services, making a total of 2,377 contacts for that purpose. For youth who eventually enrolled, the median number of contacts was 4, and the median cumulative duration of those contacts was 2.4 hours. These included telephone calls to establish appointments and in-person meetings to explain the services and waivers. While many youth enrolled quickly, others required considerably more staff effort, with 5 or more hours required to enroll 7.5 percent of youth. Staff often integrated the PCP process with the enrollment effort, which extended the latter. For youth who ultimately did not
39 In addition, 13 of the evaluation enrollees were intentionally assigned to treatment status because they were
siblings of treatment group members. Such youth were not part of the research sample and were not included in the analysis. BHBF enrolled 12 of these youth in services.

Interim Report on Broadened Horizons, Brighter Futures Chapter III: Implementation of BHBF
44
Table III.2. Staff Efforts to Enroll Treatment Group Members in BHBF
All Participants Non-
Participants Difference P-Value
Staff Enrollment Efforts Number of outreach contacts
Total 2,377 1,909 468 Average per youth 5.2 4.9 6.5 -1.6 *** 0.01 Median per youth 4.0 4.0 5.0
Staff time per contact Average (minutes) 29.5 32.7 16.6 16.1 *** 0.00 Median (minutes) 15.0 15.0 15.0
Staff time per youth Distribution of hours (%) *** 0.00
Less than 1 15.2 12.1 31.9 -19.8 1 to less than 3 51.1 50.8 52.8 -2.0 3 to less than 5 27.0 29.6 12.5 17.1 5 or more 6.7 7.5 2.8 4.7 Average (hours) 2.5 2.7 1.8 0.9 *** 0.00 Median (hours) 2.3 2.4 1.6
Duration of Enrollment Efforts Number of days from random assignment to first attempted contact
Distribution of days (%) * 0.07 1 or less 14.3 15.2 9.7 5.5 2 to 3 53.9 53.9 54.2 -0.3 4 to 7 26.3 26.5 25.0 1.5 8 to 14 5.0 4.1 9.7 -5.6 15 or more 0.4 0.3 1.4 -1.1
Average (days) 3.3 3.2 3.7 -0.5 0.25 Median (days) 2.0 2.0 2.0
Number of days from first attempted contact to enrollment in BHBF
Distribution of days (%) 1 to 7 n.a. 17.5 n.a. 8 to 14 n.a. 32.0 n.a. 15 to 30 n.a. 32.2 n.a. 31 to 60 n.a. 12.1 n.a. 61 or more n.a. 6.2 n.a.
Average (days) n.a. 22.2 n.a. Median (days) n.a. 12.0 n.a.
Number of days from random assignment to enrollment in BHBF
Average (days) n.a. 24.4 n.a. Median (days) n.a. 15.0 n.a.
Sample Size 460 388 72
Source: The BHBF ETO management information system.
Note: The sample includes all youth who were randomly assigned to treatment group for the evaluation of BHBF. Random assignment began on April 11, 2008, and ended on September 7, 2010. The first treatment group member enrolled in BHBF on April 16, 2008; the last enrolled on September 29, 2010.
*/**/*** The difference between participants and nonparticipants is significantly different at the .10/.05/.01 level, using a two-tailed t-test for mean values or a chi-square test for distributions.
n.a. = not applicable.

Interim Report on Broadened Horizons, Brighter Futures Chapter III: Implementation of BHBF
45
enroll (“non-participants”), staff made more contacts (a median of 5) than they did for participants, but overall spent less time (a median of 1.6 hours). Most contacts with participants were made via telephone; however, face-to-face contacts represented the majority of the time spent on enrollment contacts with those youth (results not shown). Half of the face-to-face enrollment contacts took place in the youths’ home and half occurred elsewhere. This pattern substantiates staff reports of holding enrollment meetings in places convenient to the youth, as well as in the BHBF offices.
As these statistics show, BHBF staff were committed to contacting and enrolling treatment group youth quickly. The project manager set a goal of contacting youth within a day or two after random assignment, and she allowed staff to work flexible schedules to accommodate the youth and their families, which facilitated rapid enrollment. Enrollment efforts were particularly intense during certain periods; staff reported spending up to half of their work weeks on enrollment tasks during the periods of highest enrollment activity, which limited their availability to provide services to youth who already had enrolled.
2. Characteristics of Participants and Non-Participants
BHBF participants (the 388 youth who had agreed to enter the study, were randomly assigned to the treatment group, and enrolled in the project) and non-participants (the 72 youth who had agreed to enter the study, were randomly assigned to the treatment group, but did not enroll in the project) were similar at baseline in many respects. The significant differences that did exist between the two groups suggest that treatment group members who had a strong orientation toward school and work, were in better health, and of a higher socioeconomic status were more likely to enroll in BHBF. The 388 participants were similar to the 72 non-participants in most of their baseline characteristics: race, ethnicity, language, living arrangements, gender, age, type and amount of disability benefits, primary disabling condition, disability duration, and earnings history (Table III.3). Participants and non-participants differed significantly with respect to the following five baseline characteristics, however:
• School attendance. Participants were more likely to have been enrolled in regular high schools (schools that did not serve students with severe disabilities exclusively) at the time of random assignment than non-participants (35 percent versus 23 percent), and less likely to have not been attending school at all (40 percent versus 54 percent).
• Employment. Participants (24 percent) were more likely to have received job training in the year before random assignment than non-participants (14 percent). While 9 percent of participants worked for pay in the last month, only 3 percent of non-participants did so.
• Family socioeconomic status. Participants had higher annual household incomes than non-participants: 24 percent of participants had household incomes of $25,000 or more, compared with 13 percent of non-participants.
• Self-reported health status. Participants (21 percent) were less likely than non-participants (33 percent) to have reported that their health was no better than fair.
• Expectations about the future. Participants had higher expectations than non-participants for continuing their education (90 percent and 80 percent, respectively) and working for pay (92 percent and 82 percent, respectively).
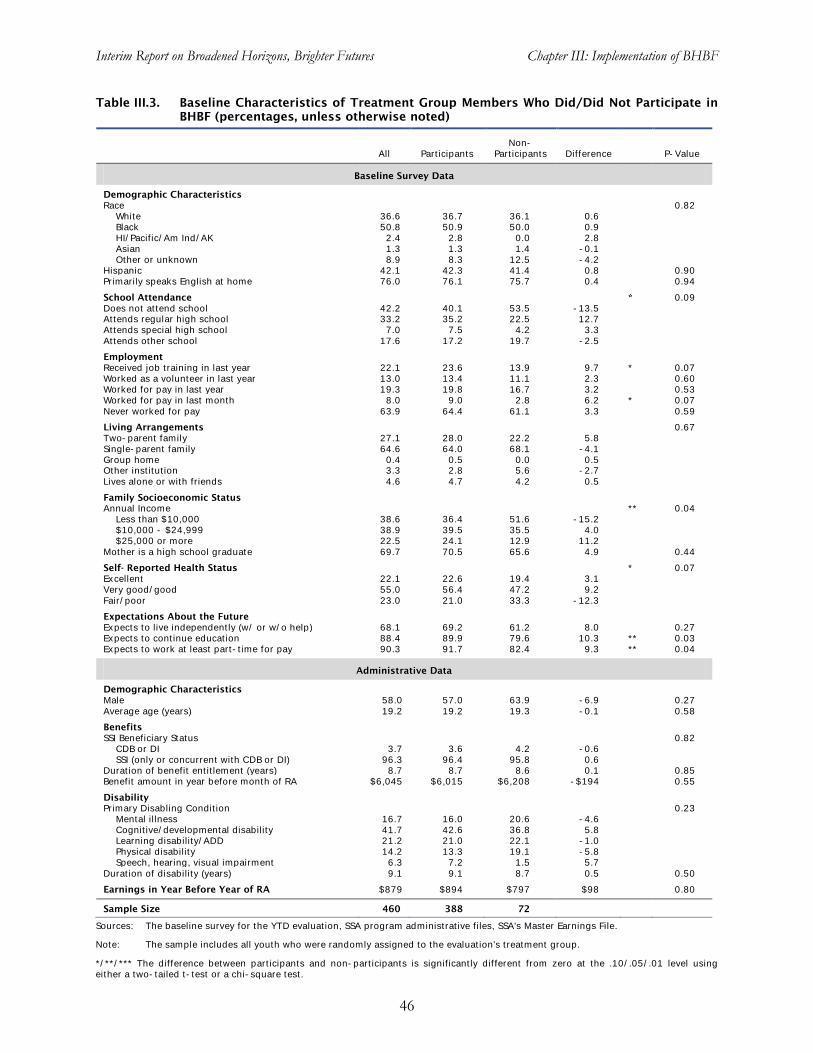
Interim Report on Broadened Horizons, Brighter Futures Chapter III: Implementation of BHBF
46
Table III.3. Baseline Characteristics of Treatment Group Members Who Did/Did Not Participate in BHBF (percentages, unless otherwise noted)
All Participants Non-
Participants Difference P-Value
Baseline Survey Data
Demographic Characteristics Race 0.82
White 36.6 36.7 36.1 0.6 Black 50.8 50.9 50.0 0.9 HI/Pacific/Am Ind/AK 2.4 2.8 0.0 2.8 Asian 1.3 1.3 1.4 -0.1 Other or unknown 8.9 8.3 12.5 -4.2
Hispanic 42.1 42.3 41.4 0.8 0.90 Primarily speaks English at home 76.0 76.1 75.7 0.4 0.94 School Attendance * 0.09 Does not attend school 42.2 40.1 53.5 -13.5 Attends regular high school 33.2 35.2 22.5 12.7 Attends special high school 7.0 7.5 4.2 3.3 Attends other school 17.6 17.2 19.7 -2.5 Employment Received job training in last year 22.1 23.6 13.9 9.7 * 0.07 Worked as a volunteer in last year 13.0 13.4 11.1 2.3 0.60 Worked for pay in last year 19.3 19.8 16.7 3.2 0.53 Worked for pay in last month 8.0 9.0 2.8 6.2 * 0.07 Never worked for pay 63.9 64.4 61.1 3.3 0.59 Living Arrangements 0.67 Two-parent family 27.1 28.0 22.2 5.8 Single-parent family 64.6 64.0 68.1 -4.1 Group home 0.4 0.5 0.0 0.5 Other institution 3.3 2.8 5.6 -2.7 Lives alone or with friends 4.6 4.7 4.2 0.5 Family Socioeconomic Status Annual Income ** 0.04
Less than $10,000 38.6 36.4 51.6 -15.2 $10,000 - $24,999 38.9 39.5 35.5 4.0 $25,000 or more 22.5 24.1 12.9 11.2
Mother is a high school graduate 69.7 70.5 65.6 4.9 0.44 Self- Reported Health Status * 0.07 Excellent 22.1 22.6 19.4 3.1 Very good/good 55.0 56.4 47.2 9.2 Fair/poor 23.0 21.0 33.3 -12.3 Expectations About the Future Expects to live independently (w/ or w/o help) 68.1 69.2 61.2 8.0 0.27 Expects to continue education 88.4 89.9 79.6 10.3 ** 0.03 Expects to work at least part-time for pay 90.3 91.7 82.4 9.3 ** 0.04
Administrative Data
Demographic Characteristics Male 58.0 57.0 63.9 -6.9 0.27 Average age (years) 19.2 19.2 19.3 -0.1 0.58 Benefits SSI Beneficiary Status 0.82
CDB or DI 3.7 3.6 4.2 -0.6 SSI (only or concurrent with CDB or DI) 96.3 96.4 95.8 0.6
Duration of benefit entitlement (years) 8.7 8.7 8.6 0.1 0.85 Benefit amount in year before month of RA $6,045 $6,015 $6,208 -$194 0.55 Disability Primary Disabling Condition 0.23
Mental illness 16.7 16.0 20.6 -4.6 Cognitive/developmental disability 41.7 42.6 36.8 5.8 Learning disability/ADD 21.2 21.0 22.1 -1.0 Physical disability 14.2 13.3 19.1 -5.8 Speech, hearing, visual impairment 6.3 7.2 1.5 5.7
Duration of disability (years) 9.1 9.1 8.7 0.5 0.50 Earnings in Year Before Year of RA $879 $894 $797 $98 0.80
Sample Size 460 388 72
Sources: The baseline survey for the YTD evaluation, SSA program administrative files, SSA's Master Earnings File.
Note: The sample includes all youth who were randomly assigned to the evaluation's treatment group.
*/**/*** The difference between participants and non-participants is significantly different from zero at the .10/.05/.01 level using either a two-tailed t-test or a chi-square test.

Interim Report on Broadened Horizons, Brighter Futures Chapter III: Implementation of BHBF
47
F. Receipt of BHBF Services
In this section, we use quantitative data from ETO to explore the services that participating youth received. We first examine the rates at which participating youth received specific types of project services and then document the timing and intensity of the services. To ensure a uniform follow-up period for all participants, we analyzed only the first 15 months after random assignment, as these data were available for all participants. To focus the analysis on substantial contacts only, we excluded contacts with participants lasting two minutes or less, such as leaving telephone messages, and contacts via letter, text messaging, and email (except those related to benefits planning). We also excluded contacts made on the day of a youth’s enrollment in BHBF.40
BHBF staff were expected to enter into ETO any service provided to or on behalf of a project participant, as well as the time spent during the service contact. The staff were trained to record separately each type of service provided during one contact. For example, if a benefits specialist discussed benefits planning with a youth for 20 minutes and provided general case management for another 30 minutes, the staff member was to record each of these services and the associated time in its own category. ETO was not intended to be a staff timesheet system, meaning that the information recorded in it was not expected to reflect all of a staff member’s work efforts. For example, time spent doing general job development was not recorded in ETO because it was not attributable to specific youth. Moreover, although the staff of BHBF received extensive training on ETO and project managers monitored the quality of data entered, the staff may not have input complete data on the services provided to or for specific youth.
The tables presented in this section summarize findings from the analysis of the ETO data as well as SSA administrative data on the use of work incentives and waivers.
41
1. PCP Development
The ETO data analyzed here thus may not fully reflect the intensity of services provided.
The PCP was a strong component of BHBF activities at the beginning of a youth’s involvement in the project. The PCP process helped a participant decide on goals and provided a framework for achieving them. Its purpose was to help the youth feel empowered to make decisions about his or her life and project services, and to inform the staff about the youth’s interest and goals. The CEDS completed PCPs for 98 percent of participants; of those, 95 percent included employment goals (results not shown).42
40 The staff of BHBF sometimes provided basic services on the day of enrollment and recorded them in ETO.
However, the evaluation team determined that those services generally were not substantive and so excluded them from the analysis of service receipt.
Development of a PCP typically occurred over the course of several meetings shortly after enrollment between a participant and BHBF staff. Due to the limitations of the ETO data, it was not possible to calculate accurately the timing of PCP completion or the number of meetings required to complete a plan.
41 We noted in Section D.6 of this chapter that BHBF management began meeting monthly with the evaluation team and SSA in the spring of 2010 to discuss ETO-based reports on service efforts and employment outcomes. These reports and meetings focused the attention of BHBF management on the delivery of employment-focused services and the achievement of positive employment outcomes by participants. They also underscored the importance of staff accurately recording their service hours in ETO. Recorded service hours increased shortly after these meetings were initiated.
42 For purposes of this analysis, PCP completion was defined as the existence of a PCP assessment in ETO; the content of the PCP was not reviewed to determine whether every section had been completed. Case file reviews of a sample of PCPs, as well as interviews with staff, suggested that, in most cases, many or all sections were completed.

Interim Report on Broadened Horizons, Brighter Futures Chapter III: Implementation of BHBF
48
Despite the emphasis on quickly developing PCPs for all participants, the plans did not appear to be central to the ongoing participation of youth in BHBF. They were intended to be living documents that would evolve as youth experienced various aspects of project services, but staff generally did not update the plans to reflect changes in youths’ goals. While nearly all BHBF participants completed a PCP shortly after their enrollment in the project, few received PCP services as part of their subsequent project services. As indicated later, in Table III.4 (under case management services), only 14 percent of participants received services to enhance or amend a PCP.
The emphasis of BHBF services on empowerment and self-direction varied by staff member and participant. Case reviews revealed that staff generally attempted to identify jobs based upon the needs and interests of the participants, but staff could have taken more steps to empower youth in completing and submitting job applications. For example, some youth needed accommodations with application activities, such as assistance in completing on-line applications to avoid being timed out of the application process. BHBF staff sometimes completed such applications for participants. It would have been more empowering for the participants if the staff had instead provided them with guidance on how to seek assistance on their own, which would have better prepared them to pursue such activities following the end of the project.
2. Types of Services Received
All participants in BHBF received some project services and most received at least one contact for each of four types or categories of services: benefits planning, employment, education, and case management. In Table III.4, we show the percentage of youth who received each type of service, as well as the breakdown of specific services within each category. The “other” services shown in the table are accumulations of all related services within the categories other than the specific listed services. For example, “other education-related service” includes general discussion with youth about their education plans. Below, we present details on the four types of services that participants received, along with explanations of how BHBF staff delivered those services.
a. Benefits Planning
Virtually every participant (more than 99 percent) received benefits planning services, which reflects the project’s emphasis on educating beneficiaries about how to use work incentives to retain some of their benefits while working (Table III.4). The high percentage of participants with such services is due to almost all participants receiving four specific benefits planning services: a general discussion of the YTD waivers and SSA work incentives, discussion of non-SSA benefits and work incentives (such as SNAP and TANF), benefits assessment, and benefits analysis and advisement. In particular, benefits assessments involved a comprehensive review and analysis of the benefits a youth and his or her family received and what work incentives could be used to support employment. Benefits specialists reported that they contacted each of their assigned youth immediately after enrollment, to give them initial advice about work incentives. They also reached out to participants upon employment to inform them about how to report their earnings and use work incentives in their specific situations. Benefits specialists also reported that participants often took the initiative to contact them when they encountered difficulties with their benefits. For example, when participants received age-18 redetermination letters, which meant that their eligibility for SSI had to be redetermined based upon the adult definition of disability, many contacted their benefits specialists, who then guided them through the redetermination process. More than half (56 percent) of participants had additional, more in-depth, discussions about YTD waivers beyond the general overview, while a lower proportion (25 percent) had additional discussions about non-YTD SSA work incentives.

Interim Report on Broadened Horizons, Brighter Futures Chapter III: Implementation of BHBF
49
Table III.4. Receipt of BHBF Services (percentages)
BHBF Participants
Any BHBF Service 100.0
Any Benefits Planning Service 99.7 Any waiver or work incentive discussion 99.7 Discussions of non-SSA benefits and work incentives (e.g., TANF and SNAP) 99.5 Benefits assessment 98.5 Benefits analysis and advisement 97.4 Additional discussions of YTD waivers (beyond general overview)a 55.9 Benefits overview 44.8 Additional discussions of non-YTD SSA work incentives (beyond general overview) 24.5 Other 68.0
Any Employment-Related Service 99.0 Career exploration and job search 95.4 Direct employment servicesb 90.2 Employment training 33.5 Other 31.7
Any Education-Related Service 83.5 Education counseling and academic advisement 68.8 Assistance with accommodations or student support services 29.9 Registration or enrollment assistance 13.7 Preparing for or attending IEP or transition meetings 12.6 Academic retention services (help to remain in school) 9.5 Accessing financial aid 7.0 Other 21.9
Any Case Management Service 95.9 General check-in 80.4 Vocational rehabilitation 41.5 Case reviews 38.9 Family support 33.0 Transportation 29.1 Legal information 15.2 Person centered planningc 14.4 Mental health 13.9 Life skills 12.6 Housing 9.8 Juvenile justice 1.3 Other 38.7
Sample Size 388
Source: The BHBF ETO management information system.
Notes: We excluded service contacts of less than two minutes and those made on the day of enrollment from this analysis. Within each service group, more than one type of service may have been recorded in ETO. The service types displayed within a group may not be exhaustive. All percentages are based on 388 participants.
a"Additional discussions of YTD waivers" includes only focused discussions of specific individual waivers or all five waivers. It does not include discussions that may have taken place during an enrollment meeting or a benefits assessment. b"Direct employment services" includes development of work experiences, job coaching, job placement, and follow-up. cPerson-centered plans were developed for 98 percent of BHBF participants; however, due to omissions in entering data in ETO, the associated person-centered planning services were not recorded for most of those participants.

Interim Report on Broadened Horizons, Brighter Futures Chapter III: Implementation of BHBF
50
The provision of assistance in accessing SSA’s standard work incentives and the waivers for YTD was an important component of BHBF’s benefits planning services. (Appendix B provides descriptions of the SSA waivers for YTD.) Table III.5 shows the percentages of BHBF participants who used the work incentives and waivers in the first 12 months after random assignment. Overall, 29 percent of participants used any of the standard work incentives or waivers. Most, but not all, of these were triggered by earned income and 16 percent of participant reported any earnings to SSA. The most frequently used work incentive, the Section 301 waiver, was not based on earnings. Seventeen percent of participants used this waiver, which allowed them to continue to receive SSI benefits temporarily following a negative CDR/age-18 redetermination. The second most commonly used work incentive was the EIE, which was used in its waiver form only by 13 percent of participants.43
Despite significant interest in IDAs by many BHBF participants and intensive counseling on the use of IDAs by the benefits specialists, only two participants actually opened accounts during the year following random assignment, according to the SSA administrative data underlying Table III.5. In contrast, according to BHBF records, 38 participants opened accounts over the entire course of the project and 10 of them achieved their savings goals.
Only a few participants used the SEIE (3 percent) or opened an IDA (0.5 percent) in the year after random assignment. And none of them used the PASS work incentive in either its standard or waiver form.
44
The ten BHBF participants who (according to project records) completed the IDA training, opened accounts, and achieved their savings goals represent remarkable success stories, having overcome barriers that were prohibitive for most participants. Successful participants purchased cars, paid for postsecondary education, and opened businesses (such as a catering business). “Rico’s Story” on page 52 provides an example of a participant’s successful use of an IDA.
45
43 Some BHBF participants who reported earnings to SSA might not have benefitted from the EIE because of the
SSI $20 general income exclusion and the exclusion of the initial $65 of earnings.
In contrast, many participants who had initiated the process of opening IDAs told us in a focus group discussion that they had encountered several different types of problems in opening accounts and making deposits to them. The first was that they had been unable to complete the required training. A second problem reported by several youth who actually had succeeded in opening IDAs was that it was difficult for them to make deposits into the accounts because their earnings were too low or they subsequently lost their jobs. A third problem arose as a consequence of the YWCA’s loss of funding for its IDA program. Several BHBF participants were interested in opening IDAs to accumulate funds for purchasing cars to drive to and from their jobs. Those who had not already opened accounts before the YWCA lost its IDA funding were unable to pursue this goal. The savings goals of buying a home or starting a business that were required for the establishment of IDAs at PSE generally were not attractive to BHBF participants.
44 BHBF participants were responsible for reporting information about their IDAs to SSA. The difference between counts of IDAs based on SSA administrative data and counts based on BHBF data in ETO may be due in part to participants not reporting their accounts to SSA. Also, some participants may have opened accounts but failed to deposit any money in them. The fact that the SSA data pertain to just the year following random assignment, whereas the ETO data cover the full three years of BHBF operations, is also likely to have contributed to the difference in IDA counts between the two data sources.
45 Rico’s story (and Elizabeth’s story on page 54) is presented to illustrate the various services provided by BHBF. To ensure that we supplied enough information to present a comprehensive picture of youth experiences, we selected youth who were active participants in BHBF. These vignettes thus are not representative of a typical BHBF participant’s experiences or outcomes.

Interim Report on Broadened Horizons, Brighter Futures Chapter III: Implementation of BHBF
51
Table III.5. Percentage of BHBF Participants Who Used SSA Work Incentives and Waivers
BHBF Participants
Reported any earnings to SSA 15.9
Used any SSA work incentive (standard or waiver) 29.0
Used Section 301 waiver 17.0
Used EIE (waiver only) 12.5
Used SEIE (standard or waiver) 2.9 Used standard SEIE only 2.6 Used SEIE waiver only 0.3
Used IDA (standard or waiver) 0.5 Used standard IDA only 0.5 Used IDA waiver only 0.0
Used PASS (standard or waiver) 0.0
Sample Size 383
Source: Calculations based on SSA administrative extracts on waiver and work incentive usage.
Note: We excluded five deceased participants from this analysis.
SEIE = student earned income exclusion EIE = earned income exclusion IDA = individual development account PASS = plan for achieving self-support NA = not available from SSA at this time; details on waiver/standard breakdown expected for subsequent draft
BHBF benefits specialists assisted participants in completing the required IDA training, opening accounts, making deposits, and satisfying SSA reporting requirements. Given the high level of effort that the benefits specialists devoted to assisting BHBF participants with IDAs and the few youth who actually opened accounts and met their savings goals, the return on the resources devoted to this component of BHBF appears to have been low.
b. Employment-Related Services
BHBF staff were strongly committed to delivering employment-related services from the outset of the project. Roughly halfway through the project period, however, this commitment intensified and became more focused on competitive paid employment, as discussed above in Section D.6. Table III.4 shows that virtually all youth who participated in the project (99 percent) received at least one employment-related service. Fully 95 percent received career exploration and job search services, which included career planning, resume writing, and mock interviewing. Ninety percent received direct employment services, such as the development of work-based experiences, placement in paid and unpaid jobs, job coaching, and post-placement follow-up. Just a third (34 percent) of participants received employment training, covering such topics as “soft” skills and occupation-specific skills.
BHBF assessed the job readiness of all participants to ensure that they received appropriate employment services. Beginning in June 2010, each participant was assessed and assigned to one of three job-readiness categories: job ready, almost job ready, and mas atención (Spanish for “more attention”). The latter category was for youth who may have had serious barriers to employment and needed intensive services to become job ready. Job-ready youth met with a BHBF employment

Interim Report on Broadened Horizons, Brighter Futures Chapter III: Implementation of BHBF
52
Rico’s Story
When Rico enrolled in BHBF at the beginning of the project, he had been working as a volunteer at a local museum for three years and was about to graduate from high school. With the help of his CEDS, he applied for and obtained a part-time paid position as an interpreter at the museum shortly after he enrolled in BHBF. He began by working eight hours per week and then gradually increased his hours to 25 hours per week. He also began taking college courses through Project Access at Miami-Dade College, which provides support services and specialized equipment for students with disabilities. Rico became interested in veterinary science and completed a veterinarian assistant training program.
Rico participated in many BHBF activities. He attended benefits workshops, employment workshops, job fairs, and prosperity fairs. The project supported him in obtaining needed accommodations, such as tutoring, for postsecondary school. His benefits specialist at BHBF worked with him to apply the SEIE and EIE waivers, which allowed him to keep more of his SSI benefits while he worked. Rico’s CEDS referred him to New Horizons for family counseling and he was approved for mental health services paid through Medicaid.
Rico also successfully established and used an IDA. Within a year of enrollment, he completed the IDA classes from the YWCA to learn about financial responsibility and he began saving through an IDA with the goal of buying a car so he could drive to and from work and increase his independence. After about 18 months of saving, he purchased a 2003 Honda Civic for $5,000.
Although Rico and his family eventually moved away from Florida, he is well positioned to continue his education and find employment in his new location.
specialist, who helped them connect with employers for paid jobs. Almost-job-ready youth were targeted for employment preparation services to help them become job ready. This system facilitated the management of services and reduced the risk that youth would not receive appropriate employment-related services; in particular, it reduced the risk that job-ready youth would be left for long periods of time without assistance to connect with employers.
Despite training and encouragement by TransCen for BHBF staff to work with competitive employers to develop customized jobs for participants with more challenging disabilities, case reviews, quarterly reports, and staff interviews revealed few employment opportunities that were customized to the needs of employers and participants. The customized employment approach entails highly individualized assessments of employers’ needs and youths’ interests and abilities. This approach to job development and placement generally requires extensive training and several years of experience to master (Griffin-Hammis Associates 2012) and was relatively new to most BHBF staff. Rather than placing participants in existing standard jobs, project staff were to negotiate with employers to “carve out” new combinations of work responsibilities for the youth. Notwithstanding the extensive training that BHBF staff received on customized employment, they placed many participants in conventional existing jobs and those traditionally taken by youth with disabilities, such as bagging groceries and working in fast food restaurants. They also placed a number of participants in jobs with organizations that primarily hired people with disabilities and marketed their products to the public as having been made by people with disabilities. While some of these latter youth used these jobs as stepping-stones to competitive jobs in integrated settings, others did not. Some BHBF staff did not seem to recognize the sheltered and segregated nature of this employment.
Interim Report on Broadened Horizons, Brighter Futures Chapter III: Implementation of BHBF
53
The national recession of 2007–2009 and the subsequent sluggish expansion in economic activity affected BHBF project operations and employment outcomes for participating youth. Project staff reported that it was very challenging to identify employment opportunities for BHBF participants in 2009 and the first half of 2010, when hiring freezes were in effect for several large local employers that previously had been reliable sources of jobs. Job development and job placement appeared to become somewhat easier in the last half of 2010 and 2011.
c. Education-Related Services
Education services did not constitute a key component of the BHBF program model, and although project staff did provide more intensive education services to a small group of participants, some youth might not have received the education services they desired. In the BHBF design (Figure III.1), education is not identified as a critical component of the project, being shown as an element of case management. In interviews, however, BHBF staff told us that they believed that education was important in order for youth to obtain better jobs, and they encouraged participants to pursue additional education and training experiences. Most project participants (84 percent) received some type of education-related service (Table III.4), the most common of which was education counseling and academic advisement. This very general form of education support was received by 69 percent of the participants. A smaller proportion, 30 percent, received assistance in accessing accommodations or student support services, and even fewer youth received registration or enrollment assistance, services to prepare for or attend IEP or transition meetings, academic retention services, and assistance in accessing financial aid. The fact that few participants received these more intensive and targeted education-related services confirms BHBF’s lack of emphasis on education services.
When we spoke with project staff about their provision of education services, they told us that they had provided participants with help to accomplish a number of types of education objectives. These included assistance to: remain in school, identify opportunities for vocational education, obtain financing for postsecondary education through DVR, complete applications for financial aid, and access services for college students with disabilities. Rico’s story, presented earlier, illustrates some of the education services that staff provided. The lack of overall focus on education by the project, however, might have resulted in some participants not receiving needed services. During our focus group discussions with BHBF participants, several mentioned that they were in need of additional education counseling to reach their employment goals.
d. Case Management Services
Ninety-six percent of BHBF participants received case management services (Table III.4). The most common of these services by far was general check-in services, a generic category of staff contacts with participants or their families to determine how they were doing and whether they were in need of assistance or supports. Eighty percent of participants received general check-in services. Other case management services received by at least a quarter of participants were vocational rehabilitation services, case reviews, family support services, and transportation assistance. BHBF often provided case management services through referrals to other agencies such as DVR or local transportation programs. (Elizabeth’s story exemplifies the importance of arranging support services to enable youth to work to their full capacity.)

Interim Report on Broadened Horizons, Brighter Futures Chapter III: Implementation of BHBF
54
Elizabeth’s Story
Elizabeth enrolled in BHBF when she was 22 years old. She and her one-year old son were living with her grandmother and uncle. Elizabeth had qualified for and received SSI benefits on the basis of a diagnosis of an early onset developmental and emotional disorder; however, she was no longer receiving benefits at the time of her enrollment in BHBF. SSA had determined that she was capable of working and also that she had received overpayments of benefits amounting to several thousand dollars. She was in the process of appealing both of these decisions at the time of her enrollment in the project. Like other former beneficiaries in the YTD evaluation, Elizabeth was considered to be at risk of returning to the beneficiary rolls in the future. She had a high school degree but no work experience. Her employment goal was to work in a grocery store.
BHBF staff moved quickly to help Elizabeth with her legal and employment needs. They referred her to a legal services agency, which assisted her with her SSA appeals. (Ultimately, her benefits were not reinstated, but her overpayments were cleared.) Meanwhile, her CEDS and a One-Stop Career Center counselor helped her to identify promising job openings. Elizabeth received two job offers, but she could not accept either because she lacked transportation and child care. (At the time, child care assistance was available only for working parents and not for parents who were seeking employment. Elizabeth could not sign up for child care assistance without having proof of earnings first.)
BHBF provided intensive assistance to help Elizabeth find employment—supports that continued after she obtained a job. A BHBF employment specialist helped Elizabeth apply for a position through the South Florida Workforce Summer Youth Program, through which she obtained an eight-week paid internship providing clerical support at the South Florida Workforce office. The program provided child care while she worked in this position, and BHBF provided her with bus passes to reduce her transportation costs. After this experience, Elizabeth and the employment specialist with whom she was working sought opportunities for her at grocery stores. She eventually obtained a full-time paid position with benefits at Wal-Mart. Her supervisor there was willing to take a chance on hiring Elizabeth because of the strong recommendation from her internship. Elizabeth was able to continue using child care because she could show that she was working. After two months in a position involving merchandise replenishment and pricing, she transferred to a new position on the night shift at the Wal-Mart café. Although Elizabeth could not use the YTD waivers because she was no longer a disability beneficiary, the BHBF employment specialist continued to support her to promote her retention of that job, checking in with her about her work and her career goals, and continuing to provide bus passes.
BHBF staff identified two substantial issues that made it difficult for some project participants
to engage in BHBF activities or pursue employment and that were difficult for them to address through case management activities. The first was inadequate access to transportation. Each BHBF office received five monthly bus passes for distribution to youth who could not afford public transportation, but the staff regarded this number as inadequate. Furthermore, many employers were located in areas not served by public transportation. The second issue was the lack of child care for participants who were parents (about ten percent of the BHBF caseload, according to staff estimates). Project staff were able to locate child care resources for participants who were employed but had low incomes; however, those resources were not available to participants preparing for or seeking work. Staff reported difficulty in motivating some young parents to pursue employment because they wanted to spend time with their children and were often reluctant to sacrifice stable benefits for more uncertain earned income. On the other hand, some of the participants who were parents were motivated to work because they wanted to make better lives for their children.

Interim Report on Broadened Horizons, Brighter Futures Chapter III: Implementation of BHBF
55
The focus of case management in BHBF evolved over the course of the project. Early on, the staff used case management to address the many unmet needs of the participants and often their families. In part, this reflected the desire of the staff to gain the trust of the youth and their families. By the second year of the project, however, it had become evident that the existing approach to case management was delaying or crowding out the delivery of employment services. With technical assistance from TransCen, both the CEDS and the benefits specialists changed their approach to case management, using it to provide services to support employment; that is, case management services became secondary to the primary emphasis on employment services.
3. The Timing of Services
BHBF staff initiated services with youth very soon after they enrolled in the project. Table III.6 shows that the median elapsed time between enrollment and the first service contact was just 4 days, and 98.5 percent of initial service contacts occurred within 30 days of enrollment. Staff also provided follow-up services very quickly; the median number of days between enrollment and the second service contact was 9, and 90 percent of second contacts occurred within 30 days of enrollment.
Initial service contacts frequently entailed the provision of benefits planning and case management services but were much less likely to entail the delivery of employment services. This pattern reflects the project model, with staff meeting with youth early on to conduct initial assessment activities and provide benefits information. During the first service contact, 59 percent of participants received benefits planning services, including information about work incentives and the SSA waivers for YTD (Table III.6). This reflects recognition on the part of the BHBF staff that many participants and their families were fearful of losing their disability benefits and thus needed this information before they could seriously consider employment. Additionally, many of the families had significant needs in such areas as housing and medical care that staff could address through case management services, which were a component of the initial service contact for 37 percent of participants. Only 26 percent received employment services during their initial BHBF service contact, likely because the project staff were focused on establishing rapport with the participants and their families, and providing necessary precursor services before commencing employment services.
The types of services that BHBF participants received changed over the course of their participation in the project, shifting sharply toward employment services. The bottom section of Table III.6 shows the services that participants received during their most recent contact with BHBF in the 15-month observation window for our analysis of ETO data. Almost half of the youth received employment services, followed closely by benefits planning services. Much smaller fractions of participants received case management and education services. We believe that this primarily reflects the natural progression of youth through BHBF, as the project was designed to provide employment services only after certain preparatory services had been delivered (Figure III.1). To a lesser extent, it also may reflect the adjustment in service priorities that occurred during the project’s second year, when increased technical assistance with the delivery of employment services apparently prompted project management and staff to focus more intensely on achieving positive employment outcomes for project participants.

Interim Report on Broadened Horizons, Brighter Futures Chapter III: Implementation of BHBF
56
Table III.6. Timing of BHBF Services (percentages, unless otherwise noted)
BHBF Participants
Ever Received Service 100.0
Timing of Service Receipt Time between enrollment and first service contact
Average number of days 6.1 Median number of days 4.0
First service contact occurred within: 30 days of enrollment 98.5 180 days of enrollment 100.0
Time between enrollment and second service contact Average number of days 14.4 Median number of days 9.0
Second service contact occurred within: 30 days of enrollment 89.9 180 days of enrollment 100.0
Types of services received during the first service contacta Benefits planning 58.5 Employment 25.5 Education 19.1 Case management 37.4
Types of services received during the most recent service contacta Benefits planning 38.1 Employment 47.9 Education 4.1 Case management 22.7
Sample Size 388
Source: The BHBF ETO management information system.
Notes: We excluded contacts of less than two minutes and those made on the day of enrollment from this analysis. We calculated the percentage of youth who ever received any service based on all 388 BHBF participants. We calculated the statistics on the timing of service contacts based on those participants who received a first or second contact.
aThe types of services received are not mutually exclusive, so the percentages add to more than 100.
4. The Intensity of Services
We have seen that BHBF staff moved quickly to deliver services to every enrolled youth, but it was also the case that the intensity of those services generally was high, whether measured by the number of service contacts or by their cumulative duration. On average, project staff made 49 service contacts of any type for each participant, lasting a total of 29 hours (Table III.7).46
46 In Table III.7, the median values for the number of service contacts per participant and the cumulative duration
of those contacts are 41 contacts and 21 hours, respectively. These median values do not differ dramatically from the corresponding mean values, indicating that the distribution of service intensity is not highly skewed.
Some of those contacts were with employers, parents, and other individuals or organizations on behalf of the youth. The average cumulative duration of service contacts that directly involved the youth was 18 hours (results not shown). While the median length of a single service contact was 15 minutes, the average length was 27 minutes, indicating that some contacts may have been of a very long duration, though most were shorter. Only 18 percent of service contacts lasted longer than 30 minutes.
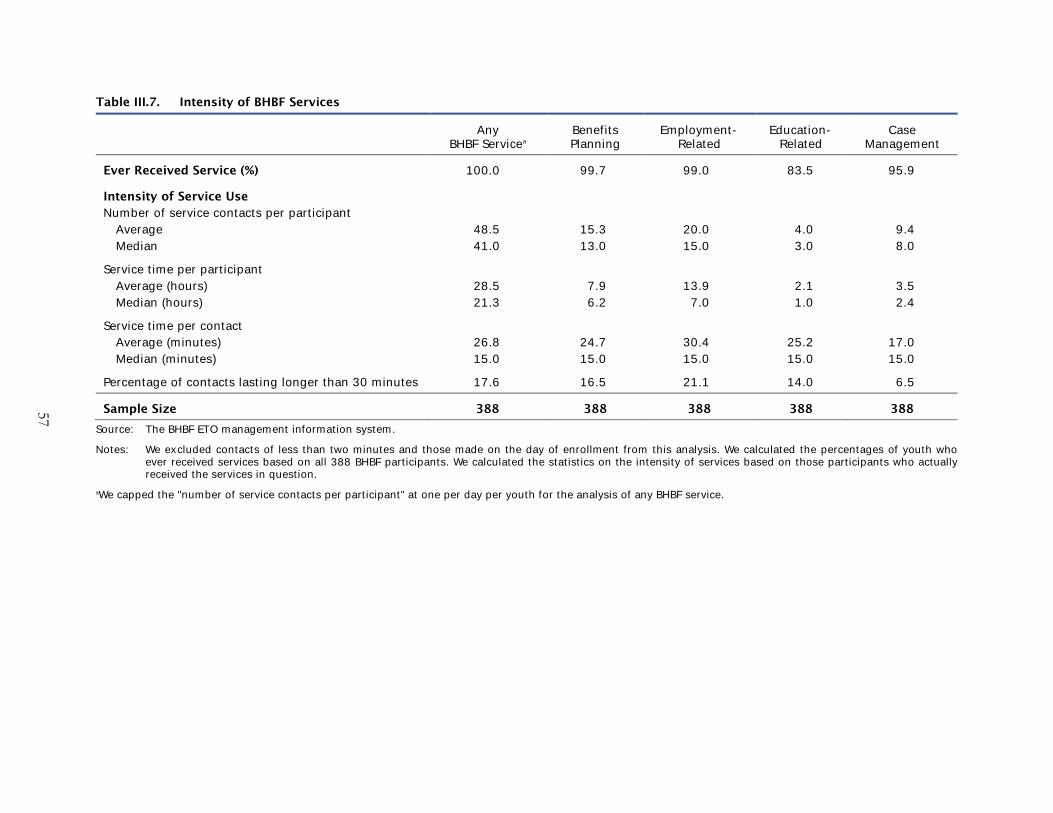
57
Table III.7. Intensity of BHBF Services
Any
BHBF Servicea Benefits Planning
Employment-Related
Education-Related
Case Management
Ever Received Service (%) 100.0 99.7 99.0 83.5 95.9
Intensity of Service Use Number of service contacts per participant
Average 48.5 15.3 20.0 4.0 9.4 Median 41.0 13.0 15.0 3.0 8.0
Service time per participant Average (hours) 28.5 7.9 13.9 2.1 3.5 Median (hours) 21.3 6.2 7.0 1.0 2.4
Service time per contact Average (minutes) 26.8 24.7 30.4 25.2 17.0 Median (minutes) 15.0 15.0 15.0 15.0 15.0
Percentage of contacts lasting longer than 30 minutes 17.6 16.5 21.1 14.0 6.5
Sample Size 388 388 388 388 388
Source: The BHBF ETO management information system.
Notes: We excluded contacts of less than two minutes and those made on the day of enrollment from this analysis. We calculated the percentages of youth who ever received services based on all 388 BHBF participants. We calculated the statistics on the intensity of services based on those participants who actually received the services in question.
aWe capped the "number of service contacts per participant" at one per day per youth for the analysis of any BHBF service.

Interim Report on Broadened Horizons, Brighter Futures Chapter III: Implementation of BHBF
58
Consistent with the BHBF program model, the number and cumulative duration of service contacts per participant were greater for employment-related services than for any other category of services. On average, BHBF staff made 20 contacts per participant to deliver employment services, with a cumulative duration of 14 hours. We note that the median duration of employment service contacts is about half of the mean value, indicating that a small number of participants accounted for a disproportionate share of total employment service hours. Benefits planning services also were relatively intense in BHBF. On average, project staff made 15 contacts per participant to deliver benefits planning services, with a cumulative duration of 8 hours. A comparison of median and mean values indicates that the distribution of the duration of benefits planning services is not highly skewed by extremely intense services provided to a small proportion of youth.
The receipt of case management services and education-related services was somewhat less than universal among BHBF participants but, more notably, the intensity of those services was relatively low for the youth who did receive them. Among the 96 percent of participants who received case management services, the average number of service contacts was 9 and the average cumulative duration of those contacts was 4 hours. The corresponding statistics for the 84 percent of participants who received education-related services are 4 service contacts for a cumulative duration of 2 hours.
G. Changes in Service Receipt over Time
We have noted elsewhere that the emphasis on employment services and paid employment outcomes in BHBF intensified starting in May 2009 (see Section D.6), when TransCen sharpened the focus of its technical assistance to BHBF on paid competitive employment. Several months later, BHBF management established aggressive goals for staff contacts with prospective employers and the placement of participants in paid competitive jobs. Later, in the spring of 2010, the evaluation team developed a standardized report based on ETO data showing staff employment and non-employment service hours and counts of participants in competitive paid jobs. The evaluation team updated this report each month and provided it to BHBF management. Given this adjustment in the project’s focus during what roughly corresponded to its second year of operation, one might expect those youth who were earlier enrollees in BHBF and received any service to have received a different mix of services than later enrollees. In this section, we investigate whether this was actually the case.
Our analysis of changes in service receipt over time is based on two cohorts of BHBF participants—defined by whether they had been randomly assigned to the treatment group earlier (before July 1, 2009) or later (on or after July 1, 2009). We selected the cohorts on the basis of this date for three reasons. First, after 15 months of project operations, the project was well established, and most of the staff had accumulated significant experience. Second, by design, the project had four periods of recruitment and enrollment; it had completed the second period by this time but had not yet begun the third. Third, as stated above, with assistance from TransCen and the evaluation team, BHBF management sharpened the project’s focus on competitive paid employment around this time.
Relative to earlier enrollees in BHBF, later enrollees received more hours of project services overall, with a large positive differential in employment-related services and small negative differentials in education-related and case management services. In Table III.8, we show the percentages of youth in each cohort who received any BHBF service and the specific types of
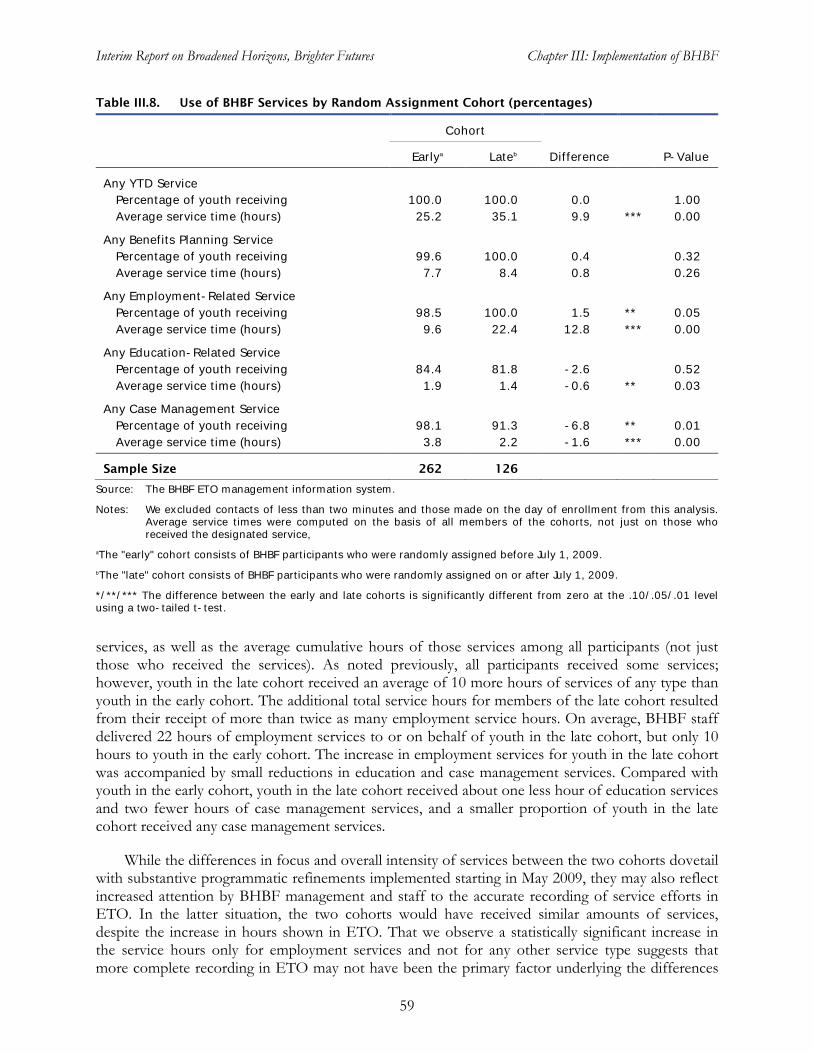
Interim Report on Broadened Horizons, Brighter Futures Chapter III: Implementation of BHBF
59
Table III.8. Use of BHBF Services by Random Assignment Cohort (percentages)
Cohort
Earlya Lateb Difference P-Value
Any YTD Service Percentage of youth receiving 100.0 100.0 0.0 1.00 Average service time (hours) 25.2 35.1 9.9 *** 0.00
Any Benefits Planning Service Percentage of youth receiving 99.6 100.0 0.4 0.32 Average service time (hours) 7.7 8.4 0.8 0.26
Any Employment-Related Service Percentage of youth receiving 98.5 100.0 1.5 ** 0.05 Average service time (hours) 9.6 22.4 12.8 *** 0.00
Any Education-Related Service Percentage of youth receiving 84.4 81.8 -2.6 0.52 Average service time (hours) 1.9 1.4 -0.6 ** 0.03
Any Case Management Service Percentage of youth receiving 98.1 91.3 -6.8 ** 0.01 Average service time (hours) 3.8 2.2 -1.6 *** 0.00
Sample Size 262 126
Source: The BHBF ETO management information system.
Notes: We excluded contacts of less than two minutes and those made on the day of enrollment from this analysis. Average service times were computed on the basis of all members of the cohorts, not just on those who received the designated service,
aThe "early" cohort consists of BHBF participants who were randomly assigned before July 1, 2009. bThe "late" cohort consists of BHBF participants who were randomly assigned on or after July 1, 2009.
*/**/*** The difference between the early and late cohorts is significantly different from zero at the .10/.05/.01 level using a two-tailed t-test.
services, as well as the average cumulative hours of those services among all participants (not just those who received the services). As noted previously, all participants received some services; however, youth in the late cohort received an average of 10 more hours of services of any type than youth in the early cohort. The additional total service hours for members of the late cohort resulted from their receipt of more than twice as many employment service hours. On average, BHBF staff delivered 22 hours of employment services to or on behalf of youth in the late cohort, but only 10 hours to youth in the early cohort. The increase in employment services for youth in the late cohort was accompanied by small reductions in education and case management services. Compared with youth in the early cohort, youth in the late cohort received about one less hour of education services and two fewer hours of case management services, and a smaller proportion of youth in the late cohort received any case management services.
While the differences in focus and overall intensity of services between the two cohorts dovetail with substantive programmatic refinements implemented starting in May 2009, they may also reflect increased attention by BHBF management and staff to the accurate recording of service efforts in ETO. In the latter situation, the two cohorts would have received similar amounts of services, despite the increase in hours shown in ETO. That we observe a statistically significant increase in the service hours only for employment services and not for any other service type suggests that more complete recording in ETO may not have been the primary factor underlying the differences

Interim Report on Broadened Horizons, Brighter Futures Chapter III: Implementation of BHBF
60
between the cohorts. In particular, we might have expected benefits planning (rather than education and case management) service hours to have been greater for the late cohort than the early cohort in this situation because of its relative importance in the project, although this is not what we observe. Nonetheless, factors other than actual service delivery might have been responsible for the large increase in recorded employment service hours between the two cohorts.
H. Youth Satisfaction with Services
The evaluation’s 12-month follow-up survey asked BHBF participants about their satisfaction with project services, but half of the respondents did not recall having received such services. That such a large proportion of participants did not recall having received project services runs counter to the finding from ETO data that 100 percent of participants received some type of service from the project. There are two possible explanations for this finding. First, confusion regarding the project’s name may have resulted in a lack of recall. In conducting the survey, we referred to the project either by its full name, “Broadened Horizons, Brighter Futures,” or the acronym, “BHBF,” whereas many participants referred to it as “Abilities,” which was the original name (subsequently changed to ServiceSource) of the organization that operated the project. Those youth might not have recognized “Broadened Horizons, Brighter Futures” and “BHBF” as alternative ways to refer to the project that they knew as “Abilities.” Second, weak attachment to the project by some participants may have led them to not recall having received project services. Supplemental analyses of linked survey and ETO data revealed that participants for whom fewer service contacts were recorded in ETO were less likely to recall having received services from BHBF than those with more recorded service contacts.47
Between one-quarter and one-third of BHBF participants felt that each of six specific experiences or services that they may have had or received through the project had been somewhat or very helpful, and these proportions are larger when we examine just those who recall receiving services from BHBF. As shown in the upper panel of Table III.9, the values range from 33 percent feeling that the project had been somewhat or very helpful in providing them with information about career opportunities to 25 percent feeling that the project had helped them work effectively with others. For this analysis, the youth who did not recall having received services from BHBF were classified with those who did recall the services but did not consider them to have been somewhat or very helpful, on the assumption that those who did not remember the services were unlikely to have viewed them as having been useful. This assumption may be too extreme, given the issue with name recall previously mentioned. When we exclude from the analysis the 160 participants who did not recall having received BHBF services, the proportions who rated these experiences highly range from 68 percent to 53 percent. Even these adjusted statistics are lower than what might be expected, however, given the findings on staff involvement and service intensity presented earlier in this chapter.
Nearly two in five BHBF participants rated their overall experience with the project as either good or very good, whereas only 2 percent rated their experience as poor (Table III.9, bottom panel). A slightly higher proportion of participants, 44 percent, reported that the services they had received had been somewhat or very useful. Again, only a small proportion (3 percent) had an unambiguously negative opinion of the project, telling us that the services had been not at all useful. These statistics include participants who did not recall having received BHBF services. When we
47 Additional analysis, not shown, indicates that for 95 percent of the participants who did not recall having received services from BHBF, at least 14 service contacts were recorded in ETO.

Interim Report on Broadened Horizons, Brighter Futures Chapter III: Implementation of BHBF
61
Table III.9. Satisfaction with BHBF Services Among Participants (percentages)
BHBF Participants
BHBF was “Somewhat Helpful” or “Very Helpful” in Assisting Participant with: Gaining information about career opportunities 32.6 Developing a sense of confidence in abilities 29.2 Developing clearer career goals 28.3 Understanding self 26.3 Acquiring a job or work-related knowledge and skills 25.8 Working effectively with others 25.4
Sample Size 304
Participant’s Overall Experience with BHBF Very good 18.6 Good 19.4 Fair 9.9 Poor 1.6 Don't know 0.8 Did not recall receiving services 49.8
Usefulness of BHBF Services Very useful 25.3 Somewhat useful 18.2 Not very useful 2.8 Not at all useful 2.8 Don't know 1.2 Did not recall receiving services 49.8
Sample Size 253
Source: YTD 12-month follow-up survey.
Notes: This analysis is based on 304 treatment group youth who enrolled in BHBF and completed the 12-month interview. In this group, 160 youth did not mention having received BHBF services. The analysis of the helpfulness of BHBF (top panel) assumes that those who did not recall receiving services did not find those services to have been somewhat or very helpful. Data are missing for between three and five cases, depending on the measure of helpfulness. We excluded cases with missing data from the calculations. The sample size for the analyses of participants' overall experience with BHBF and the usefulness of BHBF services (bottom panel) is smaller because questions on these topics were not asked of 49 proxy respondents and because data are missing for two cases. We excluded cases with missing data from the calculations.
consider only participants who recalled receiving services, 76 percent reported good or very good experiences with the project, and 86 percent reported that the services were somewhat or very useful.
The survey-based findings for youth who recalled receiving services from BHBF are corroborated by findings from our May 2011 focus group discussions with participants, during which a number of them reported having worked with BHBF staff to gain financial literacy, prepare for employment, and find jobs. Most of these youth spoke positively of the staff and services, although a few did tell us that the services were not useful and the staff were unresponsive to their needs. Several also told us that they could not recall having received very many services from BHBF.
I. Summary and Implementation Lessons and Challenges
BHBF was designed to promote the economic self-sufficiency of youth with disabilities by providing them with employment services, benefits counseling, and case management, as well as the

Interim Report on Broadened Horizons, Brighter Futures Chapter III: Implementation of BHBF
62
opportunity to receive financial literacy training and open IDAs. Project staff helped participants find competitive paid employment based on their individual interests and abilities, and provided benefits counseling to assist them in using the standard SSA work incentives and the enhanced incentives under SSA’s waivers for YTD. On average, BHBF staff made 47 service contacts with each participating youth, for a total of 29 hours of service. Virtually all participants received employment-related services, which averaged over 13 hours per youth. Those services were geared toward providing participants with work experiences in competitive paid jobs; however, many participants had other types of work-based experiences, such as job shadowing, internships, and paid summer youth employment.
BHBF was a well-managed project that, with significant technical assistance, maintained fidelity to its program model and the broader YTD conceptual framework. The project manager marshaled her staff to provide services with a strong employment focus. She led her staff in establishing goals for employer contacts and job placements, and disciplined staff that did not adequately contribute to the attainment of those goals. Staff members demonstrated a high degree of commitment to the youth enrolled in the project and most of them remained with the project throughout its period of performance.
We conclude this chapter by discussing four key implementation lessons and challenges for BHBF that we identified through the process analysis.
1. Employment-focused interventions for youth with disabilities should emphasize job development and job placement from their inception. Data collection and monitoring should focus on contacts with employers and direct job placements. During BHBF’s first year of operation, project staff focused their efforts on case management and pre-employment services. While these activities were not without merit, they may have crowded out the delivery of services more specifically designed to help participants have paid competitive employment experiences. Early in the project’s second year, the focus of services shifted to job development through outreach to employers and the placement of youth in paid competitive jobs. BHBF management and staff set and met monthly goals at both the project and individual staff levels for employer contacts and job placements. They used the ETO management information system to record and monitor efforts and outcomes relative to these goals. They also used ETO to monitor the progress of individual participants through three stages of job readiness, thus facilitating the delivery of appropriate services at each stage. By the time the project ended, more than 50 percent of the participants had held paid competitive jobs at some point during their involvement in the project, as recorded by staff in ETO. This percentage might have been even higher if the emphasis on job development and job placement had been this strong from the beginning.
2. Employment-focused interventions should be staffed with individuals who are comfortable interacting with employers. While all of the BHBF employment specialists and some of the CEDS were in frequent contact with employers, other CEDS had difficulty (even after receiving technical assistance) in making the transition from interacting with participants and other service providers in a case management role to interacting with employers. The project manager eventually began to recruit staff with experience interacting with employers for open CEDS and employment specialist positions. Although this made recruiting more difficult, it ensured that the new staff members would be highly capable of promoting the project’s most critical goals.
Interim Report on Broadened Horizons, Brighter Futures Chapter III: Implementation of BHBF
63
3. Project staff should work with employers to develop customized jobs for participants who have especially challenging barriers to employment. Despite technical assistance in implementing a customized employment (“job carving”) approach to job development and job placement, BHBF staff rarely used the approach, preferring to help youth obtain employment in response to existing openings for standard jobs. If the project staff had made greater use of customized employment, additional hard-to-serve youth might have been placed in jobs, and some youth who were placed might have retained their jobs longer.
4. IDAs are challenging to implement for youth. While many BHBF participants were interested in IDAs and a few used them successfully to purchase cars, pay for additional education, or start businesses, this required a great deal of staff effort with relatively little payoff. Few project participants succeeded in opening accounts, and those who did often had difficulty maintaining sufficient earnings to set aside funds for deposits. Less than one percent of participants opened IDAs during the first 12 months after random assignment (according to SSA administrative data), although 38 youth did so eventually and 10 achieved their IDA savings goals (according to BHBF administrative data). IDAs may be a poor fit for interventions designed to serve youth, many of whom cannot sustain employment long enough to reach their savings objectives.

65
IV. IMPACTS ON USE OF EMPLOYMENT SERVICES AND OTHER SERVICES
The YTD initiative was designed to help youth with disabilities maximize their economic self-sufficiency as they transition from school to work. Given that paid employment is critical to the achievement of economic self-sufficiency, employment-promoting services were a core component of the initiative, as described in the conceptual framework (Figure I.1), and participation in those services constitutes one of the five outcome domains for the impact analysis. Employment-promoting services were intended to increase work-related experiences in the short term, and short-term participation in employment—an outcome examined in the next chapter—was regarded as pivotal to improving the potential for long-term employment.
The goal of BHBF was to place treatment group youth participating in project services in competitive employment based on their individual interests. Under the BHBF service model, the community employment development specialists provided employment services in individual, small group, and workshop formats. As described in Chapter III, BHBF fully embraced work-related experiences and short-term employment as the central focus of its services: 90 percent of participants received direct employment services, which included job coaching, job placement, post-placement follow-up services, and paid and unpaid work experiences (Table III.4).
In this chapter, we begin with a discussion of the findings pertaining to the primary outcome measure in the domain of employment-promoting services—the use of any such service. Based on our analysis of this measure, we answer the following question: During the year following random assignment, did BHBF lead to treatment group youths’ use of more employment-promoting services than if the project had not been available? In Chapter III, we used data from the project’s management information system to show that nearly all treatment group youth participating in the project received employment-promoting services from project staff. However, in this chapter, to answer the above question, we use information from survey data collected from both treatment and control group youth about 12 months after random assignment.48
We found that BHBF increased the proportion of youth who reported using any employment-promoting service and several specific types of such services, including support for job search activities, benefits counseling, and such direct work experiences as apprenticeships. The project also increased the proportion of youth who used non-employment services, particularly those related to person-centered planning. BHBF had a modest impact on the number of months of overall service use. Despite the project’s emphasis on benefits counseling, we found that it did not increase understanding of the relationship between benefits and employment. It did, however, increase knowledge of specific SSA work incentives. All of these service-utilization measures cover the period between random assignment and the evaluation’s 12-month follow-up survey.
It is important to note that this analysis captures the use of services delivered by BHBF and other providers. Because the project provided referrals to local service providers, it could have increased the use of services beyond those provided directly by BHBF. On the other hand, BHBF services could have displaced some services that other organizations otherwise would have provided.
48 For youth under age 18 at the time of the 12-month survey, we gathered information on service utilization from
a parent or guardian. For ease of reference, we refer to the responses as “youth reports.”

Interim Report on Broadened Horizons, Brighter Futures Chapter IV: Impacts on Employment Services
66
A. BHBF Increased the Use of Employment Services
Consistent with the intent of the YTD program model, BHBF increased the use of any employment-promoting service by youth with disabilities. Fifty-eight percent of treatment group youth reported using any employment-promoting service in the year following random assignment (Table IV.1). We estimated that, in the absence of BHBF, only 46 percent of these youth would have used any such service. The project had a positive impact of 13 percentage points on the primary outcome measure in the domain of employment-promoting services (reflecting a relative impact of 27 percent). The impact is statistically significant at the one percent level.49
The YTD 12-month follow-up survey asked about the use of specific employment-promoting services, including career counseling, support for resume writing and job search activities, job shadowing and apprenticeships/internships, and other employment-focused services (such as basic skills training, computer classes, problem solving, and social skills training). Given that SSA benefits-related work incentives are integral to the YTD initiative, counseling on SSA benefits is also considered an employment-promoting service. The BHBF service model emphasized the provision of employment-promoting services, including direct employment services and benefits counseling. Consistent with this model, we found that the project increased the use of support for career counseling (by 9 percentage points, a relative increase of 40 percent); resume writing and job search (by 19 percentage points, a relative increase of 99 percent); job shadowing and apprenticeships/ internships (by 5 percentage points, a relative increase of 75 percent); and benefits counseling (by 11 percentage points, a relative increase of 55 percent).
50
While important, the receipt of benefits counseling was not the primary factor underlying the increase in overall use of employment services. To assess whether the impact on the use of any employment-promoting service was attributable mainly to the increase in benefits counseling, we conducted an impact analysis that excluded benefits counseling from the definition of “any employment-promoting service.” With this change, the share of treatment group youth receiving employment-promoting services fell to 51 percent (from 58 percent), and the estimated impact increased, to 16 percentage points (from 13 percentage points) and remained statistically significant at the one percent level (results not shown in table).
49 As noted in Chapter II, Section A.4, the estimated impacts presented in this and subsequent chapters are
regression adjusted. To provide context, in Table IV.1 and subsequent tables, we report observed mean values for the treatment group, estimates of what the treatment group means would have been in the absence of BHBF, and regression-adjusted impact estimates. A regression-adjusted impact estimate is the difference between the treatment and control group means after adjusting for differences in baseline characteristics. The “estimated mean without BHBF” is calculated as the observed treatment group mean less the regression-adjusted impact estimate. We report unadjusted mean impacts in Table A.5 for all outcomes.
50 In Chapter III, Section F, we reported that our analysis of ETO data revealed that BHBF delivered benefits planning services to almost every treatment group youth who participated in the project. The participation rate was 84 percent, so it follows that the project delivered benefits planning services to 84 percent of all treatment group members. The difference between this rate, computed from ETO data, and the 31 percent rate of use of benefits planning services computed for treatment group members from the 12-month survey data (Table IV.1) may be explained by the following: (1) per instructions given by the YTD evaluation team, project staff recorded in ETO even very brief discussions with youth about SSA benefits at the time they occurred, and (2) the survey respondents were asked to recall benefits planning services they may have used over the entire preceding 12 months. The youth may have forgotten about these, especially if those services consisted of a single brief discussion.

Interim Report on Broadened Horizons, Brighter Futures Chapter IV: Impacts on Employment Services
67
Table IV.1. Use of Employment- Promoting Services and Non- Employment Services (percentages)
Treatment Group
Observed
Mean
Estimated Mean w/o
BHBF Impact P-Value
Primary Outcome
Any Employment-Promoting Service 58.2 45.7 12.5 *** 0.00
Supplementary Outcomes
Employment-Promoting Services Career counseling 32.1 23.0 9.1 *** 0.01 Support for resume writing and job search
activities 37.9 19.0 18.9 *** 0.00 Job shadowing, apprenticeship/internship 12.4 7.1 5.3 ** 0.03 Other employment-focused services (basic
skills training, computer classes, problem solving, and social skills training) 2.6 1.1 1.5 0.15
Counseling on SSA benefits and work incentives 30.7 19.8 10.9 *** 0.00
Non-Employment Services Any non-employment service 73.9 62.2 11.7 *** 0.00 Discussions about youth’s general interests,
life, and future plans 66.8 53.8 12.9 *** 0.00 Life skills training 27.2 25.3 2.0 0.53 Help getting into an education or training
program 19.1 16.0 3.2 0.29 Help with accommodations 21.4 17.4 4.0 0.17 Referrals to another agency 2.1 1.1 1.1 0.26 Transportation services 3.2 1.8 1.5 0.24 Health services 5.4 4.4 1.0 0.51 Case management (not otherwise specified) 1.2 0.1 1.2 0.18 Other non-employment services 7.4 3.4 4.0 ** 0.03
Overall Service Use Any employment or non-employment service 80.5 70.6 9.9 *** 0.00
Source: YTD 12-month follow-up survey.
Notes: The sample includes all youth who completed the study’s 12-month follow-up survey. In the table, we report observed means or percentages for the treatment group, estimates of what the treatment group means or percentages would have been in the absence of BHBF, and regression-adjusted impact estimates (see Chapter II, Section A.4). We measured explanatory variables in the regression model before random assignment by using data from the study’s baseline survey and SSA administrative records. We calculated all statistics with sample weights to account for interview non-response. The analysis sample includes 404 treatment group youth and 334 control group youth. Survey item non-response may have resulted in smaller sample sizes for specific outcomes. See Appendix A, Table A.5, for sample sizes for all outcomes.
*/**/***Impact estimate is significantly different from zero at the .10/.05/.01 level using a two-tailed t-test.
We also examined whether BHBF led to more youth using non-employment services. Typically, general case management services tend to be more readily available than employment-promoting services, such that control group youth also would have had access to these services. In fact, we found higher levels of use of non-employment services relative to employment-promoting services among members of both the treatment and control groups. Our estimates show that, even in the absence of BHBF, nearly two-thirds of treatment group youth would have received non-employment services and the project increased the use of these services by 12 percentage points (a relative increase of 19 percent). Furthermore, consistent with the BHBF service model and its use of person-centered planning, we found a relatively large impact on the percentage of youth who

Interim Report on Broadened Horizons, Brighter Futures Chapter IV: Impacts on Employment Services
68
reported that someone had talked with them about their general interests, life, and future plans. Sixty-seven percent of the treatment group youth reported having had such discussions, compared with only 54 percent who would have had them in the absence of the intervention, leading to an impact of 13 percentage points (reflecting a relative increase of 24 percent). We did not find statistically significant impacts on the use of other specific types of non-employment services. However, we did find that BHBF increased the use of an aggregate category of “other” non-employment services (such as help with school work, legal services, and housing support) by 4 percentage points.
Finally, we found that BHBF increased the share of youth using any service. Looking at overall service use (employment-promoting or non-employment), we found that 81 percent of treatment group members used any service at all. In the absence of BHBF, 71 percent of them would have used services. The 10 percentage point difference is statistically significant and represents a relative increase of 14 percent. Thus, the project led to an increase in the combined use of employment and non-employment services.
In sum, we found that BHBF resulted in greater use of both employment-promoting and non-employment services. In the next chapter, we examine whether the increased services under BHBF, combined with other aspects of the intervention, were sufficient to produce an impact on employment. However, an impact on employment also may depend on the amount of services used. In the next section, we address the impact of BHBF on the amount of services used.
B. BHBF Led to Increases in the Amount of All Services Used
In addition to examining the proportion of youth who used services, we examined the amount of all (employment and non-employment) services used.51
Our measures of the amount of all services used are subject to considerable error because they are based on youth recall over a one-year period. However, there is no reason to believe that the measurement error differs between treatment and control group members. This means that, while the measurement error may reduce the precision of our impact estimates, it should not cause them to be biased. The 12-month survey asked each youth about the starting and ending dates for services from each provider the youth had reported using. Our principal measure of the amount of services is the number of months during which a youth reported using services from any provider. We estimated that treatment group members used services for seven months, which is about one month more than the duration of services they would have used in the absence of the intervention (Table IV.2). This represents a relative impact of 19 percent (statistically significant at the one percent level). Further analysis suggests that this impact was driven largely by the fact that more treatment group youth used any service, and not by additional months of services among those who used any service. Among youth who used any service, the average number of months of services was about nine months for both the treatment and control groups (not shown in the table). Notwithstanding the positive impact on the number of months of services, we estimated that the project had no impact on the number of contacts that youth had with service providers. This finding
Although control group youth were less likely than treatment group youth to have received any services, if control group youth who did receive services tended to utilize a large amount of them, then the control group may have received a similar amount, or even more services on average, than the treatment group.
51 Our data from the 12-month survey did not allow us to analyze the amount of employment services separately
from the amount of all services.

Interim Report on Broadened Horizons, Brighter Futures Chapter IV: Impacts on Employment Services
69
Table IV.2. Amount of Services Used and Unmet Service Needs
Treatment Group
Observed
Mean
Estimated Mean w/o
BHBF Impact P-Value
Supplementary Outcomes
Amount of Services Useda Average number of months of service useb 7.0 5.9 1.1 *** 0.00 Average number of contacts with providersb 82.4 79.2 3.2 0.72 Average number of hours of serviceb 316.8 318.3 -1.5 0.97 Average number of providers 1.7 1.4 0.3 *** 0.00
Unmet Service Needs (%) Any unmet service need 28.2 29.7 -1.4 0.68 Type of unmet service need
Help finding a job 9.0 12.9 -3.9 * 0.09 Other employment services 13.9 16.1 -2.2 0.43 Basic skills training 2.1 2.5 -0.4 0.69 Other unmet needs 17.4 14.5 2.9 0.30
Source: YTD 12-month follow-up survey.
Notes: The sample includes all youth who completed the study’s 12-month follow-up survey. In the table, we report observed means or percentages for the treatment group, estimates of what the treatment group means or percentages would have been in the absence of BHBF, and regression-adjusted impact estimates (see Chapter II, Section A.4). We measured explanatory variables in the regression model before random assignment by using data from the study’s baseline survey and SSA administrative records. We calculated all statistics with sample weights to account for interview non-response. The analysis sample includes 404 treatment group youth and 334 control group youth. Survey item non-response may have resulted in smaller sample sizes for specific outcomes. See Appendix A, Table A.5, for sample sizes for all outcomes.
aThe average values include youth who did not use any (employment or non-employment) services. bFor these outcomes, item non-response occurred conditionally, depending on the values of other measures in the follow-up survey. The rate of missing data ranges from 13.4 to 15.0 percent. We used a multiple imputation procedure to assign values when they were missing. See Appendix A, Section E, for more information on the procedure.
*/**/***Impact estimate is significantly different from zero at the .10/.05/.01 level using a two-tailed t-test.
is based on information the youth provided about the typical frequency of their service contacts (for example, weekly or monthly).
The survey-based measure of hours of service use is especially problematic. For each service provider reported by a youth, we used information on the starting and ending dates of service, the frequency of visits, and the typical length of each visit (in minutes). We multiplied these components together to calculate the total hours of services for each provider and then summed across the providers to calculate the grand total of service hours. We thus constructed our measure of service hours from three measures that are themselves difficult to measure accurately, based on recall over an entire year.
We estimated that BHBF had no impact on the number of hours of services used. Treatment group members used 317 hours of services, on average, and we estimated that they would have used almost the same number of hours of services in the absence of the project.52
52 To flesh out this analysis, we examined the average hours of services among youth who received any services.
The average hours of services were lower for treatment group youth (407 hours) than control group youth (483 hours), but the difference (76 hours) is not statistically significant (not shown in Table IV.2). Because this analysis was
The average number of
(continued)

Interim Report on Broadened Horizons, Brighter Futures Chapter IV: Impacts on Employment Services
70
hours of services treatment group members used may seem surprisingly high in light of the finding from the process analysis, which showed that youth participating in BHBF received an average of almost 29 hours of services from the project (Table III.7). One explanation is that the survey-based measure reflects services received from BHBF and other providers, such as schools and personal care providers; the average includes some very high values for youth who received personal care or other services on a daily basis.53
In collaboration with other service providers in Miami-Dade County, BHBF used partners and referrals to meet the needs of its participants, perhaps leading to the expectation that the project would have increased the total number of service providers used. On the other hand, given that the project provided youth with a number of services directly, and that control group youth may have had to rely on several providers for the services they wanted, the project could have had the opposite effect on the number of service providers used. We estimated that BHBF increased the number of service providers used by youth. On average, treatment group members received services from 1.7 providers (including BHBF), and we estimated that they would have used just 1.4 providers had they not had the opportunity to participate in the project (a relative increase of 21 percent). The difference is statistically significant at the one percent level.
Two additional explanations are (1) the fundamental differences between how BHBF staff and survey respondents perceived and reported services, and (2) the measurement error in the hours of service receipt as calculated from the follow-up survey.
Although BHBF increased the amount of services used, the project did not reduce the share of youth with unmet service needs. Among youth in the treatment group, 28 percent reported any unmet need (Table IV.2).54
C. BHBF Did Not Increase Understanding of the Relationship Between Benefits and Employment
We estimated that the share would have been nearly the same in the absence of the project. Consistent with BHBF’s emphasis on employment services, we did find that BHBF decreased the unmet needs related to help finding a job. On average, among treatment group members, 9 percent reported having an unmet service need for help finding a job. We estimated that in the absence of BHBF, 13 percent of youth would have reported the same unmet need. The impact is statistically significant at the ten percent level.
The BHBF service model emphasized intensive benefits counseling by BHBF benefits specialists. This focus of the project was borne out by our previously reported finding that the project increased the proportion of youth who received benefits counseling by 11 percentage points (Table IV.1). These results notwithstanding, in this section we show that BHBF did not lead to
(continued) conducted on a self-selected subsample (youth who used any services), rather than on the full research sample, this finding should not be interpreted as a formal impact estimate.
53 To understand the hours of services measure better, we examined this measure for youth who used fewer than 1,000 hours of services over the one-year recall period. The 1,000-hour level is roughly equivalent to 4 hours of services every weekday over the year. Eighty-seven percent of treatment group members and 86 percent of control group members used fewer than 1,000 hours of services. Among these youth, the average amount of services used was 106 hours for those in the treatment group and 104 hours for those in the control group.
54 Specifically, the evaluation’s 12-month follow-up survey asked if the youth “needed any (other) help or services preparing for work or school” that they had not received. One possible explanation for the absence of an impact on unmet service needs is that BHBF may have increased youth awareness of needs. This increased awareness of needs could have offset any potential reduction in unmet service needs due to the intervention.

Interim Report on Broadened Horizons, Brighter Futures Chapter IV: Impacts on Employment Services
71
increased understanding of the relationship between benefits and employment. The project did increase knowledge of specific SSA requirements and work incentives, however.
We analyzed two measures that capture whether youth understood that, when they started working, they would not lose (1) all of their SSA benefits or (2) their related medical insurance.55, 56 Sixty-two percent of treatment group members reported correctly that the entire cash benefit is not lost once work begins, and 75 percent reported correctly that medical insurance is not lost as soon as work commences (Table IV.3). We estimated that these proportions would have been roughly the same in the absence of BHBF. In other words, we found no statistically significant evidence that BHBF improved understanding of these relationships.57
In addition to determining whether youth understood the basic principle that all benefits are not lost when they start working, we examined whether BHBF increased their awareness of specific SSA requirements and work incentives. Awareness among treatment group youth was not as great as might have been expected, given the project’s emphasis on benefits counseling; however, it was significantly greater than what it would have been in the absence of the project. The 12-month survey asked youth whether they had ever heard of each of the following six requirements or work incentives for disability beneficiaries:
58
1. The earned income exclusion (EIE)
2. The student earned income exclusion (SEIE) 3. The continuing disability review (CDR) or age-18 medical redetermination requirement 4. The plan for achieving self-support (PASS) 5. Individual development accounts (IDAs) 6. Medicaid-while-working or continued Medicaid eligibility
Table IV.3 shows that more than half of treatment group members were aware of the CDR/age-18 medical redetermination requirement but far less than half were aware of each of the five work incentives. Their awareness would have been lower if they had not had the opportunity to participate in BHBF. We estimated that the project significantly increased awareness of the review/redetermination requirement and all five work incentives by between 7 and 38 percentage
55 For most measures discussed in this section and reported in Table IV.3, we collected information on knowledge
of SSA benefits from one source per respondent. For youth age 18 or older, the 12-month follow-up survey asked the youth directly about knowledge of SSA benefits. For youth who were under age 18, the survey asked a parent (or guardian) about knowledge of SSA benefits. For ease of exposition, we discuss these measures as if they had been reported by the youth themselves. For two measures, we collected information from both youth and parents. For knowledge of IDAs, we report both measures: 19 percent of records were missing youth responses and 23 percent were missing parent responses. For knowledge of the CDR or age-18 medical redetermination, we report only parent responses due to missing information on youth responses: 97 percent of records were missing youth responses, whereas 24 percent were missing parent responses. The high degree of missing information on youth responses occurred in large part because the information was asked only of youth under age 18.
56 These measures report the share of youth who (correctly) disagreed with the statements, “As soon as people start working, they stop getting their Social Security benefits” and “As soon as people start working, they lose their medical coverage.”
57 Understanding of these relationships was somewhat higher among treatment group youth who had worked for pay in the year following random assignment. Of these youth, 71 percent understood the relationship between work and SSA benefits, and 81 percent understood the relationship between work and medical coverage (not shown).
58 The survey questions provided both the name of each requirement or incentive and a brief description.
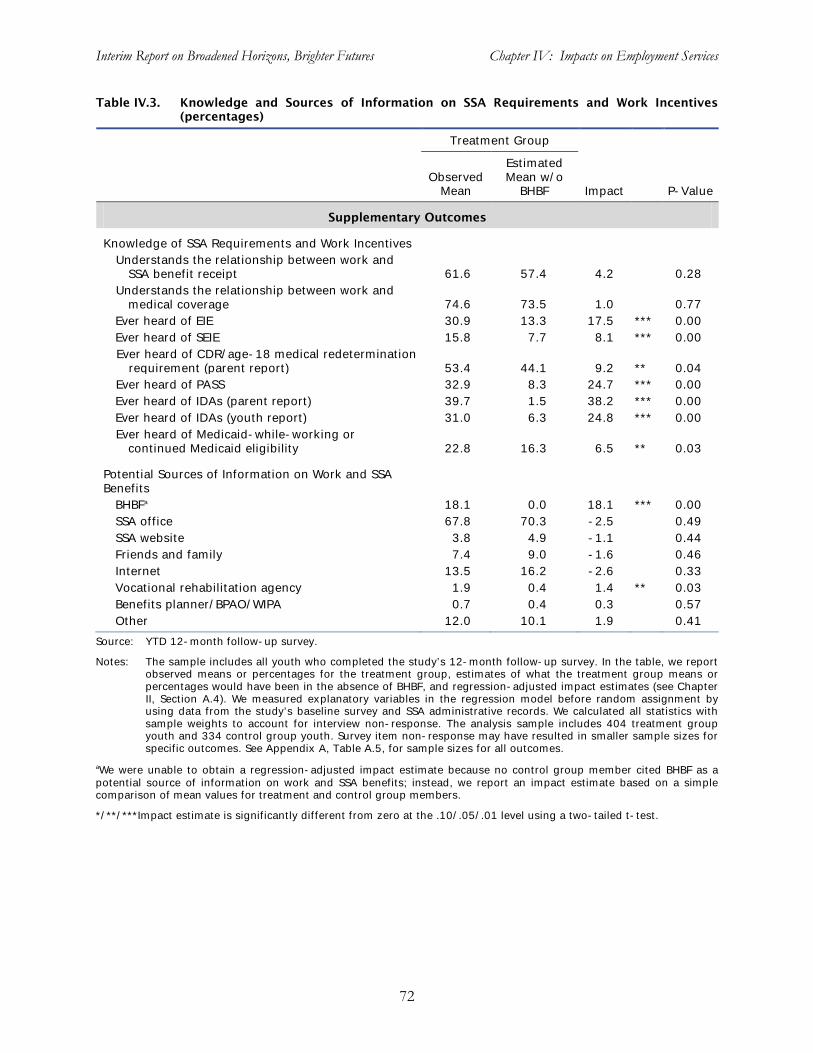
Interim Report on Broadened Horizons, Brighter Futures Chapter IV: Impacts on Employment Services
72
Table IV.3. Knowledge and Sources of Information on SSA Requirements and Work Incentives (percentages)
Treatment Group
Observed
Mean
Estimated Mean w/o
BHBF Impact P-Value
Supplementary Outcomes
Knowledge of SSA Requirements and Work Incentives Understands the relationship between work and
SSA benefit receipt 61.6 57.4 4.2 0.28 Understands the relationship between work and
medical coverage 74.6 73.5 1.0 0.77 Ever heard of EIE 30.9 13.3 17.5 *** 0.00 Ever heard of SEIE 15.8 7.7 8.1 *** 0.00 Ever heard of CDR/age-18 medical redetermination
requirement (parent report) 53.4 44.1 9.2 ** 0.04 Ever heard of PASS 32.9 8.3 24.7 *** 0.00 Ever heard of IDAs (parent report) 39.7 1.5 38.2 *** 0.00 Ever heard of IDAs (youth report) 31.0 6.3 24.8 *** 0.00 Ever heard of Medicaid-while-working or
continued Medicaid eligibility 22.8 16.3 6.5 ** 0.03
Potential Sources of Information on Work and SSA Benefits
BHBFa 18.1 0.0 18.1 *** 0.00 SSA office 67.8 70.3 -2.5 0.49 SSA website 3.8 4.9 -1.1 0.44 Friends and family 7.4 9.0 -1.6 0.46 Internet 13.5 16.2 -2.6 0.33 Vocational rehabilitation agency 1.9 0.4 1.4 ** 0.03 Benefits planner/BPAO/WIPA 0.7 0.4 0.3 0.57 Other 12.0 10.1 1.9 0.41
Source: YTD 12-month follow-up survey.
Notes: The sample includes all youth who completed the study’s 12-month follow-up survey. In the table, we report observed means or percentages for the treatment group, estimates of what the treatment group means or percentages would have been in the absence of BHBF, and regression-adjusted impact estimates (see Chapter II, Section A.4). We measured explanatory variables in the regression model before random assignment by using data from the study’s baseline survey and SSA administrative records. We calculated all statistics with sample weights to account for interview non-response. The analysis sample includes 404 treatment group youth and 334 control group youth. Survey item non-response may have resulted in smaller sample sizes for specific outcomes. See Appendix A, Table A.5, for sample sizes for all outcomes.
aWe were unable to obtain a regression-adjusted impact estimate because no control group member cited BHBF as a potential source of information on work and SSA benefits; instead, we report an impact estimate based on a simple comparison of mean values for treatment and control group members.
*/**/***Impact estimate is significantly different from zero at the .10/.05/.01 level using a two-tailed t-test.
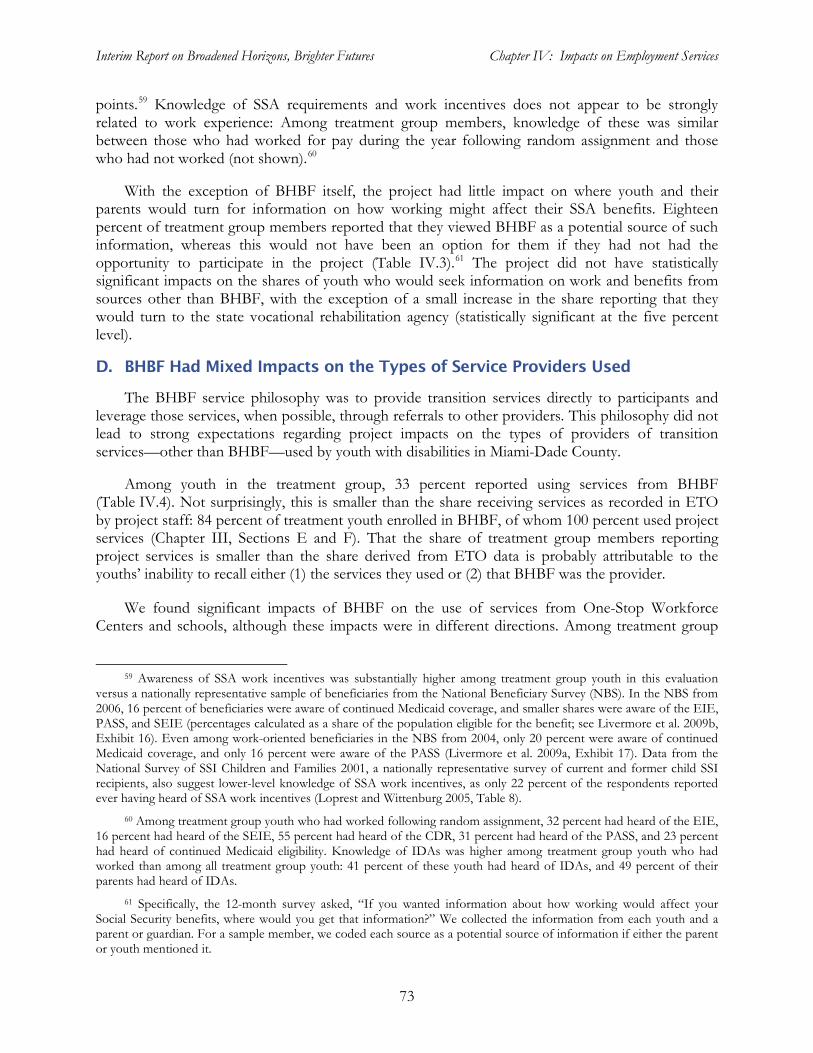
Interim Report on Broadened Horizons, Brighter Futures Chapter IV: Impacts on Employment Services
73
points.59 Knowledge of SSA requirements and work incentives does not appear to be strongly related to work experience: Among treatment group members, knowledge of these was similar between those who had worked for pay during the year following random assignment and those who had not worked (not shown).60
With the exception of BHBF itself, the project had little impact on where youth and their parents would turn for information on how working might affect their SSA benefits. Eighteen percent of treatment group members reported that they viewed BHBF as a potential source of such information, whereas this would not have been an option for them if they had not had the opportunity to participate in the project (Table IV.3).
61
D. BHBF Had Mixed Impacts on the Types of Service Providers Used
The project did not have statistically significant impacts on the shares of youth who would seek information on work and benefits from sources other than BHBF, with the exception of a small increase in the share reporting that they would turn to the state vocational rehabilitation agency (statistically significant at the five percent level).
The BHBF service philosophy was to provide transition services directly to participants and leverage those services, when possible, through referrals to other providers. This philosophy did not lead to strong expectations regarding project impacts on the types of providers of transition services—other than BHBF—used by youth with disabilities in Miami-Dade County.
Among youth in the treatment group, 33 percent reported using services from BHBF (Table IV.4). Not surprisingly, this is smaller than the share receiving services as recorded in ETO by project staff: 84 percent of treatment youth enrolled in BHBF, of whom 100 percent used project services (Chapter III, Sections E and F). That the share of treatment group members reporting project services is smaller than the share derived from ETO data is probably attributable to the youths’ inability to recall either (1) the services they used or (2) that BHBF was the provider.
We found significant impacts of BHBF on the use of services from One-Stop Workforce Centers and schools, although these impacts were in different directions. Among treatment group
59 Awareness of SSA work incentives was substantially higher among treatment group youth in this evaluation
versus a nationally representative sample of beneficiaries from the National Beneficiary Survey (NBS). In the NBS from 2006, 16 percent of beneficiaries were aware of continued Medicaid coverage, and smaller shares were aware of the EIE, PASS, and SEIE (percentages calculated as a share of the population eligible for the benefit; see Livermore et al. 2009b, Exhibit 16). Even among work-oriented beneficiaries in the NBS from 2004, only 20 percent were aware of continued Medicaid coverage, and only 16 percent were aware of the PASS (Livermore et al. 2009a, Exhibit 17). Data from the National Survey of SSI Children and Families 2001, a nationally representative survey of current and former child SSI recipients, also suggest lower-level knowledge of SSA work incentives, as only 22 percent of the respondents reported ever having heard of SSA work incentives (Loprest and Wittenburg 2005, Table 8).
60 Among treatment group youth who had worked following random assignment, 32 percent had heard of the EIE, 16 percent had heard of the SEIE, 55 percent had heard of the CDR, 31 percent had heard of the PASS, and 23 percent had heard of continued Medicaid eligibility. Knowledge of IDAs was higher among treatment group youth who had worked than among all treatment group youth: 41 percent of these youth had heard of IDAs, and 49 percent of their parents had heard of IDAs.
61 Specifically, the 12-month survey asked, “If you wanted information about how working would affect your Social Security benefits, where would you get that information?” We collected the information from each youth and a parent or guardian. For a sample member, we coded each source as a potential source of information if either the parent or youth mentioned it.

Interim Report on Broadened Horizons, Brighter Futures Chapter IV: Impacts on Employment Services
74
Table IV.4. Use of Services, by Type of Provider (percentages)
Treatment Group
Observed
Mean
Estimated Mean w/o
BHBF Impact P-Value
Supplementary Outcomes
Type of Service Provider BHBF a 32.5 0.0 32.5 *** 0.00 One-Stop Workforce Center 6.5 2.7 3.8 ** 0.03 Schools or school districts 32.2 44.0 -11.9 *** 0.00 Vocational rehabilitation agency (DVR) 9.8 10.7 -0.9 0.71 Work-related, sheltered workshop,
employment agency, job training 4.7 2.1 2.6 0.11 SSA office 6.6 6.8 -0.2 0.92 Health services providers 6.6 6.4 0.2 0.93 Other providers primarily serving
people with disabilities 14.5 8.0 6.5 *** 0.01 All other providers 23.8 19.7 4.0 0.20
Source: YTD 12-month follow-up survey.
Notes: The sample includes all youth who completed the study’s 12-month follow-up survey. In the table, we report observed means or percentages for the treatment group, estimates of what the treatment group means or percentages would have been in the absence of BHBF, and regression-adjusted impact estimates (see Chapter II, Section A.4). We measured explanatory variables in the regression model before random assignment by using data from the study’s baseline survey and SSA administrative records. We calculated all statistics with sample weights to account for interview non-response. The analysis sample includes 404 treatment group youth and 334 control group youth. Survey item non-response may have resulted in smaller sample sizes for specific outcomes. See Appendix A, Table A.5, for sample sizes for all outcomes.
aWe were unable to obtain a regression-adjusted impact estimate for the use of BHBF services because no control group member reported the use of such services. Instead, we report an impact estimate based on a simple comparison of mean values for treatment and control group members.
*/**/***Impact estimate is significantly different from zero at the .10/.05/.01 level using a two-tailed t-test.
youth, seven percent reported receiving services from a One-Stop. We estimated that, in the absence of BHBF, the share would have been three percent. This positive impact may have been due to the project’s informal relationships with the South Florida Workforce Investment Board, which facilitated access to One-Stop services for BHBF participants.
In contrast to this positive impact, we found that BHBF reduced the share of youth who received services from schools or school districts by 12 percentage points. This negative impact may have been due to BHBF participants having received services from the project that they otherwise would have sought from schools. Alternatively, school staff may have reduced their service outreach to BHBF participants because they believed that the youths’ needs were being met by the project.
We found no impacts of BHBF on the use of services from the state vocational rehabilitation agency, the local SSA office, health service providers, or all other providers, such as churches, group homes, and community centers. However, we did find that the project increased the use of services from a group of other providers that primarily served people with disabilities. Fifteen percent of treatment group youth used services from these providers. We estimated that only eight percent would have done so in the absence of BHBF.

Interim Report on Broadened Horizons, Brighter Futures Chapter IV: Impacts on Employment Services
75
E. Impacts on the Use of Employment Services Did Not Vary Across Subgroups
Reasonable arguments can be advanced for why the impacts of BHBF on the use of employment-promoting services might have been different for some subgroups of youth than others. For example, as we describe in Chapter III, BHBF sharpened its focus on employment services during its second year of full operation; thus, we might expect to observe larger impacts on the use of employment services for youth who enrolled in the evaluation and were randomly assigned in July 2009 or later. As another example, youth age 18 or older at baseline might have been more interested in employment and so more receptive to employment services than younger youth. Similarly, youth not enrolled in school at baseline might have had more interest and time available to participate in employment services than their in-school peers. To investigate whether such differences in impacts on service use actually occurred, we estimated impacts on the primary outcome measure in the domain of employment-promoting services—the use of any employment-promoting service—for subgroups of youth defined by random assignment cohort and baseline values of age, school attendance, and work experience.
Overall, we did not find evidence that the impact of BHBF on the use of employment services varied across the subgroups considered. Table IV.5 shows that the difference between the impact estimates for youth who were randomly assigned before July 2009 (16 percentage points) and for those randomly assigned later (6 percentage points) is not statistically significant. This result is somewhat surprising, given that our process analysis found that BHBF delivered substantially more hours of employment services to the later cohort than to the earlier cohort.62
62 Our process analysis of ETO data showed that nearly all youth in both cohorts received some employment
services. The average hours of employment services provided by BHBF increased from 10 hours for the early cohort to 22 hours for the later cohort (Table III.8). Even with the increase in the hours of employment services provided, some youth received only a few hours or less of employment services and may have forgotten them, or misreported them as non-employment services, when providing information for the follow-up survey.
As with the cohorts, for the other subgroup pairs, the impact estimates differ between the two subgroups, but the differences are not statistically significant.
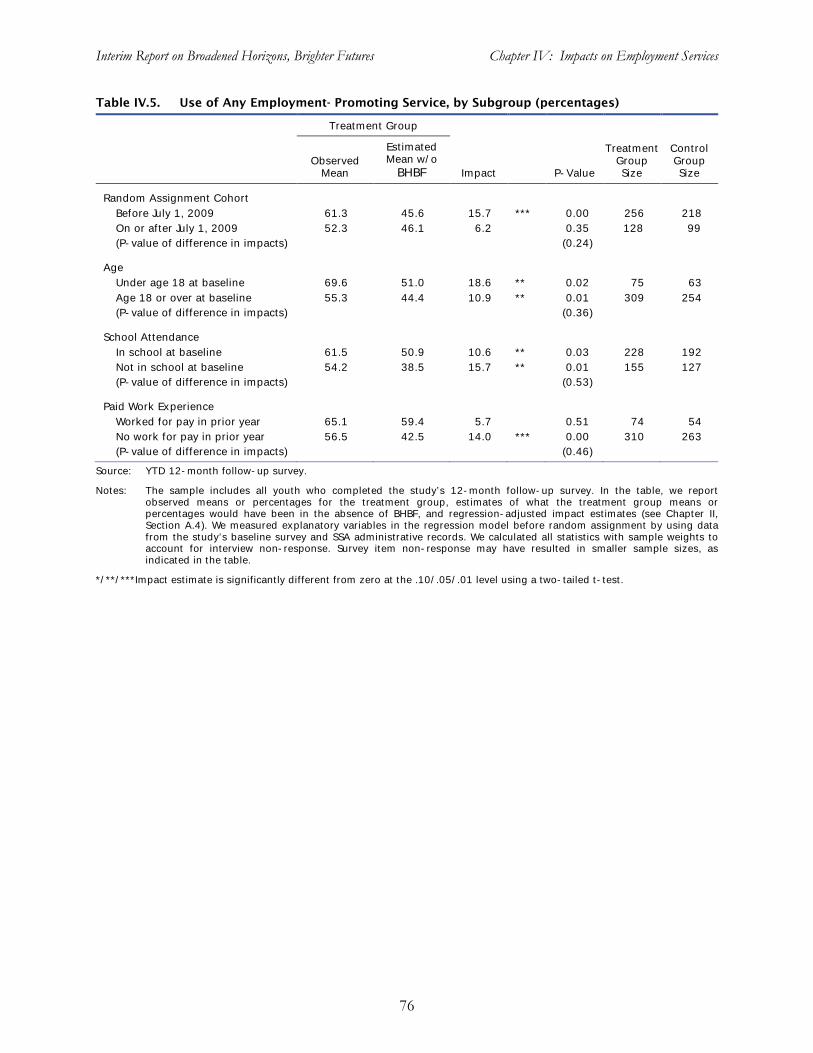
Interim Report on Broadened Horizons, Brighter Futures Chapter IV: Impacts on Employment Services
76
Table IV.5. Use of Any Employment- Promoting Service, by Subgroup (percentages)
Treatment Group
Observed
Mean
Estimated Mean w/o
BHBF Impact P-Value
Treatment Group Size
Control Group Size
Random Assignment Cohort Before July 1, 2009 61.3 45.6 15.7 *** 0.00 256 218 On or after July 1, 2009 52.3 46.1 6.2
0.35 128 99
(P-value of difference in impacts) (0.24)
Age Under age 18 at baseline 69.6 51.0 18.6 ** 0.02 75 63 Age 18 or over at baseline 55.3 44.4 10.9 ** 0.01 309 254 (P-value of difference in impacts) (0.36)
School Attendance In school at baseline 61.5 50.9 10.6 ** 0.03 228 192 Not in school at baseline 54.2 38.5 15.7 ** 0.01 155 127 (P-value of difference in impacts) (0.53)
Paid Work Experience Worked for pay in prior year 65.1 59.4 5.7 0.51 74 54 No work for pay in prior year 56.5 42.5 14.0 *** 0.00 310 263 (P-value of difference in impacts) (0.46)
Source: YTD 12-month follow-up survey.
Notes: The sample includes all youth who completed the study’s 12-month follow-up survey. In the table, we report observed means or percentages for the treatment group, estimates of what the treatment group means or percentages would have been in the absence of BHBF, and regression-adjusted impact estimates (see Chapter II, Section A.4). We measured explanatory variables in the regression model before random assignment by using data from the study’s baseline survey and SSA administrative records. We calculated all statistics with sample weights to account for interview non-response. Survey item non-response may have resulted in smaller sample sizes, as indicated in the table.
*/**/***Impact estimate is significantly different from zero at the .10/.05/.01 level using a two-tailed t-test.
77
V. IMPACTS ON EMPLOYMENT AND EARNINGS
BHBF sought to improve economic self-sufficiency and independence among youth receiving SSA disability benefits by providing intensive services, including work-based experiences, as well as the waiver of certain disability program rules. Work-based experiences, ranging from workplace tours to placement in paid jobs, were integral to the intervention, so its effective implementation could be expected to lead to increased employment and earnings within the first year of service receipt. In Sections A-C of this chapter we examine the short-term impacts of BHBF on employment, earnings, and job characteristics. In Section D we present estimates of the project’s impacts on employment for key subgroups of its target population. Finally, in Section E we provide a descriptive analysis of job characteristics and job search activities among treatment group youth during the year following random assignment.
We found that BHBF had a statistically significant positive impact on paid employment during the year after youth enrolled in the evaluation. We also found statistically significant positive impacts of the intervention on several measures of earnings and job characteristics.
A. BHBF Increased Paid Employment
Maximizing self-sufficiency through work was a central goal of the YTD interventions; consequently, we identified employment as a key domain for the analysis of the short-term impacts of BHBF and the other YTD projects. The primary outcome in this domain is the share of youth ever employed in paid jobs during the year after random assignment. This measure is preferred to a measure of the intensity of employment, such as the number of weeks worked during the year, because more than half of the youth in the evaluation were students, who would not be expected to work intensively over the course of the year. We constructed the primary outcome measure based on youth reports of paid employment during the period between random assignment and the 12-month follow-up interview. As noted in Chapter II, paid employment in the year following random assignment is, in part, a measure of the receipt of services, as BHBF emphasized experiences in paid employment.
BHBF significantly increased the share of youth with paid employment during the year following random assignment. Twenty-three percent of the treatment group youth were ever employed in paid jobs during the follow-up period (Table V.1).63
63 In Chapter III, Section D.6, we report that our analysis of ETO data revealed that 54 percent of the youth who
participated in BHBF services worked in competitive paid jobs at some point during their involvement in BHBF. When we focus on the year following random assignment, 29 percent of the BHBF participants worked in competitive paid jobs according to ETO records; the rate is 30 percent for any paid job (regardless of whether it was competitive) at or above the minimum wage. The difference between the employment rates computed from ETO data, and the 23 percent rate of paid employment computed for treatment group members from the 12-month survey data (Table V.1) may be explained by two factors. First, the ETO data cover only BHBF participants, instead of all youth in the treatment group; the employment rates might have been lower if the ETO data had also covered treatment group youth who did not participate in BHBF (this was not possible). Second, and more importantly, the survey respondents were asked to recall paid employment over the entire preceding 12 months. The youth may have forgotten about some of their employment experiences, especially their experiences in short-term jobs.
In the absence of BHBF, we estimated that 13 percent of the youth would have ever been employed in paid jobs during that period. The estimated impact of 9 percentage points (a relative increase of 70 percent) is statistically significant at the one percent level.

Interim Report on Broadened Horizons, Brighter Futures Chapter V: Impacts on Employment and Earnings
78
Table V.1. Employment and Number of Jobs (percentages, unless otherwise noted)
Treatment Group
Observed
Mean
Estimated Mean w/o
BHBF Impact P-Value
Primary Outcome
Ever employed in paid job during first year after random assignment (RA) 22.8 13.4 9.4 *** 0.00
Supplementary Outcomes
Employment During the First Year After RA Ever employed in any (paid or unpaid) job 24.6 15.2 9.4 *** 0.00 Ever employed in unpaid job (but not on paid job) 1.6 1.6 0.0 0.96
Extent of Employment During First Year After RAa Percentage of weeks employed in any (paid or unpaid) job
since RA 11.9 8.8 3.1 0.13 Percentage of weeks employed in paid jobs since RA 9.8 7.6 2.2 0.24 Percentage of weeks employed in unpaid jobs since RA 1.5 0.7 0.8 0.31
Employment Status at the Time of the Follow-up Survey 0.55 Employed in paid job 9.7 8.5 1.1 Employed in unpaid job 1.7 0.6 1.1 Not employed, looking for work 18.6 16.7 1.9 Not employed, out of the labor force 70.1 74.2 -4.1
Number of Jobs Held During the First Year After RAa Number of jobs (paid and unpaid) ** 0.02
0 76.9 85.0 -8.1 1 21.0 13.9 7.1 2 or more 2.1 1.1 1.0 (Average, paid and unpaid)b 0.29 0.20 0.10 ** 0.02
Average number of jobs (paid)b 0.25 0.16 0.09 *** 0.01 Average number of jobs (unpaid)b 0.02 0.02 0.00 0.79
Source: YTD 12-month follow-up survey.
Notes: The sample includes all youth who completed the study’s 12-month follow-up survey. In the table, we report observed means or percentages for the treatment group, estimates of what the treatment group means or percentages would have been in the absence of BHBF, and regression-adjusted impact estimates (see Chapter II, Section A.4). We measured explanatory variables in the regression model before random assignment by using data from the study’s baseline survey and SSA administrative records. We calculated all statistics with sample weights to account for interview non-response. The analysis sample includes 404 treatment group youth and 334 control group youth. Survey item non-response may have resulted in smaller sample sizes for specific outcomes. See Appendix A, Table A.5, for sample sizes for all outcomes.
aFor these outcomes, item non-response occurred conditionally, depending on the values of other measures in the follow-up survey. The rate of missing data ranges from 0.4 percent to 2.8 percent. We used a multiple imputation procedure to assign values when they were missing. See Appendix A, Section E, for more information on this procedure. bThe average includes youth who were not employed during the year following random assignment.
*/**/***Impact estimate is significantly different from zero at the .10/.05/.01 level using either a two-tailed t-test or a chi-square test.
To enhance our understanding of the impact on the primary employment outcome, we conducted supplementary analyses of other employment-related outcomes. Table V.1 presents the estimated impacts on these outcomes, including the prevalence of employment in any job (paid or unpaid) and solely in unpaid jobs. Similar to what we found for paid jobs, BHBF had a statistically significant positive impact on the share of youth employed in any job (paid or unpaid). Twenty-five percent of treatment group youth were ever employed in any job during the year following random assignment, which was nine percentage points more than would have been employed in the absence of the intervention (a relative increase of 62 percent). The prevalence of employment in unpaid jobs

Interim Report on Broadened Horizons, Brighter Futures Chapter V: Impacts on Employment and Earnings
79
was low; only two percent of treatment group youth were ever employed in jobs without pay. We found no impact on the share of youth employed in unpaid jobs.
Although BHBF increased the prevalence of employment, it had no effect on the extent of employment, as measured by the percentage of weeks that youth were employed during the year following random assignment. We constructed this measure by first identifying a respondent’s employment status in each week following random assignment and then aggregating that information over the 52-week follow-up period. Table V.1 shows that youth in the treatment group were employed in any (paid or unpaid) job for 12 percent of the 52 weeks (roughly 6 weeks) following random assignment. (This average includes values of zero for youth who were never employed during the year, as do all other employment and earnings averages reported in this chapter.) In the absence of BHBF, they would have been employed for 9 percent of the 52 weeks. The estimated impact of 3 percentage points is not statistically significant. The project also had no significant impacts on the extent of either paid employment only or unpaid employment only.
In addition, BHBF had no effect on employment status at the time of the follow-up survey. Youth could have been in any one of four employment statuses when they completed the survey: employed in a paid job; employed in an unpaid job only (no paid employment); not employed but in the labor force (that is, actively looking for work); and not employed and out of the labor force. To identify the impact of the project, we conducted a test of the difference between the observed distribution of treatment group youth across these employment statuses and our estimate of what that distribution would have been in the absence of the project. The results in Table V.1 show no significant evidence that the project had an effect on employment status at the time of the follow-up survey. These results suggest that the previous finding of positive impacts on employment during the year following random assignment was driven by treatment group youth being more likely to have had short-term jobs during the year than they would have in the absence of the intervention.
The project did increase the number of jobs (paid and unpaid combined) held during the year following random assignment. We found that BHBF decreased the share of youth having no job and increased the share having one job. Accordingly, the project increased the average number of jobs held by youth during the year. The average number of (paid or unpaid) jobs held by treatment group youth was 0.29, which was 0.10 more (a relative increase of 50 percent) than the number of jobs they would have held without the intervention. This impact is statistically significant at the five percent level. Table V.1 shows that the project also had a similar positive impact on the average number of paid jobs only but did not significantly affect the average number of unpaid jobs that youth held during the year.
BHBF also had significant impacts on the timing of employment following random assignment. We used youth reports from the 12-month follow-up survey on the starting and ending dates of each job to construct monthly measures of employment. Figure V.1 presents the rates of employment for youth in any job, and in paid jobs only, for each month during the year following random assignment.64
64 We interviewed 24 percent of the analysis sample during (before the end of) the 12th month following random
assignment; consequently, employment outcomes measured for month 12 may reflect some underlying censoring in the data (that is, incomplete data on employment in month 12 for these cases). Because there were no significant treatment-control differences in the timing of responses to the 12-month follow-up survey, we do not anticipate any bias in the estimated impacts for month 12.
The figure shows the actual employment rates for treatment group members and our estimates of what the rates would have been if they had not had the opportunity to participate in the project. In the figure, the vertical difference between the two plotted employment

Interim Report on Broadened Horizons, Brighter Futures Chapter V: Impacts on Employment and Earnings
80
Figure V.1. Employment Rate, by Month Following Random Assignment
Source: YTD 12-month follow-up survey.
Notes: The sample includes all youth who completed the study’s 12-month follow-up survey. In these figures, we present observed percentages for the treatment group and estimates of what the treatment group percentages would have been in the absence of BHBF. We measured explanatory variables in the regression model prior to random assignment by using data from the study’s baseline survey and SSA administrative records. We calculated all statistics with sample weights to account for interview non-response.
For all outcomes in this figure, item non-response occurred conditionally, depending on the values of other measures in the follow-up survey. The rate of missing data ranges from 1.6 percent to 2.9 percent. We used a multiple imputation procedure to assign values when they were missing. See Appendix A, Section E, for more information on this procedure.
The impact estimates for employment in paid or unpaid jobs in months 3 and months 5 through 9 and employment in paid jobs only in months 3 and 8 are significantly different from zero at least at the .10 level.
rates for any month is a graphical representation of the estimated impact. The rates of employment in paid and unpaid jobs and in paid jobs only for treatment group youth were higher for each month during the year than they would have been in the absence of BHBF. The differences are statistically significant for month 3 and months 5 through 9 for any job, and for months 3 and 8 for paid jobs only. We conclude that the treatment group youth were employed at higher rates during some of the months in the year following random assignment than they would have been absent BHBF.
Figure V.2 displays the proportion of youth who had ever been employed since random assignment for each month during the year following random assignment. The cumulative employment rate for treatment group youth in paid and unpaid jobs combined increased gradually during year following random assignment, resulting in cumulative employment rates in months 4 through 12 that are significantly higher than they would have been in the absence of the intervention.65
65 The cumulative employment rate in paid or unpaid jobs in the 12th month following random assignment for
treatment group members shown in Figure V.2 (23.1 percent) does not equal the percentage of those youth employed on any paid or unpaid job during the year following random assignment shown in Table V.1 (24.6 percent). This deviation is a result of our use of the multiple imputation procedure in Stata (the statistical software used for this analysis) to assign employment status by month to youth who reported in the follow-up survey that they had worked but did not report the start and/or end dates for their jobs. This procedure imputed a status of not employed to several of these youth.
We obtained similar results for the cumulative employment rate in paid jobs only,
Treatment Group Treatment Group w/o BHBF (est.)
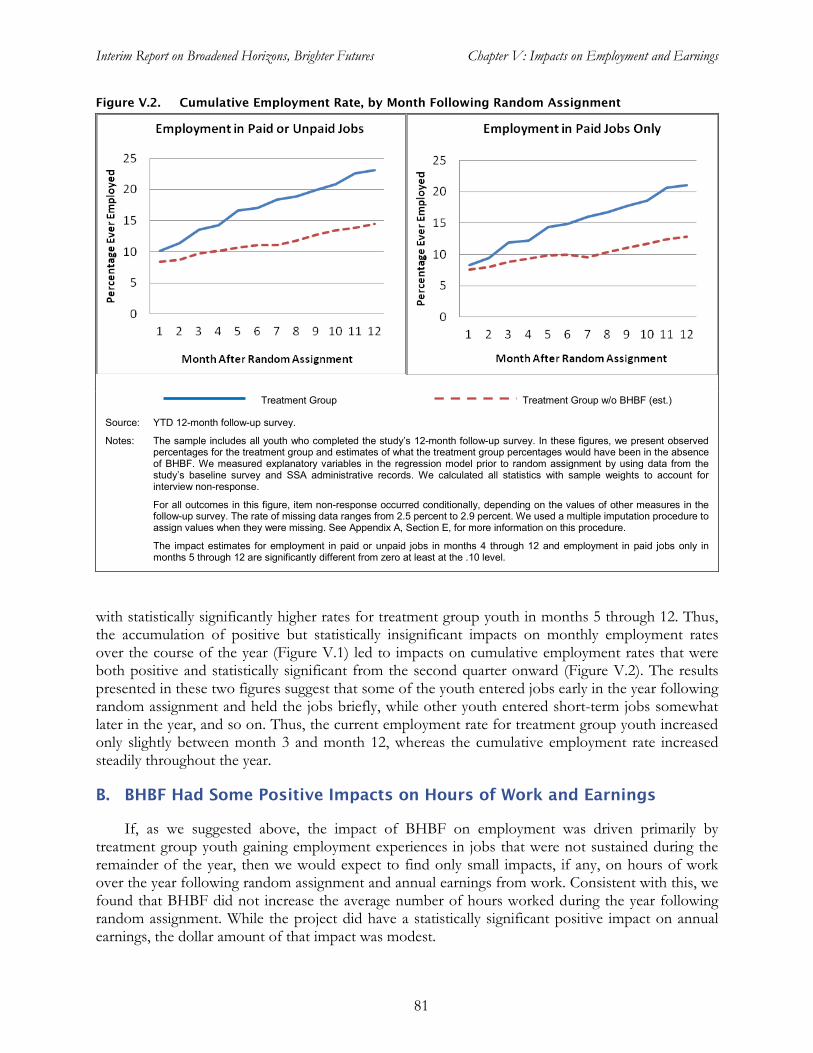
Interim Report on Broadened Horizons, Brighter Futures Chapter V: Impacts on Employment and Earnings
81
Figure V.2. Cumulative Employment Rate, by Month Following Random Assignment
Source: YTD 12-month follow-up survey.
Notes: The sample includes all youth who completed the study’s 12-month follow-up survey. In these figures, we present observed percentages for the treatment group and estimates of what the treatment group percentages would have been in the absence of BHBF. We measured explanatory variables in the regression model prior to random assignment by using data from the study’s baseline survey and SSA administrative records. We calculated all statistics with sample weights to account for interview non-response.
For all outcomes in this figure, item non-response occurred conditionally, depending on the values of other measures in the follow-up survey. The rate of missing data ranges from 2.5 percent to 2.9 percent. We used a multiple imputation procedure to assign values when they were missing. See Appendix A, Section E, for more information on this procedure.
The impact estimates for employment in paid or unpaid jobs in months 4 through 12 and employment in paid jobs only in months 5 through 12 are significantly different from zero at least at the .10 level.
with statistically significantly higher rates for treatment group youth in months 5 through 12. Thus, the accumulation of positive but statistically insignificant impacts on monthly employment rates over the course of the year (Figure V.1) led to impacts on cumulative employment rates that were both positive and statistically significant from the second quarter onward (Figure V.2). The results presented in these two figures suggest that some of the youth entered jobs early in the year following random assignment and held the jobs briefly, while other youth entered short-term jobs somewhat later in the year, and so on. Thus, the current employment rate for treatment group youth increased only slightly between month 3 and month 12, whereas the cumulative employment rate increased steadily throughout the year.
B. BHBF Had Some Positive Impacts on Hours of Work and Earnings
If, as we suggested above, the impact of BHBF on employment was driven primarily by treatment group youth gaining employment experiences in jobs that were not sustained during the remainder of the year, then we would expect to find only small impacts, if any, on hours of work over the year following random assignment and annual earnings from work. Consistent with this, we found that BHBF did not increase the average number of hours worked during the year following random assignment. While the project did have a statistically significant positive impact on annual earnings, the dollar amount of that impact was modest.
Treatment Group Treatment Group w/o BHBF (est.)

Interim Report on Broadened Horizons, Brighter Futures Chapter V: Impacts on Employment and Earnings
82
Table V.2. Total Hours Worked (percentages, unless otherwise noted)
Treatment Group
Observed
Mean
Estimated Mean w/o
BHBF Impact P-Value
Supplementary Outcomes
Total Hours Worked in All Jobs During First Year After Random Assignment
Total Hours Worked in Paid or Unpaid Jobs ** 0.01 Not employed 76.6 85.4 -8.8 >0 to 260 hours 10.9 4.5 6.4 >260 to 1,040 hours 7.7 6.9 0.8 >1,040 hours 4.8 3.1 1.7 (Average total hours all jobs)a 119.5 91.3 28.2 0.23
Total Hours Worked in Paid Jobs *** 0.01 No paid employment 78.3 87.4 -9.1 >0 to 260 hours 10.4 4.3 6.0 >260 to 1,040 hours 7.2 5.3 1.9 >1,040 hours 4.2 2.9 1.2 (Average total hours in paid jobs)a 103.1 77.1 26.1 0.21
Source: YTD 12-month follow-up survey.
Notes: The sample includes all youth who completed the study’s 12-month follow-up survey. In the table, we report observed means or percentages for the treatment group, estimates of what the treatment group means or percentages would have been in the absence of BHBF, and regression-adjusted impact estimates (see Chapter II, Section A.4). We measured explanatory variables in the regression model before random assignment by using data from the study’s baseline survey and SSA administrative records. We calculated all statistics with sample weights to account for interview non-response. The analysis sample includes 404 treatment group youth and 334 control group youth. Survey item non-response may have resulted in smaller sample sizes for specific outcomes. See Appendix A, Table A.5, for sample sizes for all outcomes.
260 and 1,040 hours per year correspond to 5 and 20 hours per week, respectively, for 52 weeks.
For all outcomes in this table, item non-response occurred conditionally, depending on the values of other measures in the follow-up survey. The rate of missing data is 3.0 percent. We used a multiple imputation procedure to assign values when they were missing. See Appendix A, Section E, for more information on this procedure.
aThe average includes youth who were not employed during the year following random assignment.
*/**/***Impact estimate is significantly different from zero at the .10/.05/.01 level using either a two-tailed t-test or a chi-square test.
We estimated the impacts of the project on total hours worked in any (paid or unpaid) job and paid jobs only during the year following random assignment. On average, youth in the treatment group were employed for a total of 120 hours in paid and unpaid jobs and 103 hours in paid jobs only (Table V.2). We found no significant impact of BHBF on these measures of average hours, indicating that those youth would have worked about the same number of hours even if they had not had the opportunity to participate in the project. To better understand these findings, we investigated the impact on the distribution of total hours. We found that BHBF had a statistically significant impact on the distribution of total hours of work in paid and unpaid jobs (combined) by reducing the share of youth not employed over the year and increasing the share employed for no more than 260 hours. We found a similar impact on the distribution of total hours of work in paid jobs only.

Interim Report on Broadened Horizons, Brighter Futures Chapter V: Impacts on Employment and Earnings
83
Figure V.3. Hours Worked per Week, by Month Following Random Assignment
Source: YTD 12-month follow-up survey.
Notes: The sample includes all youth who completed the study’s 12-month follow-up survey. In these figures, we present observed means for the treatment group and estimates of what the treatment group means would have been in the absence of BHBF. We measured explanatory variables in the regression model prior to random assignment by using data from the study’s baseline survey and SSA administrative records. We calculated all statistics using sample weights to account for interview non-response.
For all outcomes in this figure, item non-response occurred conditionally, depending on the values of other measures in the follow-up survey. The rate of missing data ranges from 2.9 percent to 3.0 percent. We used a multiple imputation procedure to assign values when they were missing. See Appendix A, Section E, for more information on this procedure.
The average values of hours of employment include data for youth who were not employed during the indicated months.
None of the impact estimates shown in the figures are significantly different from zero at the .10 level.
We also estimated the impacts of the intervention on hours worked per week for each month during the year following random assignment. Among treatment group youth, the average number of hours worked per week in paid and unpaid jobs combined ranged from 1.9 hours to 2.7 hours (Figure V.3). These values are low because we included non-workers (with zero hours) in the analysis, and less than 15 percent of youth were working during these months (Figure V.1). We estimated that the average hours worked per week in each of the 12 months following random assignment would not have been significantly different in the absence of BHBF. In light of the small amount of unpaid employment (discussed in the previous section), it is not surprising that the monthly pattern of average hours worked per week is essentially the same for paid jobs only as for paid and unpaid jobs combined.
We estimated that BHBF had a positive impact on average earnings from employment during the year following random assignment (Table V.3). Combining youth reports of their hours and wage rates on each paid job during the follow-up period, we calculated their earnings for the entire year.66
66 We adjusted the earnings measures for inflation using the consumer price index for urban wage earners and
clerical workers (CPI-W) created by the U.S. Bureau of Labor Statistics (BLS). We chose this index because SSA uses it to adjust benefits. The earnings measures thus represent real earnings in 2008 dollars. For the yearly measure of earnings, we used the annual average of the CPI-W (as is the convention for SSA and BLS). For the monthly measures of earnings, we used the monthly CPI-W (not seasonally adjusted).
On average, youth in the treatment group had earnings of $895 during the year following
Treatment Group Treatment Group w/o BHBF (est.)

Interim Report on Broadened Horizons, Brighter Futures Chapter V: Impacts on Employment and Earnings
84
Table V.3. Earnings from Employment (percentages, unless otherwise noted)
Treatment Group
Observed
Mean
Estimated Mean w/o
BHBF Impact
P-Value
Supplementary Outcomes
Earnings During First Year After Random Assignment
Annual Earnings *** 0.01 No paid employment 77.0 86.4 -9.4 $1 to $1,000 5.1 3.8 1.2 >$1000 to $5,000 10.7 3.9 6.7 >$5,000 7.2 5.8 1.4 (Average earnings) ($)a 895 588 306 * 0.07
Earnings Per Month Worked During First Year After Random Assignment
Earnings per Month Worked ** 0.00 No paid employment 77.0 86.2 -9.2 $1 to $500 8.9 7.1 1.8 >$500 14.1 6.7 7.4 (Average earnings per month worked) ($)a 150 84 67 *** 0.00
Source: YTD 12-month follow-up survey.
Notes: The sample includes all youth who completed the study’s 12-month follow-up survey. In the table, we report observed means or percentages for the treatment group, estimates of what the treatment group means or percentages would have been in the absence of BHBF, and regression-adjusted impact estimates (see Chapter II, Section A.4). We measured explanatory variables in the regression model before random assignment by using data from the study’s baseline survey and SSA administrative records. We calculated all statistics with sample weights to account for interview non-response. The analysis sample includes 404 treatment group youth and 334 control group youth. Survey item non-response may have resulted in smaller sample sizes for specific outcomes. See Appendix A, Table A.5, for sample sizes for all outcomes.
For all outcomes in this table, item non-response occurred conditionally, depending on the values of other measures in the follow-up survey. The rate of missing data is 4.6 percent. We used a multiple imputation procedure to assign values when they were missing. See Appendix A, Section E, for more information on this procedure.
aThe average includes youth who were not employed during the year following random assignment.
*/**/***Impact estimate is significantly different from zero at the .10/.05/.01 level using either a two-tailed t-test or a chi-square test.
random assignment, which was $306 more than our estimate of their earnings absent the intervention (a relative increase of 52 percent); this difference is statistically significant at the ten percent level. In addition, we found that BHBF had a significant impact on the distribution of yearly earnings by reducing the share of youth who were not employed and therefore had no earnings and increasing the share with earnings in excess of $1,000.
Similarly, we found that BHBF had a significant impact on earnings per month worked during the year following random assignment (Table V.3). On average, youth in the treatment group earned $150 per month worked, which was $67 more than our estimate of what their average earnings would have been in the absence of BHBF (a relative increase of 80 percent). The difference is statistically significant at the one percent level.67
67 Youth not employed in paid jobs during the year following random assignment had zero earnings per month
worked. For youth who were employed in paid jobs, we calculated their total earnings over the year and divided by the number of months worked. On average, treatment group youth who were employed in paid jobs during the follow-up period worked about five months and earned $660 per month worked.

Interim Report on Broadened Horizons, Brighter Futures Chapter V: Impacts on Employment and Earnings
85
Figure V.4. Earnings, by Month Following Random Assignment
Source: YTD 12-month follow-up survey.
Notes: The sample includes all youth who completed the study’s 12-month follow-up survey. In these figures, we present observed means for the treatment group and estimates of what the treatment group means would have been in the absence of BHBF. We measured explanatory variables in the regression model prior to random assignment by using data from the study’s baseline survey and SSA administrative records. We calculated all statistics using sample weights to account for interview non-response.
For all outcomes in this figure, item non-response occurred conditionally, depending on the values of other measures in the follow-up survey. The rate of missing data ranges from 3.2 percent to 3.6 percent. We used a multiple imputation procedure to assign values when they were missing. See Appendix A, Section E, for more information on this procedure.
Earnings are measured in 2008 dollars.
The average values of earnings include data for youth who were not employed during the indicated months.
None of the impact estimates shown in the figure are significantly different from zero at the .10 level.
Figure V.4 presents the estimated average monthly earnings and average cumulative earnings for each month during the year following random assignment.68
C. BHBF Had Small Impacts on Job Characteristics
The timelines in the figure show that the average monthly earnings and cumulative earnings by month for treatment group members were somewhat higher than what they would have been in the absence of the intervention; however, those differences are not statistically significant for any month.
BHBF did affect certain characteristics of the jobs held by the target population; however, those impacts were small. We analyzed impacts on the characteristics of the primary paid jobs held by youth during the year following random assignment (Table V.4).69
68 The average cumulative earnings in the 12th month following random assignment for treatment group members
in Figure V.4 ($833) does not equal the average annual earnings during the year following random assignment in Table V.3 ($895). This deviation is a product of differential rates of item non-response across the annual and monthly measures of earnings and our use of the multiple imputation procedure to address non-response. For both measures, item non-response occurred conditionally, depending on the values of other measures in the follow-up survey.
We found that the project had
69 For youth who had more than one paid job during the follow-up period, we defined the primary job as the one that generated the most earnings.
Treatment Group Treatment Group w/o BHBF (est.)

Interim Report on Broadened Horizons, Brighter Futures Chapter V: Impacts on Employment and Earnings
86
Table V.4. Job Tenure, Hours of Work, Hourly Wage, and Benefits in the Primary Paid Job (percentages, unless otherwise noted)
Treatment Group
Observed
Mean
Estimated Mean w/o
BHBF Impact P-Value
Supplementary Outcomes
Tenure ** 0.02 Not employed 78.3 86.9 -8.7 1 month or less 4.4 2.4 2.0 >1 to 6 months 9.1 2.8 6.2 > 6 to 11 months 3.3 2.9 0.5 >11 months 4.9 4.9 0.0 (Average months of tenure)a 1.1 0.9 0.2 0.27
Usual Hours Worked per Week *** 0.01 Not employed 77.0 86.4 -9.4 10 hours or less 5.9 2.6 3.3 >10 to 20 hours 5.0 4.7 0.2 >20 hours 12.1 6.2 5.9 (Average hours per week)a 5.4 3.1 2.3 *** 0.00
Hourly Wage (in 2008 dollars) *** 0.01 Not employed 77.0 86.6 -9.6 <$7 6.4 3.4 3.0 $7 to $9 11.0 6.2 4.9 >$9 5.6 3.8 1.8
Health Insurance Benefit *** 0.01 Not employed 77.0 86.3 -9.3 Employed w/o health insurance 14.9 8.6 6.4 Employed with health insurance 8.1 5.1 3.0
Paid Vacation/Sick Leave Benefit *** 0.00 Not employed 77.0 86.7 -9.7 Employed w/o paid vacation/sick leave 15.2 8.1 7.1 Employed with paid vacation/sick leave 7.8 5.2 2.6
Source: YTD 12-month follow-up survey.
Notes: The sample includes all youth who completed the study’s 12-month follow-up survey. In the table, we report observed means or percentages for the treatment group, estimates of what the treatment group means or percentages would have been in the absence of BHBF, and regression-adjusted impact estimates (see Chapter II, Section A.4). We measured explanatory variables in the regression model before random assignment by using data from the study’s baseline survey and SSA administrative records. We calculated all statistics with sample weights to account for interview non-response. The analysis sample includes 404 treatment group youth and 334 control group youth. Survey item non-response may have resulted in smaller sample sizes for specific outcomes. See Appendix A, Table A.5, for sample sizes for all outcomes.
For all outcomes in this table, item non-response occurred conditionally, depending on the values of other measures in the follow-up survey. The rate of missing data ranges from 3.1 percent to 5.7 percent. We used a multiple imputation procedure to assign values when they were missing. See Appendix A, Section E, for more information on this procedure.
aThe average includes youth who were not employed during the year following random assignment.
*/**/***Impact estimate is significantly different from zero at the .10/.05/.01 level using either a two-tailed t-test or a chi-square test.

Interim Report on Broadened Horizons, Brighter Futures Chapter V: Impacts on Employment and Earnings
87
small impacts on job tenure and usual hours worked per week. BHBF also reduced the share of youth not employed and increased the shares employed in jobs with hourly wage rates of $7 or more, as well as in jobs without health insurance and paid leave benefits.
We defined the measures of job characteristics in a manner that allowed us to retain all sample members in the analysis, regardless of whether they had been employed for pay during the follow-up period.70
As shown in Table V.4, the average tenure in the primary paid job for youth in the treatment group was one month (all averages include values of zero for youth who did not work). We estimated that the average tenure would have been the same even if the youth had not had the opportunity to participate in the project. However, BHBF did significantly alter the distribution of tenure in the primary job by reducing the share of youth not employed and increasing the share employed for at least one month but no more than six months.
This maintained the integrity of the evaluation’s experimental design and allowed us to generate reliable estimates of whether the intervention resulted in better jobs for treatment group youth.
BHBF also had a significant impact on the distribution of usual hours worked per week in the primary job, by reducing the share of youth not employed and increasing the shares employed no more than 10 hours and more than 20 hours. Consistent with this finding, the project increased the average usual hours worked per week in the primary job by a statistically significant 2 hours. The project also had a statistically significant impact on the hourly wage associated with the primary job. It shifted the distribution of the hourly wage mainly by reducing the share of youth not employed and increasing the shares employed at several hourly wage categories, including the share earning between $7 and $9 per hour. The estimated impact on distribution of the hourly wage is statistically significant at the one percent level.
Very few treatment group members were employed in primary jobs that provided health insurance benefits (eight percent) or paid vacation or sick leave benefits (also eight percent). We found that BHBF shifted the distribution of health insurance benefits mainly by reducing the share of youth not employed and increasing the share employed in primary jobs that did not provide health insurance. The estimated impact of BHBF on the distribution of the availability of paid vacation or sick leave benefits was similar to that for health insurance coverage (namely, an increase in the share of youth employed in primary jobs that did not provide paid vacation or sick leave). Both of these estimates are statistically significant at the one percent level.
D. The Impact on Employment Was Consistent Across Subgroups
We investigated whether the impact of BHBF on employment varied with the baseline characteristics of youth. That investigation revealed that the impact on the primary outcome in the employment domain—the share of youth ever employed in paid jobs during the year after random assignment—was consistent across subgroups defined by random assignment cohort and baseline age, school attendance status, and paid work experience (Table V.5). Our estimates of the impacts of
70 Characteristics of the primary job are observed only for youth who were ever employed for pay during the year following random assignment. Since employed youth are a self-selected group, comparing the job characteristics of employed treatment group youth with those of employed control group youth would not provide unbiased estimates of the impacts of BHBF on job characteristics. Hence, to estimate impacts on job characteristics reliably, the analysis must maintain the experimental nature of the evaluation sample by using measures of job characteristics defined to include youth who were never employed as well as those who were ever employed.

Interim Report on Broadened Horizons, Brighter Futures Chapter V: Impacts on Employment and Earnings
88
Table V.5. Ever Employed in Paid Job During the First Year After Random Assignment, by Subgroup (percentages)
Treatment Group
Observed
Mean
Estimated Mean w/o
BHBF Impact P-Value
Treatment Group Size
Control Group Size
Random Assignment Cohort Before July 1, 2009 21.3 12.5 8.9 *** 0.01 268 227 On or after July 1, 2009 25.6 15.3 10.3 ** 0.05 135 107 (P-value of difference in impacts) 0.99
Age Younger than 18 at baseline 19.7 7.5 12.2 ** 0.05 77 68 Age 18 or older at baseline 23.6 14.9 8.6 *** 0.01 326 266 (P-value of difference in impacts) 0.48
School Attendance In school at baseline 20.2 12.7 7.5 ** 0.04 240 202 Not in school at baseline 26.9 14.7 12.2 *** 0.01 162 132 (P-value of difference in impacts) 0.51
Paid Work Experience Worked for pay in prior year 46.1 34.6 11.5 0.19 79 58 No work for pay in prior year 17.2 8.1 9.2 *** 0.00 324 275 (P-value of difference in impacts) 0.46
Source: YTD 12-month follow-up survey.
Notes: The sample includes all youth who completed the study’s 12-month follow-up survey. In the table, we report observed means or percentages for the treatment group, estimates of what the treatment group means or percentages would have been in the absence of BHBF, and regression-adjusted impact estimates (see Chapter II, Section A.4). We measured explanatory variables in the regression model before random assignment by using data from the study’s baseline survey and SSA administrative records. We calculated all statistics with sample weights to account for interview non-response. Survey item non-response may have resulted in smaller sample sizes, as indicated in the table.
*/**/***Impact estimate is significantly different from zero at the .10/.05/.01 level using a two-tailed t-test.
BHBF on paid employment for youth in all subgroups defined by these four characteristics are all positive (but not necessarily statistically significant), and the differences in the impact estimates for the subgroup pairs are not statistically significant.
The findings for the subgroups defined by paid work experience prior to random assignment are especially interesting. Our estimates reveal that the project had a statistically significant positive impact on employment only for youth who had not worked for pay in the year before random assignment. While the estimated impact on youth who had worked for pay in the year before random assignment is positive, it is not significantly different from zero. These findings suggest that BHBF was successful in engaging youth who had not worked in the year before random assignment in employment experiences that they would not have had in the absence of the intervention.
E. Descriptive Analysis of Job Characteristics and Job Search Activities
To provide context for the findings from the analysis of impacts on employment-related outcomes, we present descriptive information for the primary paid jobs held by treatment group youth during the follow-up period. Among youth in the treatment group who were employed in paid jobs at some time during the year following random assignment, the four most common types of
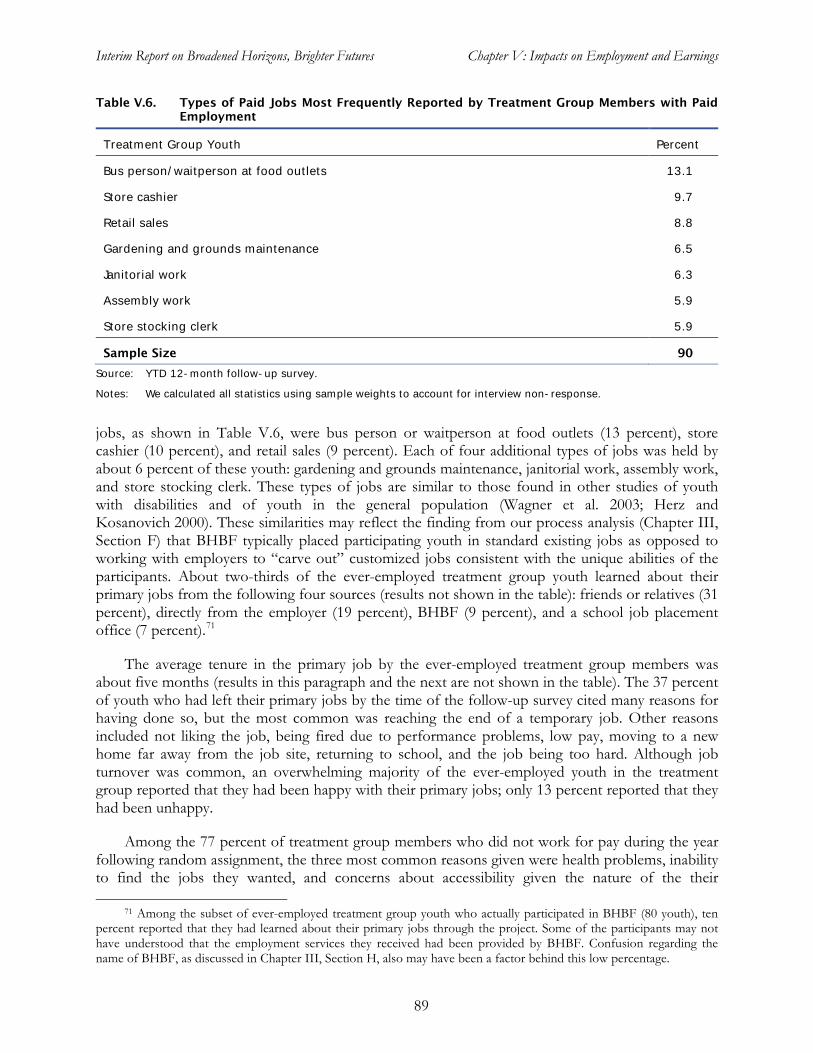
Interim Report on Broadened Horizons, Brighter Futures Chapter V: Impacts on Employment and Earnings
89
Table V.6. Types of Paid Jobs Most Frequently Reported by Treatment Group Members with Paid Employment
Treatment Group Youth Percent
Bus person/waitperson at food outlets 13.1
Store cashier 9.7
Retail sales 8.8
Gardening and grounds maintenance 6.5
Janitorial work 6.3
Assembly work 5.9
Store stocking clerk 5.9
Sample Size 90
Source: YTD 12-month follow-up survey.
Notes: We calculated all statistics using sample weights to account for interview non-response.
jobs, as shown in Table V.6, were bus person or waitperson at food outlets (13 percent), store cashier (10 percent), and retail sales (9 percent). Each of four additional types of jobs was held by about 6 percent of these youth: gardening and grounds maintenance, janitorial work, assembly work, and store stocking clerk. These types of jobs are similar to those found in other studies of youth with disabilities and of youth in the general population (Wagner et al. 2003; Herz and Kosanovich 2000). These similarities may reflect the finding from our process analysis (Chapter III, Section F) that BHBF typically placed participating youth in standard existing jobs as opposed to working with employers to “carve out” customized jobs consistent with the unique abilities of the participants. About two-thirds of the ever-employed treatment group youth learned about their primary jobs from the following four sources (results not shown in the table): friends or relatives (31 percent), directly from the employer (19 percent), BHBF (9 percent), and a school job placement office (7 percent).71
The average tenure in the primary job by the ever-employed treatment group members was about five months (results in this paragraph and the next are not shown in the table). The 37 percent of youth who had left their primary jobs by the time of the follow-up survey cited many reasons for having done so, but the most common was reaching the end of a temporary job. Other reasons included not liking the job, being fired due to performance problems, low pay, moving to a new home far away from the job site, returning to school, and the job being too hard. Although job turnover was common, an overwhelming majority of the ever-employed youth in the treatment group reported that they had been happy with their primary jobs; only 13 percent reported that they had been unhappy.
Among the 77 percent of treatment group members who did not work for pay during the year following random assignment, the three most common reasons given were health problems, inability to find the jobs they wanted, and concerns about accessibility given the nature of the their
71 Among the subset of ever-employed treatment group youth who actually participated in BHBF (80 youth), ten percent reported that they had learned about their primary jobs through the project. Some of the participants may not have understood that the employment services they received had been provided by BHBF. Confusion regarding the name of BHBF, as discussed in Chapter III, Section H, also may have been a factor behind this low percentage.

Interim Report on Broadened Horizons, Brighter Futures Chapter V: Impacts on Employment and Earnings
90
disabilities. These reasons for not working are very similar to those mentioned by a national cross-section of all SSA disability program beneficiaries in the 2006 National Beneficiary Survey (Livermore et al. 2009c). Additionally, among youth in the treatment group, 25 percent had not been involved in either paid employment or education/training in the year following random assignment and, of those, 38 percent reported that they had looked for work during the four weeks preceding the interview. Those who had looked for work indicated that their search typically involved checking job advertisements in a newspaper or on the Internet, asking friends or relatives about jobs, contacting employers directly, contacting the One-Stop Workforce Center, and seeking assistance from DVR.

91
VI. IMPACTS ON EDUCATION
Education is an investment that can improve employment opportunities and increase the potential for self-sufficiency. It is a key short-term outcome in the YTD evaluation conceptual framework (Figure I.1) and some YTD projects, including BHBF, provided education services. For BHBF, these services may have been particularly valuable because a substantial share of the population it aimed to serve was enrolled in school; almost 60 percent of treatment and control group youth were enrolled in school at baseline (see Table II.2). Although BHBF did not have an explicit goal of increasing educational attainment, the CEDS asked project participants about their education goals as part of person-centered planning. The CEDS then provided limited education services, including counseling, assistance with supportive services, enrollment assistance, and help preparing for IEP meetings. The project did not provide substantial education services; our process analysis of ETO data revealed that although BHBF provided education-related services to 84 percent of participants, among those who received education services the average amount of such services was just two hours (Table III.7).
In light of the age of youth in BHBF and the importance of completing high school, the primary outcome in the domain of educational progress for the impact analysis is either that a youth (1) was enrolled in an educational institution at any time during the year following random assignment, or (2) had completed high school by the time of the 12-month follow-up survey (including youth who had completed high school at baseline). High school completion includes attainment of a high school diploma, GED, or certificate of completion. We found that treatment group members were no more likely to have enrolled in school or completed high school than they would have been in the absence of BHBF. Examining the two components of this outcome separately, we found that the project did not have an impact on either school enrollment or high school completion.
A. BHBF Had No Impact on Education Outcomes
Consistent with the absence of explicit education-related goals in the project, we found that BHBF had no impact on education outcomes. Among treatment group youth, 82 percent either were enrolled in school during the year after random assignment or had completed high school by the time of the 12-month follow-up survey (Table VI.1). We estimated that the share either enrolled in school or having completed high school would have been about the same in the absence of BHBF.
Examining the two components of the primary education outcome separately, we found no impact of BHBF on school enrollment or high school completion. Fifty-six percent of treatment group youth were enrolled in school in the year following random assignment.72
72 For youth under the age of 18, education information was collected from the parent or guardian. Respondents
were asked to report any education or training activity and, for youth with such an activity, the type of school or training program. We coded youth as enrolled in an education program if the type of program was school, college, GED, adult education, or home schooling. Among treatment group youth in the analytic sample, 58 percent were enrolled in school at the time of the baseline survey (conducted prior to random assignment). In this same sample, a similar share of treatment group youth—56 percent—was enrolled in the year following random assignment. However, enrollment statistics from the baseline and follow-up surveys are not fully comparable. The baseline survey asked about enrollment at the time of the survey or, if the interview was conducted during a summer month, asked if the youth would be returning to school in the fall (if affirmative, the youth was considered to be enrolled). The follow-up survey asked about enrollment during the year since random assignment; if the interview was conducted during a summer month, it did not probe about fall enrollment.
We estimated that

Interim Report on Broadened Horizons, Brighter Futures Chapter VI: Impacts on Education
92
Table VI.1. Educational Progress (percentages)
Treatment Group
Observed
Mean
Estimated Mean w/o
BHBF Impact
P-Value
Primary Outcome
Ever enrolled in school in the year following random assignment or completed high school by the time of the 12-month follow-up survey 81.6 84.0 -2.5 0.37
Supplementary Outcomes
Ever enrolled in school in the year following random assignment 56.4 58.6 -2.2 0.49
Completed high school (attained high school diploma/GED/certificate or higher) 51.4 48.3 3.1 0.38
Type of School Attended 0.34 Did not attend school 43.7 41.8 1.8 Elementary/middle/regular high school 23.6 25.2 -1.6 Special high school for the disabled or home school 9.2 12.5 -3.3 Postsecondary institution 20.9 19.2 1.7 GED/adult continuing education 2.6 1.2 1.4
Intensity of Educational Activity Number of Months Enrolled in School 0.67
None 44.1 42.5 1.6 Less than nine months 16.5 19.1 -2.6 Nine to twelve months 39.4 38.3 1.0
Source: YTD 12-month follow-up survey.
Notes: The sample includes all youth who completed the study’s 12-month follow-up survey. The table reports observed means or percentages for the treatment group, estimates of what the treatment group means or percentages would have been in the absence of BHBF, and regression-adjusted impact estimates (see Chapter II, Section A.4). We measured explanatory variables in the regression model prior to random assignment using data from the study’s baseline survey and SSA administrative records. We calculated all statistics using sample weights to account for interview non-response. The analytic sample includes 404 treatment group youth and 334 control group youth. Survey item non-response may have resulted in smaller sample sizes for specific outcomes. See Appendix A, Table A.5, for the sample sizes for all outcomes.
*/**/***Impact estimate is significantly different from zero at the .10/.05/.01 level using either a two-tailed t-test or a chi-square test.
this would have been about the same in the absence of BHBF. Furthermore, 51 percent of treatment group youth had completed high school by the time of the follow-up survey.73
Forty-four percent of the treatment group members were not enrolled in school at some time during the year following random assignment; 24 percent attended an elementary, middle, or regular high school; 9 percent were either home schooled or attended a special high school for the disabled; 21 percent attended a postsecondary institution; and 3 percent attended a GED or adult continuing
We also estimated that this share would have been about the same in the absence of BHBF.
73 The baseline and follow-up surveys used the same question when asking about high school completion. At
baseline, 33 percent of the treatment group had completed high school (including having obtained a GED or certificate of completion).

Interim Report on Broadened Horizons, Brighter Futures Chapter VI: Impacts on Education
93
education program.74 We estimated that BHBF had no impact on the distribution of school type. We also found that BHBF had no impact on the distribution of the number of months that youth were enrolled in school.75
B. BHBF Had No Impact on Education for Key Subgroups
The impact of BHBF on education might be expected to vary across subgroups of youth. For example, the intervention might be expected to have had a greater impact for the early cohort of evaluation enrollees because, as discussed in Section H of Chapter III, project staff recorded the delivery of somewhat more education services to participants in this cohort than to those in the later cohort of enrollees. In addition, decisions and goals related to enrolling in school and high school completion may be different for youth who were younger, attended school at baseline, or worked in the year prior to baseline. We investigated whether the intervention had a significant impact on the primary outcome in the domain of educational progress—enrollment in an educational institution or completion of high school—for groups of youth defined by random assignment cohort and by baseline values of age, school attendance, and paid work experience.
We found no statistically significant impacts on the primary measure of educational progress for any of the subgroups we considered (Table VI.2). Furthermore, we found no statistically significant differences in the estimated impacts within the pairs of subgroups. We also separately examined the two components of the primary measure and found no statistically significant impacts on either enrollment in an educational institution or high school completion for any subgroup.76
74 For this measure, we created mutually exclusive categories by using only the most recently attended institution.
75 We calculated months of enrollment in school based on information in the follow-up survey on the start and end dates for attendance in each school attended during the year following random assignment. For the start and end dates, the survey gave no special instructions regarding how to report extended breaks in attendance, such as any summer break. For this reason, we do not separately measure the months of enrollment beyond nine months or calculate the average months of enrollment.
76 The difference in the estimated impacts of BHBF on school enrollment across subgroup pairs is statistically significant only for the pair defined by prior work experience (significant at the five percent level). The difference in the estimated impacts of BHBF on high school completion across subgroup pairs is not statistically significant for any pair.

Interim Report on Broadened Horizons, Brighter Futures Chapter VI: Impacts on Education
94
Table VI.2. School Enrollment or Completion of High School, by Subgroup (percentages)
Treatment Group
Observed
Mean
Estimated Mean w/o
BHBF Impact P-Value Treatment Group Size
Control Group Size
Random Assignment Cohort RA before July 1, 2009 82.7 85.4 -2.6 0.40 257 218 RA on or after July 1, 2009 79.4 81.6 -2.1 0.66 134 104 (P-value of difference in impacts) (0.84)
Age Under age 18 at baseline 86.3 89.7 -3.4 0.51 74 64 Age 18 or over at baseline 80.4 82.6 -2.2 0.48 317 258 (P-value of difference in impacts) (0.72)
School Attendance In school at baseline 92.8 94.2 -1.4 0.58 229 191 Not in school at baseline 65.7 69.7 -4.0 0.44 161 131 (P-value of difference in impacts) (0.95)
Paid Work Experience Worked for pay in prior year 86.2 86.6 -0.4 0.96 76 55 No work for pay in prior year 80.5 83.4 -2.9 0.33 315 266 (P-value of difference in impacts) (0.75)
Source: YTD 12-month follow-up survey.
Notes: The sample includes all youth who completed the study’s 12-month follow-up survey. The table reports observed means or percentages for the treatment group, estimates of what the treatment group means or percentages would have been in the absence of BHBF, and regression-adjusted impact estimates (see Chapter II, Section A.4). We measured explanatory variables in the regression model prior to random assignment using data from the study’s baseline survey and SSA administrative records. We calculated all statistics using sample weights to account for interview non-response. Survey item non-response may have resulted in smaller sample sizes, as indicated in the table.
*/**/***Impact estimate is significantly different from zero at the .10/.05/.01 level using a two-tailed t-test.

95
VII. IMPACTS ON YOUTH INCOME, SSA BENEFITS, AND RELATED OUTCOMES
Greater income for youth with disabilities is a critical indicator of success for the YTD initiative, as described in the conceptual framework (Figure I.1). This initiative is expected to increase income through greater earnings and, in the short run, greater benefits as a result of the special SSA waivers for YTD participants. BHBF had a significant positive impact on earnings in the short term (as discussed in Chapter V); also, in principle, the waivers would have allowed the project participants to retain more of their benefits at most levels of earnings, including zero countable earnings.77
The estimates presented in this chapter show that BHBF had statistically significant positive impacts on the amount of total youth income and the fraction of total income received in the form of earnings during the year following random assignment. The project also had a positive impact on the amount of SSA benefits received by youth during that year. In contrast, BHBF had no impacts on youth health insurance coverage and receipt of public assistance.
Through greater earnings and benefits, BHBF thus could have increased participants’ income during the year following random assignment.
A. BHBF Increased the Amount of Youth Income and the Fraction of Income from Earnings
BHBF had a positive impact on the primary outcome measure in the domain of youth income—total income from earnings and SSA disability benefits during the year following random assignment. We constructed this measure by combining earnings information from the 12-month follow-up survey with information on benefit amounts from SSA administrative records.78 The first row of Table VII.1 shows that, on average, youth in the treatment group had total income of $6,762 in the year following random assignment, which was $424 more than we estimated their average total income would have been in the absence of BHBF (a relative increase of seven percent).79
To enhance our understanding of the estimated impact on total annual income, we conducted supplementary analyses of the distribution of total annual income and the share of income from earnings. The results shown in Table VII.1 provide no evidence that BHBF had an impact on the distribution of total income. However, we found that the project had a positive impact on the fraction of total income from earnings. We estimated that, for treatment group youth, 12 percent of their total annual income came from earnings, which was 3 percentage points higher than it would have been in the absence of BHBF (a relative increase of 43 percent). This difference is statistically
The impact estimate is statistically significant at the ten percent level.
77 One of the SSA waivers for YTD expands access to the PASS. Income set aside for a specific goal under an
approved PASS is excluded from SSI countable income. The income need not be from earnings. The waivers are described in Appendix B.
78 We used monthly data on SSA benefits obtained from a special extract of the TRF data. For a detailed description of the TRF data, see Hildebrand et al. (2010).
79 As noted in Chapter II, Section A.4, for all estimated impacts presented in this chapter, we controlled for the amount of benefits received by the youth during the 12 months preceding the month of random assignment (along with the other control variables). Because total benefits during the year prior to random assignment correspond directly to the income and benefit outcomes during the year following random assignment, we included the former as a control to improve the precision of the impact estimator for the income and benefit outcomes.

Interim Report on Broadened Horizons, Brighter Futures Chapter VII: Impacts on Youth Income
96
Table VII.1. Youth Total Income
Treatment Group
Observed
Mean
Estimated Mean w/o
BHBF Impact
P-Value
Primary Outcome
Total annual income (earnings and SSA benefits) ($) 6,762 6,338 424 * 0.07
Supplementary Outcomes
Distribution of Total Annual Income (%) 0.54 Less than $5,000 25.8 25.3 0.5 $5,000 to less than $7,000 41.1 37.9 3.3 $7,000 to less than $10,000 23.4 28.2 -4.8 $10,000 or more 9.6 8.6 1.0
Percentage of total annual income from earnings 11.5 8.0 3.4 ** 0.03 Sources: YTD 12-month follow-up survey and SSA administrative records.
Notes: The sample includes all youth who completed the study’s 12-month follow-up survey. The table reports observed means or percentages for the treatment group, estimates of what the treatment group means or percentages would have been in the absence of BHBF, and regression-adjusted impact estimates (see Chapter II, Section A.4). We measured explanatory variables in the regression model prior to random assignment using data from the study’s baseline survey and SSA administrative records. We calculated all statistics using sample weights to account for interview non-response. The analysis sample includes 404 treatment group youth and 334 control group youth. Survey item non-response may have resulted in smaller sample sizes for specific outcomes. See Appendix A, Table A.5, for the sample sizes for all outcomes.
For all outcomes in this table, item non-response occurred conditionally in measuring the earnings component of total annual income, depending on the values of other measures in the follow-up survey. The rate of missing data in the annual earnings measure is 4.6 percent. We used a multiple imputation procedure to assign earnings when they were missing. See Appendix A, Section E, for more information on this procedure.
Youth who had no earnings or who did not receive SSA benefits during the year following random assignment were included in the computation of the values reported in this table.
*/**/***Impact estimate is significantly different from zero at the .10/.05/.01 level using either a two-tailed t-test or a chi-square test.
significant at the five percent level. Thus, along with increasing the total income received by youth who had been given the opportunity to participate, BHBF shifted the source of their income away from benefits and toward earnings.
The positive impact of BHBF on annual income was underpinned by an increase in the monthly income of youth in 8 of the 12 months during the year following random assignment. In Figure VII.1, we present average values of earnings plus SSA benefits for each month in the year following random assignment. The timelines in this figure show the average observed monthly income amounts for youth in the treatment group, as well as estimates of what their average monthly income amounts would have been if they had not had the opportunity to participate in BHBF. The vertical difference between the plotted timelines for any month represents the estimated impact of the intervention in that month. The impact estimates for months 5 through 12 are positive and significantly different from zero at least at the ten percent level, indicating that the project increased the average income of youth in those months.
Given the SSA waivers for YTD, we had no expectation that BHBF would reduce either the rate of receipt or the average amount of disability benefits in the near term, despite the project having increased earnings during the year following random assignment (as reported in Chapter V).

Interim Report on Broadened Horizons, Brighter Futures Chapter VII: Impacts on Youth Income
97
Figure VII.1. Youth Income by Month Following Random Assignment
Sources: YTD 12-month follow-up survey and SSA administrative records.
Notes: The sample includes all youth who completed the study’s 12-month follow-up survey. The figure presents observed means for the treatment group and estimates of what the treatment group means would have been in the absence of BHBF. We measured explanatory variables in the regression model prior to random assignment using data from the study’s baseline survey and SSA administrative records. We calculated all statistics using sample weights to account for interview non-response.
For all outcomes in this figure, item non-response occurred conditionally in measuring earnings, depending on the values of other measures in the follow-up survey. The rate of missing data in the monthly earnings measure ranges from 3.1 percent to 3.5 percent. We used a multiple imputation procedure to assign earnings when they were missing. See Appendix A, Section E, for more information on this procedure.
Youth who had no earnings or who did not receive SSA benefits in the indicated months were included in the computation of the values reported in this figure.
The impact estimates for months 5 through 12 are significantly different from zero at least at the .10 level.
In fact, we anticipated that the waivers would result in increased benefits in the short run, since they allow youth to keep more of their benefits while earning income through work. In Table VII.2, we show that the project had no impact on the share of youth who received any SSA benefits during the year following random assignment. The share of treatment group youth who received SSA benefits during the year (84 percent) may seem low in light of the fact that all youth in the research sample were on the SSA benefit rolls at baseline. However, not all of the youth were in current pay status at baseline. The share of treatment group members not receiving SSA benefits in each month in the year before random assignment ranged from 7 percent to 17 percent (Appendix A, Figure A.2).80
80 In Appendix A, we also provide the average SSA benefits by month in the year before and after random
assignment (Figure A.1 and Table A.10).
The most common reasons why research sample members (including those in the treatment group as well as those in the control group) were not in current pay status were cessation of disability and family income in excess of the allowable amount. These cases account for most of the research sample members who received no SSA benefits during the year following random assignment.
Treatment Group Treatment Group w/o BHBF (est.)

Interim Report on Broadened Horizons, Brighter Futures Chapter VII: Impacts on Youth Income
98
Table VII.2. Receipt and Amount of SSA Benefits (percentages, unless otherwise noted)
Treatment Group
Observed
Mean
Estimated Mean w/o
BHBF Impact P-Value
Supplementary Outcomes
Receipt of SSA Benefits (SSI, DI, or CDB) Any benefit receipt during the year following
random assignment 83.9 83.6 0.3 0.87 Number of months of benefit receipt during
the year following random assignment 9.5 8.9 0.6 ** 0.01
Annual Benefit Amount Distribution of annual benefit amount 0.22
None 16.1 16.8 -0.7 $1 to $6,500 24.2 27.9 -3.7 More than $6,500 to $8,000 50.4 48.2 2.3 More than $8,000 9.3 7.1 2.1
Average annual benefit amount ($)a 5,766 5,455 312 ** 0.04 Source: SSA administrative records.
Notes: The sample includes all youth in the research sample less nine youth identified as deceased at the time of the 12-month follow-up survey. The table reports observed means or percentages for the treatment group, estimates of what the treatment group means or percentages would have been in the absence of BHBF, and regression-adjusted impact estimates (see Chapter II, Section A.4). We measured explanatory variables in the regression model prior to random assignment using data from the study’s baseline survey and SSA administrative records. The sample includes 454 treatment group youth and 396 control group youth.
aThe average includes youth who did not receive benefits during the year following random assignment.
*/**/***Impact estimate is significantly different from zero at the .10/.05/.01 level using either a two-tailed t-test or a chi-square test.
In Table VII.2, we also show that treatment group youth received SSA disability program benefits for an average of ten months of the year following random assignment.81
We found that the positive impact of BHBF on the annual disability benefit amount reflects an increase in the benefits received by treatment group members in 9 of the 12 months following random assignment. Figure VII.2 depicts the average benefit amount received by youth in each
We estimated that they received benefits for 0.6 more months than they would have in the absence of BHBF (a relative increase of seven percent). This difference is statistically significant at the five percent level. Furthermore, we estimated that the intervention had a positive impact on the annual benefit amount. On average, treatment group members received $5,766 in benefits during the follow-up year, which we estimated to be $312 more than what they would have received in the absence of the project (a relative increase of six percent). The difference is statistically significant at the five percent level. To flesh out this finding, we analyzed the distribution of the annual benefit amount, but found no statistically significant impact of BHBF.
81 In Table VII.2, we report the estimated impacts on receipt and amount of SSA benefits for the full research
sample. We also estimated impacts for the analytic sample (youth in the research sample who completed the study’s 12-month follow-up survey), and found that the points estimates are not very different from those for the full research sample. However, the estimated impacts on the number of months of benefit receipt and the annual benefit amount are not statistically significant for the analytic sample, which may reflect the smaller size of the analytic sample. Appendix A, Table A.9, provides benefit impact estimates for both samples.

Interim Report on Broadened Horizons, Brighter Futures Chapter VII: Impacts on Youth Income
99
Figure VII.2. SSA Benefit Amount by Month Following Random Assignment
Source: SSA administrative records.
Notes: The sample includes all youth in the research sample less nine youth identified as deceased at the time of the 12-month follow-up survey. The figure presents observed means for the treatment group and estimates of what the treatment group means would have been in the absence of BHBF. We measured explanatory variables in the regression model prior to random assignment using data from the study’s baseline survey and SSA administrative records.
Youth who did not receive SSA benefits in the indicated months were included in the computation of the values reported in this figure.
The impact estimates for months 4 through 12 are significantly different from zero at least at the .10 level.
month during the year following random assignment. Impacts are represented in the figure by the difference between the average benefit received by treatment group members and our estimate of what would have been the average benefit in the absence of the project. We found that the estimated impacts for months 4 through 12 are positive and significantly different from zero at least at the ten percent level, indicating that the project increased the amount of benefits received by youth in those months.82, 83
82 The Social Security benefit amount is the only outcome for which we have monthly values for the period before
random assignment. The differences in the average monthly benefit amount between the treatment and control groups during the year prior to random assignment are small (about 7 percent) but statistically significant in months 2, 3, 6, 7, and 8 before the month of random assignment (see Appendix A, Section F). As explained above in Section A, we controlled for the total amount of benefits received during the 12 months prior to random assignment in all impact analyses presented in this chapter.
83 The analysis of monthly benefit amounts presented in Figure VII.2 is based on the evaluation’s research sample—the sample of all youth who were randomly assigned. In contrast, the analyses of monthly earnings and income presented in Figures V.4 and VII.1, respectively, are based on the evaluation’s analysis sample—the sample of youth who were randomly assigned and who also responded to the 12-month follow-up survey. Because of these different samples, these results are not necessarily additive, despite the fact that we defined income to equal earnings plus benefits. In other words, because of the different samples, the earnings results in Figure V.4 and the benefit results in Figure VII.2 do not necessarily sum to the income results in Figure VII.1.
Treatment Group Treatment Group w/o BHBF (est.)
Interim Report on Broadened Horizons, Brighter Futures Chapter VII: Impacts on Youth Income
100
B. BHBF Had Little Impact on the Use of SSA Work Incentives
Treatment group youth who enrolled in BHBF had the opportunity to use the five SSA waivers for YTD (see Appendix B for a description of these waivers).84
We found that BHBF did not increase the use of the collective SSA work incentives under consideration during the year following random assignment. Table VII.3 shows that 28 percent of treatment group youth used at least one of the five work incentives.
Since each of the waivers enhanced an SSA work incentive available to the control group, we were able to analyze the impact of BHBF on use of the specific incentives. The treatment group youth may have been more likely to use these work incentives than if they had not had the opportunity to participate in BHBF because the project provided intensive benefits counseling, which led to increased awareness of the SSA work incentives (as discussed in Chapter IV). Additionally, the greater generosity of the waivers for YTD relative to the standard SSA work incentives may have encouraged treatment group youth to make more use of the incentives. Using data from SSA administrative records, we constructed five supplementary outcome measures that captured the use of each incentive (namely, the EIE, SEIE, Section 301 waiver, PASS, and IDAs). We also constructed a composite outcome measure of the use of any of these work incentives.
85 We estimated that these youth would have had a 26 percent overall rate of use of work incentives if they had not been given the opportunity to participate in the project. The difference of two percentage points is not statistically significant at the ten percent level.86
We also found that BHBF had a statistically significant impact on the use of just one of the five individual work incentives, the EIE. The project increased the use of this incentive by 4 percentage points (to 11 percent).
The 28 percent rate of use of work incentives by treatment group members appears to be consistent with 14 percent of them having reported earnings to SSA and 18 percent having used the Section 301 waiver, which is not contingent on employment or earnings.
87 It had no significant impacts on use of the SEIE,88 the Section 301 waiver,89
84 Some of the SSA work incentives are applied automatically to disability program beneficiaries who meet the
criteria for receiving the incentives: the EIE applies automatically to all SSI beneficiaries, and the Section 301 waiver applies automatically to youth participating in BHBF. For these work incentives, we apply the term "use" of SSA work incentives loosely to indicate that youth were benefitting from them.
or on PASS and IDA take-up rates. Benefits planning services provided by BHBF may have helped some treatment group members avoid negative age-18 redeterminations, thus obviating their need to use the Section 301 waiver. The PASS and IDAs are rarely used by the broader beneficiary population and this was also the case for the BHBF evaluation enrollees.
85 We provide statistics on the use of YTD waivers by BHBF participants in Table III.5. 86 The estimated impact on the overall use of SSA work incentives for youth who completed the study’s 12-month
follow-up survey is similar to that for the full research sample in BHBF. In Table A.9, we provide work incentive impact estimates for both samples.
87 Among BHBF evaluation enrollees who reported any earnings to SSA, 61 percent of both treatment and control group members used the EIE
88 Among BHBF evaluation enrollees who reported any earnings to SSA, 16 percent of treatment group members and 13 percent of control group members used the SEIE.
89 Nineteen percent of control group youth used the Section 301 waiver (Appendix A, Table A.5). Among the control group youth who used the Section 301 waiver, 66 percent were enrolled in school at baseline (results not shown). Thus, it is likely that a majority of control group youth who qualified for this incentive did so by being enrolled in an educational institution and receiving services under the Individuals with Disabilities Education Act.

Interim Report on Broadened Horizons, Brighter Futures Chapter VII: Impacts on Youth Income
101
Table VII.3. Use of SSA Work Incentives (percentages)
Treatment Group
Observed
Mean Estimated Mean
w/o BHBF Impact P-Value
Supplementary Outcomes
Use of SSA Work Incentives Used at least one SSA work incentive 28.2 26.2 2.0 0.48 Used the SEIE 2.4 1.4 1.0 0.31 Used the EIE 11.0 6.9 4.1 ** 0.04 Used the Section 301 waiver 17.6 18.7 -1.1 0.64 Established a PASSa 0.0 0.0 0.0 1.00 Opened an IDAa 0.4 0.0 0.4 0.19
Reported any earnings to SSA 14.1 8.8 5.3 ** 0.02 Source: SSA administrative records.
Notes: The sample includes all youth in the research sample less six youth identified as deceased at the time of the 12-month follow-up survey. The table reports observed means or percentages for the treatment group, estimates of what the treatment group means or percentages would have been in the absence of BHBF, and regression-adjusted impact estimates (see Chapter II, Section A.4). We measured explanatory variables in the regression model prior to random assignment using data from the study’s baseline survey and SSA administrative records. The sample includes 454 treatment group youth and 396 control group youth.
aSince no control group member used this work incentive, we could not do regression-adjusted impact analysis. We present the impact estimate from a simple comparison of means.
*/**/***Impact estimate is significantly different from zero at the .10/.05/.01 level using a two-tailed t-test.
Finally, we examined whether BHBF had an impact on the share of youth reporting earnings to SSA. As previously noted, 14 percent of treatment group youth reported earnings to SSA. We estimated that the share would have been only 9 percent in the absence of BHBF. The estimated impact of 5 percentage points is statistically significant at the 5 percent level. While 23 percent of treatment group youth reported in the follow-up survey that they had been employed for pay during the year following random assignment, only 14 percent of them reported any earnings to SSA. The lower share of youth reporting earnings to SSA may have been due to the reporting requirements for SSA beneficiaries: The first $65 of earnings each month (or $85 if the beneficiary receives no unearned income) are automatically excluded from SSI benefit calculations and thus beneficiaries are not required to report earnings at or below these levels.
C. BHBF Had No Impacts on Health Insurance Coverage or Receipt of Public Assistance
To understand whether BHBF affected broader indicators of the economic status of the youth in the study and their households, we analyzed measures of health insurance coverage and receipt of public assistance at the time of the 12-month follow-up survey. Looking first at self-reported health insurance coverage, we found that 86 percent of the treatment group youth were covered by public health insurance (Table VII.4). We estimated that, in the absence of the project, the public health insurance coverage rate would have been similar, indicating that the project had no impact on public health insurance coverage for youth. Although all SSI recipients in Florida are eligible for Medicaid (and DI and CDB recipients are eligible for Medicare), some youth may not have been covered by public health insurance at the time of the follow-up survey because they were not receiving SSA benefits at that time: 21 percent of treatment group youth (and 26 percent of control group youth) were not receiving benefits in month 12 after random assignment (see Appendix A, Figure A.2, and related discussion).
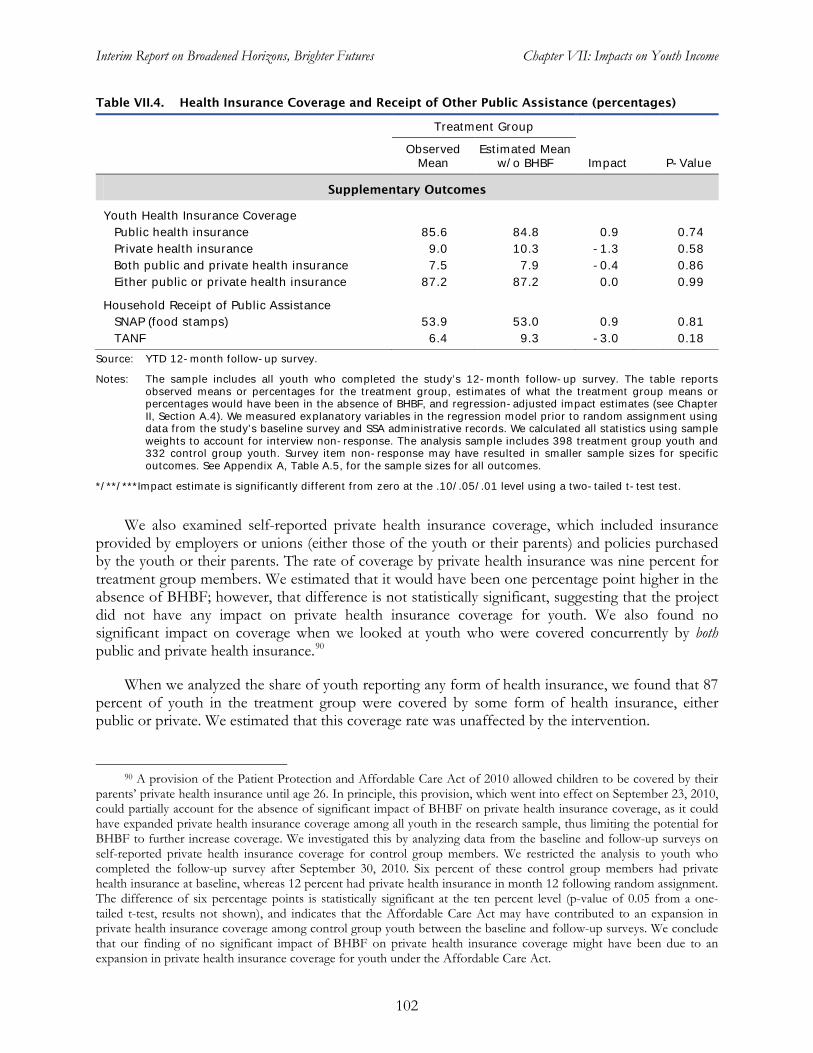
Interim Report on Broadened Horizons, Brighter Futures Chapter VII: Impacts on Youth Income
102
Table VII.4. Health Insurance Coverage and Receipt of Other Public Assistance (percentages)
Treatment Group
Observed
Mean Estimated Mean
w/o BHBF Impact P-Value
Supplementary Outcomes
Youth Health Insurance Coverage Public health insurance 85.6 84.8 0.9 0.74 Private health insurance 9.0 10.3 -1.3 0.58 Both public and private health insurance 7.5 7.9 -0.4 0.86 Either public or private health insurance 87.2 87.2 0.0 0.99
Household Receipt of Public Assistance SNAP (food stamps) 53.9 53.0 0.9 0.81 TANF 6.4 9.3 -3.0 0.18
Source: YTD 12-month follow-up survey.
Notes: The sample includes all youth who completed the study’s 12-month follow-up survey. The table reports observed means or percentages for the treatment group, estimates of what the treatment group means or percentages would have been in the absence of BHBF, and regression-adjusted impact estimates (see Chapter II, Section A.4). We measured explanatory variables in the regression model prior to random assignment using data from the study’s baseline survey and SSA administrative records. We calculated all statistics using sample weights to account for interview non-response. The analysis sample includes 398 treatment group youth and 332 control group youth. Survey item non-response may have resulted in smaller sample sizes for specific outcomes. See Appendix A, Table A.5, for the sample sizes for all outcomes.
*/**/***Impact estimate is significantly different from zero at the .10/.05/.01 level using a two-tailed t-test test.
We also examined self-reported private health insurance coverage, which included insurance provided by employers or unions (either those of the youth or their parents) and policies purchased by the youth or their parents. The rate of coverage by private health insurance was nine percent for treatment group members. We estimated that it would have been one percentage point higher in the absence of BHBF; however, that difference is not statistically significant, suggesting that the project did not have any impact on private health insurance coverage for youth. We also found no significant impact on coverage when we looked at youth who were covered concurrently by both public and private health insurance.90
When we analyzed the share of youth reporting any form of health insurance, we found that 87 percent of youth in the treatment group were covered by some form of health insurance, either public or private. We estimated that this coverage rate was unaffected by the intervention.
90 A provision of the Patient Protection and Affordable Care Act of 2010 allowed children to be covered by their
parents’ private health insurance until age 26. In principle, this provision, which went into effect on September 23, 2010, could partially account for the absence of significant impact of BHBF on private health insurance coverage, as it could have expanded private health insurance coverage among all youth in the research sample, thus limiting the potential for BHBF to further increase coverage. We investigated this by analyzing data from the baseline and follow-up surveys on self-reported private health insurance coverage for control group members. We restricted the analysis to youth who completed the follow-up survey after September 30, 2010. Six percent of these control group members had private health insurance at baseline, whereas 12 percent had private health insurance in month 12 following random assignment. The difference of six percentage points is statistically significant at the ten percent level (p-value of 0.05 from a one-tailed t-test, results not shown), and indicates that the Affordable Care Act may have contributed to an expansion in private health insurance coverage among control group youth between the baseline and follow-up surveys. We conclude that our finding of no significant impact of BHBF on private health insurance coverage might have been due to an expansion in private health insurance coverage for youth under the Affordable Care Act.

Interim Report on Broadened Horizons, Brighter Futures Chapter VII: Impacts on Youth Income
103
BHBF had no impact on the receipt of public assistance, despite the fact that its benefits counselors tried to connect participants and their families to additional public assistance for which they were eligible. Table VII.4 shows that 54 percent of treatment group members lived in households that received SNAP benefits during the year following random assignment, and 6 percent lived in households that received TANF. We found no statistically significant evidence that the intervention influenced these measures of public assistance receipt.
D. BHBF’s Impact on Youth Income Did Not Vary by Subgroup
The impact of BHBF on the primary outcome in the income domain—the amount of total annual income for youth—did not differ significantly within any of four pairs of subgroups (Table VII.5). We estimated the impacts of BHBF on youth total income for the same subgroup pairs as in our analyses of the other outcome domains, defined by random assignment cohort and baseline values of age, school attendance, and paid work experience. Table VII.5 shows that the project had a statistically significant positive impact on youth income for two of the eight subgroups considered: the earlier random assignment cohort and youth under the age of 18. For the other six subgroups, BHBF had positive but statistically insignificant impacts. We found no statistically significant differences in the estimated impacts within any of the four pairs of subgroups.
Table VII.5. Youth Total Income—Earnings and SSA Benefits, by Subgroup ($)
Treatment Group
Observed
Mean
Estimated Mean w/o
BHBF Impact
P-Value
Treatment Group Size
Control Group Size
Random Assignment Cohort Before July 1, 2009 6,986 6,466 520 ** 0.03 269 227 On or after July 1, 2009 6,339 6,098 241 0.60 135 107 (P-value of difference in impacts) (0.58)
Age Under age 18 at baseline 7,127 6,145 982 ** 0.02 78 68 Age 18 or over at baseline 6,672 6,388 284 0.28 326 266 (P-value of difference in impacts) (0.16)
School Attendance In school at baseline 6,909 6,548 360 0.20 241 202 Not in school at baseline 6,558 6,037 521 0.17 162 132 (P-value of difference in impacts) (0.73)
Paid Work Experience Worked for pay in prior year 7,590 6,558 1,031 0.15 79 58 No work for pay in prior year 6,565 6,240 325 0.15 325 275 (P-value of difference in impacts) (0.34)
Sources: YTD 12-month follow-up survey and SSA administrative records.
Notes: The sample includes all youth who completed the study’s 12-month follow-up survey. The table reports observed means or percentages for the treatment group, estimates of what the treatment group means or percentages would have been in the absence of BHBF, and regression-adjusted impact estimates (see Chapter II, Section A.4). We measured explanatory variables in the regression model prior to random assignment using data from the study’s baseline survey and SSA administrative records. We calculated all statistics using sample weights to account for interview non-response.
For all outcomes in this table, item non-response occurred conditionally in measuring earnings, depending on the values of other measures in the follow-up survey. The rate of missing data in various subgroups in the table ranges from 3.8 percent to 6.2 percent. We used a multiple imputation procedure to assign earnings when they were missing. See Appendix A, Section E, for more information on this procedure.
*/**/***Impact estimate is significantly different from zero at the .10/.05/.01 level using a two-tailed t-test.

105
VIII. IMPACTS ON ATTITUDES AND EXPECTATIONS
BHBF, like all of the YTD projects, sought to provide youth who had disabilities with services and experiences that would instill in them a belief in their ability to succeed in life. The conceptual framework for the YTD evaluation (Figure I.1) thus posits near-term improvements in youths’ expectations for their futures and sense of self-efficacy. BHBF in particular sought to promote independence and self-sufficiency among participants through person-centered planning. The project’s service model featured early discussions of a participant’s overall goals, including education, employment, and other milestones. The project also offered life skills training focused on goal setting, decision making, time management, interpersonal and social skills, self-esteem, managing relationships, and addressing physical and mental health issues (Chapter III).
The overarching objective of the YTD initiative was to promote economic self-sufficiency and independence. Accordingly, we specified the primary outcome in the domain of “attitudes and expectations” as whether a youth’s goals included working and earning enough money to stop receiving Social Security disability benefits. The supplementary outcomes in this domain include additional measures of youth expectations and self-determination. If BHBF was successful in empowering youth and fostering positive expectations, we should anticipate that treatment group members would demonstrate greater independence in daily activities, decision making, and social interactions. The supplementary outcomes thus also include measures of independence and social interactions.
We might expect attitudes and expectations to be more malleable and subject to influence by BHBF than many of the other outcome measures considered in this report. In particular, employment and income might be slow to respond to the intervention, given that about one-fifth of the youth in the analytic sample were under age 18 at baseline, and almost 60 percent were attending school. Finding positive impacts on attitudes and expectations could foreshadow positive impacts on these and perhaps other outcomes in the longer run.
Attitudes and expectations are difficult to measure, however. Responses to survey questions on these topics are clearly subjective, and research on the stability of self-reports indicates that the same person answering on different days may respond differently.91
In addition, with respect to the primary outcome, it is possible for an intervention that provides benefits counseling or paid work experience to have an unintentional adverse impact on whether a youth’s goals included working and earning enough money to stop receiving disability benefits. To the extent that a YTD project increased awareness that working and receiving earnings may not eliminate a youth’s entire cash benefit and eligibility for medical insurance, this awareness may result
In addition, youth may feel pressure to respond in a way they think is expected or socially accepted. Due to the difficulty in accurately measuring attitudes and expectations, some studies find no impacts on these measures, even when an objective outcome of interest (such as employment) shows an impact. The YTD follow-up survey was designed to include the best available measures used in other surveys. Nevertheless, even with widely used measures, the concepts of self-efficacy and future expectations are difficult to measure.
91 Research finds evidence of low to moderate stability in self-reports of social skills (Gresham and Elliott 1990)
and self-concept (Marsh 1983). Also, for youth with developmental disabilities, stability likely would be lower. Stability is related to cognitive rather than chronological age. Younger children have more difficulty in differentiating discrete areas of self-worth (Harper 1990).
Interim Report on Broadened Horizons, Brighter Futures Chapter VIII: Impacts on Attitudes and Expectations
106
in fewer youth agreeing that their goals include working and earning enough to stop receiving disability benefits. However, as we showed in Chapter IV, BHBF did not improve understanding that the entire cash benefit and medical insurance would not be lost once work begins (Table IV.3).
Although BHBF emphasized youth independence and self-sufficiency, we found no impact on our primary measure of attitudes and expectations—youth goals for future work and earnings. We also found no pattern of impacts on supplementary outcomes in this domain. The absence of impacts is perhaps surprising, as our process analysis of BHBF found that almost all participants developed person-centered plans, and the planning process specifically involved setting goals and making plans to achieve those goals. However, the process analysis also noted that this component tended to be emphasized early in a youth’s participation in BHBF, but often received little subsequent attention. In addition, the degree to which self-determination was emphasized varied across project staff members (Chapter III, Section F). We caution that the lack of estimated impacts may reflect the difficulty of measuring these outcomes precisely.
A. BHBF Had No Impact on Goals for Future Work and Earnings
Our primary outcome measure in the domain of attitudes and expectations is goals for future work and earnings. This measure is based on youth responses to the statement in the follow-up survey, “Your personal goals include someday working and earning enough to stop receiving Social Security disability benefits.” 92 This is particularly relevant to the YTD evaluation because it measures whether youths’ goals align with the goal of the YTD initiative for youth to maximize their economic self-sufficiency.93
We found no impact on goals for future work and earnings. Among youth in the treatment group, 70 percent agreed with the statement that their goals included working and earning enough to stop receiving disability benefits (Table VIII.1).
94
92 Youth were asked to respond to this statement in one of four categories: “agree a lot,” “agree a little,” “disagree
a little,” and “disagree a lot.” We combined the first two categories to create a measure of whether the youth agreed with the statement. As a robustness check, we verified that there were no impacts of BHBF on the share of youth responding “agree a lot” or on the distribution of responses across all four categories
In the absence of BHBF, we estimated that 72 percent of those youth would have agreed with the statement. The estimated impact of negative two percentage points is not statistically significant. As discussed in the introduction to this chapter, BHBF could have had an unintentional negative impact by increasing awareness that benefits do not cease when paid work begins. Because the impact estimate is not statistically significant, we conclude that there is no evidence of an unintentional negative impact. However, the lack of an impact on this outcome may reflect a combination of a positive impact on some youth and an unintended negative impact on others.
93 Information on most of the measures of attitudes and expectations reported in this section were collected from youth only. In particular, responses to the primary measure and locus of control measures were not asked of parents (or guardians). The three expectations measures (regarding independent living, employment, and education) were asked of both parents and youth. For these three measures, we report both youth and parent responses in Table VIII.1.
94 Information on plans for the future and self-efficacy was missing for a large share of cases—roughly 23 to 26 percent for youth responses and up to 29 percent for parent responses. For youth responses, missing information for many cases occurred due to skip patterns in the survey for proxy respondents: 18 percent of youth had a proxy respondent for the follow-up survey, and most of the proxy respondents were parents of the youth. Regarding plans for the future, proxy respondents who were parents provided information for the parent response only and proxy respondents who were not parents provided information for the youth response only. For self-efficacy, proxy respondents were not asked to provide any information. For parent responses, missing information mainly occurred when the parent (or guardian) was unavailable to respond to the survey.

Interim Report on Broadened Horizons, Brighter Futures Chapter VIII: Impacts on Attitudes and Expectations
107
Table VIII.1. Expectations and Self- Efficacy (percentages, unless otherwise noted) Treatment Group
Observed
Mean
Estimated Mean w/o
BHBF Impact P-Value
Primary Outcome
Youth agrees that personal goals include working and earning enough to stop receiving Social Security disability benefits 70.1 72.2 -2.2 0.59
Supplementary Outcomes
Plans and Goals for the Next Five Years
Plans to go further in school, youth response 78.3 80.5 -2.2 0.53
Plans to go further in school, parent response 67.1 72.5 -5.4 0.17
Expectations for Employment, Youth Responsea 0.18 Working for pay at the time of the follow-up survey 9.5 8.4 1.1 Plans to start working for pay 79.0 74.6 4.4 No plans to start working for pay 11.5 17.0 -5.5
Expectations for Employment, Parent Responsea 0.23 Working for pay at the time of the follow-up survey 9.5 8.5 1.0 Plans to start working for pay 70.5 65.9 4.5 No plans to start working for pay 20.0 25.6 -5.6
Plans to live on own (with or without help), youth response 67.7 63.9 3.7 0.33
Plans to live on own (with or without help), parent response 36.5 28.2 8.3 ** 0.03
Internal locus of control (4-point index)b 3.3 3.2 0.1 0.25
External locus of control (4-point index)b 2.6 2.5 0.1 0.21 Source: YTD 12-month follow-up survey.
Notes: The sample includes all youth who completed the study’s 12-month follow-up survey. The table reports observed means or percentages for the treatment group, estimates of what the treatment group means or percentages would have been in the absence of BHBF, and regression-adjusted impact estimates (see Chapter II, Section A.4). We measured explanatory variables in the regression model prior to random assignment using data from the study’s baseline survey and SSA administrative records. We calculated all statistics using sample weights to account for interview non-response. The analytic sample includes 404 treatment group youth and 334 control group youth. Survey item non-response may have resulted in smaller sample sizes for specific outcomes. See Appendix A, Table A.5, for the sample sizes for all outcomes.
aFor these outcomes, item non-response occurred conditionally, depending on the values of other measures in the follow-up survey. The rate of missing information was 25.6 percent for youth responses on employment expectations and 29.4 percent for parent responses. We used a multiple imputation procedure to assign values when they were missing. See Appendix A, Section E, for more information on this procedure. bSee text for further discussion of the measures of internal and external locus of control.
*/**/***Impact estimate is significantly different from zero at the .10/.05/.01 level using either a two-tailed t-test or a chi-square test.
We also found no effects of BHBF on supplementary measures of youth expectations and plans for the five years after the follow-up survey. These measures capture whether youth expected to (1) go further in school, (2) start or continue working for pay, and (3) live on their own (as opposed to living with parents or guardians). At baseline, 89 percent of treatment group youth reported that they planned to go further in school in the next five years (Table II.2).95
95 For most outcome measures, we do not have similar measures at baseline. However, the baseline and follow-up
survey used similar questions to ask about plans for the next five years for further schooling, working for pay, and living independently. The biggest difference between the surveys was that the follow-up survey did not ask youth who were
In the follow-up survey, a
(continued)
Interim Report on Broadened Horizons, Brighter Futures Chapter VIII: Impacts on Attitudes and Expectations
108
smaller share, 78 percent, reported that they planned to go further in school in this time period (Table VIII.1). The reduction in the share with plans for further schooling may reflect that some youth attained their education goals during the year (or more) between the surveys. We estimated that BHBF had no impact on educational goals—in the absence of the project, an estimated 81 percent of treatment group youth would have reported in the follow-up survey that they planned to go further in school (the difference of 2 percentage points is not statistically significant). Twelve percent of treatment group youth reported no plans to work for pay in the five years after the follow-up survey (the baseline share was ten percent). We estimated that, in the absence of BHBF, a somewhat larger share would have reported that they had no plans for future paid work, but the impact estimate is not statistically significant. Finally, 68 percent of treatment group youth reported plans to live independently in the future with or without help (this is almost identical to the 69 percent share at baseline). We estimated that the share would have been about the same in the absence of BHBF.
We did find an impact of BHBF on parent responses about youth plans for living independently. Thirty-seven percent of parents of treatment group members reported that their children had plans to live independently (with or without assistance). In the absence of BHBF, we estimated that this share would have been lower: 28 percent. Although the estimated impact is statistically significant at the five percent level, it is possible that it is spurious. Because we planned to analyze a large number of supplementary outcomes across all the domains for the impact analysis, we expected to find some statistically significant estimates due to random chance. Furthermore, we found no impacts of BHBF on parent responses about other types of youth expectations—their plans for further education and employment. Because we found no pattern of positive or negative impacts on youth expectations or plans, whether reported by the youth or their parents, we conclude that BHBF had no substantial impacts on this set of outcomes related to future plans.
To investigate the effects of the intervention on youths’ feelings of self-efficacy, we created composite measures from a series of questions in the follow-up survey. The self-efficacy measures are based on a battery of questions that includes the Pearlin Mastery Scale (Pearlin and Schooler 1978). After analyzing the degree of correlation between these measures and the concepts measured, we determined that the measures could be combined into an “internal locus of control” and an “external locus of control.” See Appendix A, Section H, for further information on these measures.
In this evaluation, the internal locus of control reflects whether youth believe their life outcomes result primarily from their own behaviors and actions. The average value of this index for treatment group youth was 3.3 on a scale of 1 to 4, and we estimated that, in the absence of BHBF, the average would have been the about the same. The external locus of control reflects the degree to which youth believe that others, fate, or chance primarily determine their life outcomes. The average value of this index for treatment group youth was 2.6, also on a scale of 1 to 4. We estimated that these youth would have had essentially the same average value even if they had not been given the opportunity to participate in BHBF.96
(continued) working full time about plans for work. For this reason, for comparison between baseline and follow-up, we examined the share with no plans to work for pay, which is more comparable between the surveys. For our impact analysis of plans for future work based on the follow-up survey, we created a separate category, “working for pay at the time of the follow-up survey” (Table VIII.1).
96 Appendix A, Section H, presents separate impact estimates for each of the 11 questions used to create the two indices of self-efficacy. These additional estimates suggest that BHBF had impacts on several of the components of the indices of self-efficacy.

Interim Report on Broadened Horizons, Brighter Futures Chapter VIII: Impacts on Attitudes and Expectations
109
B. BHBF Had No Impacts on Independence, Decision Making, and Social Interactions
In principle, a belief by youth that they can succeed in life could lead them to display more independence in daily activities, play a bigger part in decision making, and engage in higher levels of social interaction. We examined measures of these outcomes as a supplementary analysis in the attitudes and expectations domain. However, the previous finding of no impact of BHBF on self-efficacy suggests that the project was unlikely to have had impacts on these additional measures, even though it provided participants with life skills training designed to influence these outcomes.
Consistent with our finding of no impact on self-efficacy, we found no statistically significant impacts of BHBF on independent activities, decision making, or social interactions (Table VIII.2).97 We found that 82 percent of treatment group youth made snacks on their own, 56 percent rode public transportation alone, and 88 percent picked the clothes they wore each day. Seventy-two percent of treatment group members decided how to spend their own money, and 83 percent decided how to spend their free time. Sixty-six percent of treatment group youth reported that they got together with friends “to have fun or hang out.” We estimated that none of these percentages would have been significantly different in the absence of BHBF.98
C. BHBF Had No Impact on Goals for Future Work and Earnings for Any Subgroup
Although BHBF had no impact on the primary outcome in the domain of attitudes and expectations—goals for future work and earnings—for the entire target population, it nevertheless could have had impacts for certain subgroups. For example, the goals for work and earnings of youth who had not worked for pay in the year prior to random assignment might have been more malleable than those who did have work experience. Accordingly, we estimated the impacts of BHBF on the primary outcome measure in this domain for the four pairs of subgroups of the target population defined by random assignment cohort, baseline age, school attendance, and paid work experience. We found that the estimated impacts are not statistically significant for these subgroups and do not vary significantly across the subgroups within each pair (Table VIII.3).
97 We collected the measures of independence in daily activities, decision making, and social interaction from youth
only. For the first five measures in Table VIII.2, we asked youth how often they do the activity by themselves. We combined “most of the time” and “some of the time” into a single category, which we interpreted as being indicative of the youth doing the activity on their own. The alternative response was “none of the time.” For social interaction, youth were asked how often they get together with friends “to have fun or hang out.” We combined “sometimes” and “often” into a single category to measure having social interaction. The alternative responses were “never,” “hardly ever,” and “does not have friends.” For all of these measures, we conducted robustness checks by estimating the impact of BHBF on the full distribution of responses. The results were consistent with the conclusions reported in the text. We did find that BHBF had a statistically significant impact on the distribution of responses regarding youth decisions to spend their own money: BHBF appears to have increased the shares of youth responding “most of the time” and “none of the time.”
98 We asked the same battery of questions about independent activities and decision making in the baseline and follow-up surveys. For the treatment group, the baseline levels of independent activity and decision making at baseline (Appendix A, Table A.2) are similar to the follow-up levels reported in Table VIII.2. For each activity or decision making area, the baseline level for the treatment group was within plus or minus four percentage points of the follow-up level.

Interim Report on Broadened Horizons, Brighter Futures Chapter VIII: Impacts on Attitudes and Expectations
110
Table VIII.2. Independent Activities, Decision Making, and Social Interactions (percentages)
Treatment Group
Observed
Mean
Estimated Mean w/o
BHBF Impact P-Value
Supplementary Outcomes
Independent Activities and Decision Making Makes snacks or sandwiches (most/some of the time) 81.7 82.4 -0.7 0.78 Rides public transportation alone (most/some of the time) 56.4 52.1 4.3 0.21 Picks clothes to wear (most/some of the time) 87.5 87.4 0.1 0.95 Decides to spend own money (most/some of the time) 72.3 75.2 -2.9 0.35 Decides how to spend free time (most/some of the time) 83.2 82.1 1.1 0.70
Social Interactions Gets together with friends (often or sometimes) 65.7 62.0 3.6 0.31
Source: YTD 12-month follow-up survey.
Notes: The sample includes all youth who completed the study’s 12-month follow-up survey. The table reports observed means or percentages for the treatment group, estimates of what the treatment group means or percentages would have been in the absence of BHBF, and regression-adjusted impact estimates (see Chapter II, Section A.4). We measured explanatory variables in the regression model prior to random assignment using data from the study’s baseline survey and SSA administrative records. We calculated all statistics using sample weights to account for interview non-response. The analytic sample includes 404 treatment group youth and 334 control group youth. Survey item non-response may have resulted in smaller sample sizes for specific outcomes. See Appendix A, Table A.5, for the sample sizes for all outcomes.
*/**/***Impact estimate is significantly different from zero at the .10/.05/.01 level using a two-tailed t-test.
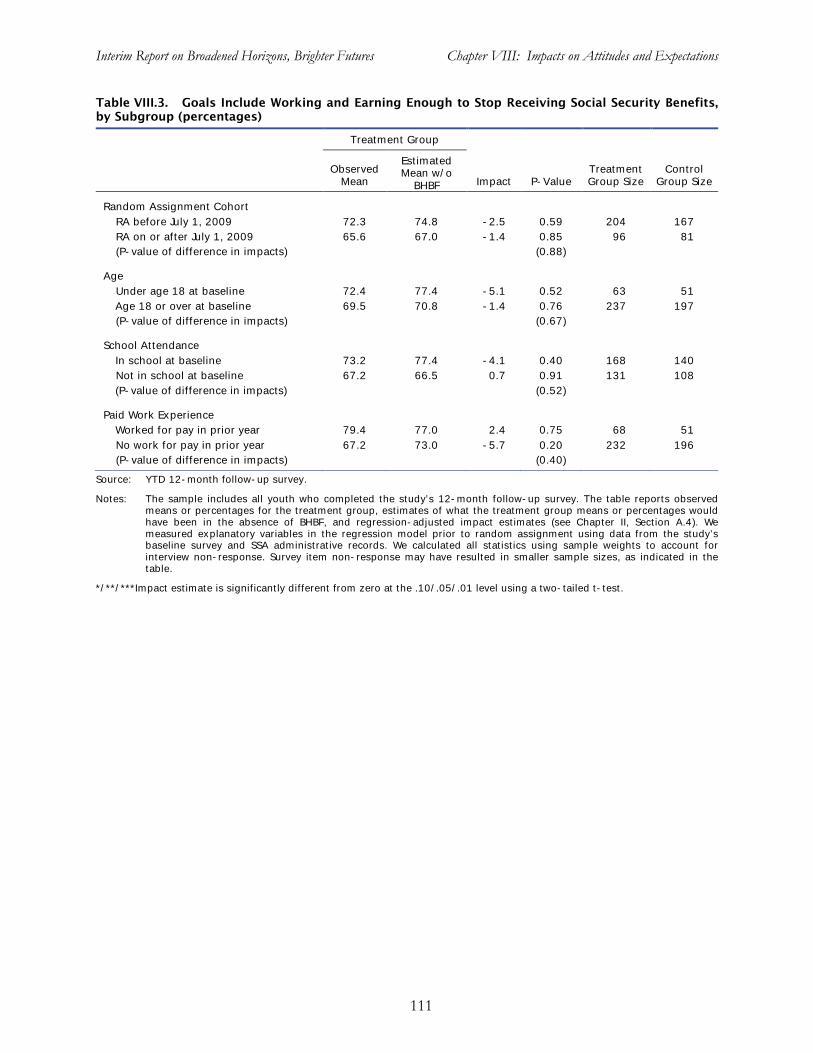
Interim Report on Broadened Horizons, Brighter Futures Chapter VIII: Impacts on Attitudes and Expectations
111
Table VIII.3. Goals Include Working and Earning Enough to Stop Receiving Social Security Benefits, by Subgroup (percentages)
Treatment Group
Observed
Mean
Estimated Mean w/o
BHBF Impact P-Value Treatment Group Size
Control Group Size
Random Assignment Cohort RA before July 1, 2009 72.3 74.8 -2.5 0.59 204 167 RA on or after July 1, 2009 65.6 67.0 -1.4 0.85 96 81 (P-value of difference in impacts) (0.88)
Age Under age 18 at baseline 72.4 77.4 -5.1 0.52 63 51 Age 18 or over at baseline 69.5 70.8 -1.4 0.76 237 197 (P-value of difference in impacts) (0.67)
School Attendance In school at baseline 73.2 77.4 -4.1 0.40 168 140 Not in school at baseline 67.2 66.5 0.7 0.91 131 108 (P-value of difference in impacts) (0.52)
Paid Work Experience Worked for pay in prior year 79.4 77.0 2.4 0.75 68 51 No work for pay in prior year 67.2 73.0 -5.7 0.20 232 196 (P-value of difference in impacts) (0.40)
Source: YTD 12-month follow-up survey.
Notes: The sample includes all youth who completed the study’s 12-month follow-up survey. The table reports observed means or percentages for the treatment group, estimates of what the treatment group means or percentages would have been in the absence of BHBF, and regression-adjusted impact estimates (see Chapter II, Section A.4). We measured explanatory variables in the regression model prior to random assignment using data from the study’s baseline survey and SSA administrative records. We calculated all statistics using sample weights to account for interview non-response. Survey item non-response may have resulted in smaller sample sizes, as indicated in the table.
*/**/***Impact estimate is significantly different from zero at the .10/.05/.01 level using a two-tailed t-test.


113
IX. EXPLORATORY ANALYSES OF IMPACTS ON TRAINING AND PRODUCTIVE ACTIVITIES
While training is an investment that can improve employment and earning opportunities, it is not a key component of the YTD conceptual framework. The individual YTD projects, including BHBF, did not emphasize training as either a service input or an outcome. However, BHBF may have promoted training indirectly through its support for developing and pursuing life goals and emphasis on independence. Specifically, some youth may have been motivated to obtain training as an important step on the path to those BHBF objectives. In addition, BHBF encouraged and supported youth who desired to enroll in vocational training programs. Because of the importance of training for future employment and earnings and the potential for BHBF to have influenced such training, we explore the project’s impacts on training outcomes in the first of two exploratory analyses presented in this chapter.
As a precursor to our planned longer-term analysis, our second exploratory analysis examines the impact of BHBF on a composite measure of participation in productive activities during the year following random assignment—specifically, participation in education, training, paid work, or unpaid work. Participation in productive activities is a key longer-term outcome in the YTD conceptual framework.
We found that BHBF had positive impacts on both youth enrollment in training programs and the intensity of their participation in those programs. In light of these impacts, as well as the project’s positive impact on paid employment (discussed in Chapter V), it is not surprising that we also found that BHBF had a positive impact on participation in productive activities.
A. BHBF Had Positive Impacts on Training
Although BHBF did not emphasize enrollment in training programs, its focus on employment could have prompted some of its participants to participate in training. Indeed, we found statistically significant, positive impacts of the intervention on two key training outcomes: enrollment in training programs and the intensity of participation in those programs. A small share of treatment group youth, ten percent, was enrolled in training programs during the year following random assignment (Table IX.1).99
99 At baseline, 22 percent of treatment group youth reported having received job training during the past year
(Table II.2). The difference in the rate of receipt of training between the baseline and follow-up surveys may be due largely to differences in the way the surveys asked for this information. The baseline survey asked a very broad question about training in job skills, vocational education, career counseling, and help in finding a job. This measure of “job training” includes activities that fell in the employment services domain in the follow-up survey (as described in Chapter IV). The follow-up survey asked whether youth were “currently in a training program or taking classes to help you learn job skills or get a job?” If youth currently were not participating in training, the survey asked, “Did you go to school, attend a training program, or take any classes?” following the date of random assignment. We distinguished between schooling and training based on a follow-up question about the program type for each program reported. We coded educational institutions as “schooling.” We coded the remaining categories as “training”: “job skills training, job training, interviewing skills, computer skills, on the job training, assistance with finding a job;” “life skills, college preparation, transition programs, YTD;” and “day habilitation, day programs.” Although some of these categories could be considered employment services, youth specifically were asked to report on training programs and classes to learn job skills or get a job, whereas the service section of the survey asked more broadly about “services or training.” If youth perceived BHBF services as “training,” BHBF services would be included in this measure of training. For youth under the age of 18, we collected information on participation in training programs from parents or guardians.
We estimated that the proportion enrolled would have been even smaller in the

Interim Report on Broadened Horizons, Brighter Futures Chapter IX: Exploratory Analyses
114
Table IX.1. Participation in Training Programs (percentages, unless otherwise noted)
Treatment Group
Observed
Mean
Estimated Mean w/o
BHBF Impact P-Value
Supplementary Outcomes
Enrollment in Training Ever enrolled in a training program in the year
following random assignment 10.2 4.0 6.2 *** 0.00
Intensity of Training Number of Months in a Training Program *** 0.00
None 89.8 96.3 -6.5 Less than nine months 2.9 1.9 1.0 Nine to twelve months 7.3 1.8 5.5 (Average number of months in a training
program) 1.0 0.3 0.7 *** 0.00 Source: YTD 12-month follow-up survey.
Notes: The sample includes all youth who completed the study’s 12-month follow-up survey. The table reports observed means or percentages for the treatment group, estimates of what the treatment group means or percentages would have been in the absence of BHBF, and regression-adjusted impact estimates (see Chapter II, Section A.4). We measured explanatory variables in the regression model prior to random assignment using data from the study’s baseline survey and SSA administrative records. We calculated all statistics using sample weights to account for interview non-response. The analytic sample includes 404 treatment group youth and 334 control group youth. Survey item non-response may have resulted in smaller sample sizes for specific outcomes. See Appendix A, Table A.5, for the sample sizes for all outcomes.
*/**/***Impact estimate is significantly different from zero at the .10/.05/.01 level using either a two-tailed t-test or a chi-square test.
absence of BHBF, only four percent (the estimated impact of six percentage points is statistically significant at the one percent level).
The intervention also had an impact on the intensity of participation in training programs, as measured by the number of months that youth were enrolled in such programs during the year following random assignment. Seven percent of treatment group youth were enrolled in training for at least nine months. We estimated this share would have been just two percent in the absence of BHBF (the estimated impact is statistically significant at the one percent level). In addition, treatment group youth were enrolled in training for one month, on average (the average includes zero values for youth not participating in training). We estimated that they would have been enrolled for only 0.3 months, on average, in the absence of BHBF (the estimated impact is statistically significant at the one percent level).100
100 We calculated months of training from reported dates of enrollment in training programs. The average number
of months of training includes youth who did not participate in training (that is, zero months of training). We chose to group months of training in the same categories used for school enrollment (which were chosen to distinguish between a full academic year and less than an academic year). The training intensity measures do not include a small number of youth who participated in training but did not report information on the number of months of training. We chose not to use the multiple imputation procedure (see Appendix A, Section E) for the training intensity measures in this chapter due to the very small number of youth with missing information on these measures.
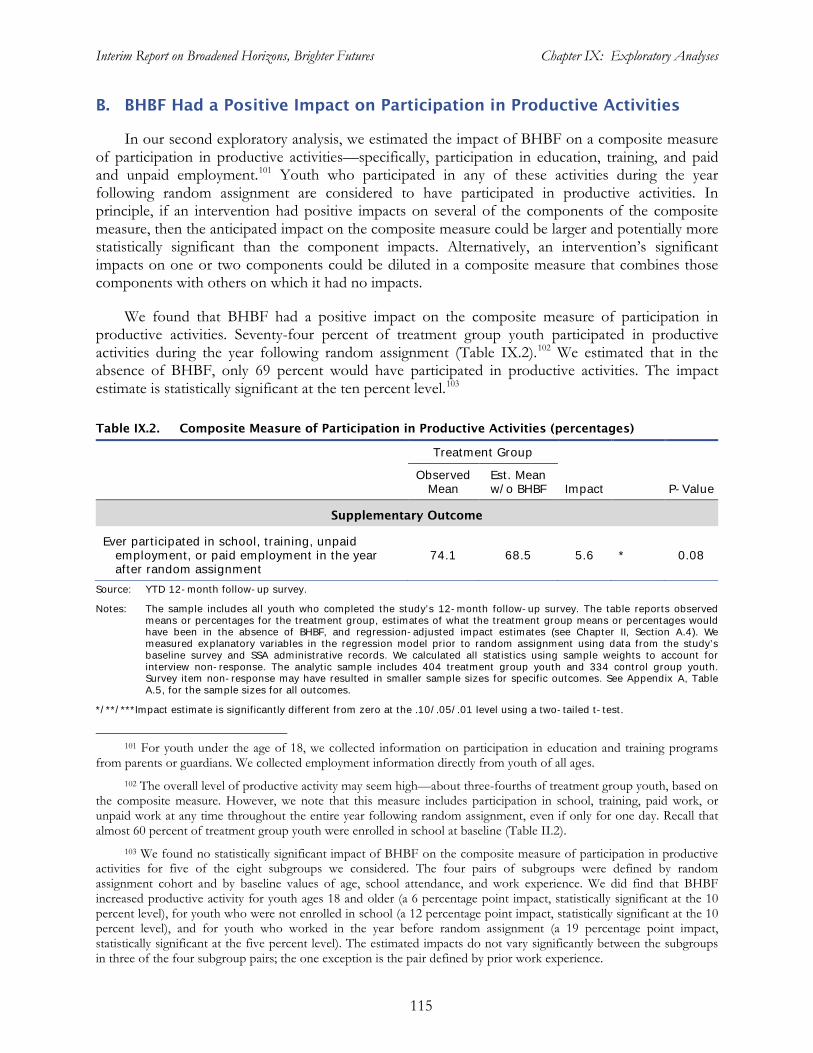
Interim Report on Broadened Horizons, Brighter Futures Chapter IX: Exploratory Analyses
115
B. BHBF Had a Positive Impact on Participation in Productive Activities
In our second exploratory analysis, we estimated the impact of BHBF on a composite measure of participation in productive activities—specifically, participation in education, training, and paid and unpaid employment.101
We found that BHBF had a positive impact on the composite measure of participation in productive activities. Seventy-four percent of treatment group youth participated in productive activities during the year following random assignment (Table IX.2).
Youth who participated in any of these activities during the year following random assignment are considered to have participated in productive activities. In principle, if an intervention had positive impacts on several of the components of the composite measure, then the anticipated impact on the composite measure could be larger and potentially more statistically significant than the component impacts. Alternatively, an intervention’s significant impacts on one or two components could be diluted in a composite measure that combines those components with others on which it had no impacts.
102 We estimated that in the absence of BHBF, only 69 percent would have participated in productive activities. The impact estimate is statistically significant at the ten percent level.103
Table IX.2. Composite Measure of Participation in Productive Activities (percentages)
Treatment Group
Observed
Mean Est. Mean w/o BHBF Impact
P-Value
Supplementary Outcome
Ever participated in school, training, unpaid employment, or paid employment in the year after random assignment
74.1 68.5 5.6 * 0.08
Source: YTD 12-month follow-up survey.
Notes: The sample includes all youth who completed the study’s 12-month follow-up survey. The table reports observed means or percentages for the treatment group, estimates of what the treatment group means or percentages would have been in the absence of BHBF, and regression-adjusted impact estimates (see Chapter II, Section A.4). We measured explanatory variables in the regression model prior to random assignment using data from the study’s baseline survey and SSA administrative records. We calculated all statistics using sample weights to account for interview non-response. The analytic sample includes 404 treatment group youth and 334 control group youth. Survey item non-response may have resulted in smaller sample sizes for specific outcomes. See Appendix A, Table A.5, for the sample sizes for all outcomes.
*/**/***Impact estimate is significantly different from zero at the .10/.05/.01 level using a two-tailed t-test.
101 For youth under the age of 18, we collected information on participation in education and training programs
from parents or guardians. We collected employment information directly from youth of all ages. 102 The overall level of productive activity may seem high—about three-fourths of treatment group youth, based on
the composite measure. However, we note that this measure includes participation in school, training, paid work, or unpaid work at any time throughout the entire year following random assignment, even if only for one day. Recall that almost 60 percent of treatment group youth were enrolled in school at baseline (Table II.2).
103 We found no statistically significant impact of BHBF on the composite measure of participation in productive activities for five of the eight subgroups we considered. The four pairs of subgroups were defined by random assignment cohort and by baseline values of age, school attendance, and work experience. We did find that BHBF increased productive activity for youth ages 18 and older (a 6 percentage point impact, statistically significant at the 10 percent level), for youth who were not enrolled in school (a 12 percentage point impact, statistically significant at the 10 percent level), and for youth who worked in the year before random assignment (a 19 percentage point impact, statistically significant at the five percent level). The estimated impacts do not vary significantly between the subgroups in three of the four subgroup pairs; the one exception is the pair defined by prior work experience.


117
X. CONCLUSION
In this report, we present findings from a process analysis and a random assignment impact analysis of Broadened Horizons, Brighter Futures, the YTD project in Miami-Dade County, Florida, that served youth ages 16 through 22 who were on SSA’s disability benefit rolls. Through the process analysis, we learned that the services delivered by BHBF conformed to the YTD program model and focused on person-centered planning, employment, financial literacy, benefits planning, and case management to resolve barriers to employment. The project enrolled 84 percent of the 460 randomly assigned treatment group members who had been referred by Mathematica and delivered services to all of the enrollees. On average, the enrollees received 29 hours of services, just under half of which were employment related, including activities such as the development of work experiences, job placement, and job coaching.
We estimated the impacts of BHBF in the initial year following random assignment on outcome measures in five domains. Within each domain, we based our principal conclusions on statistical results for a single primary outcome measure, as follows:
• Employment-promoting services - Receipt of any employment-promoting services
• Paid employment - Ever employed in a paid job
• Educational progress - Ever enrolled in school during the year following random assignment, or had
completed high school by the end of the year
• Youth income - Total income from earnings and SSA disability benefits
• Attitudes and expectations - Goals include working and earning enough money to stop receiving SSA benefits
We found that BHBF increased by 13 percentage points the proportion of treatment group youth who received any employment-promoting services during the year following random assignment. Furthermore, it increased by 9 percentage points the proportion of treatment group youth who were employed in paid jobs at any time during that year. This represents a relative increase of 70 percent in the employment rate. Also in the domain of paid employment, the project increased average annual earnings by $306, or 52 percent. As a result of this impact on earnings, as well as a positive impact on the average annual SSA disability benefit amount, the project increased youth income in the year following random assignment by an average of $424, or 7 percent. However, the project had no significant impacts on the primary outcomes in the domains of educational progress and attitudes and expectations. Even when we expanded the analysis to include supplementary outcome measures in these domains, we found no consistent patterns of impacts.
Given the focus of BHBF on employment, it is perhaps not surprising that we found positive impacts of the intervention in the domains of paid employment and youth income but no impacts in the domains of educational progress and attitudes and expectations. Whether the impacts on paid employment and earnings will persist and grow in future years, ultimately resulting in reduced

Interim Report on Broadened Horizons, Brighter Futures Conclusion
118
benefits but higher total income, will be investigated in planned analyses of data now being collected under the YTD evaluation.
It is important to recognize that this report has presented interim impact estimates based on just one of the six random assignment YTD projects and data pertaining to the first year in the evaluation’s multiyear follow-up period. Many of the youth who participated in BHBF still were receiving project services when they completed the evaluation’s 12-month follow-up survey. Interim evaluation findings from the other five random assignment YTD projects will enable us to extend the initial assessments presented in this report. As planned, the projects vary in their mix and intensity of services, while broadly adhering to the YTD program model. We thus expect that the full set of six interim evaluation reports will provide SSA with a better understanding of the challenges that youth with disabilities face in making transitions and the specific types of interventions that might assist more of them to succeed. Furthermore, the YTD evaluation’s comprehensive final report will present impact estimates based on 36 months of follow-up data from all six of the random assignment projects. Our analyses of those data may reveal longer-term impacts of BHBF in addition to the short-term impacts reported here.
119
REFERENCES
Bjelland, M.J., W.A. Erickson, and C.G. Lee. “Disability Statistics from the American Community Survey (ACS).” Ithaca, NY: Cornell University Rehabilitation Research and Training Center on Disability Demographics and Statistics (StatsRRTC), November 2008.
Carlin, J.B., J.C. Galati, and P. Royston. “New Framework for Managing and Analyzing Multiply Imputed Data.” Stata Journal, vol. 8, no. 1, 2008, pp. 49-67.
Florida Department of Education, Education Information and Accountability Services. “Archives: Data Publications and Reports.” 2012. Available at [http://www.fldoe.org/eias/eiaspubs/ archives.asp]. Accessed May 18, 2012.
Freedman, D. “On Regression Adjustments to Experimental Data.” University of California Statistics Department Working Paper. 2006. Available at [http://www.stat.berkeley. edu/~census/neyregr.pdf]. Accessed February 24, 2010.
Gresham, F.M. and S. N. Elliot. Social Skills Rating System Manual. Circle Pines, MN: American Guidance Service, 1990.
Griffin-Hammis Associates. “Customized Employment.” 2012. Available at [http://www. griffinhammis.com/customized_employ.asp]. Accessed March 17, 2012.
Harper, S. “Causes, Correlates, and the Functional Role of Global Self-Worth: A life Span Perspective.” In R. J. Sternberg and J. J. Kooligian (Eds.), Competence Considered. New Haven, CT: Yale University Press, 1990, pp. 67-97.
Herz, D. and K. Kosanovich. “Trends in Youth Employment: Data from the Current Population Survey.” Washington, DC: U.S. Bureau of Labor Statistics, 2000.
Hildebrand, L., L. Kosar, J. Page, M. Loewenberg, D. Phelps, and N. Hazelwood. “User’s Guide for the Ticket Research File: TRF08: Data from January 1994 to December 2008.” Washington, DC: Mathematica Policy Research, January 2010.
Johnson, G., R Stodden, E. Emanuel, R. Leucking, and M. Mack. “Current Challenges Facing Secondary Education and Transition Services: What Research Tells Us.” Exceptional Children, vol. 68, no. 4, 2002, pp. 5199-531.
Livermore, G., A. Roche, and S. Prenovitz. “Work Activity and Use of Employment Supports Under the Original Ticket to Work Regulations: SSI and DI Beneficiaries with Work-Related Goals and Expectations.” Washington, DC: Mathematica Policy Research, October 2009a.
Livermore, G., D. Stapleton, and A. Roche. “Work Activity and Use of Employment Supports Under the Original Ticket to Work Regulations: Characteristics, Employment, and Sources of Support Among Working-Age SSI and DI Beneficiaries.” Washington, DC: Mathematica Policy Research, April 2009b.

Interim Report on Broadened Horizons, Brighter Futures References
120
Livermore, G., D.A. Wright, A. Roche, and E. Grau. “Work Activity and Use of Employment Supports Under the Original Ticket to Work Regulations: 2006 National Beneficiary Survey: Methodology and Descriptive Statistics.” Washington, DC: Mathematica Policy Research, October 2009c.
Loprest, P. and D. Wittenburg. “Choices, Challenges, and Options: Child SSI Recipients Preparing for the Transition to Adult Life.” Washington, DC: The Urban Institute, May 2005.
Loprest, P. and D. Wittenburg. “Post-Transition Experiences of Former Child SSI Recipients.” Social Service Review, vol. 81, no. 4, 2007, pp. 583-608.
Mank, D., A. Cioffi, and P. Yovanoff. “Supported Employment Outcomes Across a Decade: Is There Evidence of Improvement in the Quality of Implementation?” Mental Retardation, vol. 41, 2003, pp. 199-197.
Marsh, H.W., I.D. Smith, J. Barnes, and S. Butler. “Self-Concept: Reliability, Stability, Dimensionality, Validity, and the Measurement of Change.” Journal of Educational Psychology, vol. 75, 1983, pp. 772-790.
Martinez, J., M. Manno, P. Baird, T. Fraker, T. Honeycutt, A. Mamun, B. O’Day, and A. Rangarajan. “The Social Security Administration’s Youth Transition Demonstration Projects: Profiles of the Random Assignment Projects.” Princeton, NJ: Mathematica Policy Research, 2008.
Martinez, J., T. Fraker, M. Manno, P. Baird, A. Mamun, B. O’Day, A. Rangarajan, and D. Wittenburg. “The Social Security Administration’s Youth Transition Demonstration Projects: Implementation Lessons from the Original Sites.” Washington, DC: Mathematica Policy Research, 2010.
National Collaborative on Workforce and Disability for Youth. “Guideposts for Success.” Washington, DC: Institute on Education Leadership, 2005.
O’Day, B., T. Honeycutt, L. Guy, T. Fraker, S. Muller-Ravett, I. Lee. “The Broadened Horizons, Brighter Futures Youth Transition Demonstration Project of Abilities, Inc. of Florida: Early Assessment Report.” Washington, DC: Mathematica Policy Research, 2009.
Pearlin, L.I. and C. Schooler. “The Structure of Coping.” Journal of Health and Social Behavior, vol. 19, no. 1, 1978, pp. 2-21.
Puma, M.J., R.B. Olsen, S.H. Bell, and C. Price. “What to Do When Data Are Missing in Group Randomized Controlled Trials (NCEE 2009-0049).” Washington, DC: National Center for Education Evaluation and Regional Assistance, Institute of Education Sciences, U.S. Department of Education, October 2009.
Rangarajan, A., L. Grossman, J. Martinez, T. Fraker, K. Cybulski, A. Ciemnecki, and G. Livermore. “Data Collection and Survey Plan for the Youth Transition Demonstration Evaluation.” Washington, DC: Mathematica Policy Research, 2007.
Rangarajan, A., T. Fraker, T. Honeycutt, A. Mamun, J. Martinez, B. O’Day, and D. Wittenburg. “SSA’s Youth Transition Demonstration Projects: Evaluation Design Report.” Princeton, NJ: Mathematica Policy Research, 2009a.
Interim Report on Broadened Horizons, Brighter Futures References
121
Rangarajan, A., D. Reed, A. Mamun, J. Martinez, and T. Fraker. “The Social Security Administration’s Youth Transition Demonstration Projects: Analysis Plan for Interim Reports.” Princeton, NJ: Mathematica Policy Research, 2009b.
Royston, P. “Multiple Imputation of Missing Values: Update of ICE.” Stata Journal, vol. 7, no. 4, 2007, pp. 445-464.
Royston, P., J.B. Carlin, and I.R. White. “Multiple Imputation of Missing Values: New Features for MIM”. Stata Journal, vol. 9, no. 2, 2009, pp. 252-264.
Schochet, P.Z. “Technical Methods Report: Guidelines for Multiple Testing in Impact Evaluations (NCEE 2008-4018).” Washington, DC: National Center for Education Evaluation and Regional Assistance, Institute of Education Sciences, U.S. Department of Education, May 2008.
Schochet, P.Z. “Is Regression Adjustment Supported by the Neyman Model for Causal Inference?” Journal of Statistical Planning and Inference, vol. 140, January 2010, pp. 246-259.
Social Security Administration. “SSI Recipients by State and County, 2010.” SSA Publication No. 13-11976. Washington, DC: Office of Retirement and Disability Policy, Social Security Administration, 2011.
Social Security Administration. “Annual Statistical Supplement to the Social Security Bulletin, 2011.” SSA Publication No. 13-11700. Washington, DC: Office of Retirement and Disability Policy, Social Security Administration, 2012.
U.S. Bureau of Labor Statistics. “Local Area Unemployment Statistics: Annual Average, Statewide Data.” Washington, DC: U.S. Department of Labor, Bureau of Labor Statistics (on-line database: http://www.bls.gov/lau/tables.htm).
U.S. Census Bureau. “American Fact Finder: 2010 American Community Survey 1-Year Estimates.” Washington, DC: U.S. Census Bureau (on-line database: http://factfinder2.census.gov/ faces/nav/jsf/pages/index.xhtml).
Wagner, M., T.W. Cadwallader, C. Marder, R. Cameto, D. Cardoso, N. Garza, P. Levine, and L. Newman. “Life Outside the Classroom for Youth with Disabilities.” Menlo Park, CA: SRI International, 2003.
Wehman, P. Life Beyond the Classroom: Transition Strategies for Young People with Disabilities (4th ed.). Baltimore, MD: Paul H. Brookes Publishing Co., 2006.


APPENDIX A
ADDITIONAL ANALYSES AND TECHNICAL DISCUSSION


Interim Report on Broadened Horizons, Brighter Futures Appendix A: Additional Analyses and Technical Discussion
A.1
In this appendix, we provide a detailed discussion of some of the analytic issues raised in Chapter II. We begin by examining baseline characteristics of youth who enrolled in the evaluation relative to those who did not, and of youth in the treatment group relative to those in the control group. We also provide simple unadjusted means for all outcome measures and compare impacts based on simple and regression-adjusted means for the primary outcomes. We then discuss response and non-response to the 12-month survey and our treatment of missing information for dependent and independent variables. In the final sections of the appendix, we present additional analyses to support the impact analysis: monthly average benefit receipt for the annual periods before and following random assignment, outcomes for exploratory subgroups, and impact estimates for the component outcomes of the composite locus of control measures.
A. Characteristics of Youth Who Enrolled in the Evaluation
Although we attempted to contact a representative sample of youth in Miami-Dade County, only about 15 percent of those we attempted to contact were recruited into the study and randomly assigned to the treatment or control groups. Those not randomly assigned, and thus not in the study, included (1) youth we were unable to reach, (2) youth we reached but who were not interested in participating and did not complete a baseline interview, (3) youth who completed a baseline interview but did not return a signed consent form, (4) youth who returned a signed consent form but did not want to participate in the study, and (5) youth who completed the baseline interview and consented to participate in the study but were siblings of youth who had previously agreed to participate in the study and had already been randomly assigned. The latter youth were deliberately assigned to the same treatment/control status as their siblings and were not included in the research sample.
To understand more fully the characteristics of study participants compared to those of the project’s full target population (youth ages 16 through 22 who received SSA benefits and lived in Miami-Dade County), we used SSA administrative data to compare the characteristics of those recruited into the study (enrollees) to those who were not (non-enrollees).104
Although differences between enrollees and non-enrollees are statistically significant for several baseline characteristics, the overall differences are not large. The comparisons suggest that, among eligible youth in Miami-Dade County, the YTD evaluation enrolled a broad group of disability beneficiaries and not merely a distinctive subset. However, enrollees did differ from non-enrollees in that the former had a lower share with earnings in the year before the year of random assignment
Relative to youth who did not enroll, those who did enroll in the evaluation were a few months younger on average and slightly less likely to be male (Table A.1). Enrollees also were more likely to have a cognitive or developmental disability and less likely to have a mental illness as the primary disabling condition. A greater share of enrollees received benefits through their parent(s) as representative payees rather than directly or through other representative payees. Enrollees were slightly more likely to live in North Miami and slightly less likely to live in South Miami. Enrollees were also less likely to have worked in the year prior to random assignment and they had lower average earnings during that year.
104 The reference period for earnings data from SSA files is the year prior to the year in which random assignment
occurred. This is different from the reference period for self-reported employment in the YTD baseline survey, as reported in Tables II.2 and A.3. The latter reference period is the year prior to the baseline interview date. Random assignment occurred after signed consent to participate in the study was received, subsequent to the baseline interview. The time lag between completion of the baseline survey and random assignment was typically several weeks, but in extreme cases was as long as six months.

Interim Report on Broadened Horizons, Brighter Futures Appendix A: Additional Analyses and Technical Discussion
A.2
Table A.1. Characteristics, by Enrollment in the Evaluation (percentages, unless otherwise noted)
All Enrollees Non-
Enrollees Difference P-Value
Administrative Data
Demographic Characteristics Male 62.7 60.0 63.2 -3.2 * 0.07 Age in Years ** 0.02
14–17 22.8 26.1 22.1 4.0 18–21 66.0 64.1 66.4 -2.3 22–25 11.2 9.8 11.5 -1.7 Average age (years) 19.1 18.9 19.1 -0.2 *** 0.01
Language 0.34 English 71.2 73.5 70.7 2.8 Spanish 26.8 24.8 27.2 -2.5 Other 0.8 0.6 0.9 -0.3 Unknown/missing 1.2 1.1 1.2 0.0
Benefits
SSA Beneficiary Status 0.70 SSI (only or concurrent with CDB or DI) 96.9 96.7 97.0 -0.2
Duration of benefit entitlement (years) 8.7 8.5 8.7 -0.2 0.29 Representative Payee Type * 0.08
None 14.8 12.4 15.3 -2.9 Natural/adoptive/stepparent 68.5 70.7 68.0 2.6 Other relative 12.0 12.8 11.8 1.1 Other 4.8 4.1 4.9 -0.8
Disability
Primary Disabling Condition (SSA data) *** 0.00 Mental illness 20.7 16.6 21.5 -4.9 Cognitive/developmental disability 37.7 44.9 36.7 6.2 Learning disability/ADD 22.5 21.4 22.7 -1.3 Physical disability 13.8 14.2 13.7 0.5 Speech, hearing, visual impairment 5.3 4.9 5.4 -0.5
Duration of disability (years) 8.9 8.8 8.9 -0.1 0.73 Location Within Service Delivery Area * 0.07
North Miami 28.8 31.4 28.3 3.1 South Miami 71.2 68.6 71.7 -3.1
Earnings in Year Before Year of RA
Positive earnings 24.9 21.0 25.6 -4.6 *** 0.00 Amount of earnings ($) 1,144 828 1,203 -376 *** 0.00
Sample Size 5,573 880 4,693 Sources: SSA administrative records. Most measures are from the TRF. Earnings are measured in the MEF.
Notes: Missing information resulted in smaller sample sizes for some characteristics than indicated at the bottom of the table. The table includes all youth randomly selected from the sample frame. The enrollees include all youth who enrolled in the evaluation, including 21 youth who were not in the research sample because they were assigned to the treatment or control group to match the status of their siblings.
*/**/***Difference is significantly different from zero at the 0.10/0.05/0.01 level using either a two-tailed t-test or a chi-square test.
RA = random assignment

Interim Report on Broadened Horizons, Brighter Futures Appendix A: Additional Analyses and Technical Discussion
A.3
and the average amount of those earnings was lower.105 As a result of their self-selection into or out of the evaluation, enrollees and non-enrollees may also have differed on unobserved characteristics, such as motivation to work in the future. However, baseline differences between youth who enrolled in the evaluation and non-enrollees do not imply bias in the impact estimates, as both the treatment and control groups were populated exclusively with youth who enrolled in the evaluation.106
For readers unfamiliar with employment rates among youth with disabilities, the share of youth with earnings in the year before random assignment may seem fairly high: 21 percent for enrollees and 26 percent for non-enrollees (based on administrative records, Table A.1). However, these employment rates are similar to rates found in other studies of youth with disabilities. In the American Community Survey, the national employment rate for youth ages 16 to 20 with disabilities was 28 percent (Bjelland et al. 2008).
107
B. Baseline Equivalence
We examined the baseline characteristics of the treatment and control groups to assess the equivalence of the samples before youths’ participation in the evaluation. Most important, we assessed baseline equivalence in the analytic sample, which is the sample of all respondents to the 12-month follow-up survey and the source of most outcome measures. In Chapter II (Table II.2), we discuss the baseline equivalence for the analytic sample for several characteristics. In Table A.2, we show that the treatment and control groups were similar at baseline for several additional characteristics.108
We also examined baseline characteristics for the research sample, which is the full sample of youth randomized into the treatment and control groups, including those who did not respond to the 12-month follow-up survey.
109
105 We also found that enrollees were less likely to work than non-enrollees and had lower average earnings two
years and three years prior to the year of random assignment. These values were based on administrative records from the MEF and are not shown in Table A.1.
We found that the two groups were highly similar at baseline,
106 In future years, we can use administrative data to examine trends in work and earnings for non-enrollees in comparison to trends for the control group to further understand selection into the evaluation. At the time of this writing, administrative data on earnings are not available for the period after random assignment.
107 We found similar employment rates for YTD youth in most of the other evaluation sites (30-31 percent in the overall samples [enrollees plus non-enrollees] for the Erie County, New York, Colorado, and Montgomery County, Maryland sites; 23 percent for the West Virginia site). We found a lower employment rate for YTD youth in the Bronx County, New York, site (10 percent), perhaps reflecting the greater share of youth under age 18 targeted by that YTD project.
108 In addition, for the analytic and research samples, we found only two statistically significant differences between treatment and control group youth in employment and earnings for the three years before the year of random assignment (based on administrative records from the MEF; not shown in Tables A.2 and A.3). In the analytic sample, but not the research sample, the treatment group was somewhat more likely than the control group to have had employment (measured as positive earnings) during the 24 month period before random assignment (33 percent versus 27 percent; the difference is statistically significant at the ten percent level) and during the 36 month period before random assignment (38 percent versus 32 percent, the difference is statistically significant at the ten percent level). However, in both the analytic and research samples, when employment in the first, second, and third year prior to random assignment are considered separately, the differences between the treatment and control groups are not statistically significant in any of the three years. Furthermore, there are no statistically significant differences in average earnings between the treatment and control group in the first, second, or third year before random assignment in either the analytic or research sample.
109 For the research sample, which includes non-respondents to the 12-month follow-up survey, we can estimate impacts only for outcomes measured in administrative data (Appendix A, Section D).

Interim Report on Broadened Horizons, Brighter Futures Appendix A: Additional Analyses and Technical Discussion
A.4
Table A.2. Additional Baseline Characteristics of the Analytic Sample (percentages, unless otherwise noted)
All Treatment Control Difference P-Value
Baseline Survey Data
Education Attainment—Highest Grade Completed 0.76
9th grade or less 10.4 9.1 11.9 -2.8 10th or 11th grade 34.2 34.4 34.0 0.4 12th grade 47.5 48.5 46.5 2.0 College or technical school 1.3 1.6 0.9 0.7 Other 6.6 6.4 6.8 -0.4
High school diploma, GED, or certificate of completion 32.4 33.2 31.5 1.7 0.64 Ever received special education 75.9 75.1 76.7 -1.6 0.64
Health Insurance Coverage Covered by public health insurance 89.2 88.5 89.9 -1.4 0.57 Covered by private health insurance 8.7 8.7 8.7 0.0 0.99 Covered by either public or private health insurance 5.8 5.8 5.9 -0.1 0.95 Covered by both public and private health insurance 91.7 90.9 92.7 -1.8 0.41
Family Socioeconomic Status Public Assistance
TANF/family assistance 9.3 8.4 10.3 -1.9 0.41 SNAP (food stamps) 48.6 47.3 50.0 -2.7 0.49
Independent Activities and Decision Making Makes snacks or sandwiches (most/some of the time) 84.0 84.8 83.2 1.6 0.58 Rides public transportation alone (most/some of the
time 54.1 56.4 51.5 4.9 0.21 Picks clothes to wear (most/some of the time) 90.3 90.7 89.9 0.8 0.74 Decides how to spend own money (most/some of the
time) 76.5 76.5 76.4 0.0 0.99 Decides how to spend free time (most/some of the
time) 85.1 85.2 84.9 0.3 0.92
Random Assignment Cohort Before July 1, 2009 65.6 65.4 65.9 -0.5 0.90
Location Within Service Delivery Area North Miami 30.4 31.3 29.5 1.8 0.61
Administrative Data
Language 0.73 English 72.9 72.6 73.2 -0.6 Spanish 25.1 25.9 24.2 1.7 Other 0.7 0.4 1.0 -0.6 Unknown/missing 1.3 1.1 1.6 -0.5
Benefits Representative Payee Type 0.45
None 12.3 14.1 10.4 3.7 Natural/adoptive/stepparent 70.1 69.6 70.8 -1.2 Other relative 12.7 12.2 13.4 -1.2 Other 4.8 4.2 5.5 -1.3
Sample Size 738 404 334
Sources: YTD baseline survey and SSA administrative records.
Notes: We weighted statistics to adjust for non-response to the 12-month survey. Baseline survey item non-response may have resulted in smaller sample sizes for some characteristics than indicated at the bottom of the table.
*/**/***Difference is significantly different from zero at the 0.10/0.05/0.01 level using either a two-tailed t-test or a chi-square test.
Interim Report on Broadened Horizons, Brighter Futures Appendix A: Additional Analyses and Technical Discussion
A.5
with small differences that are similar to those we found for the analytic sample (Table A.3). Similar to the analytic sample, in the research sample we found that treatment group youth were less likely than control group youth to have had job training, have worked as a volunteer, and have an employed father. Treatment group youth were more likely than control group youth to have a mother who had graduated from high school or to require aids for reading, hearing, speaking, or walking. Treatment group youth also had lower average annual benefit amounts in the year before the month of random assignment than did control group youth.
The degree of difference between the treatment and control groups is about what we would expect due to chance. For example, of the 50 baseline characteristics we investigated, we would expect about five characteristics to be statistically different at the ten percent significance level or lower.110
C. Comparison of Means and Regression- Adjusted Means
We found six statistically significant differences at this level in the analytic and research samples.
In the text, we report regression-adjusted impact estimates. We estimated the regressions by using ordinary least squares (OLS) for continuous variables, logistic regression for binary variables, and multinomial logistic regression for categorical variables.111 The regression adjustments control for small differences in baseline characteristics between the treatment and control groups. In addition, the regression-adjusted approach tends to yield more precise estimates—that is, estimates with smaller standard errors—thereby providing greater statistical power to detect small impacts. In Table A.4, we list the variables in the regression models.112
Some research suggests that the use of OLS multivariate regression models may not always be justified for impact estimation, even with the availability of control variables with significant power to explain the variation in outcome measures (Freedman 2006). Freedman’s argument is that multivariate models, under some circumstances, may lead to biases in the standard errors of impact estimates. Schochet (2010) examined data from several large-scale random assignment evaluations and found that, in practice, regression adjustments did not lead to biases in the standard errors of impact estimates. In general, as long as there is a fairly even split in the sample between treatment and control groups, the regression-adjusted estimates do not lead to biases in the
110 The 50 baseline characteristics that we investigated for the research sample include the 32 shown in Table A.3
plus 18 additional characteristics for which results are not shown. In the research sample, there are no significant treatment-control differences for any of the additional characteristics. These latter results are similar to those based on the analytic sample (reported in Table A..2).
111 For the logistic and multinomial logistic regressions, we computed the estimated impact as the difference between the estimated outcome if all sample youth were in the treatment group (that is, the predicted value with the treatment dummy equal to one) less the estimated outcome if all sample youth were in the control group (that is, the predicted value with the treatment dummy equal to zero). The reported p-value for the estimated impact is the p-value on the treatment dummy in the regression model.
112 The control variables in the regression model were chosen, in part, to include characteristics for which the baseline difference between treatment and control groups was substantial and/or statistically significant. The regression model used here for BHBF is largely the same as the model used for the interim analysis of the other sites. For BHBF, we added four indicators due to statistically significant baseline differences between the treatment and control groups: received job training in the prior year; worked as a volunteer in the prior year; father employed; and requires reading, hearing, speaking, or walking aids. For models of outcomes in the income domain, we included SSA benefit amount in the year before the month of random assignment because it is a strong predictor of income in the year after random assignment (income is defined as earnings plus SSA benefits). We also used an indicator for black race rather than white because black was the largest racial group.

Interim Report on Broadened Horizons, Brighter Futures Appendix A: Additional Analyses and Technical Discussion
A.6
Table A.3. Baseline Characteristics of the Research Sample (percentages, unless otherwise noted)
All Treatment Control Difference P-Value
Baseline Survey Data
Demographic Characteristics Race 0.45
White 36.1 36.6 35.6 1.0 Black 51.6 50.8 52.6 -1.9 American Indian/AK/HI/Pacific Islander 2.1 2.4 1.8 0.6 Asian 0.8 1.3 0.3 1.1 Other or unknown 9.3 8.9 9.8 -0.8
Hispanic 42.3 42.1 42.4 -0.3 0.93 Primarily speaks English at home 77.1 76.0 78.3 -2.3 0.43
Education School Attendance 0.47
Does not attend school 43.6 42.2 45.3 -3.1 Attends regular high school 33.3 33.2 33.4 -0.2 Attends special high school 7.3 7.0 7.6 -0.6 Attends other school 15.8 17.6 13.7 3.9
Employment Received job training in last year 24.8 22.1 27.8 -5.7 * 0.05 Worked as volunteer in last year 15.2 13.0 17.7 -4.6 * 0.06 Worked for pay in last year 18.5 19.3 17.6 1.8 0.51 Worked for pay in last month 8.1 8.0 8.3 -0.2 0.90 Never worked for pay at baseline 65.3 63.9 66.8 -2.9 0.37
Living Arrangements and Household Composition Living Arrangements
Two-parent family 0.48 Single-parent family 28.7 27.1 30.6 -3.5 Group home 63.0 64.6 61.1 3.5 Other institution 0.8 0.4 1.3 -0.8 Lives alone or with friends 2.9 3.3 2.5 0.7
Average number of people in household 4.6 4.6 4.5 0.0 Lives with others with disabilities 4.1 4.1 4.1 0.0 0.84
Family Socioeconomic Status 39.5 40.7 38.2 2.4 0.48 Annual Income
Less than $10,000 0.93 $10,000–$24,999 38.1 38.6 37.5 1.2 $25,000 or more 39.0 38.9 39.1 -0.2
Parents' Education 22.9 22.5 23.4 -1.0 Mother high school graduate 65.3 69.7 60.4 9.4 *** 0.01 Father high school graduate 65.3 63.8 67.1 -3.3 0.44
Parents' Employment Status Mother employed 44.8 45.8 43.7 2.1 0.55 Father employed 61.4 56.3 67.3 -11.0 ** 0.01
Self-Reported Health Status 0.89 Excellent 21.9 22.1 21.6 0.5 Very good/good 55.7 55.0 56.5 -1.6 Fair/poor 22.4 23.0 21.9 1.1
Assistance Reading, hearing, speaking, or walking aidsb 16.8 19.0 14.4 4.6 * 0.08 Help with personal care needs 19.8 20.5 19.0 1.4 0.60
Expectations About the Future Expects to live independently (w/ or w/o help) 68.4 68.1 68.7 -0.6 0.87 Expects to continue education 88.2 88.4 88.0 0.4 0.89 Expects to work at least part-time for pay 90.3 90.3 90.3 0.0 1.00
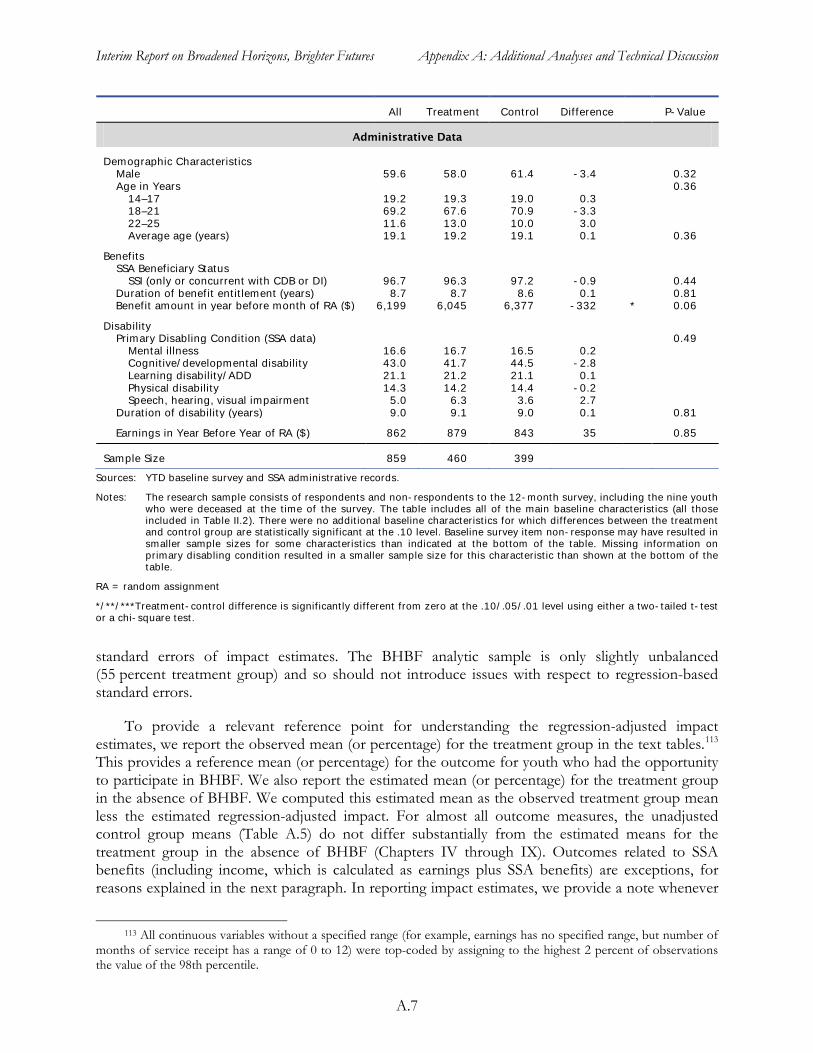
Interim Report on Broadened Horizons, Brighter Futures Appendix A: Additional Analyses and Technical Discussion
A.7
All Treatment Control Difference P-Value
Administrative Data
Demographic Characteristics Male 59.6 58.0 61.4 -3.4 0.32 Age in Years 0.36
14–17 19.2 19.3 19.0 0.3 18–21 69.2 67.6 70.9 -3.3 22–25 11.6 13.0 10.0 3.0 Average age (years) 19.1 19.2 19.1 0.1 0.36
Benefits SSA Beneficiary Status
SSI (only or concurrent with CDB or DI) 96.7 96.3 97.2 -0.9 0.44 Duration of benefit entitlement (years) 8.7 8.7 8.6 0.1 0.81 Benefit amount in year before month of RA ($) 6,199 6,045 6,377 -332 * 0.06
Disability Primary Disabling Condition (SSA data) 0.49
Mental illness 16.6 16.7 16.5 0.2 Cognitive/developmental disability 43.0 41.7 44.5 -2.8 Learning disability/ADD 21.1 21.2 21.1 0.1 Physical disability 14.3 14.2 14.4 -0.2 Speech, hearing, visual impairment 5.0 6.3 3.6 2.7
Duration of disability (years) 9.0 9.1 9.0 0.1 0.81
Earnings in Year Before Year of RA ($) 862 879 843 35 0.85
Sample Size 859 460 399 Sources: YTD baseline survey and SSA administrative records.
Notes: The research sample consists of respondents and non-respondents to the 12-month survey, including the nine youth who were deceased at the time of the survey. The table includes all of the main baseline characteristics (all those included in Table II.2). There were no additional baseline characteristics for which differences between the treatment and control group are statistically significant at the .10 level. Baseline survey item non-response may have resulted in smaller sample sizes for some characteristics than indicated at the bottom of the table. Missing information on primary disabling condition resulted in a smaller sample size for this characteristic than shown at the bottom of the table.
RA = random assignment
*/**/***Treatment-control difference is significantly different from zero at the .10/.05/.01 level using either a two-tailed t-test or a chi-square test.
standard errors of impact estimates. The BHBF analytic sample is only slightly unbalanced (55 percent treatment group) and so should not introduce issues with respect to regression-based standard errors.
To provide a relevant reference point for understanding the regression-adjusted impact estimates, we report the observed mean (or percentage) for the treatment group in the text tables.113
113 All continuous variables without a specified range (for example, earnings has no specified range, but number of
months of service receipt has a range of 0 to 12) were top-coded by assigning to the highest 2 percent of observations the value of the 98th percentile.
This provides a reference mean (or percentage) for the outcome for youth who had the opportunity to participate in BHBF. We also report the estimated mean (or percentage) for the treatment group in the absence of BHBF. We computed this estimated mean as the observed treatment group mean less the estimated regression-adjusted impact. For almost all outcome measures, the unadjusted control group means (Table A.5) do not differ substantially from the estimated means for the treatment group in the absence of BHBF (Chapters IV through IX). Outcomes related to SSA benefits (including income, which is calculated as earnings plus SSA benefits) are exceptions, for reasons explained in the next paragraph. In reporting impact estimates, we provide a note whenever

Interim Report on Broadened Horizons, Brighter Futures Appendix A: Additional Analyses and Technical Discussion
A.8
Table A.4. Control Variables for Regression- Adjusted Analysis of Impacts
Characteristic Control Variables
Demographic Male Age: less than 18 years, 18–21 years (reference 22–25) Race: black
Education and employment Enrolled in school at baseline Received job training in year prior to random assignment Worked as a volunteer in year prior to random assignment Worked for pay in year prior to random assignment
Disability benefit SSI beneficiary – SSI only or concurrent with CDB or DI Duration of benefit entitlement: less than three years, three
years to less than ten years (reference: more than ten years)
Benefit amount in year before month of random assignment (continuous variable; included only in models for the income domain)
Health Self-reported health status: good/very good/excellent Primary disabling conditions: mental illness,
cognitive/developmental disability, learning disability/ADD, physical disability (reference: speech, hearing, visual impairment)
Requires reading, hearing, speaking, or walking aids Requires help with personal care needs
Family resources Living arrangement: two-parent family, single-parent family (reference: does not live with either parent)
High school graduate mother Father employed at time of baseline survey
Expectations Expects to live independently
Project-specific factors Randomly assigned before July 1, 2009 Residence in North Miami
Notes: All control variables are categorical, except as noted. For variables with more than two categories, the table shows the reference category in parentheses. The benefit amount in the year before the month of random assignment is included in models for the income domain because it is a strong predictor of income (which is defined as earnings plus benefits).
a statistically significant impact would differ substantially in proportional terms if considered relative to the observed control group mean rather than the estimated mean for the treatment group in the absence of BHBF. In Table A.5, we provide the simple mean impact estimates for all outcomes.
We compared results from the simple mean and regression-adjusted mean differences for the primary outcomes (Table A.6). For receipt of employment services, both methods produced an estimated impact of 11 to 13 percentage points (statistically significant at the one percent level). Similarly, both methods produced an estimated impact on paid employment of 8 to 9 percentage points (statistically significant at the one percent level). For the other primary outcomes except income, the estimated impacts differ by a relatively small amount and in no case do they differ statistically from zero. For income, the simple mean difference between the treatment and control groups is $96 and is not statistically significant. In contrast, the adjusted mean difference suggests that BHBF increased income by $424 (statistically significant at the ten percent level). The difference occurs because the adjusted mean accounts for the higher SSA benefit amount received by the control group before random assignment ($351 higher, Table II.2). The SSA benefit amount in the year before random assignment is a strong predictor of income in the year after random assignment because income is calculated as earnings plus SSA benefits.
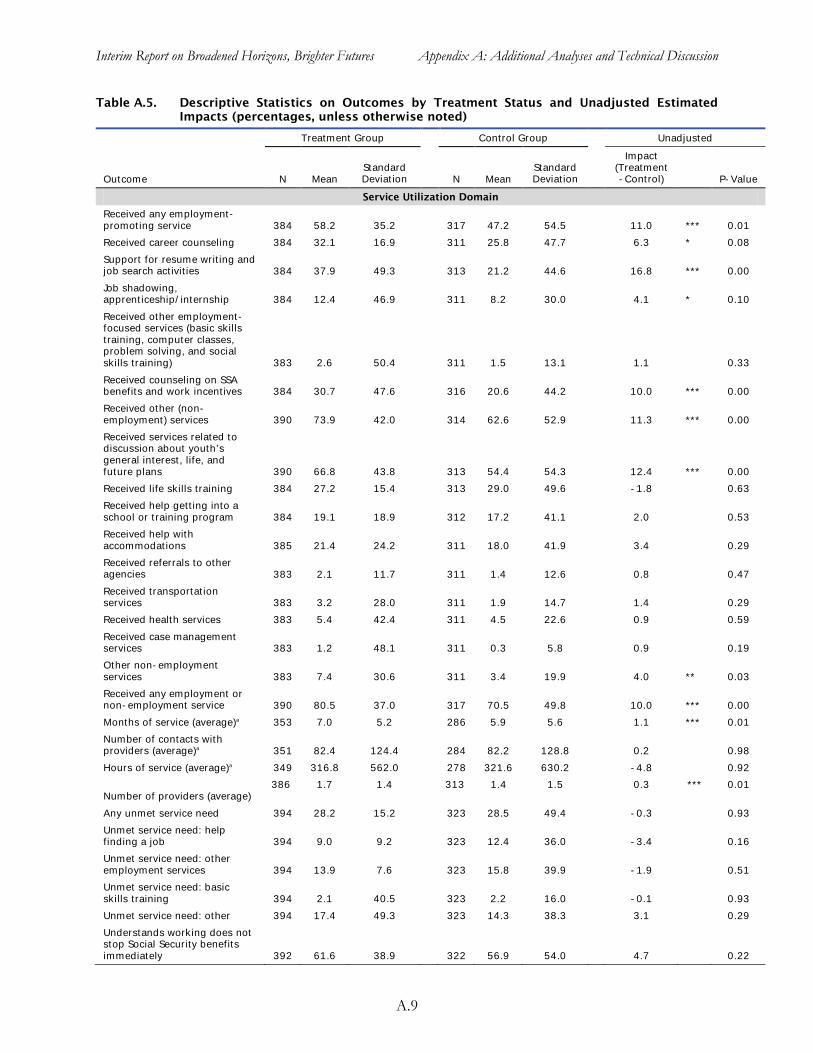
Interim Report on Broadened Horizons, Brighter Futures Appendix A: Additional Analyses and Technical Discussion
A.9
Table A.5. Descriptive Statistics on Outcomes by Treatment Status and Unadjusted Estimated Impacts (percentages, unless otherwise noted)
Treatment Group Control Group Unadjusted
Outcome N Mean Standard Deviation N Mean
Standard Deviation
Impact (Treatment-Control) P-Value
Service Utilization Domain Received any employment-promoting service 384 58.2 35.2 317 47.2 54.5 11.0 *** 0.01 Received career counseling 384 32.1 16.9 311 25.8 47.7 6.3 * 0.08 Support for resume writing and job search activities 384 37.9 49.3 313 21.2 44.6 16.8 *** 0.00 Job shadowing, apprenticeship/internship 384 12.4 46.9 311 8.2 30.0 4.1 * 0.10 Received other employment-focused services (basic skills training, computer classes, problem solving, and social skills training) 383 2.6 50.4 311 1.5 13.1 1.1 0.33 Received counseling on SSA benefits and work incentives 384 30.7 47.6 316 20.6 44.2 10.0 *** 0.00 Received other (non-employment) services 390 73.9 42.0 314 62.6 52.9 11.3 *** 0.00 Received services related to discussion about youth’s general interest, life, and future plans 390 66.8 43.8 313 54.4 54.3 12.4 *** 0.00 Received life skills training 384 27.2 15.4 313 29.0 49.6 -1.8 0.63 Received help getting into a school or training program 384 19.1 18.9 312 17.2 41.1 2.0 0.53 Received help with accommodations 385 21.4 24.2 311 18.0 41.9 3.4 0.29 Received referrals to other agencies 383 2.1 11.7 311 1.4 12.6 0.8 0.47 Received transportation services 383 3.2 28.0 311 1.9 14.7 1.4 0.29 Received health services 383 5.4 42.4 311 4.5 22.6 0.9 0.59 Received case management services 383 1.2 48.1 311 0.3 5.8 0.9 0.19 Other non-employment services 383 7.4 30.6 311 3.4 19.9 4.0 ** 0.03 Received any employment or non-employment service 390 80.5 37.0 317 70.5 49.8 10.0 *** 0.00 Months of service (average)a 353 7.0 5.2 286 5.9 5.6 1.1 *** 0.01 Number of contacts with providers (average)a 351 82.4 124.4 284 82.2 128.8 0.2 0.98 Hours of service (average)a 349 316.8 562.0 278 321.6 630.2 -4.8 0.92
Number of providers (average) 386 1.7 1.4 313 1.4 1.5 0.3 *** 0.01
Any unmet service need 394 28.2 15.2 323 28.5 49.4 -0.3 0.93 Unmet service need: help finding a job 394 9.0 9.2 323 12.4 36.0 -3.4 0.16 Unmet service need: other employment services 394 13.9 7.6 323 15.8 39.9 -1.9 0.51 Unmet service need: basic skills training 394 2.1 40.5 323 2.2 16.0 -0.1 0.93 Unmet service need: other 394 17.4 49.3 323 14.3 38.3 3.1 0.29 Understands working does not stop Social Security benefits immediately 392 61.6 38.9 322 56.9 54.0 4.7 0.22

Interim Report on Broadened Horizons, Brighter Futures Appendix A: Additional Analyses and Technical Discussion
A.10
Treatment Group Control Group Unadjusted
Outcome N Mean Standard Deviation N Mean
Standard Deviation
Impact (Treatment-Control) P-Value
Understands working does not stop medical coverage immediately 392 74.6 52.9 322 73.8 48.0 0.8 0.82 Ever heard of EIE 392 30.9 50.2 322 13.2 36.9 17.7 *** 0.00 Ever heard of SEIE 392 15.8 51.9 322 7.6 29.0 8.1 *** 0.00 Ever heard of CDR/Age-18 medical redetermination 313 53.4 49.5 253 44.5 54.2 8.9 ** 0.05 Ever heard of PASS 392 32.9 44.8 322 7.7 29.1 25.2 *** 0.00 Ever heard of IDA (parent report) 313 39.7 41.1 253 2.5 17.0 37.3 *** 0.00 Ever heard of IDA (youth report) 330 31.0 49.9 265 6.0 26.0 25.0 *** 0.00 Ever heard of Medicaid-while-working or continued Medicaid eligibility 392 22.8 20.3 322 16.3 40.3 6.4 ** 0.04 Potential source of information on work and benefits: BHBF 392 18.1 28.0 322 0.0 0.0 18.1 *** 0.0 Potential source of information on work and benefits: SSA office 392 67.8 36.5 322 73.5 48.1 -5.6 0.12 Potential source of information on work and benefits: SSA website 392 3.8 34.8 322 5.0 23.7 -1.2 0.45 Potential source of information on work and benefits: Friends and family 392 7.4 50.1 322 8.9 31.1 -1.5 0.49 Potential source of information on work and benefits: Internet 392 13.5 50.0 322 17.1 41.1 -3.6 0.21 Potential source of information on work and benefits: Vocational rehabilitation agency 392 1.9 14.4 322 0.7 9.2 1.1 0.21 Potential source of information on work and benefits: Benefits planner 392 0.7 8.8 322 0.3 5.7 0.4 0.47 Potential source of information on work and benefits: Other 392 12.0 31.9 322 9.7 32.3 2.3 0.35 Type of service provider: BHBF 381 32.5 26.4 307 0.0 0.0 32.5 *** 0.00 Type of service provider: One-Stop Workforce Center 381 6.5 26.6 307 2.4 16.8 4.1 ** 0.02 Type of service provider: Schools or school districts 381 32.2 37.7 307 45.6 54.2 -13.5 *** 0.00 Type of service provider: Vocational rehabilitation agency 381 9.8 22.6 307 11.1 34.1 -1.2 0.62 Type of service provider: Work-related, sheltered workshop, employment agency, job training 381 4.7 45.5 307 2.2 16.0 2.5 * 0.10 Type of service provider: SSA office 381 6.6 7.4 307 7.0 27.7 -0.3 0.86 Type of service provider: Health services providers 381 6.6 50.3 307 6.6 27.0 0.0 0.99 Type of service provider: Other providers serving primarily people with disabilities 381 14.5 26.6 307 9.4 31.7 5.2 * 0.05 Type of service provider: All other providers 381 23.8 45.2 307 20.2 43.7 3.5 0.29

Interim Report on Broadened Horizons, Brighter Futures Appendix A: Additional Analyses and Technical Discussion
A.11
Treatment Group Control Group Unadjusted
Outcome N Mean Standard Deviation N Mean
Standard Deviation
Impact (Treatment-Control) P-Value
Employment Domain
Ever employed on paid jobs 403 22.8 44.8 334 14.6 38.7 8.2 *** 0.01 Ever employed on any (paid or unpaid) jobs 404 24.6 46.0 334 16.8 40.9 7.9 ** 0.01 Ever employed on unpaid jobs (but not on paid jobs) 403 1.6 13.6 334 2.1 15.8 -0.5 0.65 Percentage of weeks since RA employed on any (paid or unpaid) jobsa 393 11.9 27.6 327 9.7 26.7 2.2 0.28 Percentage of weeks since RA employed on paid jobsa 392 9.8 24.8 329 8.3 25.3 1.5 0.43 Percentage of weeks since RA employed on unpaid jobsa 403 1.5 11.5 332 1.0 7.1 0.5 0.50 Employment status at time of survey 399 332 0.81
Employed on paid job 9.7 9.1 0.6 Employed on unpaid job 1.7 1.0 0.6 Not employed, looking for work 18.6 16.9 1.7 Not employed, out of the work force 70.1 73.0 -2.9
Number of jobs (paid and unpaid)a 391 326 * 0.1
0 76.9 84.0 -7.1
1 21.0 14.8 6.3
2 or more 2.1 1.2 0.9
Number of jobs (average, paid and unpaid)a 391 0.3 0.6 326 0.2 0.5 0.1 * 0.06
Number of paid jobs (average)a 389 0.3 0.5 328 0.2 0.5 0.1 ** 0.02
Number of unpaid jobs (average)a 403 0.0 0.2 332 0.0 0.2 0.0 0.86
Employment rate on paid and unpaid jobs, by month after RA: Month 1a 392 10.1 28.6 326 9.2 28.7 0.9 0.69 Employment rate on paid and unpaid jobs, by month after RA: Month 2a 392 10.4 29.5 326 9.2 28.4 1.2 0.61 Employment rate on paid and unpaid jobs, by month after RA: Month 3a 392 13.0 31.4 326 9.2 26.7 3.7 0.12 Employment rate on paid and unpaid jobs, by month after RA: Month 4a 392 12.1 28.8 326 9.7 28.3 2.5 0.30 Employment rate on paid and unpaid jobs, by month after RA: Month 5a 392 13.9 34.7 326 10.0 28.0 3.8 0.12 Employment rate on paid and unpaid jobs, by month after RA: Month 6a 392 13.8 33.8 326 10.2 29.7 3.6 0.14 Employment rate on paid and unpaid jobs, by month after RA: Month 7a 392 13.4 33.1 326 10.1 26.3 3.2 0.19 Employment rate on paid and unpaid jobs, by month after RA: Month 8a 392 14.2 31.5 326 10.5 29.6 3.7 0.14

Interim Report on Broadened Horizons, Brighter Futures Appendix A: Additional Analyses and Technical Discussion
A.12
Treatment Group Control Group Unadjusted
Outcome N Mean Standard Deviation N Mean
Standard Deviation
Impact (Treatment-Control) P-Value
Employment rate on paid and unpaid jobs, by month after RA: Month 9a 392 14.7 33.4 327 10.9 29.1 3.8 0.14 Employment rate on paid and unpaid jobs, by month after RA: Month 10a 393 14.1 32.8 327 12.3 32.2 1.8 0.46 Employment rate on paid and unpaid jobs, by month after RA: Month 11a 393 14.3 32.8 327 12.5 32.8 1.8 0.48 Employment rate on paid and unpaid jobs, by month after RA: Month 12a 393 13.5 29.9 326 12.1 30.8 1.4 0.58 Employment rate on paid jobs, by month after RA: Month 1a 391 8.5 19.8 326 8.4 26.5 0.1 0.95 Employment rate on paid jobs, by month after RA: Month 2a 391 8.9 23.1 326 8.6 27.2 0.3 0.88 Employment rate on paid jobs, by month after RA: Month 3a 391 11.1 31.1 326 8.1 26.3 3.0 0.19 Employment rate on paid jobs, by month after RA: Month 4a 391 9.8 28.0 326 8.5 27.0 1.3 0.56 Employment rate on paid jobs by month after RA: Month 5a 391 12.0 32.9 326 8.9 25.4 3.1 0.19 Employment rate on paid jobs, by month after RA: Month 6a 392 11.6 32.3 326 8.9 27.7 2.6 0.25 Employment rate on paid jobs, by month after RA: Month 7a 392 11.1 29.8 326 8.6 24.8 2.5 0.28 Employment rate on paid jobs, by month after RA: Month 8a 392 12.2 30.6 326 9.3 27.9 3.0 0.21 Employment rate on paid jobs, by month after RA: Month 9a 391 12.3 30.5 327 9.4 28.1 2.9 0.23 Employment rate on paid jobs by month after RA: Month 10a 393 11.9 29.3 327 10.1 28.9 1.8 0.46 Employment rate on paid jobs, by month after RA: Month 11a 391 11.6 26.3 327 11.3 31.5 0.4 0.88 Employment rate on paid jobs, by month after RA: Month 12a 391 11.5 26.6 326 11.1 30.9 0.4 0.87 Cumulative employment rate on paid and unpaid jobs, by month following RA: Month 1a 392 10.2 26.8 326 9.2 26.6 1.0 0.65 Cumulative employment rate on paid and unpaid jobs, by month following RA: Month 2a 392 11.4 28.6 326 9.9 28.1 1.5 0.53 Cumulative employment rate on paid and unpaid jobs, by month following RA: Month 3a 392 13.5 33.1 326 10.7 30.2 2.8 0.26 Cumulative employment rate on paid and unpaid jobs, by month following RA: Month 4a 392 14.2 34.6 326 11.0 29.5 3.3 0.20 Cumulative employment rate on paid and unpaid jobs, by month following RA: Month 5a 392 16.7 38.5 326 11.6 27.9 5.1 * 0.06 Cumulative employment rate on paid and unpaid jobs, by month following RA: Month 6a 392 17.0 37.7 326 12.1 31.8 4.9 * 0.07 Cumulative employment rate on paid and unpaid jobs, by month following RA: Month 7a 392 18.4 39.7 326 12.5 32.2 5.9 ** 0.03

Interim Report on Broadened Horizons, Brighter Futures Appendix A: Additional Analyses and Technical Discussion
A.13
Treatment Group Control Group Unadjusted
Outcome N Mean Standard Deviation N Mean
Standard Deviation
Impact (Treatment-Control) P-Value
Cumulative employment rate on paid and unpaid jobs, by month following RA: Month 8a 392 18.9 40.1 326 13.2 32.7 5.7 ** 0.04 Cumulative employment rate on paid and unpaid jobs by month following RA: Month 9a 392 19.9 40.8 327 14.1 34.6 5.7 ** 0.04 Cumulative employment rate on paid and unpaid jobs by month following RA: Month 10a 393 20.8 41.1 327 14.9 35.3 5.9 ** 0.04 Cumulative employment rate on paid and unpaid jobs, by month following RA: Month 11a 393 22.6 43.0 327 15.3 35.6 7.4 ** 0.01 Cumulative employment rate on paid and unpaid jobs, by month following RA: Month 12a 393 23.1 43.3 327 15.9 36.3 7.1 ** 0.02 Cumulative employment rate on paid jobs, by month following RA: Month 1a 391 8.3 23.6 326 8.4 24.7 -0.1 0.96 Cumulative employment rate on paid jobs, by month following RA: Month 2a 391 9.4 26.9 326 9.1 27.1 0.3 0.88 Cumulative employment rate on paid jobs, by month following RA: Month 3a 391 12.0 32.2 326 9.7 29.2 2.2 0.35 Cumulative employment rate on paid jobs, by month following RA: Month 4a 391 12.3 31.5 326 10.0 29.8 2.3 0.34 Cumulative employment rate on paid jobs, by month following RA: Month 5a 391 14.4 33.9 326 10.6 30.4 3.8 0.14 Cumulative employment rate on paid jobs, by month following RA: Month 6a 392 14.9 36.1 326 10.7 29.8 4.1 0.11 Cumulative employment rate on paid jobs, by month following RA: Month 7a 392 16.0 36.5 326 10.6 29.8 5.4 ** 0.04 Cumulative employment rate on paid jobs, by month following RA: Month 8a 392 16.7 38.6 326 11.4 30.2 5.3 ** 0.05 Cumulative employment rate on paid jobs, by month following RA: Month 9a 392 17.8 39.1 327 12.1 31.8 5.7 ** 0.04 Cumulative employment rate on paid jobs, by month following RA: Month 10a 393 18.6 38.6 327 12.7 32.8 5.8 ** 0.04 Cumulative employment rate on paid jobs, by month following RA: Month 11a 392 20.6 40.5 327 13.5 33.3 7.1 ** 0.01 Cumulative employment rate on paid jobs, by month following RA: Month 12a 392 21.0 42.0 327 14.0 34.1 7.0 ** 0.01 Total hours worked on paid and unpaid jobsa 391 325 ** 0.02
Not employed 76.6 83.8 -7.1 >0 to 260 hours 10.9 4.7 6.2 >260 to 1,040 hours 7.7 8.2 -0.6 >1,040 hours 4.8 3.3 1.5
Total hours worked on paid and unpaid jobs (average)a 391 119.5 316.6 325 103.5 298.0 16.0 0.49
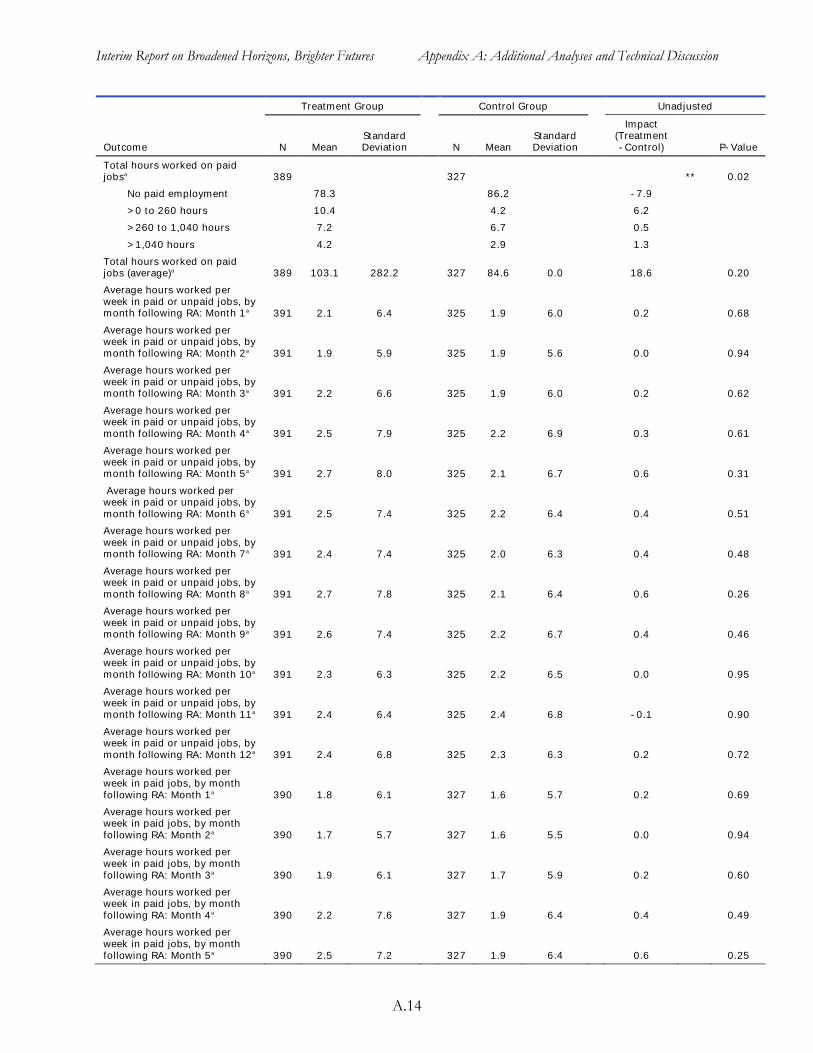
Interim Report on Broadened Horizons, Brighter Futures Appendix A: Additional Analyses and Technical Discussion
A.14
Treatment Group Control Group Unadjusted
Outcome N Mean Standard Deviation N Mean
Standard Deviation
Impact (Treatment-Control) P-Value
Total hours worked on paid jobsa 389 327 ** 0.02
No paid employment 78.3 86.2 -7.9 >0 to 260 hours 10.4 4.2 6.2 >260 to 1,040 hours 7.2 6.7 0.5 >1,040 hours 4.2 2.9 1.3
Total hours worked on paid jobs (average)a 389 103.1 282.2 327 84.6 0.0 18.6 0.20 Average hours worked per week in paid or unpaid jobs, by month following RA: Month 1a 391 2.1 6.4 325 1.9 6.0 0.2 0.68 Average hours worked per week in paid or unpaid jobs, by month following RA: Month 2a 391 1.9 5.9 325 1.9 5.6 0.0 0.94 Average hours worked per week in paid or unpaid jobs, by month following RA: Month 3a 391 2.2 6.6 325 1.9 6.0 0.2 0.62 Average hours worked per week in paid or unpaid jobs, by month following RA: Month 4a 391 2.5 7.9 325 2.2 6.9 0.3 0.61 Average hours worked per week in paid or unpaid jobs, by month following RA: Month 5a 391 2.7 8.0 325 2.1 6.7 0.6 0.31 Average hours worked per week in paid or unpaid jobs, by month following RA: Month 6a 391 2.5 7.4 325 2.2 6.4 0.4 0.51 Average hours worked per week in paid or unpaid jobs, by month following RA: Month 7a 391 2.4 7.4 325 2.0 6.3 0.4 0.48 Average hours worked per week in paid or unpaid jobs, by month following RA: Month 8a 391 2.7 7.8 325 2.1 6.4 0.6 0.26 Average hours worked per week in paid or unpaid jobs, by month following RA: Month 9a 391 2.6 7.4 325 2.2 6.7 0.4 0.46 Average hours worked per week in paid or unpaid jobs, by month following RA: Month 10a 391 2.3 6.3 325 2.2 6.5 0.0 0.95 Average hours worked per week in paid or unpaid jobs, by month following RA: Month 11a 391 2.4 6.4 325 2.4 6.8 -0.1 0.90 Average hours worked per week in paid or unpaid jobs, by month following RA: Month 12a 391 2.4 6.8 325 2.3 6.3 0.2 0.72 Average hours worked per week in paid jobs, by month following RA: Month 1a 390 1.8 6.1 327 1.6 5.7 0.2 0.69 Average hours worked per week in paid jobs, by month following RA: Month 2a 390 1.7 5.7 327 1.6 5.5 0.0 0.94 Average hours worked per week in paid jobs, by month following RA: Month 3a 390 1.9 6.1 327 1.7 5.9 0.2 0.60 Average hours worked per week in paid jobs, by month following RA: Month 4a 390 2.2 7.6 327 1.9 6.4 0.4 0.49 Average hours worked per week in paid jobs, by month following RA: Month 5a 390 2.5 7.2 327 1.9 6.4 0.6 0.25

Interim Report on Broadened Horizons, Brighter Futures Appendix A: Additional Analyses and Technical Discussion
A.15
Treatment Group Control Group Unadjusted
Outcome N Mean Standard Deviation N Mean
Standard Deviation
Impact (Treatment-Control) P-Value
Average hours worked per week in paid jobs, by month following RA: Month 6a 390 2.3 7.3 327 1.8 6.2 0.4 0.38 Average hours worked per week in paid jobs, by month following RA: Month 7a 390 2.2 6.9 327 1.8 6.1 0.4 0.42 Average hours worked per week in paid jobs, by month following RA: Month 8a 390 2.4 7.5 327 1.8 6.0 0.6 0.24 Average hours worked per week in paid jobs, by month following RA: Month 9a 390 2.3 6.9 327 1.9 6.3 0.5 0.34 Average hours worked per week in paid jobs, by month following RA: Month 10a 390 2.0 6.1 327 1.9 5.9 0.1 0.80 Average hours worked per week in paid jobs, by month following RA: Month 11a 390 2.0 6.2 327 2.0 6.4 0.0 0.99 Average hours worked per week in paid jobs, by month following RA: Month 12a 390 2.1 6.3 327 2.0 6.3 0.1 0.76 Annual earningsa 381 323 ** 0.03
No paid employment 77.0 85.4 -8.3 $1 to $1,000 5.1 3.3 1.7 >$1,000 to $5,000 10.7 5.2 5.5 >$5,000 7.2 6.1 1.1
Annual earnings (average, $)a 381 895 2,256 323 640 1,951 255.1 0.13 Earnings per month worked a 381 323 ** 0.01
No paid employment 77.0 85.4 -8.3 $1 to $500 8.9 6.7 2.2 >$500 14.1 7.9 6.2
Earnings per working month (average, $)a 381 150 348 323 89 243 61.0 *** 0.01 Average monthly earnings, by month following RA: Month 1 ($)a 389 59 197 326 48 159 11.5 0.44 Average monthly earnings, by month following RA: Month 2 ($)a 388 58 192 326 48 165 9.8 0.50 Average monthly earnings, by month following RA: Month 3 ($)a 388 63 206 326 51 183 12.2 0.41 Average monthly earnings, by month following RA: Month 4 ($)a 388 73 238 326 58 204 14.2 0.41 Average monthly earnings, by month following RA: Month 5 ($)a 388 82 252 326 58 205 23.9 0.17 Average monthly earnings, by month following RA: Month 6 ($)a 387 76 234 326 58 198 18.7 0.27 Average monthly earnings by month following RA: Month 7 ($)a 387 74 240 326 56 198 17.4 0.29 Average monthly earnings, by month following RA: Month 8 ($)a 387 82 247 326 58 201 23.5 0.17
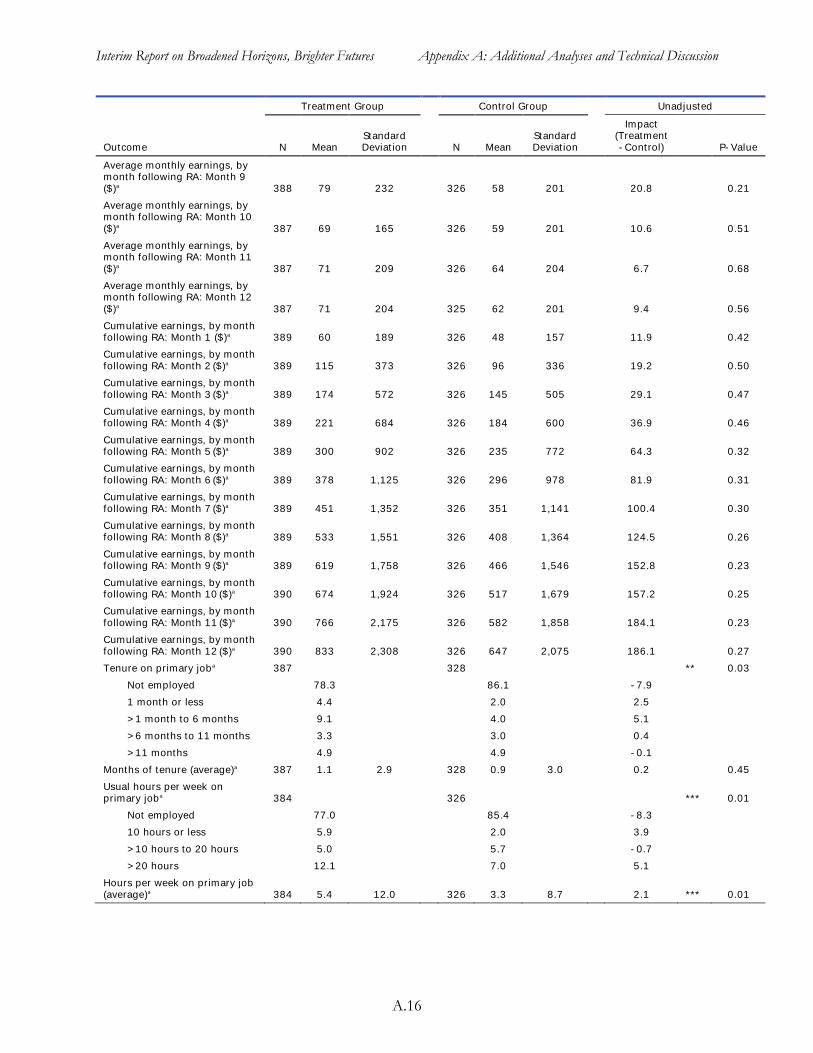
Interim Report on Broadened Horizons, Brighter Futures Appendix A: Additional Analyses and Technical Discussion
A.16
Treatment Group Control Group Unadjusted
Outcome N Mean Standard Deviation N Mean
Standard Deviation
Impact (Treatment-Control) P-Value
Average monthly earnings, by month following RA: Month 9 ($)a 388 79 232 326 58 201 20.8 0.21 Average monthly earnings, by month following RA: Month 10 ($)a 387 69 165 326 59 201 10.6 0.51 Average monthly earnings, by month following RA: Month 11 ($)a 387 71 209 326 64 204 6.7 0.68 Average monthly earnings, by month following RA: Month 12 ($)a 387 71 204 325 62 201 9.4 0.56 Cumulative earnings, by month following RA: Month 1 ($)a 389 60 189 326 48 157 11.9 0.42 Cumulative earnings, by month following RA: Month 2 ($)a 389 115 373 326 96 336 19.2 0.50 Cumulative earnings, by month following RA: Month 3 ($)a 389 174 572 326 145 505 29.1 0.47 Cumulative earnings, by month following RA: Month 4 ($)a 389 221 684 326 184 600 36.9 0.46 Cumulative earnings, by month following RA: Month 5 ($)a 389 300 902 326 235 772 64.3 0.32 Cumulative earnings, by month following RA: Month 6 ($)a 389 378 1,125 326 296 978 81.9 0.31 Cumulative earnings, by month following RA: Month 7 ($)a 389 451 1,352 326 351 1,141 100.4 0.30 Cumulative earnings, by month following RA: Month 8 ($)a 389 533 1,551 326 408 1,364 124.5 0.26 Cumulative earnings, by month following RA: Month 9 ($)a 389 619 1,758 326 466 1,546 152.8 0.23 Cumulative earnings, by month following RA: Month 10 ($)a 390 674 1,924 326 517 1,679 157.2 0.25 Cumulative earnings, by month following RA: Month 11 ($)a 390 766 2,175 326 582 1,858 184.1 0.23 Cumulative earnings, by month following RA: Month 12 ($)a 390 833 2,308 326 647 2,075 186.1 0.27 Tenure on primary joba 387 328 ** 0.03
Not employed 78.3 86.1 -7.9 1 month or less 4.4 2.0 2.5 >1 month to 6 months 9.1 4.0 5.1 >6 months to 11 months 3.3 3.0 0.4 >11 months 4.9 4.9 -0.1
Months of tenure (average)a 387 1.1 2.9 328 0.9 3.0 0.2 0.45 Usual hours per week on primary joba 384 326 *** 0.01
Not employed 77.0 85.4 -8.3 10 hours or less 5.9 2.0 3.9 >10 hours to 20 hours 5.0 5.7 -0.7 >20 hours 12.1 7.0 5.1
Hours per week on primary job (average)a 384 5.4 12.0 326 3.3 8.7 2.1 *** 0.01

Interim Report on Broadened Horizons, Brighter Futures Appendix A: Additional Analyses and Technical Discussion
A.17
Treatment Group Control Group Unadjusted
Outcome N Mean Standard Deviation N Mean
Standard Deviation
Impact (Treatment-Control) P-Value
Hourly wage rate on primary joba 381 324 * 0.06
Not employed 77.0 85.3 -8.3 Less than $7 6.4 4.2 2.2 $7 to $9 11.0 7.0 4.1 >$9 5.6 3.5 2.1
Health insurance coverage on primary joba 378 320 ** 0.02
Not employed 77.0 85.4 -8.4 Employed without health insurance 14.9 8.8 6.2 Employed with health insurance 8.1 5.9 2.2
Paid vacation/sick leave on primary joba 379 317 ** 0.02
Not employed 77.0 85.4 -8.4 Employed w/o paid vacation/sick leave 15.2 8.9 6.3 Employed with paid vacation/sick leave 7.8 5.7 2.1
Education Domain
Ever enrolled in school in the year following RA or completed high school by the time of the 12-month follow-up survey 391 81.6 41.5 322 83.8 40.3 -2.2 0.46 Ever enrolled in school 381 56.4 53.0 316 57.5 54.1 -1.0 0.80 High school diploma/GED/certificate or higher 399 51.4 53.4 333 48.4 54.7 3.0 0.44 Type of School Attended 380 316 0.39
Did not attend 43.7 42.5 1.1 Elementary/middle/ regular high school 23.6 23.0 0.6 Special school for the disabled or home school 9.2 13.9 -4.6 Postsecondary institution 20.9 19.1 1.8 GED/Adult continuing education 2.6 1.5 1.1
Number of months in school 376 311 0.97 None 44.1 43.2 1.0 <Nine months 16.5 16.9 -0.4 Nine or more months 39.4 40.0 -0.6
Income Domain
Annual income from earnings and SSA benefits (average, $)a 381 6,762 3,783 323 6,666 3,387 96.0 0.72 Distribution of total annual incomea 381 323 0.17
<$5,000 25.8 22.2 3.6 $5,000 to <$7,000 41.1 38.6 2.6 $7,000 to <$10,000 23.4 31.0 -7.6 $10,000 or more 9.6 8.2 1.5
Percentage of total annual income from earningsa 381 11.5 29.5 323 7.0 20.2 4.5 ** 0.02

Interim Report on Broadened Horizons, Brighter Futures Appendix A: Additional Analyses and Technical Discussion
A.18
Treatment Group Control Group Unadjusted
Outcome N Mean Standard Deviation N Mean
Standard Deviation
Impact (Treatment-Control) P-Value
Youth income, by month following RA: Month 1 ($)a 389 545 341 326 578 275 -33.3 0.16 Youth income, by month following RA: Month 2 ($)a 388 542 347 326 579 271 -36.7 0.12 Youth income, by month following RA: Month 3 ($)a 388 548 349 326 566 300 -18.7 0.44 Youth income, by month following RA: Month 4 ($)a 388 557 366 326 559 314 -2.0 0.94 Youth income, by month following RA: Month 5 ($)a 388 574 364 326 551 326 23.8 0.36 Youth income, by month following RA: Month 6 ($)a 387 568 363 326 549 327 19.5 0.45 Youth income, by month following RA: Month 7 ($)a 387 565 370 326 548 329 16.2 0.53 Youth income, by month following RA: Month 8 ($)a 387 573 372 326 555 339 18.0 0.50 Youth income, by month following RA: Month 9 ($)a 388 571 366 326 553 333 17.7 0.50 Youth income, by month following RA: Month 10 ($)a 387 561 331 326 547 334 14.0 0.59 Youth income, by month following RA: Month 11 ($)a 387 562 345 326 548 335 14.2 0.58 Youth income, by month following RA: Month 12 ($)a 387 560 339 325 547 332 13.7 0.59 Any benefit receipt during the year following RA b 454 83.9 36.8 396 85.1 35.7 -1.2 0.64 Number of months of benefit receipt during the year following RA (average)b 454 9.5 466.4 396 9.3 472.4 0.3 0.38 Distribution of annual benefit amountb 454 396 0.94
None 16.1 14.9 1.2 $1 to $6,500 24.2 24.5 -0.3 >$6,500 to $8,000 50.4 52.0 -1.6 >$8,000 9.3 8.6 0.7
Annual benefit amount (average, $)b 454 5,766 3,235 396 5,741 3,320 25.7 0.91 SSA benefit amount, by month following RA: Month 1($)b 454 480 277 396 509 276 -28.8 0.13 SSA benefit amount, by month following RA: Month 2 ($)b 454 478 278 396 503 276 -25.4 0.18 SSA benefit amount, by month following RA: Month 3 ($)b 454 479 280 396 491 282 -12.7 0.51 SSA benefit amount, by month following RA: Month 4 ($)b 454 479 283 396 478 291 0.2 0.99 SSA benefit amount, by month following RA: Month 5 ($)b 454 483 285 396 467 303 15.6 0.44 SSA benefit amount, by month following RA: Month 6 ($)b 454 484 290 396 470 304 14.6 0.48 SSA benefit amount, by month following RA: Month 7 ($)b 454 483 284 396 464 307 18.4 0.37 SSA benefit amount by month following RA: Month 8 ($)b 454 483 288 396 470 309 13.1 0.52 SSA benefit amount, by month following RA: Month 9 ($)b 454 480 289 396 472 308 8.4 0.68 SSA benefit amount, by month following RA: Month 10 ($)b 454 481 286 396 467 307 14.6 0.47
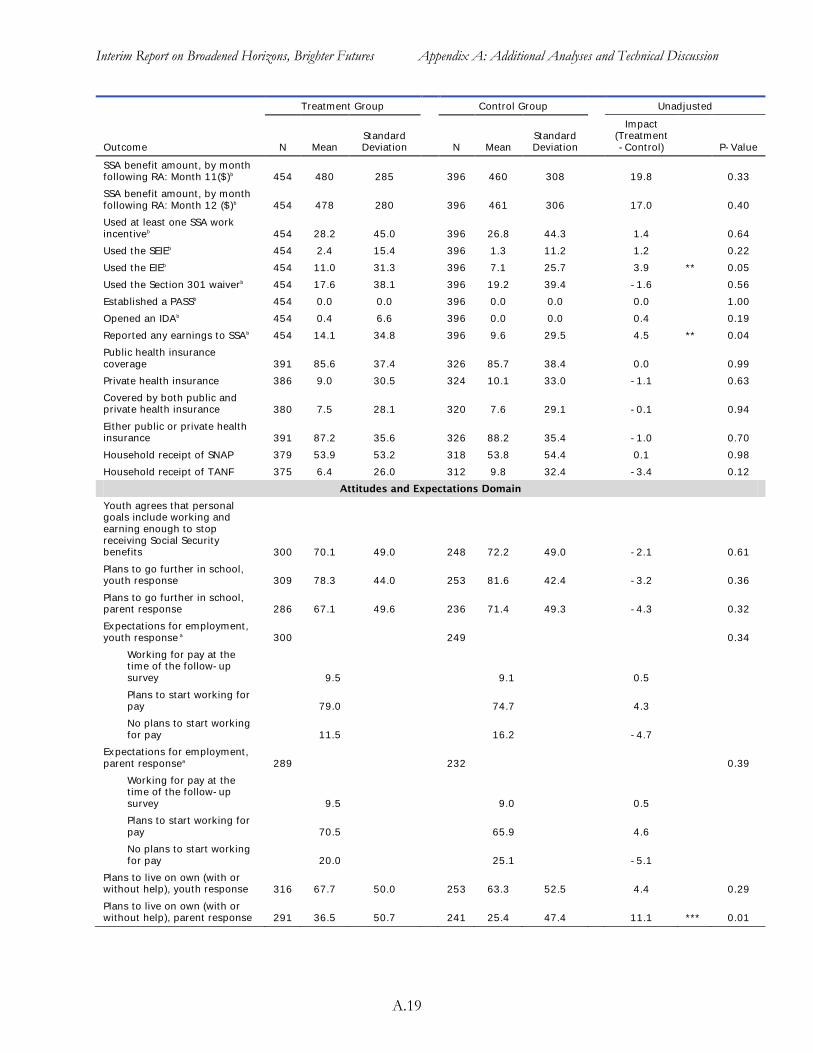
Interim Report on Broadened Horizons, Brighter Futures Appendix A: Additional Analyses and Technical Discussion
A.19
Treatment Group Control Group Unadjusted
Outcome N Mean Standard Deviation N Mean
Standard Deviation
Impact (Treatment-Control) P-Value
SSA benefit amount, by month following RA: Month 11($)b 454 480 285 396 460 308 19.8 0.33 SSA benefit amount, by month following RA: Month 12 ($)b 454 478 280 396 461 306 17.0 0.40 Used at least one SSA work incentiveb 454 28.2 45.0 396 26.8 44.3 1.4 0.64 Used the SEIEb 454 2.4 15.4 396 1.3 11.2 1.2 0.22 Used the EIEb 454 11.0 31.3 396 7.1 25.7 3.9 ** 0.05 Used the Section 301 waiverb 454 17.6 38.1 396 19.2 39.4 -1.6 0.56 Established a PASSb 454 0.0 0.0 396 0.0 0.0 0.0 1.00 Opened an IDAb 454 0.4 6.6 396 0.0 0.0 0.4 0.19 Reported any earnings to SSAb 454 14.1 34.8 396 9.6 29.5 4.5 ** 0.04 Public health insurance coverage 391 85.6 37.4 326 85.7 38.4 0.0 0.99 Private health insurance 386 9.0 30.5 324 10.1 33.0 -1.1 0.63 Covered by both public and private health insurance 380 7.5 28.1 320 7.6 29.1 -0.1 0.94 Either public or private health insurance 391 87.2 35.6 326 88.2 35.4 -1.0 0.70 Household receipt of SNAP 379 53.9 53.2 318 53.8 54.4 0.1 0.98 Household receipt of TANF 375 6.4 26.0 312 9.8 32.4 -3.4 0.12
Attitudes and Expectations Domain
Youth agrees that personal goals include working and earning enough to stop receiving Social Security benefits 300 70.1 49.0 248 72.2 49.0 -2.1 0.61 Plans to go further in school, youth response 309 78.3 44.0 253 81.6 42.4 -3.2 0.36 Plans to go further in school, parent response 286 67.1 49.6 236 71.4 49.3 -4.3 0.32 Expectations for employment, youth response a 300 249 0.34
Working for pay at the time of the follow-up survey 9.5 9.1 0.5 Plans to start working for pay 79.0 74.7 4.3 No plans to start working for pay 11.5 16.2 -4.7
Expectations for employment, parent responsea 289 232 0.39
Working for pay at the time of the follow-up survey 9.5 9.0 0.5 Plans to start working for pay 70.5 65.9 4.6 No plans to start working for pay 20.0 25.1 -5.1
Plans to live on own (with or without help), youth response 316 67.7 50.0 253 63.3 52.5 4.4 0.29 Plans to live on own (with or without help), parent response 291 36.5 50.7 241 25.4 47.4 11.1 *** 0.01

Interim Report on Broadened Horizons, Brighter Futures Appendix A: Additional Analyses and Technical Discussion
A.20
Treatment Group Control Group Unadjusted
Outcome N Mean Standard Deviation N Mean
Standard Deviation
Impact (Treatment-Control) P-Value
Internal locus of control (average of index) 302 3.3 72.2 254 3.2 72.5 0.1 0.34 External locus of control (average of index) 300 2.6 80.1 249 2.5 76.9 0.1 0.30 Makes snacks or sandwiches (most/some of the time) 397 81.7 41.3 328 82.6 41.5 -0.9 0.77 Rides public transportation alone (most/some of the time) 397 56.4 52.9 327 52.5 54.7 3.9 0.32 Picks clothes to wear (most/some of the time) 397 87.5 35.3 328 87.2 36.6 0.3 0.89 Decides to spend own money (most/some of the time) 396 72.3 47.8 327 76.6 46.2 -4.3 0.21 Decides how to spend free time (most/some of the time) 396 83.2 39.9 328 82.4 41.6 0.7 0.81 Gets together with friends often or sometimes 395 65.7 50.7 325 63.4 52.7 2.2 0.55
Exploratory Analysis
Ever enrolled in training in the year following RA 393 10.2 32.4 327 4.1 21.7 6.2 *** 0.00 Number of months in a training program 393 327 *** 0.01
None 89.8 95.9 -6.2 <Nine months 2.9 1.8 1.2 Nine or more months 7.3 2.3 5.0
Number of months in a training program (average) 393 1.0 3.3 327 0.3 2.1 0.6 *** 0.00 Participated in any productive activity 385 74.1 46.8 319 67.9 51.1 6.2 * 0.09 Analytic Sample Size 404 334 Research Sample Size 460 399
Sources: YTD 12-month follow-up survey and SSA administrative records.
Notes: We weighted the statistics to adjust for non-response to the 12-month survey. aIndicates outcome measures for which we used a multiple imputation procedure for missing information. See Section E of this appendix. bIndicates outcomes based on SSA administrative records. For all outcomes from administrative records, we used the full research sample and did not weight to adjust for non-response to the 12-month survey.
RA = random assignment
*/**/***Impact estimate is significantly different from zero at the .10/.05/.01 level using either a two-tailed t-test or a chi-square test.
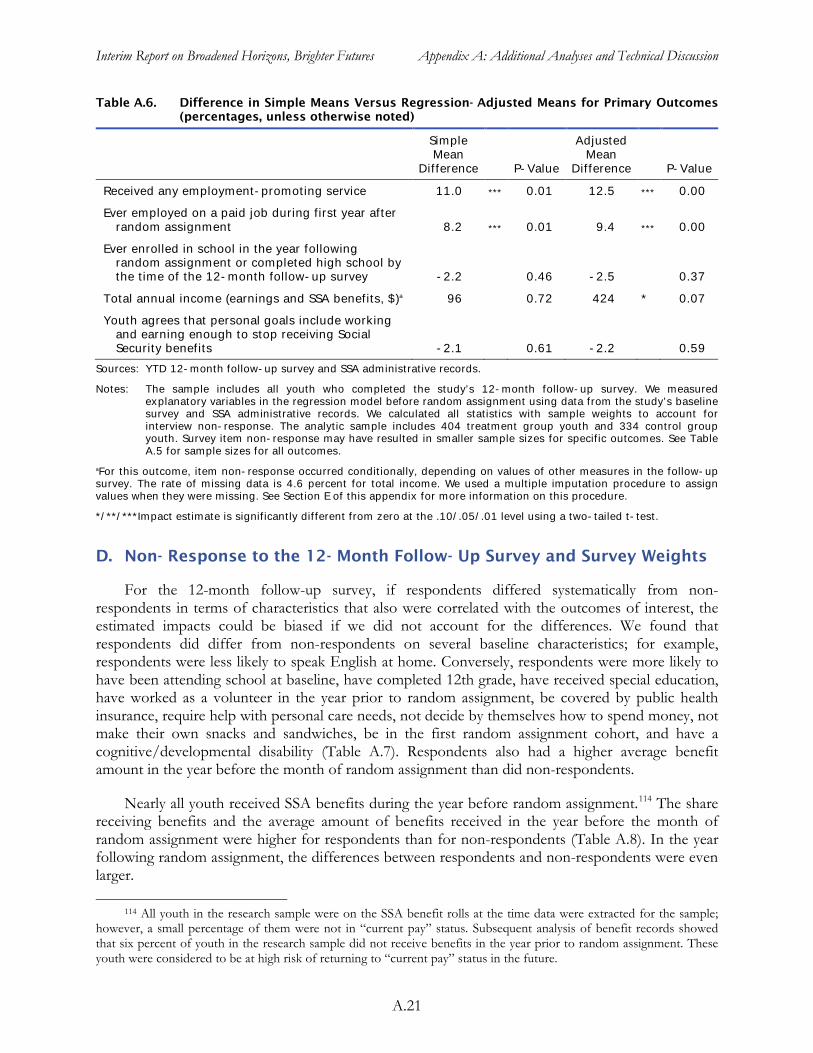
Interim Report on Broadened Horizons, Brighter Futures Appendix A: Additional Analyses and Technical Discussion
A.21
Table A.6. Difference in Simple Means Versus Regression- Adjusted Means for Primary Outcomes (percentages, unless otherwise noted)
Simple Mean
Difference
P-Value
Adjusted Mean
Difference
P-Value
Received any employment-promoting service 11.0 *** 0.01 12.5 *** 0.00
Ever employed on a paid job during first year after random assignment 8.2 *** 0.01 9.4 *** 0.00
Ever enrolled in school in the year following random assignment or completed high school by the time of the 12-month follow-up survey -2.2 0.46 -2.5 0.37
Total annual income (earnings and SSA benefits, $)a 96 0.72 424 * 0.07
Youth agrees that personal goals include working and earning enough to stop receiving Social Security benefits -2.1 0.61 -2.2 0.59
Sources: YTD 12-month follow-up survey and SSA administrative records.
Notes: The sample includes all youth who completed the study’s 12-month follow-up survey. We measured explanatory variables in the regression model before random assignment using data from the study’s baseline survey and SSA administrative records. We calculated all statistics with sample weights to account for interview non-response. The analytic sample includes 404 treatment group youth and 334 control group youth. Survey item non-response may have resulted in smaller sample sizes for specific outcomes. See Table A.5 for sample sizes for all outcomes.
aFor this outcome, item non-response occurred conditionally, depending on values of other measures in the follow-up survey. The rate of missing data is 4.6 percent for total income. We used a multiple imputation procedure to assign values when they were missing. See Section E of this appendix for more information on this procedure.
*/**/***Impact estimate is significantly different from zero at the .10/.05/.01 level using a two-tailed t-test.
D. Non- Response to the 12- Month Follow- Up Survey and Survey Weights
For the 12-month follow-up survey, if respondents differed systematically from non-respondents in terms of characteristics that also were correlated with the outcomes of interest, the estimated impacts could be biased if we did not account for the differences. We found that respondents did differ from non-respondents on several baseline characteristics; for example, respondents were less likely to speak English at home. Conversely, respondents were more likely to have been attending school at baseline, have completed 12th grade, have received special education, have worked as a volunteer in the year prior to random assignment, be covered by public health insurance, require help with personal care needs, not decide by themselves how to spend money, not make their own snacks and sandwiches, be in the first random assignment cohort, and have a cognitive/developmental disability (Table A.7). Respondents also had a higher average benefit amount in the year before the month of random assignment than did non-respondents.
Nearly all youth received SSA benefits during the year before random assignment.114
114 All youth in the research sample were on the SSA benefit rolls at the time data were extracted for the sample;
however, a small percentage of them were not in “current pay” status. Subsequent analysis of benefit records showed that six percent of youth in the research sample did not receive benefits in the year prior to random assignment. These youth were considered to be at high risk of returning to “current pay” status in the future.
The share receiving benefits and the average amount of benefits received in the year before the month of random assignment were higher for respondents than for non-respondents (Table A.8). In the year following random assignment, the differences between respondents and non-respondents were even larger.

Interim Report on Broadened Horizons, Brighter Futures Appendix A: Additional Analyses and Technical Discussion
A.22
Table A.7. Baseline Characteristics for Respondents and Non- Respondents (percentages, unless otherwise noted)
All Respondents Non-
Respondents Difference P-Value
Baseline Survey Data
Demographic Characteristics Race 0.18
White 36.2 37.6 26.8 10.8 Black 51.7 50.2 61.6 -11.4 American Indian/AK/HI/Pacific Islander 2.1 2.4 0.0 2.4 Asian 0.8 0.8 0.9 -0.1 Other or unknown 9.2 9.0 10.7 -1.8
Hispanic 42.3 43.4 35.1 8.3 0.10 Primarily speaks English at home 77.3 76.2 84.7 -8.5 ** 0.05
Education School Attendance *** 0.01
Does not attend school 43.7 41.6 57.4 -15.8 Attends regular high school 33.4 34.7 25.0 9.7 Attends special high school 7.2 7.9 2.8 5.1 Attends other school 15.7 15.8 14.8 1.0
Attainment: Highest Grade *** 0.01 9th grade or less 10.6 9.1 20.6 -11.6 10th or 11th grade 33.8 33.6 35.1 -1.5 12th grade 48.4 49.8 39.2 10.7 College or technical school 1.4 1.3 2.1 -0.8 Other 5.8 6.3 3.1 3.2
High school diploma, GED, or certificate of completion 32.5 32.3 33.9 -1.6 0.74
Ever received special education 76.1 77.1 69.6 7.4 * 0.09
Employment Received Job training in last year 25.0 25.5 21.6 3.9 0.37 Worked as a volunteer in last year 15.1 15.9 9.8 6.1 * 0.09 Worked for pay in last year 18.7 18.6 19.6 -1.1 0.79 Worked for pay in last month 8.2 8.1 8.9 -0.8 0.77 Never worked for pay at baseline 65.0 65.9 58.9 7.0 0.15
Living Arrangements and Household Composition Living Arrangements 0.32
Two-parent family 28.5 29.7 20.7 9.0 Single-parent family 63.2 62.3 69.4 -7.1 Group home 0.8 1.0 0.0 1.0 Other institution 2.8 2.7 3.6 -0.9 Lives alone or with friends 4.6 4.4 6.3 -1.9
Average number of people in household 4.1 4.1 4.1 -0.1 0.72 Lives with others with disabilities 39.4 39.6 38.1 1.5 0.77
Health Insurance Coverage Public health insurance 88.6 89.4 83.2 6.2 * 0.06 Private health insurance 8.8 8.9 8.1 0.7 0.80 Either public or private health insurance 5.9 6.1 4.5 1.6 0.49 Both public and private health insurance 91.1 91.8 86.9 4.8 0.10
Family Socioeconomic Status Annual Income Level 0.30
Less than $10,000 37.9 36.9 44.9 -8.0 $10,000 – $24,999 39.0 39.4 35.7 3.7 $25,000 or more 23.1 23.7 19.4 4.3
Parents' Education Mother high school graduate 65.6 65.3 67.8 -2.5 0.64 Father high school graduate 65.1 65.2 60.0 5.2 0.68
Parents' Employment Status Mother employed 45.1 44.9 46.7 -1.8 0.75 Father employed 60.1 59.7 73.3 -13.7 0.29
Self-Reported Health Status 0.13 Excellent 22.0 21.9 23.2 -1.4 Very good/good 56.0 57.2 48.2 9.0 Fair/poor 21.9 20.9 28.6 -7.7

Interim Report on Broadened Horizons, Brighter Futures Appendix A: Additional Analyses and Technical Discussion
A.23
All Respondents Non-
Respondents Difference P-Value
Assistance Reading, hearing, speaking, or walking aids 16.4 16.8 14.3 2.5 0.51 Help with personal care needs 19.7 21.2 9.8 11.3 *** 0.01
Independent Activities and Decision Making Makes snacks or sandwiches (most/some of the
time) 84.6 83.4 92.0 -8.5 ** 0.02 Rides public transportation alone (most/some of
the time 54.2 53.5 58.9 -5.4 0.29 Picks clothes to wear (most/some of the time) 91.0 90.6 93.8 -3.1 0.28 Decides how to spend own money (most/some of
the time) 77.0 75.7 85.6 -9.9 ** 0.02 Decides how to spend free time (most/some of the
time) 85.6 85.0 89.8 -4.8 0.18
Expectations About the Future Expects to live independently (w/ or w/o help) 68.3 67.7 71.9 -4.2 0.41 Expects to continue education 88.1 88.7 84.7 4.0 0.26 Expects to work at least part-time for pay 90.4 90.7 88.4 2.3 0.48
Random Assignment Cohort Before July 1, 2009 65.9 67.2 57.1 10.1 ** 0.04
Administrative Data
Demographic Characteristics Male 59.6 59.2 62.5 -3.3 0.51 Age in Years 0.44
14–17 19.4 19.8 17.0 2.8 18–21 69.1 68.3 74.1 -5.8 22–25 11.5 11.9 8.9 3.0 Average age (years) 19.1 19.1 19.0 0.1 0.56
Language 0.60 English 73.4 72.6 78.6 -5.9 Spanish 24.9 25.6 20.5 5.1 Other 0.6 0.5 0.9 -0.4 Unknown/missing 1.1 1.2 0.0 1.2
Benefits SSA Beneficiary Status
SSI (only, or concurrent with CDB or DI) 96.8 96.6 98.2 -1.6 0.37 Duration of benefit entitlement (years) 8.7 8.7 8.4 0.4 0.49 Benefit amount in year before month of RA ($) 6,201 6,315 5,451 864 *** 0.00
Disability Primary Disabling Condition (SSA data) *** 0.00
Mental illness 16.6 15.4 24.8 -9.4 Cognitive/developmental disability 43.1 45.7 25.7 20.0 Learning disability/ADD 21.2 19.4 33.0 -13.6 Physical disability 14.0 14.0 13.8 0.2 Speech, hearing, visual impairment 5.1 5.5 2.8 2.7
Duration of disability (years) 9.1 9.1 8.9 0.2 0.67 Earnings in year before year of RA ($) 871 844 1,039 -195 0.48
Sample Size 850 738 112
Sources: YTD baseline survey and SSA administrative records.
Notes: The table includes all of the main baseline characteristics (all of those included in Table II.2) and any baseline characteristics for which differences between respondents and non-respondents are statistically significant at the .10 level. The analysis does not include the nine research sample youth who were deceased at the time of the 12-month survey. Baseline survey item non-response may have resulted in smaller sample sizes for some characteristics than indicated at the bottom of the table. Missing information on primary disabling condition and duration of disability resulted in a smaller sample size for these characteristics than shown at the bottom of the table.
RA = random assignment.
*/**/***Difference is significantly different from zero at the .10/.05/.01 level using either a two-tailed t-test or a chi-square test.

Interim Report on Broadened Horizons, Brighter Futures Appendix A: Additional Analyses and Technical Discussion
A.24
Table A.8. Annual SSA Benefit Receipt for Respondents and Non- Respondents
All Respondent Non-
Respondent Difference P-Value
Benefit Receipt (%) Any SSA benefits in year before month of
random assignmenta 94.1 95.3 86.6 8.7 *** 0.00 Any SSA benefits in year after month of
random assignment 84.5 87.1 67.0 20.2 *** 0.00
Benefit Amount ($) SSA benefits in year before month of
random assignment 6,201 6,315 5,451 864 *** 0.00 SSA benefits in year after month of random
assignment 5,754 5,994 4,177 1,817 *** 0.00
Sample Size 850 738 112 Source: SSA administrative records.
Notes: We adjusted all benefit amount variables for inflation to 2008 dollars using the average wage index. We defined the previous year as the 12 months preceding the month of random assignment. We defined the year following random assignment as the 12 months following the month of random assignment. The analysis does not include the nine research sample youth who were deceased at the time of the 12-month survey.
aAll youth in the research sample were on the SSA benefit rolls at the time data were extracted for the sample; however, a small percentage of them were not in “current pay” status. Subsequent analysis of benefit records showed that some youth in the research sample did not receive benefits in the year before the month of random assignment. See Figure A.2 for additional details.
*/**/***Difference is significantly different from zero at the .10/.05/.01 level, using a two-tailed t-test.
One reason for the difference is that youth no longer receiving benefits were more difficult to locate through SSA records using the most recent beneficiary contact information. Thus, youth who terminated benefits at some point during the year following random assignment were more likely to be non-respondents. Even though the results showed some selectivity in who responded, we did not find that the estimated impact of BHBF on the receipt of any SSA benefits in the year following random assignment differed between the respondent sample and the full research sample (Table A.9).115
In our analysis, we used weights that adjust for survey non-response to make respondent cases more representative of the original sample and reduce the potential for non-response bias. For the weight adjustments, we used forward and backward stepwise logistic models to estimate the propensity for a sample member to respond. We used the inverse of the propensity score as the non-response weight. We computed the models separately for treatment and control observations. To select variables in the logistic model, we included variables with a statistical significance level of 0.30 or lower (instead of the standard 0.05) because the purpose of the model was to improve estimation of the propensity score, not to identify statistically significant factors related to response. For both the control and treatment groups, the explanatory variables included primary disabling
However, the estimated impacts of BHBF on the number of months of benefit receipt and the average annual benefit amount did differ between the respondent sample and the full research sample: the impact estimates were somewhat larger and statistically significant in the full research sample. For other outcomes measured in administrative data, namely the use of SSA work incentives, we found little difference in levels or estimated impacts between the respondent and full research samples.
115 This analysis was based on a regression model that included the Social Security benefit amount in the year
before the month of random assignment among the explanatory variables.

A.25
Table A.9. Impacts on Outcomes Measured with Administrative Records, Respondent and Full Sample (percentages, unless otherwise noted)
12-Month Survey Respondent Sample Full Randomly Assigned Sample
Treatment Group Treatment Group
Observed
Mean
Estimated Mean w/o
BHBF Impact P-Value Observed
Mean
Estimated Mean w/o
BHBF Impact P-Value
Receipt of SSA Benefits (SSI, DI, or CDB) Any SSA benefits 85.8 86.2 -0.4 0.79 83.9 83.6 0.3 0.87 Number of months of benefit receipt during
the year following random assignment 9.7 9.3 0.4 0.12 9.5 8.9 0.6 ** 0.01
Benefit Amount Distribution of annual benefit amount 0.16 0.22
None 14.2 14.2 0.0 16.1 16.8 -0.7 $1 to $6,500 24.8 26.4 -1.6 24.2 27.9 -3.7 >$6,500 to $8,000 51.4 52.9 -1.6 50.4 48.2 2.3 >$8,000 9.6 6.5 3.1 9.3 7.1 2.1
Annual benefit amount ($) 5,867 5,688 179 0.27 5,766 5,455 312 ** 0.04
Use of SSA Work Incentives Used at least one SSA work incentive 28.6 24.0 4.7 0.13 28.2 26.2 2.0 0.48 Used the SEIE 2.3 1.2 1.2 0.23 2.4 1.4 1.0 0.31 Used the EIE 10.8 7.0 3.8 * 0.08 11.0 6.9 4.1 ** 0.04 Used the Section 301 waiver 18.2 17.4 0.8 0.75 17.6 18.7 -1.1 0.64 Established a PASSa 0.0 0.0 0.0 1.00 0.0 0.0 0.0 1.00 Opened an IDAa 0.4 0.0 0.4 0.25 0.4 0.0 0.4 0.19
Source: SSA administrative records.
Notes: The table reports observed means or percentages for the treatment group, estimates of what the treatment group means or percentages would have been in the absence of BHBF, and regression-adjusted impact estimates (see Chapter II, Section A.4). We measured explanatory variables in the regression model before random assignment using data from the study’s baseline survey and SSA administrative records. For the respondent sample, we calculated all statistics using sample weights to account for interview non-response. The 12-month survey respondent sample (also referred to as the analytic sample) includes 404 treatment group youth and 334 control group youth. The full randomly assigned sample (also referred to as the research sample) includes 454 treatment group youth and 396 control group youth. This analysis does not include nine research sample youth who were deceased at the time of the 12-month survey.
We adjusted all benefit amount variables for inflation to 2008 dollars using the average wage index. aThe control group members did not use this work incentive; hence, the table reports the unadjusted means and unadjusted impacts.
*/**/***Impact estimate is significantly different from zero at the .10/.05/.01 level using either a two-tailed t-test or a chi-square test.

Interim Report on Broadened Horizons, Brighter Futures Appendix A: Additional Analyses and Technical Discussion
A.26
condition, type of benefits, self reported health status, educational attainment, mother’s education, father’s education, father’s employment status, living arrangement, and public or private health insurance. Additional characteristics for the control group included age, representative payee type, duration of disability, duration of benefit entitlement, school attendance, lives with others with disabilities, and mother’s employment status. For the treatment group, additional characteristics included ever received special education; receives TANF or family assistance; requires help with basic care needs; uses reading, hearing, speaking or walking aids; received job training in the prior year; expects to work at least part time for pay; primarily speaks English at home; expects to live independently; and decides how to spend free time.
E. Missing Information for Independent and Dependent Variables
For most of the explanatory characteristics (independent variables) used in our regression models, we had few observations with missing information. For these variables, generally with far fewer than five percent of observations missing information, we replaced the missing information with the mean value from the non-missing observations. For three variables with a larger share of missing observations, we used dummy variables to indicate that the information was missing: mother’s education (6 percent missing), father currently employed (32 percent missing), and youth expects to live independently in the future (23 percent missing). For the subgroup analyses, we omitted observations if the subgroup information was missing.
We typically excluded observations with missing information on an outcome measure (dependent variable) from any analysis of that outcome. For some outcome measures, however, the elimination of missing observations would produce potential bias. Specifically, the potential for bias occurs when the outcome is known to have a specific value for some observations conditional on another outcome. For example, for youth reporting that they did not work for pay in the year following random assignment, earnings in that year are known to be zero. Missing information thus arises only for observations of youth who worked for pay during the year. In this example, the elimination of missing observations would imply elimination only of observations for youth who worked for pay, resulting in an underestimate of average earnings. The degree to which the earnings estimate is too low could differ by treatment status (for example, if treatment youth were more likely to work for pay and just as likely to respond to questions on earnings). For almost all outcome measures with conditionally missing data, no more than 6 percent of observations had missing data. The only exceptions were the amount of services received (13 to 15 percent of youth were missing data) and future employment expectations (26 percent were missing the youth response, and 29 percent were missing the parent response). In Table A.5, we provide the sample size (N) for every outcome measure.
For outcome measures for which information was missing conditional on another outcome, we used a multiple imputation procedure, as described in Puma et al. (2009). Here, we provide a conceptual description of the imputation process. We first imputed the missing values by using a stochastic regression model. The imputation model included all variables in our impact analysis model, plus key outcome measures and a stochastic residual term to match the observed variance in the sample. We performed the process ten times to create ten separate analytic data sets. We then conducted the impact analysis separately on each of the ten data sets. The impact estimate is computed as the simple average of the impact estimates across the ten data sets. The standard error of the combined impact estimate is calculated from within-imputation variance and between-
Interim Report on Broadened Horizons, Brighter Futures Appendix A: Additional Analyses and Technical Discussion
A.27
imputation variance components. To implement the analysis, we used Stata procedures written by Royston (2007), Carlin et al. (2008), and Royston et al. (2009).116
F. Monthly SSA Benefits Before and After Random Assignment
Sections A through E of this appendix have provided detailed discussion of analytic issues raised in Chapter II. In the remaining sections of this appendix, we provide additional analyses to support the results of the impact analysis.
In Figure A.1 and Table A.10, we present the unadjusted average monthly benefit amount for youth in the treatment and control groups before and after random assignment. Over the period before random assignment, the average benefit amount fell for both the treatment and control groups and the average benefit amount for the treatment group was statistically lower than that of the control group in several months. Following random assignment, the average benefit amount continued to fall for the control group for about five months; however, it was relatively stable for the treatment group. To investigate whether the Section 301 waiver may have contributed to the difference between these two time-trends, we stratified the research sample according to whether the research sample members were age 17 or 18 at baseline (and thus could potentially benefit from the Section 301 waiver in the year after random assignment), or were younger or older. Among the approximately one-third of the sample members who were age 17 or 18, the average benefit amount fell in the year after random assignment for those in the control group but was fairly stable for those in the treatment group (results not shown). Among the remaining sample members, the average benefit amount was fairly stable in the year after random assignment for both treatment and control group members. These findings suggest that the Section 301 waiver may have been a driver of the treatment-control difference in the rate of decline in the average benefit amount following random assignment. However, the findings presented in Table II.3 are not consistent with this conclusion because they show that BHBF had no impact on the rate at which research sample members used that the Section 301 waiver.117
116 Impact estimates for outcomes with conditionally missing data would be biased if we did not adjust for missing
information. However, when we calculated the biased impact estimates by dropping observations with missing outcome information, we found results very similar to those of the multiple imputation procedure. The impact estimates were slightly different, but the pattern of statistical significance was the same for most outcomes, which is not surprising given the relatively small share of observations with missing outcome information. For three outcomes, the impact estimates with multiple imputation were somewhat different from those calculated by dropping observations with missing outcome information. For average annual earnings, the impact estimate with multiple imputation was $306 (p=0.07) and the impact estimate without multiple imputation was $206 (p-value 0.18). For average total income from earnings and SSA benefits, the impact estimate with multiple imputation was $424 (p=0.07) and without multiple imputation it was $296 (p-value=0.18). For average monthly income, the impact estimates with multiple imputation were somewhat larger with lower p-values in months 5 to 12.
A more consistent explanation for the stability in the average benefit amount for treatment cases following random assignment is that BHBF provided participants with intensive benefits counseling, which may have helped some of them avoid negative age-18 redeterminations. The Section 301 waiver can be used only after a negative redetermination, so the BHBF benefits counseling may also account for the absence of an impact by the project on use of the Section 301 waiver.
117 We also estimated the impact of BHBF on Section 301 waiver use just for youth who 17 or 18 years old at baseline. We found no statistically significant impact (results not shown).

Interim Report on Broadened Horizons, Brighter Futures Appendix A: Additional Analyses and Technical Discussion
A.28
Figure A.1. Average SSA Benefit Amount by Months Before and After Random Assignment
Source: SSA administrative records.
Notes: The analysis includes all youth who were randomly assigned, with the exception of nine youth who were deceased at the time of the 12-month survey. The figure presents observed means for the treatment and control groups.
The estimated differences between the treatment and control groups are statistically significant at the .10 level in months 2, 3, 6, 7, and 8 prior to random assignment and in the month of random assignment (month 0).
Treatment Group Control Group

Interim Report on Broadened Horizons, Brighter Futures Appendix A: Additional Analyses and Technical Discussion
A.29
Table A.10. Average SSA Benefit Amount, by Months Before and After Random Assignment ($)
Month Relative to Random Assignment Treatment
Group Control Group Difference P-Value
12 months before 520 540 -21 0.15 11 months before 521 537 -16 0.28 10 months before 520 535 -15 0.32 9 months before 513 531 -17 0.26 8 months before 508 541 -32 ** 0.04 7 months before 500 537 -38 ** 0.02 6 months before 498 532 -34 ** 0.04 5 months before 506 528 -23 0.17 4 months before 499 523 -24 0.16 3 months before 488 528 -39 ** 0.03 2 months before 489 526 -37 ** 0.04 1 month before 488 517 -29 0.13 Month of random assignment 484 517 -33 * 0.07 1 month after 480 509 -29 0.13 2 months after 478 503 -25 0.18 3 months after 479 491 -13 0.51 4 months after 479 478 0 0.99 5 months after 483 467 16 0.44 6 months after 484 470 15 0.48 7 months after 483 464 18 0.37 8 months after 483 470 13 0.52 9 months after 480 472 8 0.68 10 months after 481 467 15 0.47 11 months after 480 460 20 0.33 12 months after 478 461 17 0.40
Sample Size 454 396 Source: SSA administrative records.
Notes: The analysis includes all youth who were randomly assigned, with the exception of nine youth who were deceased at the time of the 12-month survey. The table reports observed means for the treatment and control groups and the difference between the observed means for the two groups.
*/**/***Difference is significantly different from zero at the .10/.05/.01 level using a two-tailed t-test.
In Figure A.2, we present the unadjusted percentage receiving any SSA benefit by month for youth in the treatment and control groups before and after random assignment. The figure shows the pattern similar to that presented in Figure A.1. For the control group, the percentage receiving benefits fell through most of the two-year period. For the treatment group, the percentage receiving benefits fell in the year before random assignment but then was fairly stable in the year after random assignment. In the 11th and 12th month after random assignment, the rate of benefit receipt was statistically significantly higher for the treatment group (79 percent) than for the control group (74 percent).

Interim Report on Broadened Horizons, Brighter Futures Appendix A: Additional Analyses and Technical Discussion
A.30
Figure A.2. Any SSA Benefit Receipt, by Months Before and After Random Assignment
Source: SSA administrative records.
Notes: The analysis includes all youth who were randomly assigned, with the exception of nine youth who were deceased at the time of the 12-month survey. The figure presents observed percentages for the treatment and control groups.
The estimated differences between the treatment and control groups are significantly different from zero at the .10 level in months 11 and 12 after random assignment.
G. Exploratory Subgroups
In the evaluation design report (Rangarajan et al. 2009a), we hypothesized the potential for differential impacts across a number of subgroups. To be responsive to the multiple comparisons problem, we limited the main subgroups discussed in the text to those with the strongest conceptual reasons for likely differential impacts: pairs of subgroups defined by random assignment cohort, age, school attendance, and work experience. In this section, we examine differential impacts for several exploratory subgroups. For these subgroups, we hypothesized the potential for differential impacts but decided before the analysis that the potential was lower than for the main subgroups discussed in the text.
We conducted exploratory analysis of the impact of BHBF on the primary outcomes for the following six exploratory subgroup pairs:
• Alternative random assignment cohort. In the text, we report subgroup analysis based on random assignment before July 1, 2009, because of differences in program implementation before and after that date (see Chapter III). As an alternative definition of cohort, we divide the sample somewhat evenly, considering youth randomly assigned by February 2009 as the early cohort. Defined in this manner, the early cohort comprised slightly less than half of the youth (46 percent).118
118 We set the cut-off date between the early and later cohorts to yield relatively balanced shares of youth in each
cohort. By making the two groups similar in size, we maximized the statistical power for detecting differences between groups in the estimated impact. We followed this approach for all exploratory subgroups defined by a continuous variable: random assignment cohort, time between baseline survey and consent, duration on SSA benefits, and time between random assignment and the 12-month follow-up survey.
Treatment Group Control Group

Interim Report on Broadened Horizons, Brighter Futures Appendix A: Additional Analyses and Technical Discussion
A.31
• Time between baseline survey and consent. To examine whether impacts differed for hard-to-enroll youth, we estimated impacts separately for youth who provided written consent to enroll in less than 25 days of completing the baseline survey versus youth who took 25 days or more. The youth who enrolled in less than 25 days made up 47 percent of the sample.
• Duration on SSA benefits. To examine whether impacts differed for youth who had received SSA benefits for a shorter period, we estimated impacts separately for youth who had received benefits for less than eight years (50 percent) versus those who had received them for eight years or more.
• Physical primary disabling condition. Impacts may differ for youth with a physical primary disability, including speech, hearing, and visual impairment (19 percent), compared to those with a mental, cognitive/developmental, or learning disability (81 percent).
• Two-parent family. To examine whether impacts differed by socioeconomic status, we estimated separate impacts for those who lived with both parents (30 percent) compared to all other youth (70 percent). Ideally, we would use family income or mother’s education to measure socioeconomic status. We chose living with both parents due to the likelihood of a high degree of error in our measure of family income and the relatively greater degree of missing information on mother’s education (6 percent missing).
• Time between random assignment and 12-month follow-up survey. Ideally, the 12-month follow-up survey would have occurred exactly 12 months after random assignment for all youth. In practice, 67 percent of respondents completed the survey in the 12th or 13th month; the remaining 33 percent completed the survey in a later month.119
In general, we found no consistent patterns of differential impacts (Tables A.11 through A.15). We found only 4 cases (out of a total of 30) for which the difference in impacts between the subgroup pairs is statistically significant. Among youth who completed the survey by the 13th month after random assignment relative to youth who completed the survey after the 13th month, the findings suggest that BHBF may have had larger impacts on the receipt of employment services. Among youth who had received benefits for eight years or more relative to youth who received benefits for a shorter period, the findings suggest BHBF may have had larger impacts on both employment and income. Finally, among youth who had a physical disability relative to youth who had a cognitive disability or mental illness, the findings suggest BHBF may have had a larger impact on future expectations for working enough to stop receiving benefits. However, given that we have conducted 30 tests of the exploratory subgroup pairs (six subgroups for each of five primary outcomes), we would have expected to find some statistically significant differences attributable to chance. In light of the lack of a pattern of differences for any subgroup, we conclude that there is no evidence that any impacts differed meaningfully for the subgroups.
To examine whether the timing of the follow-up survey affected impact estimates, we estimated separate impact estimates for youth interviewed by the end of the 13th month and those interviewed later. The purpose of this subgroup analysis is to examine the fidelity of the research approach; this analysis is the only subgroup analysis for which the defining characteristic of the subgroup pair was not measured at baseline.
119 The earliest completion occurred at 11.2 months; about half of youth completed by 12.4 months, 94 percent of
youth completed by the end of the 18th month, and the latest completion occurred at month 26.2.

Interim Report on Broadened Horizons, Brighter Futures Appendix A: Additional Analyses and Technical Discussion
A.32
Table A.11. Impact on Use of Employment Services, for Additional Subgroups (percentages)
Treatment Group
Observed
Mean
Estimated Mean w/o
BHBF Impact
P-Value
Treatment Group Size
Control Group Size
Random Assignment Cohort By February 2009 62.4 48.4 14.0 *** 0.01 184 147 After February 2009 54.3 43.5 10.8 ** 0.04 200 170 (P-value of difference in impacts) (0.66)
Time Between Baseline Survey and Consent
Less than 25 days 58.1 41.8 16.3 *** 0.00 187 161 25 days or more 58.2 49.6 8.6 0.11 197 156 (P-value of difference in impacts) (0.29)
Duration on SSA Benefits Less than 8 years 61.7 46.7 15.0 *** 0.00 202 151 8 years or more 54.4 44.3 10.1 * 0.07 182 166 (P-value of difference in impacts) (0.49)
Primary Disabling Condition Physical disability (including speech,
hearing, and visual) 56.1 46.6 9.5 0.30 73 57 Mental illness, cognitive/
developmental, and learning disability 59.1 46.7 12.3 *** 0.00 295 253
(P-value of difference in impacts) (0.76)
Two-Parent Family Lives with both parents 58.4 39.9 18.5 *** 0.00 110 100 Does not live with both parents 58.1 47.3 10.8 ** 0.02 272 215 (P-value of difference in impacts) (0.32)
Time Between Random Assignment and Follow-Up Survey
Completed survey by the end of 13th month 62.2 45.4 16.9 *** 0.00 258 212
Completed survey after 13th month 50.2 46.4 3.8 0.54 126 105 (P-value of difference in impacts) * (0.10)
Source: YTD 12-month follow-up survey.
Notes: The sample includes all youth who completed the 12-month follow-up survey. The table reports observed means or percentages for the treatment group, estimates of what the treatment group means or percentages would have been in the absence of BHBF, and regression-adjusted impact estimates (see Chapter II, Section A.4). We measured explanatory variables in the regression model before random assignment using data from the study’s baseline survey and SSA administrative records. We calculated all statistics by using sample weights to account for interview non-response. Survey item non-response may have resulted in smaller sample sizes for specific outcomes, as indicated in the table.
*/**/***Impact estimate is significantly different from zero at the .10/.05/.01 level using a two-tailed t-test.

Interim Report on Broadened Horizons, Brighter Futures Appendix A: Additional Analyses and Technical Discussion
A.33
Table A.12. Impact on Ever Employed in a Paid Job, for Additional Subgroups (percentages)
Treatment Group
Observed
Mean
Estimated Mean w/o
BHBF Impact
P-Value
Treatment Group Size
Control Group Size
Random Assignment Cohort By February 2009 21.4 11.7 9.7 ** 0.01 190 152 After February 2009 24.1 15.9 8.2 ** 0.04 213 182 (P-value of difference in impacts) (0.79)
Time Between Baseline Survey and Consent
Less than 25 days 22.9 12.4 10.5 *** 0.01 196 168 25 days or more 22.7 15.8 6.9 * 0.09 207 166 (P-value of difference in impacts) (0.52)
Duration on SSA Benefits Less than 8 years 24.6 20.3 4.3 0.31 208 162 8 years or more 21.0 7.5 13.5 *** 0.00 195 172 (P-value of difference in impacts) * (0.10)
Primary Disabling Condition Physical disability (including speech,
hearing, and visual) 17.3 12.1 5.2 0.31 80 59 Mental illness, cognitive/
developmental, and learning disability 23.5 13.9 9.6 *** 0.00 307 268
(P-value of difference in impacts) (0.46)
Two-Parent Family Lives with both parents 24.0 12.1 11.9 ** 0.01 114 104 Does not live with both parents 22.5 15.2 7.3 ** 0.03 287 228 (P-value of difference in impacts) (0.43)
Time Between Random Assignment and Follow-Up Survey
Completed survey by the end of 13th month 20.5 12.3 8.2 ** 0.01 272 221
Completed survey after 13th month 27.4 17.3 10.1 * 0.05 131 113 (P-value of difference in impacts) (0.76)
Source: YTD 12-month follow-up survey.
Notes: The sample includes all youth who completed the 12-month follow-up survey. The table reports observed means or percentages for the treatment group, estimates of what the treatment group means or percentages would have been in the absence of BHBF, and regression-adjusted impact estimates (see Chapter II, Section A.4). We measured explanatory variables in the regression model before random assignment using data from the study’s baseline survey and SSA administrative records. We calculated all statistics using sample weights to account for interview non-response. Survey item non-response may have resulted in smaller sample sizes for specific outcomes, as indicated in the table.
*/**/***Impact estimate is significantly different from zero at the .10/.05/.01 level using a two-tailed t-test.

Interim Report on Broadened Horizons, Brighter Futures Appendix A: Additional Analyses and Technical Discussion
A.34
Table A.13. Impact on Ever Enrolled in School or Has Completed High School, for Additional Subgroups (percentages)
Observed
Mean
Estimated Mean w/o
BHBF Impact
P-Value
Treatment Group Size
Control Group Size
Random Assignment Cohort By February 2009 84.1 83.4 0.7 0.85 180 144 After February 2009 79.4 84.4 -5.0 0.20 211 178 (P-value of difference in impacts) (0.33)
Time Between Baseline Survey and Consent
Less than 25 days 83.8 82.5 1.4 0.73 191 164 25 days or more 79.5 85.1 -5.6 0.13 200 158 (P-value of difference in impacts) (0.20)
Duration on SSA Benefits Less than 8 years 82.4 84.1 -1.7 0.66 203 156 8 years or more 80.6 85.3 -4.7 0.26 188 166 (P-value of difference in impacts) (0.64)
Primary Disabling Condition Physical disability (including speech,
hearing, and visual) 86.9 88.2 -1.3 0.81 77 57 Mental illness, cognitive/
developmental, and learning disability 80.1 82.9 -2.7 0.38 300 258
(P-value of difference in impacts) (0.94)
Two-Parent Family Lives with both parents 88.0 83.6 4.4 0.35 109 102 Does not live with both parents 79.9 84.4 -4.6 0.15 280 218 (P-value of difference in impacts) (0.12)
Time Between Random Assignment and Follow-Up Survey
Completed survey by the end of 13th month 83.4 87.0 -3.5 0.25 266 212
Completed survey after 13th month 77.8 78.7 -0.9 0.86 125 110 (P-value of difference in impacts) (0.52)
Source: YTD 12-month follow-up survey.
Notes: The sample includes all youth who completed the 12-month follow-up survey. The table reports observed means or percentages for the treatment group, estimates of what the treatment group means or percentages would have been in the absence of BHBF, and regression-adjusted impact estimates (see Chapter II, Section A.4). We measured explanatory variables in the regression model before random assignment using data from the study’s baseline survey and SSA administrative records. We calculated all statistics using sample weights to account for interview non-response. Survey item non-response may have resulted in smaller sample sizes for specific outcomes, as indicated in the table.
*/**/***Impact estimate is significantly different from zero at the .10/.05/.01 level using a two-tailed t-test.

Interim Report on Broadened Horizons, Brighter Futures Appendix A: Additional Analyses and Technical Discussion
A.35
Table A.14. Impact on Income, for Additional Subgroups ($)
Treatment Group
Observed
Mean
Estimated Mean w/o
BHBF Impact P-Value
Treatment Group Size
Control Group Size
Random Assignment Cohort By February 2009 6,959 6,581 378 0.20 191 152 After February 2009 6,589 6,157 432 0.20 213 182 (P-value of difference in impacts) (0.90)
Time Between Baseline Survey and Consent
Less than 25 days 6,599 6,202 397 0.18 197 168 25 days or more 6,914 6,465 449 0.19 207 166 (P-value of difference in impacts) (0.91)
Duration on SSA Benefits Less than 8 years 6,677 6,780 -103 0.73 209 162 8 years or more 6,850 5,953 897 *** 0.01 195 172 (P-value of difference in impacts) ** (0.02)
Primary Disabling Condition Physical disability (including speech,
hearing, and visual) 7,409 7,199 210 0.68 80 59 Mental illness, cognitive/
developmental, and learning disability 6,527 6,139 389 0.14 308 268
(P-value of difference in impacts) (0.76)
Two-Parent Family Lives with both parents 6,688 6,177 511 * 0.08 288 228 Does not live with both parents 7,006 6,750 257 0.44 114 104 (P-value of difference in impacts) (0.55)
Time Between Random Assignment and Follow-Up Survey
Completed survey by the end of 13th month 7,021 6,555 466 * 0.06 272 221
Completed survey after 13th month 6,251 5,926 325 0.47 132 113 (P-value of difference in impacts) (0.78)
Source: YTD 12-month follow-up survey.
Notes: The sample includes all youth who completed the 12-month follow-up survey. The table reports observed means or percentages for the treatment group, estimates of what the treatment group means or percentages would have been in the absence of BHBF, and regression-adjusted impact estimates (see Chapter II, Section A.4). We measured explanatory variables in the regression model before random assignment using data from the study’s baseline survey and SSA administrative records. We calculated all statistics using sample weights to account for interview non-response. Survey item non-response may have resulted in smaller sample sizes for specific outcomes, as indicated in the table.
For all outcomes in this table, item nonresponse occurred conditionally, depending on the values of other measures in the follow-up survey. The rate of missing data in various subgroups in the table ranges from 0.7 percent to 6.9 percent. We used a multiple imputation procedure to assign values when they were missing. See Section E of this appendix for more information on this procedure.
*/**/***Impact estimate is significantly different from zero at the .10/.05/.01 level using a two-tailed t-test.
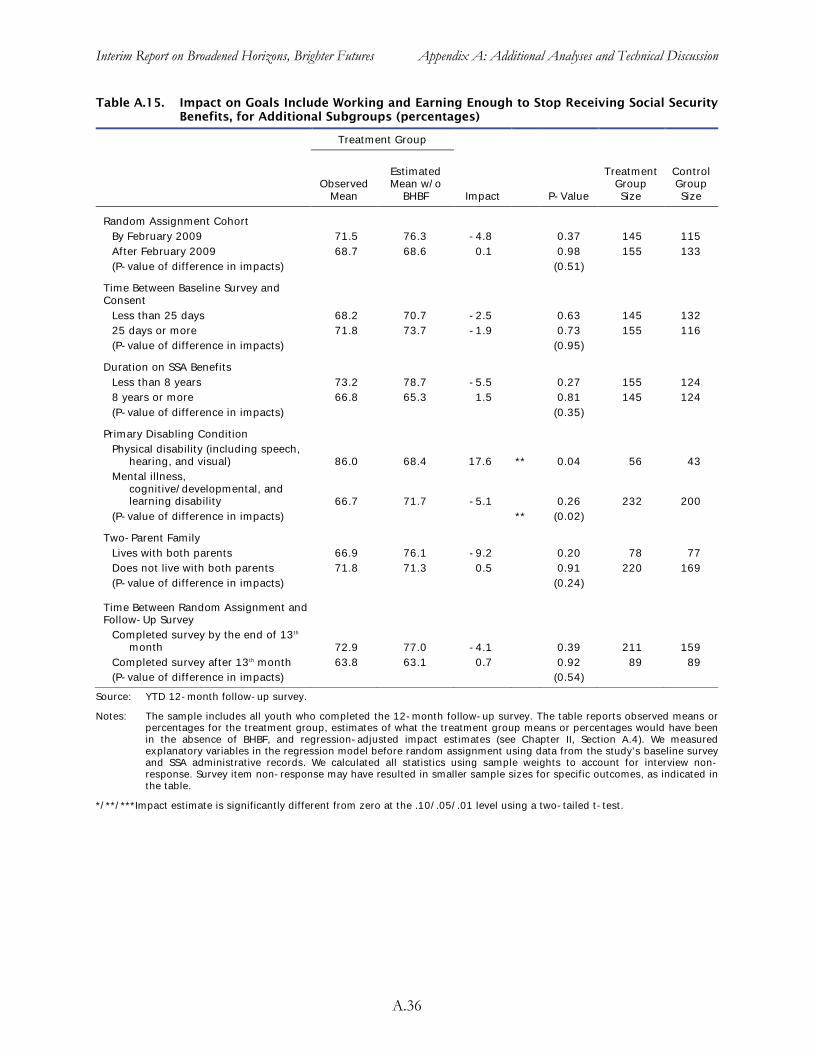
Interim Report on Broadened Horizons, Brighter Futures Appendix A: Additional Analyses and Technical Discussion
A.36
Table A.15. Impact on Goals Include Working and Earning Enough to Stop Receiving Social Security Benefits, for Additional Subgroups (percentages)
Treatment Group
Observed
Mean
Estimated Mean w/o
BHBF Impact
P-Value
Treatment Group Size
Control Group Size
Random Assignment Cohort By February 2009 71.5 76.3 -4.8 0.37 145 115 After February 2009 68.7 68.6 0.1 0.98 155 133 (P-value of difference in impacts) (0.51)
Time Between Baseline Survey and Consent
Less than 25 days 68.2 70.7 -2.5 0.63 145 132 25 days or more 71.8 73.7 -1.9 0.73 155 116 (P-value of difference in impacts) (0.95)
Duration on SSA Benefits Less than 8 years 73.2 78.7 -5.5 0.27 155 124 8 years or more 66.8 65.3 1.5 0.81 145 124 (P-value of difference in impacts) (0.35)
Primary Disabling Condition Physical disability (including speech,
hearing, and visual) 86.0 68.4 17.6 ** 0.04 56 43 Mental illness,
cognitive/developmental, and learning disability 66.7 71.7 -5.1 0.26 232 200
(P-value of difference in impacts) ** (0.02)
Two-Parent Family Lives with both parents 66.9 76.1 -9.2 0.20 78 77 Does not live with both parents 71.8 71.3 0.5 0.91 220 169 (P-value of difference in impacts) (0.24)
Time Between Random Assignment and Follow-Up Survey
Completed survey by the end of 13th month 72.9 77.0 -4.1 0.39 211 159
Completed survey after 13th month 63.8 63.1 0.7 0.92 89 89 (P-value of difference in impacts) (0.54)
Source: YTD 12-month follow-up survey.
Notes: The sample includes all youth who completed the 12-month follow-up survey. The table reports observed means or percentages for the treatment group, estimates of what the treatment group means or percentages would have been in the absence of BHBF, and regression-adjusted impact estimates (see Chapter II, Section A.4). We measured explanatory variables in the regression model before random assignment using data from the study’s baseline survey and SSA administrative records. We calculated all statistics using sample weights to account for interview non-response. Survey item non-response may have resulted in smaller sample sizes for specific outcomes, as indicated in the table.
*/**/***Impact estimate is significantly different from zero at the .10/.05/.01 level using a two-tailed t-test.
Interim Report on Broadened Horizons, Brighter Futures Appendix A: Additional Analyses and Technical Discussion
A.37
H. Additional Self- Efficacy Outcomes
In Chapter VIII, we reported that BHBF did not have statistically significant impacts on either the internal or external locus of control. We created these composite measures from a series of questions in the follow-up survey. The self-efficacy measures are based on a battery of 12 questions that includes the Pearlin Mastery Scale (Pearlin and Schooler 1978). We selected one of these questions, on goals for future work and earnings, as the primary outcome in this domain because of its relevance to the YTD initiative. We used factor analysis to determine that the remaining 11 questions could be aggregated into two factors based on the high degree of correlation of the measures within the two groupings. After examining the concepts in each group of questions, we labeled the first group “internal locus of control” and the second group “external locus of control.”120
It is preferable to use the two composite outcomes instead of estimating impacts separately for each question because the questions are meant to assess the same underlying concept (self-efficacy) and the responses are highly correlated within two factors. The composite measures have lower random variation than the separate measures, and the approach addresses the multiple comparisons problem (Chapter II). Specifically, with 11 outcomes, we would expect to find one statistically significant impact because of random variation even if BHBF had no impact on self-efficacy.
In this evaluation, the internal locus of control reflects whether youth believe their life outcomes result primarily from their own behaviors and actions. Our measure of the internal locus of control is an index based on the degree to which youth agreed with the following five statements:
• What happens to you in the future mostly depends on you.
• You can do just about anything you really set your mind to.
• You tell other people how you feel when they upset you or hurt your feelings.
• You know how to get the information you need.
• You have a good sense of the path you want to take in life and the steps to get there.
The index for the internal locus of control runs from 1 to 4, with 1 signaling strong disagreement with the statements and 4 signaling strong agreement. The average value of this index for treatment group youth is 3.3, and we estimated that, in the absence of BHBF, the average would have been the same.
The external locus of control reflects the degree to which youth believe that others, fate, or chance primarily determine their life outcomes. Our measure of the external locus of control is an index based on the degree to which youth agreed with the following six statements:
• You have little control over the things that happen to you.
• There is really no way you can solve some of the problems you have.
• There is little you can do to change many of the things in your life.
120 The factor analysis showed that the questions in each group had a high degree of correlation, so it is appropriate to combine the separate questions in a single measure for each group. Furthermore, the results of the factor analysis are consistent with grouping the questions conceptually, based on whether they affirm or suggest a lack of self-efficacy.

Interim Report on Broadened Horizons, Brighter Futures Appendix A: Additional Analyses and Technical Discussion
A.38
• You often feel helpless in dealing with the problems of life.
• Sometimes you feel like you are being pushed around in life.
• Your job opportunities will be limited by discrimination because of your gender, race, or disability.
This index also runs from 1 to 4, with 1 signaling strong agreement with the statements and 4 signaling strong disagreement. The average value of this index for the external locus of control for treatment group youth is 2.6. We estimated that these youth would have registered essentially the same average value on this index even if they had not been given the opportunity to participate in BHBF.
As a robustness check for the findings from the two composite measures, we also estimated the impact estimates for each question separately (Table A.16). The results suggest that BHBF may have had a modest impact on some component measures of self efficacy. BHBF appears to have increased the share of youth who strongly disagreed with the statements, “There is really no way you can solve some of the problems you have” and “There is little you can do to change many of the important things in your life.” In addition, BHBF may have had mixed effects on another measure: increasing the share of youth who agree a lot and the share who disagree a lot with the statement, “You know how to get the information you need.”
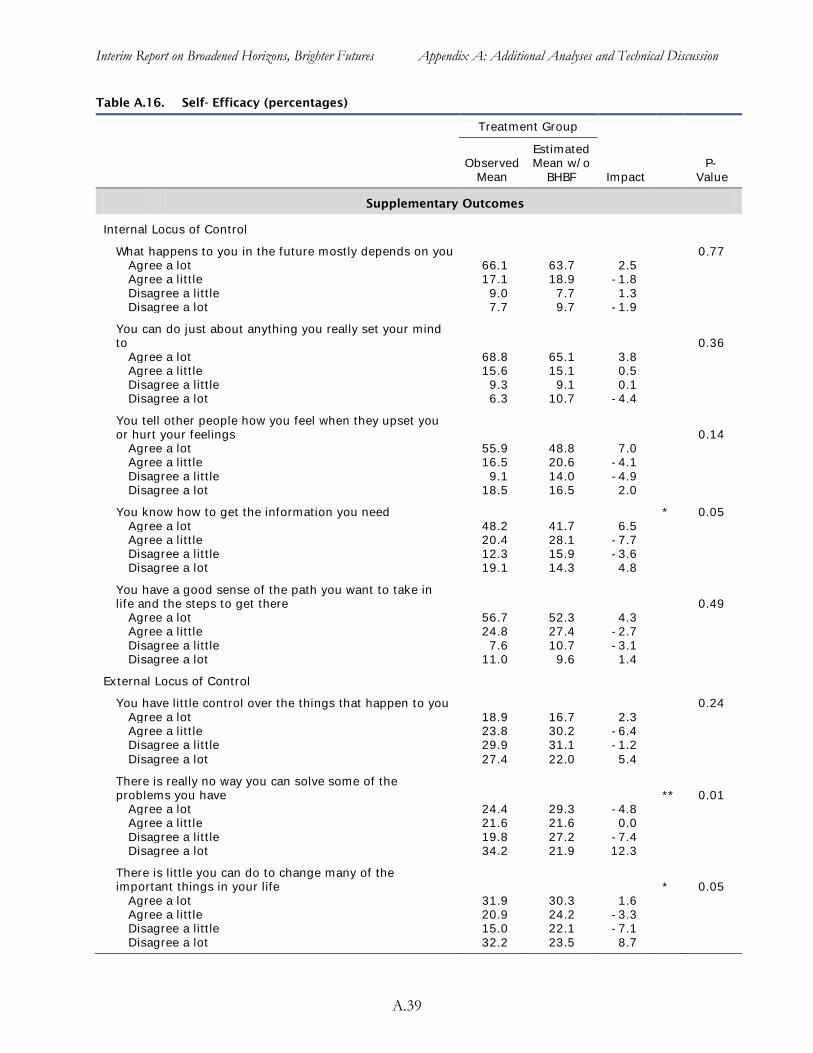
Interim Report on Broadened Horizons, Brighter Futures Appendix A: Additional Analyses and Technical Discussion
A.39
Table A.16. Self- Efficacy (percentages) Treatment Group
Observed
Mean
Estimated Mean w/o
BHBF Impact P-
Value
Supplementary Outcomes
Internal Locus of Control
What happens to you in the future mostly depends on you 0.77 Agree a lot 66.1 63.7 2.5 Agree a little 17.1 18.9 -1.8 Disagree a little 9.0 7.7 1.3 Disagree a lot 7.7 9.7 -1.9
You can do just about anything you really set your mind to 0.36
Agree a lot 68.8 65.1 3.8 Agree a little 15.6 15.1 0.5 Disagree a little 9.3 9.1 0.1 Disagree a lot 6.3 10.7 -4.4
You tell other people how you feel when they upset you or hurt your feelings 0.14
Agree a lot 55.9 48.8 7.0 Agree a little 16.5 20.6 -4.1 Disagree a little 9.1 14.0 -4.9 Disagree a lot 18.5 16.5 2.0
You know how to get the information you need * 0.05 Agree a lot 48.2 41.7 6.5 Agree a little 20.4 28.1 -7.7 Disagree a little 12.3 15.9 -3.6 Disagree a lot 19.1 14.3 4.8
You have a good sense of the path you want to take in life and the steps to get there 0.49
Agree a lot 56.7 52.3 4.3 Agree a little 24.8 27.4 -2.7 Disagree a little 7.6 10.7 -3.1 Disagree a lot 11.0 9.6 1.4
External Locus of Control
You have little control over the things that happen to you 0.24 Agree a lot 18.9 16.7 2.3 Agree a little 23.8 30.2 -6.4 Disagree a little 29.9 31.1 -1.2 Disagree a lot 27.4 22.0 5.4
There is really no way you can solve some of the problems you have ** 0.01
Agree a lot 24.4 29.3 -4.8 Agree a little 21.6 21.6 0.0 Disagree a little 19.8 27.2 -7.4 Disagree a lot 34.2 21.9 12.3
There is little you can do to change many of the important things in your life * 0.05
Agree a lot 31.9 30.3 1.6 Agree a little 20.9 24.2 -3.3 Disagree a little 15.0 22.1 -7.1 Disagree a lot 32.2 23.5 8.7

Interim Report on Broadened Horizons, Brighter Futures Appendix A: Additional Analyses and Technical Discussion
A.40
Treatment Group
Observed
Mean
Estimated Mean w/o
BHBF Impact P-
Value
You often feel helpless in dealing with the problems of life 0.10
Agree a lot 27.7 31.5 -3.9 Agree a little 23.3 18.2 5.0 Disagree a little 16.0 22.5 -6.5 Disagree a lot 33.1 27.8 5.3
Sometimes you feel like you are being pushed around in life 0.61
Agree a lot 26.9 31.4 -4.5 Agree a little 20.2 16.7 3.5 Disagree a little 17.1 17.3 -0.2 Disagree a lot 35.9 34.6 1.3
Your job opportunities will be limited by discrimination because of your gender, race, or disability 0.71
Agree a lot 25.8 24.0 1.7 Agree a little 19.8 16.9 2.8 Disagree a little 19.2 22.5 -3.3 Disagree a lot 35.3 36.5 -1.3
Source: YTD 12-month follow-up survey.
Notes: The sample includes all youth who completed the 12-month follow-up survey. The table reports observed means or percentages for the treatment group, estimates of what the treatment group means or percentages would have been in the absence of BHBF, and regression-adjusted impact estimates (see Chapter II, Section A.4). We measured explanatory variables in the regression model before random assignment using data from the study’s baseline survey and SSA administrative records. We calculated all statistics with sample weights to account for interview non-response. The analytic sample includes 404 treatment group youth and 334 control group youth. For the outcomes in this table, survey item non-response resulted in smaller sample sizes that varied by a few observations across outcomes: 299 to 307 treatment group youth and 245 to 256 control group youth.
*/**/***Impact estimate is significantly different from zero at the .10/.05/.01 level using a chi-square test.

APPENDIX B
THE SSA WAIVERS FOR YTD


Interim Report on Broadened Horizons, Brighter Futures Appendix B: The SSA Waivers for YTD
B.1
An important element of YTD was the modification of selected SSA program rules for project participants. These modifications, or waivers, were designed to encourage and reward the efforts of youth to begin working, increase their earnings, or continue their education.
Student Earned Income Exclusion (SEIE). Under the SEIE, Social Security disregards up to $1,700 per month of a student’s earnings, subject to a cap of $6,840 for the year (in 2012—the monthly and yearly amounts are adjusted for inflation each year.) Normally, the SEIE applies only to students who are age 21 or younger. For YTD participants, the SEIE applies regardless of age. As long as a YTD participant regularly attends school, he or she is eligible for the SEIE.
Earned Income Exclusion (EIE). For all SSI recipients who work, Social Security disregards $65 plus half of any earnings over that amount when it determines eligibility for SSI. For YTD participants, Social Security disregards $65 plus three-fourths of any additional earnings. This waiver allows YTD participants to keep more of their SSI benefits when they work. (The EIE is applied to earnings in addition to all other applicable exclusions, including the SEIE.)
Plan for Achieving Self-Support (PASS). Normally, a PASS must specify a particular employment or self-employment goal, list the steps that will be taken to achieve the goal, and identify the income and/or assets (other than SSI benefits) that will be used to meet the plan’s expenses. YTD participants may specify postsecondary education or career exploration as the goal of a PASS.
If Social Security approves a PASS, it disregards the funds used to pursue the plan when it determines eligibility for SSI. Such funds may include, for example wages, SSDI benefits, childhood disability benefits, or deemed parental income. If the individual is eligible for SSI without the PASS, SSI benefits replace all of the funds used for PASS expenses. If the PASS creates eligibility for SSI (which generally conveys eligibility for Medicaid, as well), SSI benefits replace part of the funds used for PASS expenses.
Individual Development Accounts (IDAs). This waiver expands the options for YTD participants to acquire certain kinds of assets. IDAs are trust-like savings accounts. For each dollar of earnings the account holder deposits, a participating nonprofit organization sets aside a matching contribution of 50 cents to four dollars (the average is one dollar). In IDA programs that involve federal funds, a federal match also is set aside. Federally funded IDAs must be used to help buy a home, pay for postsecondary education, or start a small business. All IDA participants undergo financial literacy training.
Under current rules, Social Security deducts account-holder deposits from countable earned income and disregards matching deposits, IDA account balances, and any interest earned by the account when determining SSI eligibility for someone who has a federally funded IDA. For YTD participants, these disregards also apply to IDAs that do not involve federal funds, including those that may be used for purposes other than the purchase of a home, postsecondary education, or a business startup. The IDA may be part of an existing state or local program, or a program established by a YTD project for its participants.
Continuing Disability Review (CDR) or Age-18 Medical Redetermination. YTD participants will receive coverage under Section 301 that will allow for continued benefit eligibility throughout the project, regardless of the outcome of a continuing disability review (CDR) or age-18 medical redetermination. Under existing SSA rules, a CDR is scheduled to determine whether there has been an improvement in a disabling condition. Moreover, when an SSI recipient turns 18, there is a medical redetermination in which the SSI recipient must meet the adult criteria for disability. While this coverage does not eliminate these reviews, YTD participants who are determined ineligible for benefits for medical reasons can continue to receive SSI benefit payments under Section 301.


www.mathematica-mpr.com
Improving public well-being by conducting high-quality, objective research and surveys
Princeton, NJ ■ Ann Arbor, MI ■ Cambridge, MA ■ Chicago, IL ■ Oakland, CA ■ Washington, DC
Mathematica® is a registered trademark of Mathematica Policy Research