The social costs of smoking and the social benefits of ... · of public policy measures to reduce...
48
The social costs of smoking in Western Australia in 2009/10 and the social benefits of public policy measures to reduce smoking prevalence D.J.Collins Department of Economics, Macquarie University and H.M.Lapsley Faculty of Medicine, University of New South Wales Report prepared for Cancer Council Western Australia, October 2014
Transcript of The social costs of smoking and the social benefits of ... · of public policy measures to reduce...
The social costs of smoking in Western Australia in 2009/10 and the social benefits of public policy measures to reduce smoking prevalence
D.J.CollinsDepartment of Economics, Macquarie University
and
H.M.Lapsley Faculty of Medicine, University of New South Wales
Report prepared for Cancer Council Western Australia, October 2014

First published in 2014 by Cancer Council Western Australia, 15 Bedbrook Place Shenton Park WA 6008
© Cancer Council Western Australia, 2014
All rights reserved. No part of this book may be reproduced or utilised in any form or by any means, electronic or mechanical, including photocopying, recording or by any information storage and retrieval system without permission in writing from the publisher.
To obtain copies of this publication please contact:
Administration Officer
Tobacco Programs
Cancer Council Western Australia
15 Bedbrook Place
Shenton Park WA 6008
Australia
Telephone: 08 9388 4333
Facsimile: 08 9388 4399
Website: www.cancerwa.asn.au
Email: [email protected]
Cancer Council Western Australia gratefully acknowledges the funding support of Healthway and the Department of Health.
Suggested citation:
Collins DJ, Lapsley HM. The social costs of smoking in Western Australia in 2009/10 and the social benefits of public policy measures to reduce smoking prevalence. Cancer Council Western Australia. Perth, Western Australia; 2014.
ISBN 1 876628 80 4
Government of Western AustraliaDepartment of Health

iThe social costs of smoking in Western Australia in 2009/10 and the social benefits of public policy measures to reduce smoking prevalence
ForewordA century ago, the great physician Sir William Osler described pneumonia as “the captain of the men of death”. Tobacco, which now kills some six million people around the world each year, well and truly carries that mantle in the 21st century.
Tobacco remains our largest preventable cause of death. We know what needs to be done: the frustration for so many of us remains that so little is being done, and that every step forward has to be so hard-fought. Many people are still not aware of the magnitude of the problem. Setting aside all the other causes of death and disease, lung cancer causes more deaths in men than prostate cancer (in WA in 2012 – 488 lung cancer deaths compared to 230 from prostate cancer) and more deaths in women than breast cancer (361 compared to 285). Most of these deaths from lung cancer are preventable.
And the costs go far beyond raw statistics. Many people will have seen the Cancer Council’s moving advertisements showing the impact on the Roberts family of the death of their mother Zita when they were young: the personal costs are enormous not only for those who are directly affected, but also their families.
It is impossible to turn those personal and emotional costs fully into numbers. But the financial costs can be calculated. This outstanding report from David Collins and Helen Lapsley gives us a window into the quantifiable financial costs to the people, the businesses and the government of Western Australia – and they are massive.
It also gives us a view to what can be achieved if we can reduce smoking – even just getting smoking rates down to 10 per cent – a goal now well within our reach. The benefit of such a fall is huge at more than $500 million. A more ambitious goal – seeing just over 4 per cent of adult Western Australians smoke – will yield close to $1.3 billion in benefits, surely an objective well worth pursuing on economic grounds, as well as the primary purpose of saving lives and preventing ill health and misery.
But that remains a long way off and complacency is our enemy. So too are those who wish to promote tobacco – and their fellow travellers.
How do we get there? There is overwhelming evidence on the action that is needed by governments at all levels, with the support of the community. We need to continue doing the work that has already saved the lives of tens of thousands of West Australians. We need to convince our decision-makers, colleagues and the public that smoking is still a work in progress, not a problem solved. The Cancer Council are to be congratulated on commissioning this report which shows both why we need to act and what we will gain if we do so.
Professor Mike Daube AOProfessor of Health PolicyCurtin University
October 2014

ii

1The social costs of smoking in Western Australia in 2009/10 and the social benefits of public policy measures to reduce smoking prevalence
Table of contents
Executive summary 3
Acknowledgments 5
1. Introduction 6
2. Interpreting the social cost estimates 7
3. Some disaggregated costs 8
Health 8
Productivity 10
Fires 11
4. Aggregate results 12
Tangible costs 12
Intangible costs 12
Total costs 13
Who bears the social costs of tobacco? 13
Budgetary impact 13
Tobacco-attributable costs and gross state product 17
5. Comparison with previous Western Australian social cost estimates 19
6. The economic benefits of reduced smoking prevalence in Western Australia 21
7. Conclusions 24
Appendix A Estimating the Western Australian costs of tobacco use 25
Causality 25
Costs 27
Appendix B Issues in the economic evaluation of reductions in smoking prevalence 31
Methodological issues 31
The sensitivity of the estimates of the benefits of prevalence reduction to the assumptions adopted 32
Appendix C Demographic estimates 34
The data 34
Method 34
Adjustment of the mortality rates 34
Results 35
Appendix D The changes to tobacco taxation implemented in July 2000 36
Appendix E Aetiologic fractions 37
Age-specific aetiologic fractions for tobacco caused deaths, males 37
Age-specific aetiologic fractions for tobacco caused deaths, females 38
Bibliography 39
Data Sources 40

2
List of TablesSocial costs of tobacco use in Western Australia in 2009/10 3
Comparison of constant price estimates of the social costs of tobacco in Western Australia, 2004/05 and 2009/10, at 2009/10 prices 3
The present value in 2009/10 of the social benefits of reductions in Western Australian smoking prevalence to 4.3 per cent and 10.0 per cent over 15 years 4
Table 1 Health care costs and savings attributable to smoking, Western Australia, 2009/10 8
Table 2 Tobacco-attributable deaths, hospital bed days and hospital costs, caused and prevented, Western Australia, 2009/10 9
Table 3 Tobacco-attributable deaths, hospital bed days and hospital costs, by age and smoking status, Western Australia, 2009/10 9
Table 4 Proportions of tobacco-attributable deaths, hospital bed days and hospital costs, by age and smoking status, Western Australia, 2009/10 10
Table 5 Paid and unpaid production costs of smoking, Western Australia, 2009/10 10
Table 6 Costs of smoking-attributable fires, Western Australia, 2009/10 11
Table 7 Tangible social costs of smoking, Western Australia, 2009/10 12
Table 8 Total social costs of smoking, Western Australia, 2009/10 13
Table 9 Incidence of the tangible social costs of smoking, Western Australia, 2009/10 13
Table 10 Tobacco tax revenues raised from Western Australian smokers, 1998/99 and 2009/10 14
Table 11 Impact of Western Australian smoking on the Federal budget, 2009/10 15
Table 12 Impact of Western Australian smoking on the Western Australian State budget, 2009/10 15
Table 13 Total budgetary impact of Western Australian smoking, 2009/10 16
Table 14 Expenditure on tobacco control activities in Western Australia, 2009/10 17
Table 15 Comparison of some smoking-attributable cost categories with Western Australian Gross State Product, 2009/10 18
Table 16 Comparison of constant price estimates of the social costs of tobacco in Western Australia, 2004/05 and 2009/10, at 2009/10 prices 19
Table 17 Comparison of changes in real social costs, Western Australia, 1998/99 to 2004/05, and 2004/05 to 2009/10 19
Table 18 Changes in the real social costs of smoking in three States 20
Table 19 Assumptions underlying the evaluation of reduced smoking prevalence 21
Table 20 The present value in 2009/10 of the social benefits of reductions in Western Australian smoking prevalence to 4.3 per cent and 10.0 per cent over 15 years 22
Table 21 Smoking prevalence rates, by State/Territory, 1998 to 2010 23
Table 22 Summary of studies of the benefits of prevalence rate reductions 23
Table 23 Tobacco-caused conditions and defining ICD-10 codes 26
Table 24 Present values of social cost reductions ($ millions, year 2009/10 prices), twenty year analysis, smoking prevalence rate reduced to 4.3 per cent 32
Table 25 Present values of social cost reductions ($ millions, year 2009/10 prices), thirty year analysis, smoking prevalence rate reduced to 4.3 per cent 32
Table 26 Present values of social cost reductions ($ millions, year 2009/10 prices), twenty year analysis, smoking prevalence rate reduced to 10.0 per cent 33
Table 27 Present values of social cost reductions ($ millions, year 2009/10 prices), thirty year analysis, smoking prevalence rate reduced to 10.0 per cent 33
Table 28 Estimated additional Western Australian population in the absence of smoking, June 2010, classified by age and sex 35

3The social costs of smoking in Western Australia in 2009/10 and the social benefits of public policy measures to reduce smoking prevalence
Executive summaryThis report provides new estimates of the social costs of tobacco use in Western Australia for the financial year 2009/10. It also presents estimates of the value of the social benefits which would accrue from a possible reduction in Western Australian smoking prevalence from its 2010 level of 15.6 per cent to rates of 4.3 per cent or 10.0 per cent over a period of 15 years. Previous estimates of the benefits resulting from forecast prevalence reductions are reviewed.
The main conclusions concerning the estimates of the social costs of smoking in Western Australia in 2009/10 can be summarised as follows:
• The total social costs of smoking were about $3.0 billion, which represented $1,287 for each member of the Western Australian population;
• Of these costs, 42.6 per cent were tangible costs and 57.4 per cent were intangible costs;
• Individuals bore 64 per cent of the total tangible costs, businesses bore 33 per cent and governments three per cent. Individuals bear 100 per cent of intangible costs;
• The change to tobacco tax arrangements resulting from the introduction in 2000 of the GST meant that Western Australia effectively lost about three quarters of its tobacco tax revenue. In 2009/10, Western Australian tax revenues from tobacco use exceeded smoking-attributable expenditures in that State by $71 million; and
• The financial impact of the Federal budget on Western Australian smoking was very favourable, with tobacco tax revenues from Western Australian smokers exceeding Federal smoking-attributable expenditures in that State by $449 million.
The table below presents a summary of the aggregate social cost estimates.
Social costs of tobacco use in Western Australia in 2009/10
$m %
Tangible 1,259.2 42.6%
Intangible (loss of life) 1,697.4 57.4%
Total 2,956.6 100.0%
The paper compares the Western Australian social cost estimates for 2004/05 and 2009/10 in constant price terms (that is, adjusted for increases in the general level of prices).
Comparison of constant price estimates of the social costs of tobacco use in Western Australia, 2004/05 and 2009/10, at 2009/10 prices
2004/05$m
2009/10$m
Per cent change
Tangible costs 913.7 1,259.2 37.8%
Intangible costs 2,003.8 1,697.4 (15.3%)
Total costs 2,917.5 2,956.6 1.3%
Note: the figure in brackets is negative
The social costs of tobacco use are estimated to have risen after adjusting for inflation during the period 2004/05 to 2009/10 by 1.3 per cent (consisting of a 37.8 per cent increase in tangible costs and a 15.3 per cent decrease in intangible costs). This real rate of increase of social costs represents a substantial deceleration compared with the increase of 25 per cent between 1998/89 and 2004/05.
As the lagged effects of past smoking work their way through the system, and if Western Australian smoking prevalence resumes its decline, real smoking costs (adjusting for the effects of inflation) in Western Australia should eventually fall very significantly.

4
The following table presents estimates of the social benefits which would occur as a result of a reduction in the 2010 smoking prevalence rate in Western Australia of 15.6 per cent to rates of 4.3 per cent or 10.0 per cent over a period of 15 years. It presents estimates calculated on the “most conservative” and “most plausible” bases. The target prevalence rate of 4.3 per cent was supplied by Cancer Council Western Australia for the purposes of this study. It is based on an extrapolation of the linear trend in daily smoking rates between 1998 and 2010. The alternative target of ten per cent represents a less ambitious target, which is analysed for the purposes of comparison.
The present value in 2009/10 of the social benefits of reductions in Western Australian smoking prevalence to 4.3 per cent and 10.0 per cent over 15 years
Assumption Set
Prevalence reduced to 4.3 per cent over 15 years
Prevalence reduced to 10.0 per cent over 15 years
Present value$m
Present value per smoker
$
Present value$m
Present value per smoker
$
Most conservative 1,271.4 6,167 510.7 4,999
Most plausible 3,580.6 17,368 1,421.9 13,917
Under the most conservative method of estimation, and if the prevalence rate is assumed to fall to 4.3 per cent within 15 years, the present value in the year 2009/10 of the social benefits of the reduction in smoking prevalence would be $1,271 million. This represents $6,167 for each person prevented from smoking by anti-smoking interventions. Continuing to assume the conservative estimation method, but assuming a modest reduction in the prevalence rate to 10 per cent, the 2009/10 present value of the total benefits would be $510.7m, representing $4,999 for each person prevented from smoking. These figures represent the present value in 2009/10 of the benefits accruing over the whole of an assumed twenty year period of analysis, not the benefits which would accrue solely in the year 2009/10. The estimated benefits would be much higher if the “most plausible” basis for calculation was adopted.
These results are more meaningful if they are placed into a policy context. For example, it could be assumed that public expenditures were required to yield a real social rate of return of at least ten per cent per annum and that these public expenditures were successful in producing the reduction in Western Australian smoking prevalence to the assumed lower rates. On this basis, and on the most conservative set of assumptions, the achievement of the lower prevalence rate of 4.3 per cent within 15 years would justify annual real expenditures of up to $150 million at 2009/10 prices for a 20 year period. Reducing the prevalence rate to 10.0 per cent over 15 years would justify annual expenditures of up to $60 million.
These figures represent the maximum justified expenditures. It is probable that the lower prevalence rates could be achieved by the application of much lower expenditures than these maxima, as the Federal Government continues to raise the rate of excise tax on tobacco and plain packaging of tobacco products continue. Clearly, however, there would be strong justification for effective annual public anti-smoking expenditure programs much higher than the actual 2009/10 Western Australian public expenditures, conservatively estimated to be $7.8 million.
The conclusions to be drawn from these research results are essentially the same as for previous studies. The estimated social costs of smoking in Western Australia are very high, as are the potential benefits of effective policies to reduce smoking prevalence. There is ample justification for increasing the levels of public expenditure devoted to the reduction of smoking prevalence in Western Australia. Further increasing the taxation of tobacco products – which is exclusively the prerogative of the Federal Government – remains an important policy to pursue. At a State level the range of tobacco control policies available deserves active consideration as there are both further health and economic benefits to be achieved by doing so. The most effective form of Federal intervention is likely to be increases in the taxation of tobacco products.

5The social costs of smoking in Western Australia in 2009/10 and the social benefits of public policy measures to reduce smoking prevalence
AcknowledgmentsWe wish to thank Fiona Phillips and Katie Mooney of Cancer Council Western Australia for their help throughout our work on this project.
Significant contributions to the methodological analysis and data development have been made by:
• Professor John Pollard of Macquarie University, whose indispensable demographic estimates are presented as Appendix C;
• Associate Professor James Codde of the University of Western Australia, who provided us with invaluable epidemiological assistance.
Brian Easton, consulting economist, made highly useful review comments.
We continue to draw on the epidemiological work of Holman, Armstrong et al, English, Holman et al, Ridolfo and Stevenson, and Begg et al, without all of whose painstaking calculation of aetiological fractions it would not be possible to undertake this study.
We are greatly indebted to all who assisted us. If errors and omissions remain, despite all the information and assistance provided, they are entirely our responsibility.
6
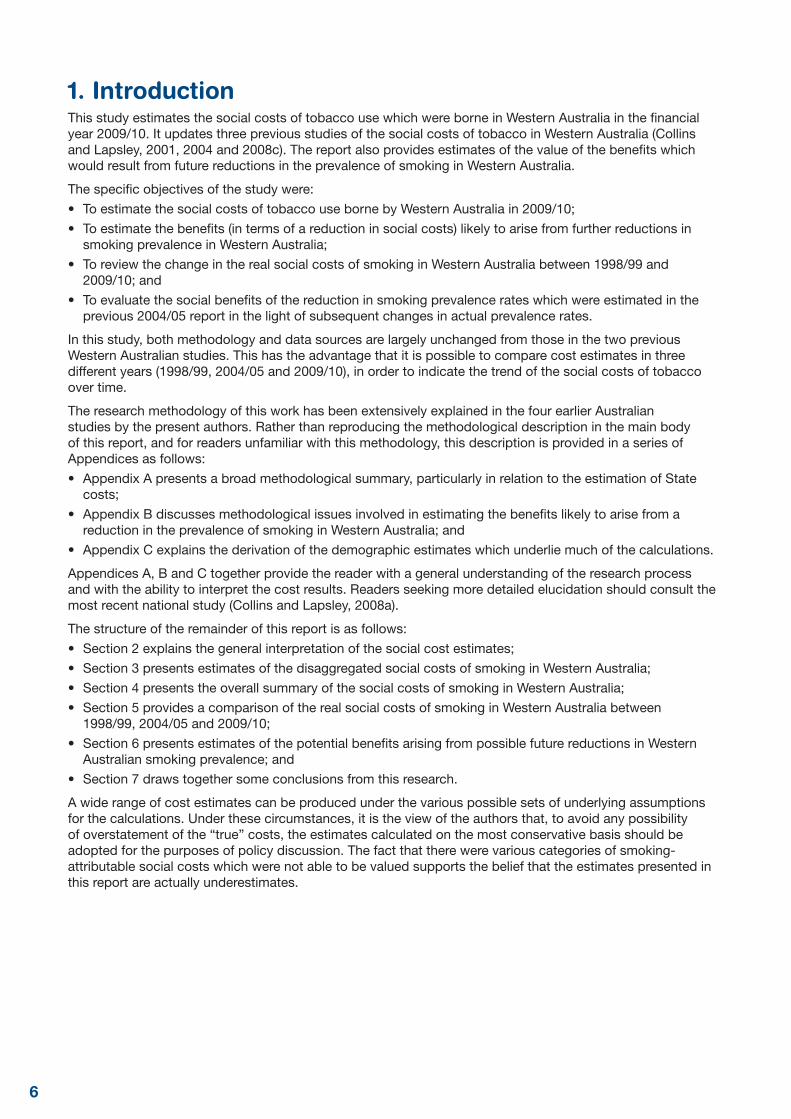
1. IntroductionThis study estimates the social costs of tobacco use which were borne in Western Australia in the financial year 2009/10. It updates three previous studies of the social costs of tobacco in Western Australia (Collins and Lapsley, 2001, 2004 and 2008c). The report also provides estimates of the value of the benefits which would result from future reductions in the prevalence of smoking in Western Australia.
The specific objectives of the study were:
• To estimate the social costs of tobacco use borne by Western Australia in 2009/10;
• To estimate the benefits (in terms of a reduction in social costs) likely to arise from further reductions in smoking prevalence in Western Australia;
• To review the change in the real social costs of smoking in Western Australia between 1998/99 and 2009/10; and
• To evaluate the social benefits of the reduction in smoking prevalence rates which were estimated in the previous 2004/05 report in the light of subsequent changes in actual prevalence rates.
In this study, both methodology and data sources are largely unchanged from those in the two previous Western Australian studies. This has the advantage that it is possible to compare cost estimates in three different years (1998/99, 2004/05 and 2009/10), in order to indicate the trend of the social costs of tobacco over time.
The research methodology of this work has been extensively explained in the four earlier Australian studies by the present authors. Rather than reproducing the methodological description in the main body of this report, and for readers unfamiliar with this methodology, this description is provided in a series of Appendices as follows:
• Appendix A presents a broad methodological summary, particularly in relation to the estimation of State costs;
• Appendix B discusses methodological issues involved in estimating the benefits likely to arise from a reduction in the prevalence of smoking in Western Australia; and
• Appendix C explains the derivation of the demographic estimates which underlie much of the calculations.
Appendices A, B and C together provide the reader with a general understanding of the research process and with the ability to interpret the cost results. Readers seeking more detailed elucidation should consult the most recent national study (Collins and Lapsley, 2008a).
The structure of the remainder of this report is as follows:
• Section 2 explains the general interpretation of the social cost estimates;
• Section 3 presents estimates of the disaggregated social costs of smoking in Western Australia;
• Section 4 presents the overall summary of the social costs of smoking in Western Australia;
• Section 5 provides a comparison of the real social costs of smoking in Western Australia between 1998/99, 2004/05 and 2009/10;
• Section 6 presents estimates of the potential benefits arising from possible future reductions in Western Australian smoking prevalence; and
• Section 7 draws together some conclusions from this research.
A wide range of cost estimates can be produced under the various possible sets of underlying assumptions for the calculations. Under these circumstances, it is the view of the authors that, to avoid any possibility of overstatement of the “true” costs, the estimates calculated on the most conservative basis should be adopted for the purposes of policy discussion. The fact that there were various categories of smoking-attributable social costs which were not able to be valued supports the belief that the estimates presented in this report are actually underestimates.

7The social costs of smoking in Western Australia in 2009/10 and the social benefits of public policy measures to reduce smoking prevalence
2. Interpreting the social cost estimatesThe definition of the social costs of tobacco use adopted for the purposes of this study is:
The value of the net resources which in a given year are unavailable to the community for consumption or investment purposes as a result of the effects of past and present tobacco consumption, plus the intangible costs imposed by this consumption.
This definition reflects a distinction between tangible and intangible costs. Tangible costs are costs such as hospital costs which, when reduced, release resources for other uses. When intangible costs, such as pain and suffering, are reduced there is no release of resources. The beneficiaries cannot pass on these benefits to anyone else.
The costs calculated in this study are the costs of smoking which, it is estimated, were actually borne in the financial year 2009/10. The basis for this calculation is a comparison between the various costs (for example, for health care or in terms of reduced labour productivity) which were borne in that year and the level of costs which would have been borne in the same year had there been no previous or current smoking in Western Australia. Thus the actual smoking situation is compared with the hypothetical counterfactual situation in which it is assumed that there had been no smoking by the Western Australian population in the previous period of more than 50 years. A comparison is made between the current actual situation and a theoretical situation of no past or present smoking.
The estimation methodology is described in much greater detail in Appendix A.

8
3. Some disaggregated costsThis section provides detailed estimates of the smoking-attributable costs of health care, production losses and fires. The next section provides an overall summary of the social costs of tobacco. This form of presentation is adopted to provide more comprehensive information on these areas of costs than is practicable in the aggregate tables.
HealthSmoking-attributable morbidity imposes direct health care costs for medical services, hospitals, nursing homes, pharmaceuticals and ambulances. However, the premature deaths caused by tobacco use can relieve the community of some health care cost burdens. Had the prematurely deceased been still alive they would have been placing demands on health care resources, demands which have been avoided as a result of the premature deaths. This report, in order to be consistent with the definition of social costs presented in Section 2 above and discussed more fully in Appendix A, estimates these health care savings as well as the direct health care costs.
Table 1 shows the health care costs due to smoking, and the savings in health care costs due to the premature deaths of smokers. The pharmaceutical costs identified here apply to prescribed pharmaceuticals outside the hospital system.
Table 1 Health care costs and savings attributable to smoking, Western Australia, 2009/10
Medical$m
Hospitals$m
Nursing homes
$m
Pharmaceuticals$m
Ambulances$m
Total$m
Direct health care costs
37.3 93.7 53.0 14.9 3.3 202.1
Savings resulting from previous premature deaths
36.1 79.8 81.0 12.0 2.2 211.2
Net costs 1.1 13.9 (28.0) 2.9 1.1 (9.1)
Note: Figures in brackets are negative.
The total direct health care costs, the figure which is most usually discussed in the public debate, represented a figure of $202m in the financial year 2009/10. There were, however, considerable offsets in the form of the health care savings resulting from premature tobacco-attributable deaths. The largest of these offsets is related to nursing homes. With such a relatively high proportion of tobacco-attributable deaths occurring at or past normal retirement ages, and with such a high proportion of nursing home residents being of advanced ages, smoking almost certainly reduces the total demand for nursing home places. After taking account of the overall savings resulting from premature deaths, the net Western Australian health costs were negative to the tune of $9m.
Great care should be taken to interpret correctly this type of information. In no way can it be claimed that, if the health care savings resulting from the premature deaths exceed the gross health care costs, these deaths would be in the community’s interest. The community bears other costs as a result of premature deaths, as is clearly illustrated by later information presented on the other tangible and intangible social costs of smoking.
Overall, health care costs have increased at a rate exceeding the Consumer Price Index. This is due to a number of factors, including the availability of more expensive and complex procedures, resulting in patients consuming more resources.
Over the time that these cost studies have been undertaken, there have been a number of changes and refinements in the cost data available in the health care system, particularly the use of casemix in hospital cost data. The diagnosis identifies those cases which have a disease which is attributable to smoking, and the costs of the events are assigned to the relevant casemix (or DRG) category. Over time, better and more comprehensive costing has enabled more accurate classification of the patient’s resource use.
A number of the tobacco aetiological fractions have become more complex, with more co-morbidities. Chronic obstructive pulmonary disease (COPD) is one example, where the costs have increased as more effective and more expensive treatments have become available (see Mannino and Buist, 2007).

9The social costs of smoking in Western Australia in 2009/10 and the social benefits of public policy measures to reduce smoking prevalence
In Western Australia, there is a greater reliance on the hospital tertiary sector compared with other States, so that these factors which increase costs will be emphasised in the WA hospital cost data.
Table 2 presents estimates of tobacco-attributable deaths caused and prevented by smoking. A very small number of deaths and hospital bed-days (in relation to Parkinson’s disease and endometrial cancer) are prevented through tobacco consumption. The protective effects of tobacco are extremely small relative to the harmful effects.
Table 2 Tobacco-attributable deaths, hospital bed days and hospital costs, caused and prevented, Western Australia, 2009/10
Deaths(number)
Hospital bed days(number)
Hospital costs ($m)
Caused 1,437 66,373 94.6
Prevented 17 800 0.9
Caused less prevented 1,420 65,573 93.7
The following two tables reflect the deaths, bed-days and hospital costs of voluntary and involuntary smoking. Table 3 shows the absolute numbers and Table 4 the relative proportions. These estimates show that the costs of involuntary smoking result largely from involuntary smoking by children and the unborn, the most fragile and blameless in the population.
Table 3 Tobacco-attributable deaths, hospital bed days and hospital costs, by age and smoking status, Western Australia, 2009/10
Voluntary Involuntary Total
Deaths (number)
0-14 0 2 2
15+ 1,409 9 1,418
Total 1,409 11 1,420
Hospital bed days (number)
0-14 0 7,614 7,614
15+ 57,783 176 57,959
Total 57,783 7,790 65,573
Hospital costs ($m)
0-14 0.0 9.8 9.8
15+ 83.6 0.3 83.9
Total 83.6 10.1 93.7

10
Table 4 Proportions of tobacco-attributable deaths, hospital bed days and hospital costs, by age and smoking status, Western Australia, 2009/10
Voluntary Involuntary Total
Deaths
0-14 0.0% 15.7% 0.1%
15+ 100.0% 84.3% 99.9%
Total 100.0% 100.0% 100.0%
Hospital bed days
0-14 0.0% 97.7% 11.6%
15+ 100.0% 2.3% 88.4%
Total 100.0% 100.0% 100.0%
Hospital costs
0-14 0.0% 96.7% 10.5%
15+ 100.0% 3.3% 89.5%
Total 100.0% 100.0% 100.0%
Over 96 per cent of all hospital costs arising from involuntary smoking are attributable to patients in the 0-14 age group. The major tobacco-attributable conditions affecting this age group are asthma, lower respiratory tract infection, otitis media, low birthweight and fire injuries.
ProductivityTable 5 presents estimates of the loss of productivity in Western Australia which is caused by smoking. These losses are estimated for the paid workforce and also within the household sector. For details of the calculation of labor costs within the household sector see Australian Bureau of Statistics (2000). As with the preceding cost estimates, these are net estimates, and show the amount of resources which would have been available if there had been no tobacco-attributable productivity losses.
Table 5 Paid and unpaid production costs of smoking, Western Australia, 2009/10
Male$m
Female$m
Total$m
Labour in the workforce
Reduction in the workforce 182.7 75.0 257.7
Absenteeism 115.5 24.8 140.2
Total paid production costs 298.1 99.7 397.9
Labour in the household
Premature death 679.2 631.4 1,310.6
Sickness 79.5 47.5 127.0
Total unpaid production costs 758.7 678.9 1,437.6
Total gross paid and unpaid production costs 1,056.8 778.7 1,835.5
Consumption resources saved 649.3 324.0 973.4
Total net production costs 407.5 454.6 862.1
In calculating “Total net production costs” for the above table, the item “consumption resources saved” is deducted from gross production costs. As a result of premature smoking-attributable deaths of smokers, these smokers no longer make a call on national consumption resources. These released resources represent a “benefit” in the sense that they are released and so made available for other consumption or investment purposes.
The value of the total productivity loss in Western Australia in 2009/10, in both the workforce and the household sector, is estimated to be $862m.

11The social costs of smoking in Western Australia in 2009/10 and the social benefits of public policy measures to reduce smoking prevalence
FiresTable 6 provides estimates of the costs of smoking-attributable fires in Western Australia. Total costs are estimated to be $24m, with tangible costs representing 86 per cent of total costs.
Smoking-attributable fire costs include both health costs and productivity losses, for which separate aggregate smoking cost estimates are made. Productivity and health costs cannot be included in both areas without double counting, and yet to exclude them from fire costs would give the impression that the total costs of smoking-attributable fires were lower than they in fact are. This problem is overcome by presenting the overall costs as well as costs “n.e.i.” (not elsewhere included). These latter costs are the values carried over to the aggregate tables. In this way all double counting is avoided.
Table 6 Costs of smoking-attributable fires, Western Australia, 2009/10
$m Total $m
Health
Medical 0.6
Hospital 1.3
Total health 1.9
Labour
In the workforce 6.2
In the household 2.7
Total labour 8.9
Fire services 6.9
Property damage 3.0
Total tangible costs 20.8
Value of loss of life 3.3
Total intangible costs 3.3
Total costs 24.0
Total tangible n.e.i. 9.9
Relevant costs as per cent of Gross State Product 0.01 per cent

12
4. Aggregate resultsThis section presents a series of tables providing a range of aggregate tobacco-attributable cost estimates, including tangible and intangible costs, the incidence of total costs, their budgetary impact at both Federal and State levels, and a comparison of selected attributable costs in Western Australia with Western Australian state output, as measured by gross state product.
Tangible costsThe tangible social costs of smoking presented in Table 7 are estimated at $1,259.2m, the largest component of which reflects the reduction in production due to premature deaths.
Table 7 Tangible social costs of smoking, Western Australia, 2009/10
$m Total $m
Labour in the workforce
Reduction in workforce 257.7
Absenteeism 140.2
Total workforce labour 397.9
Labour in the household
Premature death 1,310.6
Sickness 127.0
Total household labour 1,437.6
Total gross labour costs 1,835.5
Less consumption resources saved 973.4
Total net labour costs 862.1
Health care (net)
Medical 1.1
Hospital 13.9
Nursing homes (28.0)
Pharmaceuticals 2.9
Ambulances 1.1
Total health care (9.1)
Fires n.e.i. 9.9
Resources used in tobacco consumption 396.2
Total 1,259.2
Notes: “n.e.i.” indicates not elsewhere included.Figures in brackets are negative.
The above table includes the item “Resources used in tobacco consumption”. This represents the value at factor cost of the resources used in the domestic production or import of tobacco products. These resources would, in the absence of all smoking, be available for other consumption or investment uses.
Intangible costsIntangible costs arise from loss of life and from pain and suffering. The only intangible cost which it proved possible to estimate in this study was loss of life. This cost is estimated to have been $1,697.4m. An explanation of how this figure is calculated is presented in Appendix A.
13The social costs of smoking in Western Australia in 2009/10 and the social benefits of public policy measures to reduce smoking prevalence
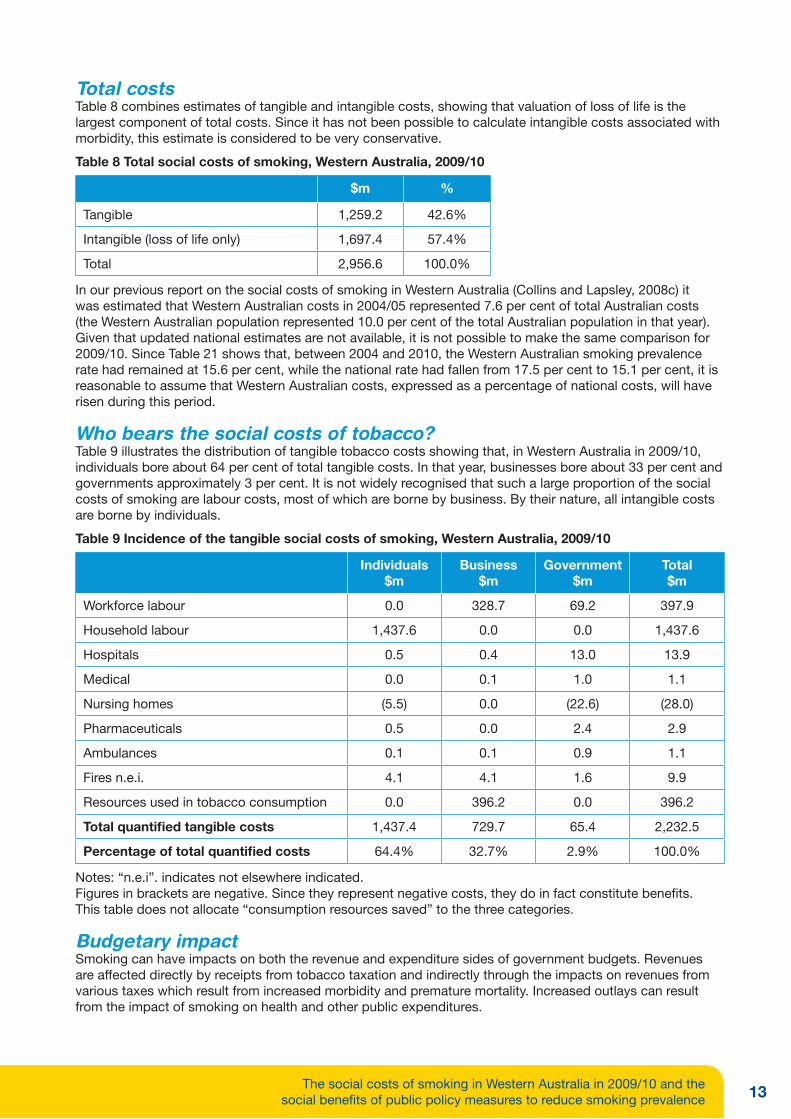
Total costsTable 8 combines estimates of tangible and intangible costs, showing that valuation of loss of life is the largest component of total costs. Since it has not been possible to calculate intangible costs associated with morbidity, this estimate is considered to be very conservative.
Table 8 Total social costs of smoking, Western Australia, 2009/10
$m %
Tangible 1,259.2 42.6%
Intangible (loss of life only) 1,697.4 57.4%
Total 2,956.6 100.0%
In our previous report on the social costs of smoking in Western Australia (Collins and Lapsley, 2008c) it was estimated that Western Australian costs in 2004/05 represented 7.6 per cent of total Australian costs (the Western Australian population represented 10.0 per cent of the total Australian population in that year). Given that updated national estimates are not available, it is not possible to make the same comparison for 2009/10. Since Table 21 shows that, between 2004 and 2010, the Western Australian smoking prevalence rate had remained at 15.6 per cent, while the national rate had fallen from 17.5 per cent to 15.1 per cent, it is reasonable to assume that Western Australian costs, expressed as a percentage of national costs, will have risen during this period.
Who bears the social costs of tobacco?Table 9 illustrates the distribution of tangible tobacco costs showing that, in Western Australia in 2009/10, individuals bore about 64 per cent of total tangible costs. In that year, businesses bore about 33 per cent and governments approximately 3 per cent. It is not widely recognised that such a large proportion of the social costs of smoking are labour costs, most of which are borne by business. By their nature, all intangible costs are borne by individuals.
Table 9 Incidence of the tangible social costs of smoking, Western Australia, 2009/10
Individuals$m
Business$m
Government$m
Total$m
Workforce labour 0.0 328.7 69.2 397.9
Household labour 1,437.6 0.0 0.0 1,437.6
Hospitals 0.5 0.4 13.0 13.9
Medical 0.0 0.1 1.0 1.1
Nursing homes (5.5) 0.0 (22.6) (28.0)
Pharmaceuticals 0.5 0.0 2.4 2.9
Ambulances 0.1 0.1 0.9 1.1
Fires n.e.i. 4.1 4.1 1.6 9.9
Resources used in tobacco consumption 0.0 396.2 0.0 396.2
Total quantified tangible costs 1,437.4 729.7 65.4 2,232.5
Percentage of total quantified costs 64.4% 32.7% 2.9% 100.0%
Notes: “n.e.i”. indicates not elsewhere indicated.Figures in brackets are negative. Since they represent negative costs, they do in fact constitute benefits.This table does not allocate “consumption resources saved” to the three categories.
Budgetary impactSmoking can have impacts on both the revenue and expenditure sides of government budgets. Revenues are affected directly by receipts from tobacco taxation and indirectly through the impacts on revenues from various taxes which result from increased morbidity and premature mortality. Increased outlays can result from the impact of smoking on health and other public expenditures.

14
The introduction of the GST package in July 2000 had a significant impact on the distribution of tobacco tax revenues between the Commonwealth and the States. The Federal Government retained sole control of customs and excise taxes on tobacco. The States lost the Revenue Replacement Payments, which had constituted Federal compensation for the States’ earlier loss of tobacco franchise taxes, and received only the revenue from the ten per cent GST rate on tobacco. Table 10 below shows how these changes affected the distribution of tax revenues between 1998/99 and 2009/10.
Table 10 Tobacco tax revenues raised from Western Australian smokers, 1998/99 and 2009/10
1998/99 2009/10
Federal$m
Western Australia (RRPs)
$m
Total$m
Federal$m
Western Australia
(GST)$m
Total$m
Excise tax 151.9 346.3 498.2 547.0 0.0 547.0
Customs duties 23.7 0.0 23.7 72.4 0.0 72.4
GST n.a. n.a. n.a. 0.0 79.0 0.0
Total revenue 175.6 346.3 521.9 619.4 79.0 698.4
Percentage 33.6% 66.4% 100.0% 88.7% 11.3% 100.0%
Sources: Australian Bureau of Statistics, Taxation Revenue 1999/2000 and 2010/11(5506.0).Australian Taxation Office, Taxation Statistics 1998/99 and 2009/10.Authors’ calculations of GST revenue.Note: n.a. means not applicable.
This table shows how the taxation of tobacco is now entirely a Commonwealth prerogative. In 2009/10, the Commonwealth received 88.7 per cent of total tobacco tax revenue from Western Australian smokers (up from 33.6 per cent in 1998/99). Western Australia, on the other hand, received 66.4 per cent of tobacco tax revenue from smokers in that State in 1998/99, but only 11.3 per cent in 2009/10. In practice, the States now have no ability to control the GST tax rate, their single remaining source of tax revenue from tobacco.
It does not appear that it will be possible in the future to obtain accurate data on revenues from tobacco excise as Federal Treasury has stated that, in future, tobacco estimates will not be separately reported “due to taxpayer confidentiality” (2013/14 Budget Paper No. 1, Statement 5 Appendix B, note to Table B1)
The following three tables indicate the impact of smoking in Western Australia on Federal Government and Western Australian Government budgets.

15The social costs of smoking in Western Australia in 2009/10 and the social benefits of public policy measures to reduce smoking prevalence
Table 11 Impact of Western Australian smoking on the Federal budget, 2009/10
Outlays $m $m Receipts $m $m
Health Excise tax 547.0
Hospitals 5.5 Customs duty 72.4
Medical 1.0 Total tobacco revenue 619.4
Nursing homes (20.7) Less
Pharmaceuticals 2.4 Revenue forgone
Ambulances 0.2 Income tax 42.0
Total health (11.6) Indirect taxes 139.6
Fires n.e.i 0.3 Total revenue forgone 181.6
Total outlays (11.4) Total net revenue 437.7
Net revenue minus outlays 449.1
Note: Figures in brackets are negative.
Table 12 Impact of Western Australian smoking on the Western Australian State budget, 2009/10
Outlays $m Total $m Receipts $m
Health GST 79.0
Hospital 7.5
Medical 0.0
Nursing homes (1.9)
Pharmaceuticals 0.0
Ambulances 0.7
Total health 6.3
Fires n.e.i. 1.3
Total outlays 7.6 Total revenue 79.0
Net revenue minus outlays 71.4
Note: Figures in brackets are negative.

16
Table 13 Total budgetary impact of Western Australian smoking, 2009/10
Outlays $m Total $m Receipts $m Total $m
Health Excise tax 547.0
Hospitals 13.0 Customs duty 72.4
Medical 1.0 GST 79.0
Nursing homes (22.6) Total tobacco revenue 698.4
Pharmaceuticals 2.4 Less
Ambulances 0.9 Revenue forgone
Total health (5.3) Income tax 42.0
Fires n.e.i. 1.6 Indirect taxes 139.6
Total revenue forgone 181.6
Total outlays (3.7) Total net revenue 516.8
Net revenue minus outlays 520.5
Note: Figures in brackets are negative
The expenditure figures in the above three tables relate to government expenditure only. As Table 9 shows, further tobacco-attributable costs are also borne by individuals and by the business sector.
The above revenue estimates implicitly assume that, if there had been no smoking, private consumption expenditure on tobacco products would not have been diverted to other forms of consumption expenditure but would simply have increased savings. Practically, it is not possible to identify alternative expenditure patterns, therefore the impact on total revenue and on the distribution of revenue between Federal and State Government cannot be estimated.
The impact of smoking on outlays and receipts at individual Federal and State levels depends upon the allocation of expenditure responsibilities and taxing powers between the two levels of government. For example, hospital expenditures are undertaken by both Federal and State Governments while medical expenditures are purely a Federal responsibility. On the revenue side, customs duties are purely a Federal tax while GST revenues accrue solely to the States.
The July 2000 change in the tobacco tax arrangements detailed in Appendix D has meant that the Federal Government is now by far the main budgetary beneficiary of revenues from smoking. In relation to Western Australia, Federal tobacco-attributable expenditures were in 2009/10 exceeded by tobacco tax revenue to the tune of nearly $449m. The Western Australian budget benefitted to the extent of an excess of revenue over expenditure of $71m.
The above tables exclude State and Federal expenditures on tobacco control activities. It has been argued that these types of expenditures, for example on anti-smoking campaigns and smoking-related research, are the discretionary effects of public decisions to reduce smoking rather than the direct effects of cigarette consumption, and as such should be excluded from smoking cost estimates. This point has been accepted here for the estimation of smoking-attributable social costs but it is still useful to identify the extent of these types of expenditures. Details of Western Australian expenditure on tobacco control activities, by both State government and non-government organisations, are presented in Table 14 below.

17The social costs of smoking in Western Australia in 2009/10 and the social benefits of public policy measures to reduce smoking prevalence
Table 14 Expenditure on tobacco control activities in Western Australia, 2009/10
Agency
Funding Source
Healthway$
DOH$
Other$
Total$
Aboriginal Health Council of WA (AHCWA) 109,661 94,600 204,261
Asthma Foundation WA 77,390 100,764 178,154
Australian Council on Smoking and Health (ACOSH) 205,789 205,789
Cancer Council WA 460,000 1,522,400 300,000 2,282,400
Department of Health Western Australia (DOH) 1,189,658 1,189,658
Healthway 3,048,220 3,048,220
National Heart Foundation (WA) 701,045 701,045
Total 4,524,715 2,789,448 495,364 7,809,527
Source: This information was supplied by the agencies listed. These data relate only to directly identified tobacco control expenditures, not to expenditures by other government departments or non-government organisations (NGOs) for which tobacco control is not identified as part of their core business and from which disaggregated tobacco control-related data are not available.
Notes:
• AHCWA expenditure covers its WA Tobacco Control Project.
• Asthma Foundation WA expenditure covers the Newborns Asthma and Parental Smoking Indigenous Women’s Project.
• Cancer Council WA expenditure covers the Make Smoking History and Fresh Start programs.
• DOH Asthma Foundation expenditure covers Newborns Asthma and Parental Smoking Indigenous Women’s Project.
• DOH Cancer Council WA expenditure covers the Make Smoking History program
• DOH expenditure includes salaries, tobacco control policy, public education and tobacco licensing funded activities.
• Healthway grant monies expended in 2009/10 financial year for major tobacco control projects appear as expenditure against relevant agencies. Remaining Healthway expenditure appears against Healthway and includes funds dispersed to NGOs for tobacco control projects which were not expended in the 2009/10 by contracted organisations, sponsorship funding for sport, arts and racing organisations (where anti-tobacco messages were assigned to the organisation), and other tobacco control projects. Please note, this is an underestimation as the figures do not include expenditure for the service level agreements with health agencies to cover staffing cost associated with Healthway sponsorships promoting a tobacco control message.
• National Heart Foundation expenditure covers the Smarter than Smoking project.
Tobacco-attributable costs and gross state productEstimates of aggregate drug-attributable social costs tend to produce numbers which are very large in absolute terms. Commentators often attempt to put these numbers in context by expressing them as a percentage of gross domestic product (GDP), which is a measure of the total value of national production or national income. Similarly, attempts to make international comparisons of the relative sizes of aggregate drug abuse costs in economies of very different sizes (for example, Australia and the USA) tend to be made by comparing aggregate costs expressed as a percentage of GDP.
A problem with this approach is that estimates of drug abuse costs contain certain (sometimes very large) components that are not measured in conventional national account measurements of GDP. In the present study these unmeasured components consist of all intangibles (loss of life) and production losses in the household (unpaid) sector. Thus, when total drug-attributable costs are compared with GDP, like is not being compared with like.

18
In order to overcome this problem, Table 15 below compares Western Australian gross state product (GSP) at factor cost (that is, excluding taxes and subsidies) with only those components of drug abuse costs which are conventionally measured in national accounts data. GSP is the state equivalent of GDP.
Table 15 Comparison of some smoking-attributable cost categories with Western Australian Gross State Product, 2009/10
$m Per cent of GSP
Labour in the workforce 397.9 0.24%
Net health care (9.1) (0.01%)
Fires n.e.i. 9.9 0.01%
Resources used in tobacco consumption 396.2 0.23%
Total 794.9 0.47%
Note: Figures in brackets are negative.
The relevant components of tobacco-attributable costs represented in total 0.47 per cent of Western Australian GSP in 2009/10.
19The social costs of smoking in Western Australia in 2009/10 and the social benefits of public policy measures to reduce smoking prevalence
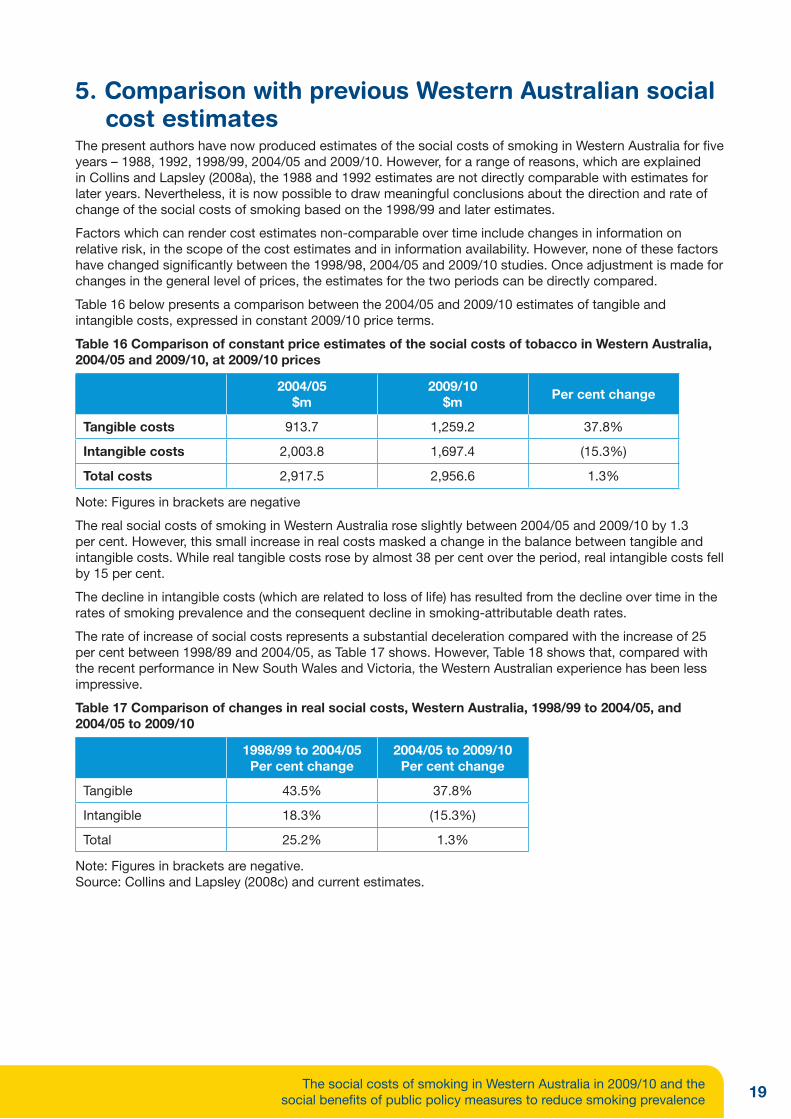
5. Comparison with previous Western Australian social cost estimates
The present authors have now produced estimates of the social costs of smoking in Western Australia for five years – 1988, 1992, 1998/99, 2004/05 and 2009/10. However, for a range of reasons, which are explained in Collins and Lapsley (2008a), the 1988 and 1992 estimates are not directly comparable with estimates for later years. Nevertheless, it is now possible to draw meaningful conclusions about the direction and rate of change of the social costs of smoking based on the 1998/99 and later estimates.
Factors which can render cost estimates non-comparable over time include changes in information on relative risk, in the scope of the cost estimates and in information availability. However, none of these factors have changed significantly between the 1998/98, 2004/05 and 2009/10 studies. Once adjustment is made for changes in the general level of prices, the estimates for the two periods can be directly compared.
Table 16 below presents a comparison between the 2004/05 and 2009/10 estimates of tangible and intangible costs, expressed in constant 2009/10 price terms.
Table 16 Comparison of constant price estimates of the social costs of tobacco in Western Australia, 2004/05 and 2009/10, at 2009/10 prices
2004/05$m
2009/10$m
Per cent change
Tangible costs 913.7 1,259.2 37.8%
Intangible costs 2,003.8 1,697.4 (15.3%)
Total costs 2,917.5 2,956.6 1.3%
Note: Figures in brackets are negative
The real social costs of smoking in Western Australia rose slightly between 2004/05 and 2009/10 by 1.3 per cent. However, this small increase in real costs masked a change in the balance between tangible and intangible costs. While real tangible costs rose by almost 38 per cent over the period, real intangible costs fell by 15 per cent.
The decline in intangible costs (which are related to loss of life) has resulted from the decline over time in the rates of smoking prevalence and the consequent decline in smoking-attributable death rates.
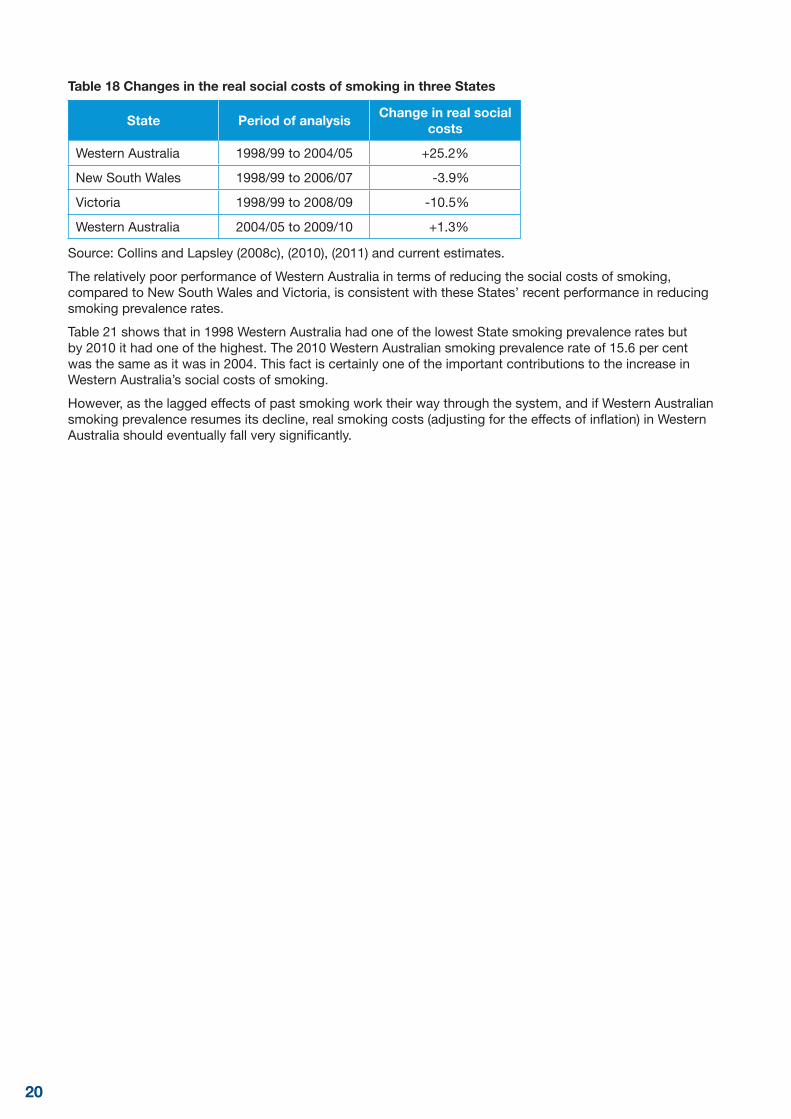
The rate of increase of social costs represents a substantial deceleration compared with the increase of 25 per cent between 1998/89 and 2004/05, as Table 17 shows. However, Table 18 shows that, compared with the recent performance in New South Wales and Victoria, the Western Australian experience has been less impressive.
Table 17 Comparison of changes in real social costs, Western Australia, 1998/99 to 2004/05, and 2004/05 to 2009/10
1998/99 to 2004/05Per cent change
2004/05 to 2009/10Per cent change
Tangible 43.5% 37.8%
Intangible 18.3% (15.3%)
Total 25.2% 1.3%
Note: Figures in brackets are negative.Source: Collins and Lapsley (2008c) and current estimates.
20
Table 18 Changes in the real social costs of smoking in three States
State Period of analysisChange in real social
costs
Western Australia 1998/99 to 2004/05 +25.2%
New South Wales 1998/99 to 2006/07 -3.9%
Victoria 1998/99 to 2008/09 -10.5%
Western Australia 2004/05 to 2009/10 +1.3%
Source: Collins and Lapsley (2008c), (2010), (2011) and current estimates.
The relatively poor performance of Western Australia in terms of reducing the social costs of smoking, compared to New South Wales and Victoria, is consistent with these States’ recent performance in reducing smoking prevalence rates.
Table 21 shows that in 1998 Western Australia had one of the lowest State smoking prevalence rates but by 2010 it had one of the highest. The 2010 Western Australian smoking prevalence rate of 15.6 per cent was the same as it was in 2004. This fact is certainly one of the important contributions to the increase in Western Australia’s social costs of smoking.
However, as the lagged effects of past smoking work their way through the system, and if Western Australian smoking prevalence resumes its decline, real smoking costs (adjusting for the effects of inflation) in Western Australia should eventually fall very significantly.

21The social costs of smoking in Western Australia in 2009/10 and the social benefits of public policy measures to reduce smoking prevalence
6. The economic benefits of reduced smoking prevalence in Western Australia
This section presents estimates of the social benefits which would arise as a result of a reduction in the 2010 smoking prevalence rate in Western Australia from 15.6 per cent (see Australian Institute of Health and Welfare, 11, Table 3.5) to rates of 4.3 per cent or 10.0 per cent over a period of 15 years. The smoking prevalence rates referred to relate to the percentage of people aged 14 years or over who smoke on a daily basis. The target prevalence rate of 4.3 per cent was supplied by Cancer Council Western Australia for the purposes of this study. It is based on an extrapolation of the linear trend in daily smoking rates between 1998 and 2010. The alternative target of ten per cent represents a less ambitious, and more conservative target, analysed for the purposes of comparison.
The calculated benefits are expressed in terms of the resulting reduction of the social costs of smoking. The present study makes no judgment as to whether the assumed prevalence reductions are feasible or what mix of public policies would be necessary to achieve such reductions. The results can be used to indicate the extent of public resources which could justifiably be employed on anti-smoking programs, if these programs led to the reductions in the Western Australian smoking prevalence rates considered in this paper.
Appendix B discusses the various methodological issues and problems involved in an economic evaluation of a reduction in smoking prevalence. Given the paucity of relevant research information it is necessary to undertake the evaluation on the basis of the adoption of certain sets of assumptions. Table 19 indicates, for each of the issues identified in Appendix B, what we judge to be the “most conservative” approach (in terms of having the effect of minimising the estimated present value of the social benefits of the reduction in smoking prevalence), the “least conservative” approach (in terms of having the effect of maximising the present value of the social benefits of the reduction in smoking prevalence) and the “most plausible” approach (in terms of its approximation, in our judgment, to reality). Thus, in this context, the term “conservative” is used to denote “yielding a comparatively low present value of the benefits of prevalence reduction”. “Least conservative” indicates “yielding a comparatively high present value of the benefits of prevalence reduction”.
Table 19 Assumptions underlying the evaluation of reduced smoking prevalence
Lag between reduction in prevalence and
reduction in social costs(years)
Period of analysis(years)
Discount rate(per cent)
Most conservative 10 20 10
Least conservative 6 30 4
Most plausible 8 20 6
Table 20 presents estimates of the present value in the financial year 2009/10 of the simulated smoking prevalence reductions, according to the most conservative, least conservative and most plausible sets of underlying analytical assumptions. It also presents estimates of the average benefits per smoker.
An assumption of this analysis is that, in the absence of effective interventions to reduce the rate of smoking prevalence in Western Australia, the rate would remain at the 2009/10 level of 15.6 per cent. In this scenario, the benefits accruing to smoking reduction interventions would result from a reduction of prevalence below the 2009/10 rate.
When estimating the average benefits per smoker, the term “smoker” includes both never-smokers (those who, as a result of the intervention, do not take up smoking) and ex-smokers (those who, as a result of the intervention, quit smoking). Therefore, there can be two components in any reduction in prevalence rates:
• Some existing smokers quit smoking; and
• Some smokers who die are not replaced by new smokers.

22
Table 20 The present value in 2009/10 of the social benefits of reductions in Western Australian smoking prevalence to 4.3 per cent and 10.0 per cent over 15 years
Assumption Set
Prevalence reduced to 4.3 per cent over 15 years
Prevalence reduced to 10.0 per cent over 15 years
Present value$m
Present value per smoker
$
Present value$m
Present value per smoker
$
Most conservative 1,271.4 6,167 510.7 4,999
Least conservative 14,083.4 68,315 6,054.4 59,262
Most plausible 3,580.6 17,368 1,421.9 13,917
These estimates range from $1,271.4m to $14,083.4m for the reduction in the prevalence rate to 4.3 per cent, and from $510.7m to $6,054.4m for the reduction in the prevalence rate to 10 per cent, over 15 years. The present values per smoker, as defined above, range from $4,999 to $68,315. Appendix B presents a testing of the sensitivity of these results to the adoption of a range of estimation assumptions indicated in Table 19 above. In general, we would tend to favour the most conservative analytical basis, and therefore the most conservative estimates.
These results may be more meaningful if they are placed into a policy context. For example, a conservative assumption could be adopted that public expenditures were required to yield a real social rate of return of at least ten per cent per annum and it could also be assumed that these public expenditures were successful in producing the reduction in Western Australian smoking prevalence to the assumed lower rates. On this basis, and on the most conservative set of estimation assumptions, the achievement of the lower prevalence rate of 4.3 per cent over 15 years would justify annual real expenditures of up to $150m at 2009/10 prices. Reducing the prevalence rate to 10.0 per cent over 15 years would justify annual expenditures of up to $60m.
These figures represent the maximum justified expenditures under very conservative assumptions. It is probable that the lower prevalence rates could be achieved by the application of much lower expenditures than these maxima (particularly if the Federal Government continues to raise the rate of excise tax on tobacco). Clearly, however, there is strong justification for effective annual public anti-smoking expenditure programs much higher than the actual 2009/10 Western Australian public expenditures of $7.8 million detailed in Table 14.
These calculations in themselves do not indicate whether public expenditure programs of this magnitude would lead to the targeted decline in prevalence, nor do they indicate the form which successful anti-smoking interventions should take. However, the magnitude of the potential cost savings available to successful interventions (as indicated by the avoidable cost estimates) would suggest that high social rates of return are available to effective policies and programs, even when the savings estimates are based on conservative assumptions.
Previous reports by the present authors in this series on the social costs of smoking in Western Australia also have presented estimates of the economic benefits of reductions in the rate of smoking prevalence in Western Australia. These estimates were based upon targets of future reductions in smoking prevalence rates. These targeted rates, as in the present study, were provided to the authors by Cancer Council Western Australia and the authors made no judgment as to the feasibility of the targeted reductions or the mix of public policies needed to achieve such a reduction.
The reliability of estimates of the benefits of reduced smoking prevalence depends partly upon the assumed future rates. With the passage of time it is now possible to compare actual prevalence outcomes with the rates assumed in previous studies, in order to judge whether the assumed rates have proved to be reasonably accurate. This exercise is conducted here for the estimates presented in Collins and Lapsley (2004 and 2008c).
Table 21 below presents a time series of smoking prevalence rates (defined as the percentage of people aged 14 years and older who are daily smokers) between 1998 and 2010 for Western Australia, all other Australian States and Territories, and Australia as a whole.

23The social costs of smoking in Western Australia in 2009/10 and the social benefits of public policy measures to reduce smoking prevalence
Table 21 Smoking prevalence rates, by State/Territory, 1998 to 2010
1998%
2001%
2004%
2007%
2010%
Western Australia 22.6 20.0 15.6 14.8 15.6
New South Wales 21.2 18.0 16.5 16.3 14.2
Victoria 23.4 19.2 17.5 16.5 14.9
Queensland 24.4 21.0 19.8 17.2 16.7
South Australia 19.3 20.1 16.5 16.5 15.0
Tasmania 24.4 20.6 21.5 22.6 15.9
ACT 22.5 18.4 16.2 14.7 11.0
Northern Territory 30.9 27.9 27.4 25.3 22.3
Australia 22.5 19.4 17.5 16.6 15.1
Source: Australian Institute of Health and Welfare (2011), 2010 National Drug Strategy Household Survey Report, Figure 3.
Smoking prevalence rates in Australia as a whole and in most of the other States and Territories have steadily declined over the period from 1998 to 2010. This was also true in the period 1998 to 2004 in Western Australia, which in 2004 had the lowest prevalence rate (15.6 percent) of any State or Territory. However, since 2004 the Western Australian smoking prevalence rate has stalled and in 2010 it was still 15.6 percent. In 2010, the Western Australian prevalence rate was higher than the rates in New South Wales, Victoria, South Australia, the ACT, and Australia as a whole.
Collins and Lapsley (2004) made separate benefit estimates on the basis of rate reductions of 5.1 percentage points (to 15 percent) and 10.1 percentage points (to 10 per cent) over a nine year period. Collins and Lapsley (2008c) assumed a reduction of 10.5 percentage points (to 5 per cent) over separate periods of 10 and 15 years. The assumptions and resulting benefit estimates are summarised in Table 22 below. In every case the present value estimates are based on the most conservative set of assumptions, that is, the set of assumptions that leads to the lowest estimated value. These assumption sets are described in the papers whose sources are given in Table 22 below.
Table 22 Summary of studies of the benefits of prevalence rate reductions
Base year of estimate
Period of analysis (years)
Assumed prevalence rate reduction
(percentage points)
Present value of benefits in base year
($m)
Present value per smoker
($)
2001/02 (a) 9 years 5.1 370.1 4,839
2001/02 (b) 9 years 10.1 733.0 4,839
2004/05 (a) 10 years 10.5 1406.0 8,398
2004/05 (b) 15 years 10.5 937.7 5,599
Source: For 2001/02 (a) and (b) Collins and Lapsley (2004) For 2004/05 (a) and (b) Collins and Lapsley (2008c)
The conclusion from the comparisons in the above table, taken with the Western Australian actual prevalence rates as shown in Table 21, are clear. As the prevalence rate assumptions in the study 2001/02(a) turned out to be reasonably accurate, the present value benefit estimates can be assumed to be reasonably reliable. On the other hand, since the rate reductions assumed in study 2001/02(b) were too optimistic, the 2001/02(b) estimates are clearly too high.
Given the disappointing prevalence outcome in Western Australia since 2004, the underlying rate reduction assumptions of 2004/05 (a) and (b) are seen to be overestimates, unless there prove to be very large reductions in the rates between 2010 and the remaining years of the estimate periods. This outcome seems unlikely.
The benefit estimates represent the present value in the base year of the social benefits if the target reductions in prevalence rates are achieved. To the extent that these target rates are not achieved in the stated time frame, the benefit estimates will prove to be too high. The choice of achievable target rates is clearly crucial for the reliability of the benefit estimates.

24
7. ConclusionsThis study indicates that the social costs of smoking in Western Australia remain high. In attempting to reduce smoking prevalence the States are handicapped by their inability to use one of the most effective anti-smoking tools – tobacco taxation. Only the Federal Government now has the power to implement discriminatory tobacco excise taxes. The GST, as a broad-based consumption tax whose revenue is hypothecated to the States, taxes tobacco at the standard ten per cent rate. However, there has been (correctly in our view) no willingness at State or Federal Government level to impose a discriminatory rate on tobacco above the standard GST rate. In terms of both compliance and administrative costs, use of the excise tax as a discriminatory instrument is preferable to use of a discriminatory GST rate.
The general Australian tax environment has another potential implication for public anti-smoking policies. As the research in this paper shows, the budgets of governments at both Federal and State levels are beneficiaries of smoking, since tobacco tax revenues exceed the costs of smoking which are borne by the public purse, even though the social costs of smoking remain high. This apparent paradox arises because a substantial proportion of the total tangible social costs of smoking is borne by the household and business sectors, not by government. As our estimates show, public expenditures on smoking reduction policies and programs have the potential to yield very substantial benefits indeed to the community as a whole, even if they might worsen individual governments’ budgetary positions. It would be unfortunate if government policies were dictated more by budgetary concerns than by a desire to reduce the overall social costs of smoking.
It is also useful to note that the Federal Government is in the fortunate position that it can, by the use of higher tobacco taxation, reduce smoking prevalence yet increase total tobacco tax revenue. Many studies of the responsiveness of the demand for tobacco products to changes in the price of tobacco have shown that a given tax-induced percentage increase in cigarette prices will lead to a smaller percentage decrease in cigarette demand, with the result that total tax revenue will rise. This would not, of course, be true if the tax increase eliminated the demand for cigarettes completely but that is a highly unlikely outcome. The tobacco taxation strategy is one which is only open in Australia to the Federal Government. Most recently, in December 2013 the Federal Government introduced a staged 12.5 per cent increase in tobacco excise to occur over the next four years. These increases to tobacco excise are in addition to the increase in prices of tobacco products that will occur under indexation arrangements. As a result, price per cigarette stick will increase from approximately 77 cents in 2013 to over one dollar per stick at the end of 2016.
The conclusions to be drawn from these research results are essentially the same as for previous studies. The estimated social costs of smoking in Western Australia are very high, as are the potential benefits of effective policies to reduce smoking prevalence. There is ample justification for increasing the levels of public expenditure devoted to the reduction of smoking prevalence in Western Australia. Further increasing the taxation of tobacco products – which is exclusively the prerogative of the Federal Government – remains an important policy to pursue. At a State level the range of tobacco control policies available deserves active consideration as there are both further future health and economic benefits to be achieved by doing so. The most effective form of Federal intervention is likely to be an increase in the taxation of tobacco products.

25The social costs of smoking in Western Australia in 2009/10 and the social benefits of public policy measures to reduce smoking prevalence
Appendix A Estimating the Western Australian costs of tobacco useThis section provides a summary of the issues involved in estimating the social costs of tobacco consumption. It reproduces in large part the methodological discussion of the previous Western Australian paper. For a more comprehensive treatment of the issues see Collins and Lapsley (2008a, sections 2-4).
The study estimates the social costs of smoking which are borne by Western Australia. This is not the same as the costs of smoking in Western Australia since some of the costs borne by Western Australia may result from smoking undertaken elsewhere. For example, people living in other States may smoke for many years before moving to Western Australia, whose health system will then bear the smoking-related illness costs. The reverse process is equally true, for example as a result of smokers, having lived their working life in Western Australia, moving to other States as their health-related smoking costs rise.
In order to be able to produce estimates of the social costs of smoking it is necessary to identify two types of information, relating to:
• causality; and
• costs.
CausalityInformation on causality is in large part epidemiological- identifying and quantifying the causal relationships between tobacco consumption, on the one hand, and mortality and morbidity, on the other. This causal information is, however, not confined to epidemiology. For example, the relationship between tobacco use and workplace productivity is a matter for several related disciplines, including industrial relations.
The quantification of tobacco costs relies upon the prior quantification of the causal relationships discussed above. Where causal relationships can be identified and quantified, the costs of smoking can almost always be estimated (although with varying degrees of accuracy).
A very considerable amount of information exists about the effects on mortality and morbidity of smoking and Western Australia has a proud record in this area of epidemiological research. The pioneering Australian work on the estimation of attributable fractions for tobacco was undertaken by Holman, Armstrong et al (1990) at the University of Western Australia. They estimated smoking attribution factors for all conditions for which it was possible to identify quantifiable causal relationships with smoking. The University of Western Australia also provided a team which produced a second comprehensive study on this topic (English, Holman et al,1995). Their work was subsequently updated by researchers at the Australian Institute of Health and Welfare (Ricardo and Stevenson, 2001). The most recent Australian research in this area is in the Australian Burden of Disease study undertaken by epidemiologists from the School of Population Health at the University of Queensland (see Begg et al, 2007).
Table 23 on following page presents a listing of all the causes of mortality and morbidity which these studies identify as being causally associated with the consumption of tobacco.

26
Table 23 Tobacco-caused conditions and defining ICD-10 codes
Diseases and conditions ICD-10 codes
Oropharyngeal cancer C00-14
Oesophageal cancer C15
Stomach cancer C16
Pancreatic cancer C25
Laryngeal cancer C32
Lung cancer C33-34
Cervical cancer C53, D06
Endometrial cancer C54
Bladder cancer C67
Kidney cancer C64-66, C68
Ischaemic heart disease I20-25
Chronic obstructive pulmonary disease J40-44
Tobacco abuse F17, T65.2, Z72.0
Parkinson’s disease G20-21
Pulmonary circulation disease I26.0, I27-28
Cardiac dysrhythmias I46-49
Heart failure I50-51, I97.1
Stroke I60-69, G45
Peripheral vascular disease I70.0-I70.8, I72-74
Lower respiratory tract infection J10-13, J15-18, J20.0, J20.2-20.9, J21-22
Crohn’s disease K50
Ulcerative colitis K51
Antepartum haemorrhage O20, O44.1, O45-46, P02.0-02.1
Low birthweight P05-07, P22
SIDS R95
Fire injuries X00-19
Asthma (under 15 years) J45-46
Macular degeneration H35.3-52.4
Otitis media H65-66
Source: Collins and Lapsley (2008a, Table 59).
The attributable fractions in relation to tobacco consumption are almost all positive. In other words, there are only very minor protective effects of tobacco consumption. The consumption of tobacco, even at low levels, is damaging to health.

27The social costs of smoking in Western Australia in 2009/10 and the social benefits of public policy measures to reduce smoking prevalence
CostsOnce the causal relationships have been established and quantified, the allocation of tangible costs is relatively straightforward. The major types of information used here are:
• National accounts data on consumption, output and income;
• Medical, hospital and nursing home costs and usage data;
• Data on pharmaceuticals usage and costs;
• Data on workforce, wage rates and earnings; and
• Budgetary data on tax revenues and public expenditures.
We consider that the approach adopted by this study confronts more directly than do most other studies the issue of the exact nature of social costs. It can also be argued that the methodology of this study leads to a much more comprehensible concept of cost.
The definition of the costs of tobacco use is very closely related to the definition of the costs of drug abuse used in Collins and Lapsley (2008a). It is:
The value of the net resources which in a given year are unavailable to the community for consumption or investment purposes as a result of the effects of past and present tobacco consumption, plus the intangible costs imposed by this consumption.
This definition reflects a distinction between tangible and intangible costs. Tangible costs are costs such as hospital costs which, when reduced, release resources for other uses. When intangible costs, such as pain and suffering, are reduced there is no release of resources. The beneficiaries cannot pass on these benefits to anyone else. Intangible costs are generally much more difficult to value than tangibles because there is no market in intangibles. Labour and capital resources are bought and sold, so that a market price exists. On the other hand, there is no market in pain, suffering and loss of life, with the result that it is more difficult to place a value on them. Intangibles are, however, important costs of tobacco use and they cannot sensibly be ignored by researchers and policymakers.
The above definition of tangible costs relates to the resources which would have been available had there been no smoking. This removes the need to consider the alternative uses to which these resources would, or would not, have been put. For example, if the alternative uses were to be specifically considered, the costs of smoking would vary according to the rate of unemployment. If unemployment were high, it could be argued, the costs of smoking would be lower because dead workers would have been either unemployed or replaced by the unemployed and little or no output would have been lost. This approach treats unemployment as a target of public policy rather than simply as a given. Governments and society can make their own decisions about the way they wish to react to the release of productive resources which would result from reduced tobacco consumption.
The categories of tangible costs which are estimated here are:
• Labour in the workforce (including reductions in the workforce size resulting from smoking-attributable mortality and increased absenteeism as a result of smoking-attributable morbidity),
• Labour in the household as a result of smoking-attributable mortality and morbidity,
• Health care,
• Fires, and
• Resources used in tobacco consumption.
The category “Resources used in tobacco consumption” represents the value at factor cost of the resources used in the domestic production or import of tobacco products. These resources would, in the absence of all smoking, be available for other consumption or investment uses.
Smoking causes premature deaths. When a life is lost prematurely the community bears two types of social costs – the loss of productive capacity (a tangible cost) and the psychological effects borne by the deceased and others (an intangible cost).
Valuing the loss of productive capacity is known as the human capital approach. It involves estimating the loss of the future stream of productive capacity and expressing it as a present-day value by the application of an appropriate discount rate. The psychological costs of premature death are estimated using the willingness-to-pay approach, in which researchers identify how much people would be willing to pay to reduce the risk of death in a particular period of time (death not being permanently avoidable). Generally, intangible costs (in this case, willingness-to-pay) are more difficult to value than tangible costs, for which conventional markets (and so market prices) exist.

28
Where the human capital approach is adopted, premature deaths of people of above workforce age are, by implication, considered to have no social cost since no productive capacity is lost. Indeed some “benefits” could be considered to accrue to the community as a whole since the resources which would have been needed to supply the consumption needs of the deceased are saved. However, the community by many actions (including the allocation of substantial health care resources to the aged) demonstrates clearly that it believes the lives of people of beyond work force age still to be of value. Thus, while it is important to value the loss of productive capacity, to ignore the psychological costs valued in a willingness-to-pay approach would produce a totally misleading estimate of the social cost of premature deaths.
The present study values the smoking-attributable loss of productive capacity in the year under study (a tangible cost) together with the psychological costs of premature death. Consistent with the demographic approach adopted here, the study estimates the value of the loss of one year’s living, not the value of a lost life (which can involve the loss of many years of living).
The Bureau of Transport Economics (2000) refers to a range of international willingness-to-pay estimates of the value of life. It indicates that a reasonable valuation of a lost life in Australia in 1996 would be $2m, which is at the low end of the range of international estimates. In this study this figure is adjusted to 2009/10 prices by the Australian National Accounts implicit price deflator for domestic final demand and converted to the value of a year’s living by reference to the average life expectancy of the Australian population.
The costs calculated in this study are the costs of smoking which, it is estimated, were actually borne in the financial year 2009/10. The basis for this calculation is a comparison between the various costs (for example for health care or reduced labour productivity) which were borne in that year and the level of costs which would have been borne in the same year had there been no previous or current smoking in Western Australia. Thus the actual smoking situation is compared with the hypothetical counterfactual situation in which it is assumed that there had been no smoking by the Western Australian population in the previous period of more than 50 years. A comparison is made between the current actual situation and a theoretical situation of no past or present smoking.
The total costs of abuse to the community consist of private costs and social costs (the latter are often referred to in the economic literature as “external” costs). If the costs of smoking are knowingly and freely borne by rational smokers, they constitute private costs. If these conditions are not satisfied, smoking costs become social costs. In the conventional terminology, the total costs of smoking to the community as a whole (both smokers and non-smokers) consist of the costs borne by informed and rational smokers (private costs) and the costs borne by the rest of the community (social costs). Thus:
Total costs = private costs + social costs
From the point of view of public policy it is social costs, not private costs, which are relevant. The costs which smokers impose on the rest of the community are important in determining the appropriate levels of tobacco consumption and in deciding appropriate public policies, for example tobacco tax rates and the resources devoted to smoking education programs. This study estimates the social costs of smoking in Western Australia.
Two broad approaches have been adopted to the estimation of the costs of substance use in general, and of tobacco use in particular - the widely adopted “human capital” approach and the more recent “demographic” approach. Both approaches are accepted and supported in the WHO’s International Guidelines for Estimating the Costs of Substance Abuse (Single et al, 2003). Both relate to the valuation of the loss of production arising from the tobacco-related deaths of otherwise productive members of society. Both approaches compare production and abuse costs in the actual situation with those in a hypothetical alternative situation which would have existed had there been no past or present tobacco use. The difference between the two approaches relates to the way in which the production costs of premature mortality are treated.
The human capital approach is to estimate the value of the worker’s future production stream, brought back to present day values by the use of an appropriate discount rate. A thousand dollars received this year is worth more than a thousand dollars received next year (even if there is no inflation) because this year’s resources become available for investment purposes a year earlier and so produce interest receipts or profits a year earlier. The use of a discount rate acknowledges this fact and adjusts for the difference between present and future values. Two major issues arise in the human capital approach - how to forecast future production levels and how to choose the appropriate discount rate.

29The social costs of smoking in Western Australia in 2009/10 and the social benefits of public policy measures to reduce smoking prevalence
The demographic approach compares the actual population size and structure with the size and structure of a hypothetical alternative non-smoking population. From this comparison the actual and hypothetical outputs are compared to yield the production costs in that year of past and present tobacco use. The major problem in this approach is the estimation of the alternative population structure, which is a demographic exercise. One major advantage of the demographic approach is that the need for arbitrary selection of a discount rate is avoided.
The present study adopts the demographic approach for two reasons:
• It avoids the very serious problem of determining an appropriate discount rate; and
• The results of this approach are much easier and more sensible to interpret.
Smoking, through its effects on mortality and morbidity, reduces both the number of people in the paid work force and the productivity of some people remaining in the work force. It also affects the output of people who are not in the paid work force but who are, nevertheless, contributing to real national output. This unpaid work includes domestic activities, childcare, and volunteer and community work. This study estimates the value of the loss of unpaid work resulting from smoking.
It is not, with the currently available information, possible to assign values to all of the types of social costs which smoking imposes. The major types of costs which are not estimated in this study are:
• Some prescribed pharmaceuticals consumed outside hospitals and non-prescribed pharmaceutical consumption;
• Domiciliary care and allied health professional services;
• Reduced on-the-job productivity;
• Litter; and
• Pain and suffering experienced by smokers and others.
This study estimates the social costs of smoking to Western Australia. It must be emphasised that it would not be possible to implement public policies which would eventually reduce all these social costs to zero. Public policies may be very successful in further reducing the prevalence of smoking but it is not within the current realms of possibility that smoking will disappear completely. Thus, of these total social costs of smoking, a component is avoidable with the remainder being unavoidable. Avoidable costs can be interpreted as being those costs which are susceptible to reduction as a result of the implementation of the appropriate public policies. They indicate the benefits potentially available to public policy initiatives.
Collins and Lapsley (2008a) discuss the problems of identifying which sections of the community bear the social costs imposed by tobacco use (individuals, government or business). It is, in practice, only possible to estimate the impact incidence of tangible tobacco costs. For example, businesses which face higher production costs as a result of a smoking-attributable decline in productivity might pass on some or all of these cost increases to their customers by charging higher prices. This type of reaction is referred to as cost-shifting. No attempt has been made to estimate any shifting behaviour adopted in response to the initial impact of these costs. By their nature, all intangible costs are borne by individuals.
In addition to the imposition which tobacco use places on real resources (such as the labour and capital used in supplying health care services) it also puts pressure on government budgets, as a result of the need to fund public expenditures on these types of services. However, the consumption of tobacco also produces government revenue, at the Federal level through customs and excises and the GST, whose revenue is fully earmarked for the States. The impact of recent changes to the taxation of tobacco is explained in section 3 above.
On the outlay side of the government budget, there will clearly be increased expenditures attributable to tobacco use but there will also be some attributable reductions. In particular, the premature mortality resulting from tobacco consumption will lead to some reduction in health expenditures. These “benefits”, as well as the costs, are estimated in this study.
On the revenue side, in addition to the evident gains there will also be losses in revenue. For example, premature mortality will lead to reduced output, incomes and consumption and so there will be reductions in revenue from income tax and indirect taxes. This analysis does not, however, include the relatively minor effects on revenues from corporate taxes such as company income tax, fringe benefits tax and payroll tax, for the reasons explained in Collins and Lapsley (1996).
The estimation of the budgetary impact of smoking is an exercise subsidiary to that of estimating the tangible and intangible costs of smoking. The latter represent the impact of smoking on the community as a whole. The budgetary impact is largely an indication of the funding impact of smoking on government.
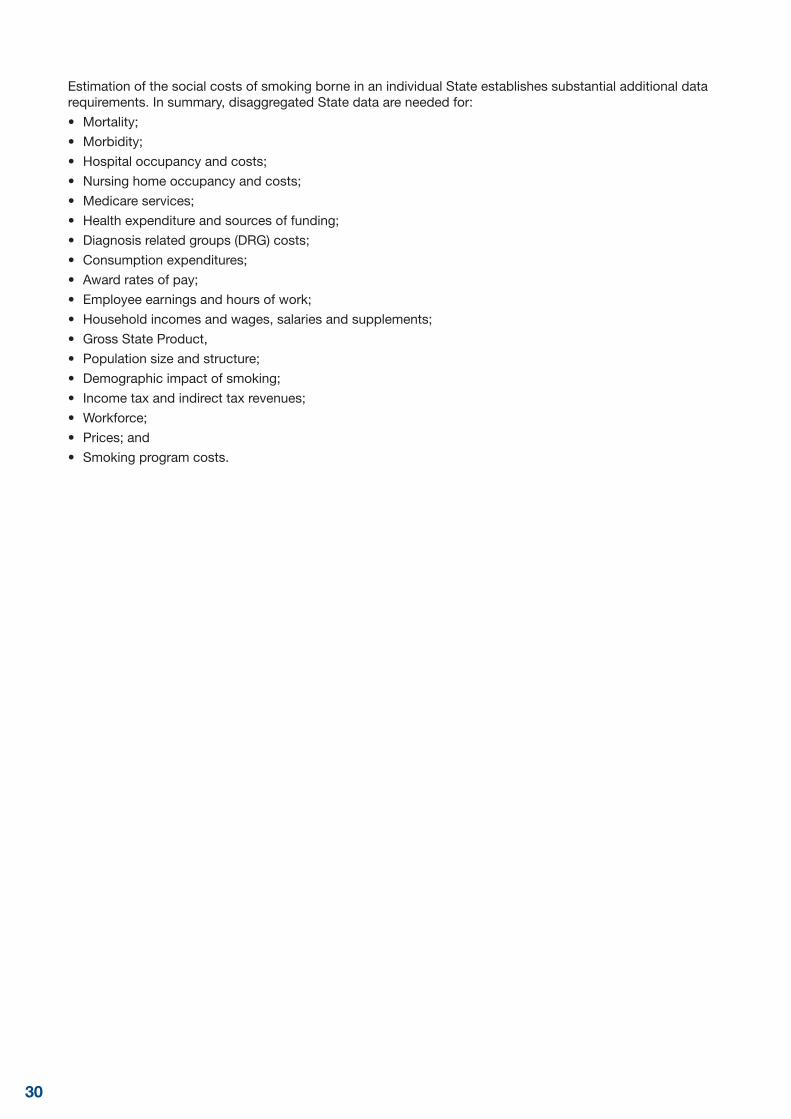
30
Estimation of the social costs of smoking borne in an individual State establishes substantial additional data requirements. In summary, disaggregated State data are needed for:
• Mortality;
• Morbidity;
• Hospital occupancy and costs;
• Nursing home occupancy and costs;
• Medicare services;
• Health expenditure and sources of funding;
• Diagnosis related groups (DRG) costs;
• Consumption expenditures;
• Award rates of pay;
• Employee earnings and hours of work;
• Household incomes and wages, salaries and supplements;
• Gross State Product,
• Population size and structure;
• Demographic impact of smoking;
• Income tax and indirect tax revenues;
• Workforce;
• Prices; and
• Smoking program costs.

31The social costs of smoking in Western Australia in 2009/10 and the social benefits of public policy measures to reduce smoking prevalence
Appendix B Issues in the economic evaluation of reductions in smoking prevalenceMethodological issuesThis study estimates the social benefits (expressed in terms of the reduction of the social costs of smoking) which would arise as a result of a reduction in the smoking prevalence rate in Western Australia (as indicated by the percentage of the population aged 14 or over who smoked on a regular basis) from 15.6 per cent in 2010 to 4.3 per cent, or to 10 per cent, in 2025. The target prevalence rate of 4.3 per cent was supplied to us by Cancer Council Western Australia for the purposes of this study. It is based on an extrapolation of the linear trend in daily smoking rates between 1998 and 2010. The alternative target of ten per cent represents a less ambitious target, analysed for the purposes of comparison.
Declines in smoking prevalence will lead to reductions in social costs, but the lags involved in this process are difficult to identify. A decline in smoking prevalence may lead to a virtually instant decline in some costs, for example those arising from fire-related deaths, injuries and damage. On the other hand, other types of costs may only be responsive to declines in smoking prevalence with a considerable lag. For example, reduced smoking prevalence may lead to a decline in lung cancer-related costs only after a period of many years. It appears impossible, on the basis of currently available research, to estimate the relevant average lag period. This study adopts the approach, therefore, of making an educated guess as to the range of values in which the actual lag may lie and testing the sensitivity of the results to the adoption of different lags. All other things being equal, the longer the assumed lag the lower will be the calculated social benefits. Total benefits will be lower and, since they will accrue later in the life of the program, their discounted present value will be less.
The present study, therefore, assumes that a given proportionate reduction in prevalence rates will lead to the same proportionate reduction in social costs after a relevant period. Results are calculated on assumed average lags of six, eight and ten years.
A further complication is that the effects of past tobacco-attributable mortality on the structure of the Western Australian population will take many years to disappear completely. Thus, the longer the period of study the greater is the proportion of the social costs of tobacco which are potentially avoidable. In this study it is assumed that the population effects of past smoking will only have fully disappeared at the end of a thirty year period.
Estimates of the future benefits of public policy programs could simply be calculated as a time series presenting, on a year-by-year basis, benefits expressed in the values of the relevant years. Such results would have limited significance since it would be virtually impossible to make any comparison between projects which were competing (in the sense that they were alternative ways of achieving the same objective) when the time patterns of benefits differed between the two projects. All other things being equal, the program which yielded its benefits earlier would be the preferable program. This is because program benefits could be reinvested in other projects to yield a further rate of return and the earlier that the benefits accrued the greater would be the reinvestment benefits. If Project A yields comparatively low benefits comparatively early while Project B yields comparatively high benefits comparatively late, simple inspection of the two time series of benefits at current values may not conclusively indicate which project is to be preferred. This type of decision can only be properly made using the technique of discounting.
Discounting reduces the future flow of values to a single figure, the present value expressed in the prices of the chosen year. Present value is calculated by the application of a discount rate to the future value stream. The higher is the discount rate, the lower will be the present value of a given stream of future values. Since there are serious theoretical problems in the choice of an appropriate social discount rate, this study estimates results according to a range of discount rates.
Over what period should the evaluation of reduced smoking prevalence be undertaken? In investment analysis it is usually possible to define the life of the project. However, anti-smoking programs often have no pre-defined lives and it is difficult to predict future public policies towards smoking. Given that the benefits of anti-smoking programs may accrue over many years and that they would certainly continue to accrue for at least some period of time after the program had ended, the adoption of too short a period of analysis would lead to underestimation of the program benefits. On the other hand, it is extremely difficult to predict future developments in medical technology, and therefore health care costs. Technological improvements may lead to cost reductions, for example as a result of the development of new vaccines, or they may lead to cost increases, for example as a result of the development of more effective but more expensive medical treatments.

32
The higher is the discount rate, the lower will be the present value of social benefits accruing into the future. For example, one dollar’s benefits to be received in thirty years’ time will have a current value of seventeen cents at a discount rate of six per cent, but only six cents at a discount rate of ten per cent. Given the major uncertainties in forecasting over long periods of time, which have to be balanced against the understatement of benefits implied by the adoption of too short a period of analysis, this paper analyses benefits accruing over twenty and thirty year periods.
In estimating the social benefits of reduced smoking prevalence, comparison must be made with some alternative level of prevalence which is based on the assumption that the maintenance of current policies would lead to the maintenance of current prevalence rates. For the purposes of this study a comparison is made between one situation in which the current year 2010 prevalence rate is maintained into the future and another in which prevalence is reduced.
In summary the approach adopted to calculating the benefits of reduced smoking prevalence is as follows:
• Assume that in the absence of anti-smoking campaigns the annual real (that is, adjusted for inflation) social costs of tobacco in Western Australia in the period of analysis (2009/10 to 2024/25) would remain the same as in 2009/10, the most recent year for which actual estimates are available;
• Estimate the proportions of these total costs which are avoidable and unavoidable for each year of the period being analysed on the basis of the target rate of smoking prevalence;
• Assume that avoidable social costs decline by the same percentage as the percentage decline in smoking prevalence, with assumed lags of six, eight and ten years before the reduction in social costs commences;
• Test the sensitivity of the results to a range of discount rates, assumed lags and prevalence rate declines.
The sensitivity of the estimates of the benefits of prevalence reduction to the assumptions adoptedThe tables below indicate the sensitivity of the results to the assumptions adopted. The alternative assumptions relate to:
• The lag between the reduction in smoking prevalence and the reduction in the social costs of smoking (six, eight or ten years);
• The period of analysis (twenty or thirty years); and
• The social rate of discount adopted (four per cent, six per cent, eight per cent or ten per cent).
The results presented in Section 7 as the “most conservative”, “least conservative” and “most plausible” are highlighted in the following two tables.
Table 24 Present values of social cost reductions ($ millions, year 2009/10 prices), twenty year analysis, smoking prevalence rate reduced to 4.3 per cent
Discount rateLag (in years)
6 8 10
4 % 6,798.5 4,949.5 3,420.7
6 % 4,992.3 3,580.6 2,438.7
8 % 3,703.5 2,614.4 1,753.5
10% 2,774.5 1,926.1 1,271.4
Table 25 Present values of social cost reductions ($ millions, year 2009/10 prices), thirty year analysis, smoking prevalence rate reduced to 4.3 per cent
Discount rateLag (in years)
6 8 10
4 % 14,083.4 12,070.2 10,168.7
6 % 9,416.8 7,897.8 6,516.5
8 % 6,423.7 5,263.9 4,248.0
10% 4,466.5 3,571.2 2,815.1

33The social costs of smoking in Western Australia in 2009/10 and the social benefits of public policy measures to reduce smoking prevalence
Table 26 Present values of social cost reductions ($ millions, year 2009/10 prices), twenty year analysis, smoking prevalence rate reduced to 10.0 per cent
Discount rateLag (in years)
6 8 10
4 % 2,666.1 1,972.4 1,383.9
6 % 1,948.1 1,421.9 984.3
8 % 1,438.0 1,034.5 706.1
10% 1,071.8 759.5 510.7
Table 27 Present values of social cost reductions ($ millions, year 2009/10 prices), thirty year analysis, smoking prevalence rate reduced to 10.0 per cent
Discount rateLag (in years)
6 8 10
4 % 6,054.4 5,288.7 4,534.3
6 % 4,001.5 3,428.2 2,884.1
8 % 2,697.7 2,263.2 1,865.8
10% 1,853.7 1,520.8 1,227.0

34
Appendix C Demographic estimatesThis appendix describes the research’s demographic methodology, using aetiological fractions and demographic data to estimate the additional numbers of Western Australian males and females who would have been alive and enumerated in the Western Australian population in June 2010 had there been no use of tobacco. The appendix was written by J.H. Pollard, Emeritus Professor of Actuarial Studies, Macquarie University, who undertook the demographic calculations for this study.
The dataThe aetiological fractions used in this report are those presented in English, Holman et al (1995), Ridolfo and Stevenson (2001), and Codde et al (2007). For the purposes of this projection, the first set of aetiological fractions are assumed to apply prior to 1988 (but without illicit drug deaths prior to 1962), and those of Ridolfo and Stevenson in 1998, with intermediate fractions for the period 1989-1997. Those of Codde et al are assumed to apply in 2006-2010, with intermediate fractions between 1998 and 2006.
The other data used in the calculations are as follows:
• the population of Australia in 1947 by age (in individual years) and sex;
• the Australian life tables 1953-55, 1965-67, 1975-77, 1985-87, 1995-97, 2005-07 and 2008-10;
• the numbers of births in Australia for each calendar year 1947-2010;
• the numbers of net migrants by age (in broad age groups) and sex for representative years in each decade (1950s, 1960s, 1970s, 1980s,1990s), 2000-2009, and in 2010;
• estimate of the Australian population in June 2010 by age and sex;
• estimate of the Western Australian population in June 2010 by age and sex.
These demographic data were all available from Australian Bureau of Statistics (ABS) publications.
MethodUsing the base 1947 population, the history of births, the above-mentioned life tables and the representative migration numbers, it was possible to project forward the Australian population from 1947 to 2010. The resultant estimates for 2010 were close to those provided by ABS.
The projection program was then re-run with modifications to the assumed rates of mortality to reflect the situation which would have existed had there been (a) no illicit drug use, (b) no illicit drug use nor alcohol use, and (c) no illicit drug use, nor alcohol use nor tobacco use.
All calculations were performed using single years of age. The reported results are in five-year age groups.
A scaling approach was adopted to obtain the Western Australian estimates from the national estimates because it was believed that the direct application of the national method to an individual state would produce spurious accuracy due to
• the uncertainties inherent in the age-specific net migration numbers into the state from overseas;
• the uncertainties relating to age-specific net interstate migration numbers and their drug-usage histories; and
• the possibility that the aetiological fractions, applicable nationally, might not be exactly the same for each individual state.
As in previous reports, no attempt was made to quantify the births that did not take place because of lives lost through drug usage.
Adjustment of the mortality ratesUsing the aetiological fractions described above and applying them to the relevant causes of death identified by the same authors, it is possible to estimate the proportions of deaths at each age attributable to illicit drug use, to alcohol use and to tobacco use. These proportions were then applied to the mortality rates in earlier epochs to determine the modified mortality rates for use in the various computer program runs described above. Normal multiple-decrement table formulae were used to calculate the modified rates.
This approach can be criticised on several counts. First, it is doubtful whether exactly the same fractions applied in earlier years, since usage of these drugs has changed over time, and other factors have had major impacts on the numbers dying from the various causes (road accident deaths, for example, have halved in recent decades, as a result of various measures, and circulatory system disease mortality has declined remarkably, presumably as a result of a number of lifestyle and medical changes). Second, the aetiological

35The social costs of smoking in Western Australia in 2009/10 and the social benefits of public policy measures to reduce smoking prevalence
fractions ought to be applied to the deaths by cause in earlier epochs to derive mortality proportions relevant to those times. This second objection can be addressed, but any improvement in accuracy is likely to be spurious, because of the serious nature of the first limitation.
In the absence of equivalent aetiological fractions for all earlier epochs, the above approach was considered the most reliable.
ResultsTable 28 presents the resulting estimates of the additional Western Australian population in the absence of past and present smoking.
Table 28 Estimated additional Western Australian population in the absence of smoking, June 2010, classified by age and sex
Male Female Total
0-4 11 5 16
5-9 17 5 22
10-14 30 10 40
15-19 41 28 69
20-24 74 52 126
25-29 81 63 144
30-34 96 76 172
35-39 133 102 235
40-44 215 141 356
45-49 333 197 530
50-54 521 274 795
55-59 814 379 1,193
60-64 1,270 505 1,775
65-69 1,547 622 2,169
70-74 2,097 860 2,957
75-79 2,697 1,153 3,850
80-84 3,155 1,453 4,608
85 plus 4,546 2,897 7,443
Total 17,677 8,822 26,499
Total Western Australian population 1,164,553 1,131,858 2,296,411

36
Appendix D The changes to tobacco taxation implemented in July 2000This study, like previous studies by the present authors in this series, estimates the impact of tobacco use by Western Australian smokers on the government budgets of the Commonwealth and of Western Australia. This involves a comparison of drug-attributable expenditures, for example on health care, with the relevant tax revenues. With the introduction of the GST in 2000, significant changes took place in the way in which tobacco is taxed.
Prior to 1997, tobacco was taxed through Federal customs and excise duties and State franchise fees. In August 1997, in response to a challenge to New South Wales franchise fees on tobacco, a High Court decision in the Ha and Lim vs. The State of New South Wales struck down these fees. This decision clearly also had applicability to tobacco franchise fees imposed by other States and, incidentally, to liquor franchise fees across all States and, as a result, all franchise fees were suspended.
As a consequence, the Commonwealth Government negotiated a safety net agreement with the States under which the Commonwealth would increase its tax rates on tobacco and alcohol to cover the revenue which would have been raised by the now-suspended franchise fees. The safety net revenue was returned to the States as Revenue Replacement Payments (RRPs). This situation was reflected in the 1998/99 tax revenue data in Collins and Lapsley (2004).
In July 2000, the Commonwealth Government introduced the Goods and Services Tax (GST) and abolished the wholesale sales tax, as part of a complicated package of changes resulting from the 1999 Intergovernmental Agreement (IGA) negotiated between the Commonwealth and the States. The IGA changed the method of taxing tobacco, and the distribution of that revenue between the Commonwealth and the States. Under the IGA, all GST revenue was earmarked for the States (though much of this revenue was clawed back by the Commonwealth through the simultaneous abolition of Financial Assistance Grants to the States).
It was intended that the GST should be applied to tobacco at the standard rate of 10 per cent, but that the overall rates of tax on tobacco should be largely unchanged. Thus, as a compensatory change to adjust for the application of the GST, the tobacco excise rate was reduced.
At the same time, to improve the effectiveness of the tobacco excise tax, its basis was changed from taxation purely by weight of tobacco to a combination of “per stick” taxation and taxation by tobacco weight. This latter reform was estimated at the time by Federal Treasury to yield an increase in tobacco tax revenue Australia-wide of $440 million in a full year.
Apart from the “per stick” tobacco tax change, the above reform was designed to leave tobacco tax revenue broadly unchanged. However, it resulted in a major reallocation of tobacco tax revenue from the States to the Commonwealth. The States lost the Revenue Replacement Payments and, in compensation, received only the 10 per cent GST on tobacco.

37The social costs of smoking in Western Australia in 2009/10 and the social benefits of public policy measures to reduce smoking prevalence
Appendix
E A
eti
olo
gic
fra
ctio
ns
Age
-spe
cific
aet
iolo
gic
frac
tion
s fo
r to
bacc
o ca
used
dea
ths,
mal
es
Mal
es<
11-
45-
910
-14
15-1
920
-24
25-2
930
-34
35-3
940
-44
45-4
950
-54
55-5
960
-64
65-6
970
-74
75-7
980
-84
85+
Oro
phar
ynge
al c
ance
r0.
000
0.00
00.
000
0.00
00.
000
0.00
00.
000
0.00
00.
000
0.27
70.
543
0.36
90.
469
0.50
30.
524
0.53
30.
531
0.55
50.
555
Oes
opha
geal
can
cer
0.00
00.
000
0.00
00.
000
0.00
00.
000
0.00
00.
000
0.00
00.
245
0.50
20.
358
0.42
80.
462
0.48
20.
492
0.49
00.
514
0.51
4
Sto
mac
h ca
ncer
0.00
00.
000
0.00
00.
000
0.00
00.
000
0.00
00.
000
0.00
00.
042
0.12
10.
070
0.09
20.
105
0.11
30.
117
0.00
00.
000
0.00
0
Pan
crea
tic c
ance
r0.
000
0.00
00.
000
0.00
00.
000
0.00
00.
000
0.00
00.
000
0.08
50.
223
0.13
70.
176
0.19
70.
210
0217
0.21
50.
232
0.23
2
Lary
ngea
l can
cer
0.00
00.
000
0.00
00.
000
0.00
00.
000
0.00
00.
000
0.00
00.
411
0.68
40.
545
0.61
70.
649
0.66
70.
676
0.67
40.
695
0.69
5
Lung
can
cer
0.00
00.
000
0.00
00.
000
0.00
00.
000
0.00
00.
000
0.00
00.
418
0.66
70.
739
0.84
30.
880
0.90
00.
912
0.91
20.
897
0.89
7
Cer
vica
l can
cer1
0.00
00.
000
0.00
00.
000
0.00
00.
000
0.00
00.
000
0.00
00.
000
0.00
00.
000
0.00
00.
000
0.00
00.
000
0.00
00.
000
0.00
0
End
omet
rial c
ance
r0.
000
0.00
00.
000
0.00
00.
000
0.00
00.
000
0.00
00.
000
0.00
00.
000
0.00
00.
000
0.00
00.
000
0.00
00.
000
0.00
00.
000
Bla
dder
can
cer
0.00
00.
000
0.00
00.
000
0.00
00.
000
0.00
00.
000
0.00
00.
156
0.36
50.
241
0.29
90.
329
0.34
80.
356
0.35
40.
377
0.37
7
Kid
ney
canc
er0.
000
0.00
00.
000
0.00
00.
000
0.00
00.
000
0.00
00.
000
0.24
20.
497
0.35
40.
424
0.45
70.
478
0.48
80.
485
0.51
00.
510
Isch
aem
ic h
eart
dis
ease
0.00
00.
000
0.00
00.
000
0.00
00.
000
0.00
00.
000
0.40
10.
367
0.33
50.
314
0.32
40.
273
0.07
70.
070
0.04
40.
042
0.04
2
Chr
onic
obs
truc
tive
pul
mon
ary
dise
ase
0.00
00.
000
0.00
00.
000
0.00
00.
000
0.00
00.
000
0.00
00.
487
0.74
60.
619
0.68
60.
715
0.73
20.
739
0.73
70.
756
0.75
6
Toba
cco
use
1.00
01.
000
1.00
01.
000
1.00
01.
000
1.00
01.
000
1.00
01.
000
1.00
01.
000
1.00
01.
000
1.00
01.
000
1.00
01.
000
1.00
0
Par
kins
on’s
dis
ease
0.00
00.
000
0.00
00.
000
0.00
00.
000
0.00
00.
000
-0.1
62-0
.162
-0.1
62-0
.162
-0.1
62-0
.162
-0.1
62-0
.162
-0.1
62-0
.162
-0.1
62
Pul
mon
ary
circ
ulat
ion
dise
ase2
0.00
00.
000
0.00
00.
000
0.00
00.
000
0.00
00.
000
0.00
00.
487
0.74
60.
619
0.68
60.
715
0.73
20.
739
0.73
70.
756
0.75
6
Car
dia
c dy
srhy
thm
ias3
0.00
00.
000
0.00
00.
000
0.00
00.
000
0.00
00.
000
0.40
10.
367
0.33
50.
314
0.32
40.
273
0.07
70.
070
0.04
40.
042
0.04
2
Hea
rt fa
ilure
30.
000
0.00
00.
000
0.00
00.
000
0.00
00.
000
0.00
00.
401
0.36
70.
335
0.31
40.
324
0.27
30.
077
0.07
00.
044
0.04
20.
042
Str
oke
0.00
00.
000
0.00
00.
000
0.00
00.
000
0.00
00.
000
0.40
80.
373
0.34
20.
320
0.33
10.
278
0.07
60.
069
0.04
40.
041
0.04
1
Per
iphe
ral v
ascu
lar
dise
ase
0.00
00.
000
0.00
00.
000
0.00
00.
000
0.00
00.
000
0.33
40.
302
0.27
40.
255
0.26
40.
219
0.16
30.
149
0.09
70.
092
0.09
2
Low
er re
spira
tory
trac
t inf
ectio
n0.
125
0.00
00.
000
0.00
00.
000
0.00
00.
000
0.00
00.
133
0.11
70.
103
0.09
40.
099
0.07
90.
056
0.05
10.
032
0.03
00.
030
Cro
hn’s
dis
ease
0.00
00.
000
0.00
00.
000
0.08
70.
234
0.23
00.
236
0.23
00.
205
0.18
40.
170
0.17
70.
143
0.10
40.
095
0.06
10.
057
0.05
7
Ulc
erat
ive
colit
is0.
000
0.00
00.
000
0.00
00.
047
0.09
40.
093
0.09
40.
093
0.08
90.
084
0.08
00.
082
0.07
10.
055
0.05
10.
034
0.03
20.
032
Ant
epar
tum
hae
mor
rhag
e40.
148
0.00
00.
000
0.00
00.
000
0.00
00.
000
0.00
00.
000
0.00
00.
000
0.00
00.
000
0.00
00.
000
0.00
00.
000
0.00
00.
000
Low
birt
hwei
ght
0.14
30.
000
0.00
00.
000
0.00
00.
000
0.00
00.
000
0.00
00.
000
0.00
00.
000
0.00
00.
000
0.00
00.
000
0.00
00.
000
0.00
0
SID
S0.
183
0.00
00.
000
0.00
00.
000
0.00
00.
000
0.00
00.
000
0.00
00.
000
0.00
00.
000
0.00
00.
000
0.00
00.
000
0.00
00.
000
Fire
inju
ries
0.23
00.
230
0.23
00.
230
0.23
00.
230
0.23
00.
230
0.23
00.
230
0.23
00.
230
0.23
00.
230
0.23
00.
230
0.23
00.
230
0.23
0
Ast
hma
(und
er 1
5 ye
ars)
0.02
10.
021
0.02
10.
021
0.00
00.
000
0.00
00.
000
0.00
00.
000
0.00
00.
000
0.00
00.
000
0.00
00.
000
0.00
00.
000
0.00
0
Mac
ular
deg
ener
atio
n0.
000
0.00
00.
000
0.00
00.
000
0.00
00.
000
0.00
00.
000
0.00
00.
249
0.23
10.
239
0.19
70.
145
0.13
30.
086
0.08
20.
082
Otit
is m
edia
0.08
40.
084
0.00
00.
000
0.00
00.
000
0.00
00.
000
0.00
00.
000
0.00
00.
000
0.00
00.
000
0.00
00.
000
0.00
00.
000
0.00
0
Lung
can
cer
(pas
sive
)0.
000
0.00
00.
000
0.00
00.
000
0.00
00.
000
0.00
00.
001
0.00
00.
000
0.00
00.
000
0.00
00.
001
0.00
10.
000
0.00
10.
001
Isch
aem
ic h
eart
dis
ease
(pas
sive
)0.
000
0.00
00.
000
0.00
00.
000
0.00
00.
000
0.00
20.
002
0.00
10.
001
0.00
10.
000
0.00
10.
002
0.00
20.
001
0.00
40.
004

38
Age
-spe
cific
aet
iolo
gic
frac
tion
s fo
r to
bacc
o ca
used
dea
ths,
fem
ales
Fem
ales
<1
1-4
5-9
10-1
415
-19
20-2
425
-29
30-3
435
-39
40-4
445
-49
50-5
455
-59
60-6
465
-69
70-7
475
-79
80-8
485
+
Oro
phar
ynge
al c
ance
r0.
000
0.00
00.
000
0.00
00.
000
0.00
00.
000
0.00
00.
000
0.00
00.
289
0.43
90.
401
0.50
30.
452
0.53
30.
556
0.54
90.
549
Oes
opha
geal
can
cer
0.00
00.
000
0.00
00.
000
0.00
00.
000
0.00
00.
000
0.00
00.
000
0.25
60.
399
0.36
20.
462
0.41
20.
492
0.51
50.
508
0.50
8
Sto
mac
h ca
ncer
0.00
00.
000
0.00
00.
000
0.00
00.
000
0.00
00.
000
0.00
00.
000
0.04
50.
083
0.07
20.
105
0.08
70.
117
0.00
00.
000
0.00
0
Pan
crea
tic c
ance
r0.
000
0.00
00.
000
0.00
00.
000
0.00
00.
000
0.00
00.
000
0.00
00.
089
0.15
90.
139
0.19
70.
167
0217
0.23
30.
228
0.22
8
Lary
ngea
l can
cer
0.00
00.
000
0.00
00.
000
0.00
00.
000
0.00
00.
000
0.00
00.
000
0.42
50.
588
0.55
00.
649
0.60
10.
676
0.69
60.
689
0.68
9
Lung
can
cer
0.00
00.
000
0.00
00.
000
0.00
00.
000
0.00
00.
000
0.00
00.
437
0.56
30.
668
0.70
30.
787
0.78
10.
795
0.80
40.
735
0.73
5
Cer
vica
l can
cer1
0.00
00.
000
0.00
00.
000
0.00
00.
000
0.00
00.
000
0.00
00.
000
0.07
90.
142
0.12
40.
176
0.14
80.
194
0.20
90.
204
0.20
4
End
omet
rial c
ance
r0.
000
0.00
00.
000
0.00
00.
000
0.00
00.
000
0.00
00.
000
0.00
00.
000
-0.1
15-0
.097
-0.1
55-0
.123
-0.1
78-0
.199
-0.1
92-0
.192
Bla
dder
can
cer
0.00
00.
000
0.00
00.
000
0.00
00.
000
0.00
00.
000
0.00
00.
000
0.16
40.
275
0.24
50.
329
0.28
60.
356
0.37
80.
371
0.37
1
Kid
ney
canc
er0.
000
0.00
00.
000
0.00
00.
000
0.00
00.
000
0.00
00.
000
0.00
00.
253
0.39
50.
358
0.45
80.
408
0.48
80.
511
0.50
30.
503
Isch
aem
ic h
eart
dis
ease
0.00
00.
000
0.00
00.
000
0.00
00.
000
0.00
00.
000
0.32
60.
339
0.27
50.
286
0.23
20.
235
0.04
80.
069
0.04
10.
012
0.01
2
Chr
onic
obs
truc
tive
pul
mon
ary
dise
ase
0.00
00.
000
0.00
00.
000
0.00
00.
000
0.00
00.
000
0.00
00.
000
0.50
10.
660
0.62
40.
715
0.67
20.
739
0.75
60.
751
0.75
1
Toba
cco
use
1.00
01.
000
1.00
01.
000
1.00
01.
000
1.00
01.
000
1.00
01.
000
1.00
01.
000
1.00
01.
000
1.00
01.
000
1.00
01.
000
1.00
0
Par
kins
on’s
dis
ease
0.00
00.
000
0.00
00.
000
0.00
00.
000
0.00
00.
000
-0.1
12-0
.120
-0.0
86-0
.091
-0.0
67-0
.068
-0.0
34-0
.051
-0.0
29-0
.008
-0.0
08
Pul
mon
ary
circ
ulat
ion
dise
ase2
0.00
00.
000
0.00
00.
000
0.00
00.
000
0.00
00.
000
0.00
00.
000
0.50
10.
660
0.62
40.
715
0.67
20.
739
0.75
60.
751
0.75
1
Car
dia
c dy
srhy
thm
ias3
0.00
00.
000
0.00
00.
000
0.00
00.
000
0.00
00.
000
0.32
60.
339
0.27
50.
286
0.23
20.
235
0.04
80.
069
0.04
10.
012
0.01
2
Hea
rt fa
ilure
30.
000
0.00
00.
000
0.00
00.
000
0.00
00.
000
0.00
00.
326
0.33
90.
275
0.28
60.
232
0.23
50.
048
0.06
90.
041
0.01
20.
012
Str
oke
0.00
00.
000
0.00
00.
000
0.00
00.
000
0.00
00.
000
0.33
30.
345
0.28
10.
291
0.23
80.
240
0.04
80.
068
0.04
10.
012
0.01
2
Per
iphe
ral v
ascu
lar
dise
ase
0.00
00.
000
0.00
00.
000
0.00
00.
000
0.00
00.
000
0.26
60.
277
0.22
10.
230
0.18
50.
187
0.10
60.
147
0.09
10.
028
0.02
8
Low
er re
spira
tory
trac
t inf
ectio
n0.
125
0.00
00.
000
0.00
00.
000
0.00
00.
000
0.00
00.
099
0.10
50.
080
0.08
40.
065
0.06
50.
035
0.05
00.
030
0.00
90.
009
Cro
hn’s
dis
ease
0.07
00.
000
0.00
00.
000
0.15
90.
373
0.37
60.
363
0.34
80.
361
0.29
50.
306
0.25
00.
253
0.14
90.
203
0.12
90.
041
0.04
1
Ulc
erat
ive
colit
is0.
070
0.00
00.
000
0.00
00.
127
0.26
60.
267
0.26
10.
253
0.26
00.
222
0.22
80.
193
0.19
40.
119
0.15
90.
104
0.03
40.
034
Ant
epar
tum
hae
mor
rhag
e40.
148
0.00
00.
000
0.00
00.
000
0.00
00.
000
0.00
00.
000
0.00
00.
000
0.00
00.
000
0.00
00.
000
0.00
00.
000
0.00
00.
000
Low
birt
hwei
ght
0.14
30.
000
0.00
00.
000
0.00
00.
000
0.00
00.
000
0.00
00.
000
0.00
00.
000
0.00
00.
000
0.00
00.
000
0.00
00.
000
0.00
0
SID
S0.
183
0.00
00.
000
0.00
00.
000
0.00
00.
000
0.00
00.
000
0.00
00.
000
0.00
00.
000
0.00
00.
000
0.00
00.
000
0.00
00.
000
Fire
inju
ries
0.23
00.
230
0.23
00.
230
0.23
00.
230
0.23
00.
230
0.23
00.
230
0.23
00.
230
0.23
00.
230
0.23
00.
230
0.23
00.
230
0.23
0
Ast
hma
(und
er 1
5 ye
ars)
0.02
10.
021
0.02
10.
021
0.00
00.
000
0.00
00.
000
0.00
00.
000
0.00
00.
000
0.00
00.
000
0.00
00.
000
0.00
00.
000
0.00
0
Mac
ular
deg
ener
atio
n0.
000
0.00
00.
000
0.00
00.
000
0.00
00.
000
0.00
00.
000
0.00
00.
199
0.20
80.
166
0.16
70.
094
0.13
10.
081
0.02
50.
025
Otit
is m
edia
0.08
10.
093
0.00
00.
000
0.00
00.
000
0.00
00.
000
0.00
00.
000
0.00
00.
000
0.00
00.
000
0.00
00.
000
0.00
00.
000
0.00
0
Lung
can
cer
(pas
sive
)0.
000
0.00
00.
000
0.00
00.
000
0.00
00.
000
0.00
00.
005
0.00
40.
003
0.00
50.
004
0.00
50.
005
0.00
30.
002
0.00
40.
004
Isch
aem
ic h
eart
dis
ease
(pas
sive
)0.
000
0.00
00.
000
0.00
00.
000
0.00
00.
000
0.01
40.
011
0.00
80.
006
0.01
00.
008
0.00
80.
010
0.00
70.
004
0.00
60.
006
Sou
rce:
Col
lins
and
Lap
sley
(200
8 a)
, Tab
les
63 a
nd 6
4.

39The social costs of smoking in Western Australia in 2009/10 and the social benefits of public policy measures to reduce smoking prevalence
BibliographyThe references detailed below are specific to the State costs study. Comprehensive bibliographies on issues related to estimation of social costs of tobacco and of other drugs appear in Collins and Lapsley (1991,1996, 2002 and 2008a).
Begg, Stephen; Vos, Theo; Barker, Bridget; Stevenson, Chris; Stanley, Lucy; and Lopez, Alan (2007), The burden of disease and injury in Australia 2003, PHE 82, Australian Institute of Health and Welfare.
Collins, D.J. and Lapsley, H.M. (1991), Estimating the economic costs of drug abuse in Australia, National Campaign Against Drug Abuse Monograph Series No. 15.
Collins, D.J. and Lapsley, H.M. (1994), “Increasing the Health Risks of Overseas Travel? Duty-Free Concessions for Alcohol and Tobacco”, Economic Papers, Volume 13, No. 4, December.
Collins, D.J. and Lapsley, H.M. (1996), The social costs of drug abuse in Australia in 1988 and 1992, National Drug Strategy Monograph Series No. 30.
Collins, D.J. and Lapsley, H.M. (1999), The Social Costs of Tobacco in Victoria and the Social Benefits of Quit Victoria, Victorian Smoking and Health Program.
Collins, D.J. and Lapsley, H.M. (2001), The Social Costs of Tobacco in Western Australia and the Social Benefits of Reducing Western Australian Smoking Prevalence, Cancer Foundation of Western Australia, Monograph Series No. 1.
Collins, D.J. and Lapsley, H.M. (2002), Counting the cost: estimates of the social costs of drug abuse in Australia in 1998-9, National Drug Strategy Monograph Series No. 49.
Collins, D.J. and Lapsley, H.M. (2004), Counting the costs of tobacco and the benefits of reducing smoking prevalence in Western Australia, The Cancer Council Western Australia, Monograph Series Number 4 2004.
Collins, D.J. and Lapsley, H.M. (2005), Counting the costs of tobacco and the benefits of reducing smoking prevalence in NSW, Report prepared for the NSW Department of Health.
Collins, D.J. and Lapsley, H.M. (2006), Counting the costs of tobacco and the benefits of reducing smoking prevalence in Victoria, Report prepared for the Victorian Department of Human Services.
Collins, D.J. and Lapsley, H.M. (2008a), The costs of tobacco, alcohol and illicit drug abuse to Australian society in 2004/05, National Drug Strategy Monograph Series No. 64.
Collins, D.J. and Lapsley, H.M. (2008b), The costs of tobacco, alcohol and illicit drug abuse to Australian society in 2004/05. Summary version, National Drug Strategy Monograph Series No. 66.
Collins, D.J. and Lapsley, H.M. (2008c), The social costs of smoking in Western Australia in 2004/05 and the social benefits of public policy measures to reduce smoking prevalence, Report prepared for the Cancer Council Western Australia, September.
Collins, D.J. and Lapsley, H.M. (2010), The social costs of smoking in NSW in 2006/07 and the social benefits of public policy measures to reduce smoking prevalence, NSW Department of Health.
Collins, D.J. and Lapsley, H.M. (2011), The social costs of smoking in Victoria in 2008/097 and the social benefits of public policy measures to reduce smoking prevalence, report prepared for Quit Victoria and the VicHealth Centre for Tobacco Control, October.
Collins, David; Lapsley, Helen; Brochu, Serge; Easton, Brian; Pérez-Gómez, Augusto; Rehm, Jürgen; and Single, Eric (2006), International Guidelines for the Estimation of the Avoidable Costs of Substance Abuse, Health Canada, http://www.hc-sc.gc.ca/ahc-asc/alt_formats/hecs-sesc/pdf/activit/strateg/drugs-drogues/nat-res-rech/cost-cout-abus/costs-estimation-couts_e.pdf
English, D.R.; Holman, C.D.J.; et al (1995), The quantification of drug caused morbidity and mortality in Australia, 1995 edition, Commonwealth Department of Human Services and Health.
Junor, William; Collins, David; and Lapsley, Helen (2004), The macroeconomic and distributional effects of reduced smoking prevalence in New South Wales, Report prepared for the Cancer Council New South Wales, June.
Mannino, David M. And Buist, A. Sonia (2007), “Global Burden of COPD: risk factors, prevalence and future trends:, Lancet vol 370 pp 765-7.
Ridolfo, Bruno and Stevenson, Chris (2001), The quantification of drug-caused mortality and morbidity in Australia, 1998, Australian Institute of Health and Welfare Drug Statistics Series No. 7.
Single, Eric; Collins, David; Easton, Brian; Harwood, Henrick; Lapsley, Helen; Kopp, Pierre; and Wilson, Ernesto (2003), International guidelines for estimating the costs of substance abuse, Second edition, World Health Organisation.

40
Data SourcesAustralian Bureau of Statistics, Australian National Accounts: National Income, Expenditure and Product (5206.0).
Australian Bureau of Statistics, Australian National Accounts: State Accounts (5220.0).
Australian Bureau of Statistics, Australian Demographic Statistics (3101.0).
Australian Bureau of Statistics, Australian Year Book (1301.0).
Australian Bureau of Statistics, Average Weekly Earnings, States and Australia (6302.0).
Australian Bureau of Statistics, Causes of Death, Australia (3303.0).
Australian Bureau of Statistics, Company Profits, Australia (5651.0).
Australian Bureau of Statistics, Consumer Price Index (6401.0).
Australian Bureau of Statistics, Deaths, Australia (3302.0).
Australian Bureau of Statistics, Distribution and Composition of Employee Earnings and Hours: Australia (6306.0).
Australian Bureau of Statistics, Estimated Resident Population by Sex and Age: States and Territories of Australia (3201.0).
Australian Bureau of Statistics, Labour Costs, Australia (6348.0).
Australian Bureau of Statistics, Labour Force (6203.0).
Australian Bureau of Statistics, Marriages and Divorces 1999 (3310.0).
Australian Bureau of Statistics, Measuring Unpaid Work: Issues and Experimental Estimates (5236.0).
Australian Bureau of Statistics, Population by Age and Sex, Australian States and Territories (3201.0).
Australian Bureau of Statistics, Population Projections, 1997 to 2051 (3222.0).
Australian Bureau of Statistics, Private Hospitals, Australia (4390.0).
Australian Bureau of Statistics, Taxation Revenue Australia (5506.0).
Australian Bureau of Statistics, The Labour Force, Australia (6203.0).
Australian Bureau of Statistics, Unpaid Work and the Australian Economy, 1992, Occasional Paper (5240.0).
Australian Bureau of Statistics (2000), Unpaid Work and the Australian Economy, 1997, Occasional Paper (5240.0).
Australian Bureau of Statistics, Working Arrangements (6432.0).
Australian Institute of Health and Welfare, Australia’s Health 1996.
Australian Institute of Health and Welfare, Health Expenditure Australia, Health and Welfare Expenditure Series.
Australian Institute of Health and Welfare (2005a), 2004 National Drug Strategy Household Survey. First results, April, AIHW catalogue number PHE 57.
Australian Institute of Health and Welfare (2005b), 2004 National Drug Strategy Household Survey. State and territory supplement, June, AIHW catalogue number PHE 61.
Australian Institute of Health and Welfare (2005c), Statistics on drug use in Australia 2004, July, AIHW catalogue number PHE 61.
Australian Institute of Health and Welfare (2005d), 2004 National Drug Strategy Household Survey. Detailed findings, October, AIHW catalogue number PHE 66.
Australian Institute of Health and Welfare (2011), 2010 National Drug Strategy Household Survey Report, July, Drug Statistics Series No.25
Australian Taxation Office, Taxation Statistics (various).
Begg, Stephen; Vos, Theo; Barker, Bridget; Stevenson, Chris; Stanley, Lucy; and Lopez, Alan (2007) The burden of disease and injury in Australia 2003, PHE 82, Australian Institute of Health and Welfare.

41The social costs of smoking in Western Australia in 2009/10 and the social benefits of public policy measures to reduce smoking prevalence
Bureau of Transport Economics (2000), Road Crash Costs in Australia, BTE Report 102, Canberra.
Costello, P. (2006), Federal Financial Relations 2006-07, Budget Paper No.3.
Health Insurance Commission, Annual Reports.
English, D.R., Holman, C.D.J., et al (1995), The quantification of drug caused morbidity and mortality in Australia, 1995 edition, Commonwealth Department of Human Services and Health.
Holman C.D.J. and Armstrong B.K. (1990), The Quantification of Drug Caused Mortality in Australia 1989, Commonwealth Department of Community Services and Health.
Holman C.D.J., Armstrong B.K. et al (1990), The Quantification of Drug Caused Morbidity and Mortality in Australia, Commonwealth Department of Community Services and Health.
Queensland Fire and Rescue Authority (2006), Spreadsheet - Fires caused by smoking materials, 2004/05, (private communication).
Ridolfo, Bruno and Stevenson, Chris (2001), The quantification of drug-caused mortality and morbidity in Australia, 1998, Australian Institute of Health and Welfare Drug Statistics Series No. 7.
Steering Committee for the Review of Commonwealth/State Service Provision, Report on Government Services, Volume 1, Education, Health, Justice and Volume 2, Emergency Management, Community Services, Housing, AusInfo.
WHO, Global Health Observatory Data Repository. Risk Factors: Tobacco by Country, http://apps.who.int/gho/data/view.main.1805


First published in 2014 by Cancer Council Western Australia, 15 Bedbrook Place Shenton Park WA 6008
© Cancer Council Western Australia, 2014
All rights reserved. No part of this book may be reproduced or utilised in any form or by any means, electronic or mechanical, including photocopying, recording or by any information storage and retrieval system without permission in writing from the publisher.
To obtain copies of this publication please contact:
Administration Officer
Tobacco Programs
Cancer Council Western Australia
15 Bedbrook Place
Shenton Park WA 6008
Australia
Telephone: 08 9388 4333
Facsimile: 08 9388 4399
Website: www.cancerwa.asn.au
Email: [email protected]
Cancer Council Western Australia gratefully acknowledges the funding support of Healthway and the Department of Health.
Suggested citation:
Collins DJ, Lapsley HM. The social costs of smoking in Western Australia in 2009/10 and the social benefits of public policy measures to reduce smoking prevalence. Cancer Council Western Australia. Perth, Western Australia; 2014.
ISBN 1 876628 80 4
Government of Western AustraliaDepartment of Health

The social costs of smoking in Western Australia in 2009/10 and the social benefits of public policy measures to reduce smoking prevalence
D.J.CollinsDepartment of Economics, Macquarie University
and
H.M.Lapsley Faculty of Medicine, University of New South Wales
Report prepared for Cancer Council Western Australia, October 2014