The Social and Economic Values of Canada’s Urban Forests...
107
The Social and Economic Values of Canada’s Urban Forests: A National Synthesis April 16, 2015 Ngaio Hotte Lorien Nesbitt Sara Barron Judith Cowan Zhaohua Cindy Cheng Stephen Sheppard (PI), Jorma Neuvonen (Project Management) UBC Review: Stephen Mitchell, Harry Nelson, Sara Gergel, Gary Bull, Howie Harshaw UBC Faculty of Forestry University of British Columbia Forest Sciences Centre 2005 – 2424 Main Mall Vancouver, BC, V6T 1Z4 CANADA
Transcript of The Social and Economic Values of Canada’s Urban Forests...

The Social and Economic Values of Canada’s Urban Forests:
A National Synthesis April 16, 2015
Ngaio Hotte Lorien Nesbitt Sara Barron Judith Cowan Zhaohua Cindy Cheng
Stephen Sheppard (PI), Jorma Neuvonen (Project Management)
UBC Review: Stephen Mitchell, Harry Nelson, Sara Gergel, Gary Bull, Howie Harshaw
UBC Faculty of Forestry University of British Columbia
Forest Sciences Centre 2005 – 2424 Main Mall Vancouver, BC, V6T 1Z4
CANADA

i
ABOUT THE AUTHORS Ngaio Hotte Ngaio Hotte is a Resource Economist and Facilitator with the Department of Forest Resources Management in the Faculty of Forestry, University of British Columbia. Her research focuses on the economics of sustainable resource management; previous projects have included exploring economic incentives for adaptation to climate change in forestry, reviewing economic benefits of urban forestry and identifying economic impacts of climate change on forestry in BC. She has also facilitated workshops with representatives from First Nations, federal, provincial and local governments, academia and industry, including two Peter Wall Institute International Roundtables.
Lorien Nesbitt Lorien Nesbitt is a PhD candidate in the Department of Forest Resources Management in the Faculty of Forestry, University of British Columbia. Her research focuses on the concept of green equity: the equitable distribution of urban greenery and how this influences the benefits our society derives from it. She is also an environmental planner and documentary filmmaker with EcoPlan International and has had the privilege of working with local communities and organizations throughout Canada and internationally. Past projects have helped her develop expertise in urban forest management planning, climate change adaptation planning, and valuing cultural ecosystem services. She is particularly interested in integrated approaches to planning and creating livable communities, with a focus on urban forests.
Sara Barron Sara Barron is a PhD candidate in the Faculty of Forestry, University of British Columbia. She was awarded the prestigious Future Forests Fellowship to pursue her studies. She earned her Master of Landscape Architecture from UBC, and has more than eight years of professional experience working with a diverse range of communities to improve the sustainability, climate change resilience and energy performance of neighbourhoods. She also volunteers at the grassroots level through a non-‐profit group called Community Studio
Judith Cowan Judith is curious how landscapes change, are used, lived in and thought about. She is a Registered Landscape Architect, ISA Certified Arborist and Trades Horticulturalist with over 15 years’ experience working for various municipalities and stewardship organizations within the Greater Vancouver metropolitan region. Her work focuses on the design and management of urban open space, primarily within the realms of Park Planning, Urban Forestry and Trail Design. While managing a diverse range and scale of projects she has engaged in planning and field work from initial conceptual stages and public consultation through to implementation and post-‐project monitoring. Throughout, she has been intrigued with urban native plant ecologies, the re-‐naturalization of altered landscapes and the management of natural resources.
As a graduate of the Master of Sustainable Forest Management Program in the Faculty of Forestry at UBC she has gained a Forester’s perspective on the functional processes of natural systems and the implications for

ii
long-‐term stewardship. Her goal is to become a Registered Professional Forester involved in ecological planning initiatives in natural systems management and the emerging field of Urban Forestry.
Zhaohua Cindy Cheng Zhaohua is a Masters student in the Faculty of Forestry, University of British Columbia. Her research focuses on public perceptions of climate change and low carbon economies in small cities in China. She has worked as a research assistant in the Faculty of Forestry for more than three years in the areas of climate change, forest carbon sequestration, carbon trading systems and low carbon development. She is also interested in exploring various benefits and costs of urban forests, particularly in urban forest management and planning as a solution to mitigate climate change while creating happy and resilient cities.

iii
ACKNOWLEDGEMENTS We would like to thank Dr. Stephen Sheppard and Jorma Neuvonen for their guidance and support on this project. It would not have been possible without their leadership.
Special thanks to the internal review board of this research project: Dr. Stephen Mitchell, Dr. Harry Nelson, Dr. Sara Gergel, Dr. Gary Bull and Dr. Howie Harshaw, for sharing your insights and expertise with us. We are greatly thankful for all of your comments and suggestions.
Finally, this project would not have been possible without the funding support of the Canadian Forest Service, whose emerging national leadership in urban forestry will position Canada for success in this field.

iv
TABLE OF CONTENTS ABOUT THE AUTHORS ............................................................................................................................... i
ACKNOWLEDGEMENTS ............................................................................................................................ iii
TABLE OF CONTENTS ............................................................................................................................... iv
EXECUTIVE SUMMARY ............................................................................................................................. vi
1 INTRODUCTION .................................................................................................................................. 1 1.1 What is “urban forestry”? ............................................................................................................................. 1 1.2 Urban forestry in Canada .............................................................................................................................. 2
2 PURPOSE AND SCOPE ......................................................................................................................... 3 2.1 Key terms ...................................................................................................................................................... 4
3 URBAN FOREST EVALUATION TOOLS ................................................................................................. 5 3.1 Approaches to evaluating ecosystem services .............................................................................................. 6 3.2 i-‐Tree ............................................................................................................................................................. 7
3.2.1 Applications ............................................................................................................................................ 7 3.2.2 Limitations ............................................................................................................................................ 13 3.2.3 Case studies: how is i-‐Tree being used? ................................................................................................ 14
3.3 Other tools .................................................................................................................................................. 15 3.3.1 Applications .......................................................................................................................................... 17 3.3.2 Case studies .......................................................................................................................................... 20 3.3.3 Limitations ............................................................................................................................................ 20
4 URBAN FOREST BENEFITS ................................................................................................................. 23 4.1 Ecosystem services ...................................................................................................................................... 23
4.1.1 Microclimate ......................................................................................................................................... 23 4.1.2 Habitat provision and urban biodiversity .............................................................................................. 26 4.1.3 Noise pollution control .......................................................................................................................... 27 4.1.4 Climate change mitigation and adaptation .......................................................................................... 28 4.1.5 Cultural services .................................................................................................................................... 31 4.1.6 Products ................................................................................................................................................ 33
4.2 Human health and well-‐being ..................................................................................................................... 35 4.2.1 Physical health ...................................................................................................................................... 36 4.2.2 Mental health ....................................................................................................................................... 39 4.2.3 Social health .......................................................................................................................................... 42 4.2.4 Equitable access to urban greenery: green equity ................................................................................ 44
4.3 Economic benefits ....................................................................................................................................... 47 4.3.1 Property values ..................................................................................................................................... 47 4.3.2 Community economic development ..................................................................................................... 50 4.3.3 Recreation and tourism ........................................................................................................................ 54

v
5 DISCUSSION: IMPLICATIONS FOR URBAN FORESTRY IN CANADA .................................................... 59 5.1 Key findings and gaps .................................................................................................................................. 59
5.1.1 Urban forest evaluation tools ............................................................................................................... 64 5.1.2 Urban forest benefits ............................................................................................................................ 65
5.2 Future directions ......................................................................................................................................... 66 5.2.1 Urbanization ......................................................................................................................................... 66 5.2.2 Rising rates of chronic illness ................................................................................................................ 67 5.2.3 Shifting cultural identity ....................................................................................................................... 68 5.2.4 Climate change ..................................................................................................................................... 68 5.2.5 Changing expectations for community engagement, governance and education ............................... 68
6 CONCLUSIONS .................................................................................................................................. 70
7 REFERENCES ..................................................................................................................................... 72
8 APPENDIX ......................................................................................................................................... 97 TABLE 3. Summary of i-‐Tree tools and their functions, requirements and limitations. ........................................ 97 TABLE 6. Summary of i-‐Tree Model Descriptions ................................................................................................. 98

vi
EXECUTIVE SUMMARY Today, the majority of the world’s population lives in urbanized areas, with a trend toward increasing urbanization and density in cities. As pressure on finite urban forest resources intensifies, appreciation of the benefits that they provide to residents and visitors is growing.
In Canada, the urban forest includes a variety of vegetation and landscape types such as public parks, streetscapes, natural areas and yards, which together form a complex system of urban greenery. Canada’s urban forests provide its citizens with a range of benefits, which can be expressed using metrics such as monetary values and well-‐being indices that capture aspects such as human health outcomes and social cohesion. Balancing the costs of managing urban forests with the benefits they generate is essential in order for decision makers to sustain liveable urban spaces and quality of life for Canadians. A number of recent Canadian studies and projects have reported on key ecosystem services provided by urban forests, using metrics to assign monetary and other values, to support a business case for investment in urban forest management.
This report summarizes the contributions of urban forests to society, with a focus on Canadian and North American studies, as available, and has not focused on the peri-‐urban setting. It begins with a review and synthesis of relevant and accessible research that focuses on existing tools (e.g. i-‐Tree) to quantify the benefits of urban forests, including data-‐gathering, decision-‐support and communication tools. The report then outlines the various ecological, economic and human health and well being benefits of urban forests using both economic valuation methods and indicators of well being (e.g. mental health, social cohesion). It identifies opportunities for future research and analysis of urban forest benefits, costs and trade-‐offs and implications that could enhance policy making on urban forest management in Canada.
Based on the literature reviewed, it is reasonable to draw the following conclusions:
There is considerable literature available that documents and/or estimates the value of urban forests and urban forestry. However, the literature is widely dispersed across kinds of value, metrics of value, geographic context and type of urban forest. There is a need for more synthetic and aggregated studies, with consistent evaluation across a standard range of dimensions and metrics (i.e. both economic metrics and other quantitative studies).
There are many values considered in the literature that go beyond those evaluated in the few comprehensive assessments conducted for Canadian cities (notably, those prepared by Alexander and McDonald for Toronto Dominion Bank). This suggests that the economic benefits of urban forests may be significantly higher than those estimated to date.
At the same time, many evaluations do not fully reflect the economic cost of urban forests or the negative impacts of urban trees. Available literature suggests that the benefits of urban forests typically outweigh the costs of their management and care, leading to overall net benefits; however, a comparison of costs across studies is difficult due to inconsistencies among calculations and assumptions and lack of full cost accounting.

vii
There is a strong need for systematic research and data collection at the local and national scales to support inventories, baseline studies and planning for urban forest management, particularly in the space between management and empirical research.
There are some dimensions of urban forests for which economic data are already available, in more mature areas of research (e.g. property values, energy use, stormwater management, certain recreation and tourism revenues, savings in certain hospital stays). There are also other rapidly emerging fields (e.g. well-‐being, cultural ecosystem services) where economic data are scarce, highlighting a considerable need for further economic analyses.
There are relatively few robust studies of future projected values beyond i-‐Tree modelled estimates, which require various caveats in their interpretation. This is particularly true of projections that consider climate change impacts and responses, which are likely to be critical drivers of change in urban forest health, productivity and maintenance costs. This represents a major deficiency in light of existing trends (e.g. declining forest health due to pests, increasing urban density in Canada and elsewhere). Reversing these trends and establishing an expanded and healthy canopy in cities could mitigate worsening heat impacts of climate change on vulnerable urban populations.
Relatively few studies have assessed the effectiveness of monitoring programs, incentive schemes and policies and governance structures for urban forestry at the municipal scale.
Urban forest evaluation tools tend to focus on forest structure and “regulating” ecosystem services (such as microclimate modification), which are more clearly measureable. These services are largely determined by urban forest structure and function, as in the widely-‐used i-‐Tree suite of tools, which are easily accessible to various users. There is, however, a need for more consistent evaluation of the utility of i-‐Tree in practice, particularly as applied to Canada’s forests and climatic conditions. A number of valuation methodologies and other tools are available and cost and benefit estimates generated using such tools appear to be heavily influenced by local economic conditions and factors such as infrastructure investment. Both high-‐tech tools (e.g. LiDAR) and low-‐cost, accessible data platforms (e.g. Google Earth, smart phone applications) are currently being tested, suggesting that accurate data acquisition to support robust urban forest management will increase in Canada.
In terms of emerging needs and future directions relevant to Canadian government agencies such as the Canadian Forest Service (CFS), we identify five key drivers of change that are expected to shape the future of Canada’s urban forests: urbanization, rising rates of chronic disease, shifting cultural identity, climate change and changing demands for community engagement. These present a range of growing needs and opportunities for urban forestry, such as offsetting temperature rise in cities, promoting social cohesion and supporting prosperity and equity for all Canadians. However, urban forests are also confronted by major threats, barriers and challenges. These include external challenges (e.g. impact of climate change on tree selection and survival; declining health and stock of urban trees due to poor development practices and regulations) and internal challenges (e.g. governance and administration of urban forestry, fragmented management of urban forests, shrinking municipal government budgets).
Key implications for strengthening planning and management of Canada’s’ urban forests include:

viii
Developing a strong business case for urban forests in order to compete with other land uses such as property development for residential, commercial, institutional and infrastructure purposes.
Developing a strategy for more comprehensive research on benefits and costs of urban forests as well as evaluation of management strategies by practitioners and local governments to maximize benefits generated by urban forests in Canada.
Developing urban forest planning and management guidelines to address the needs of Canada’s changing urban landscapes.
Supporting development of improved urban forest evaluation tools and databases at local and regional scales, with regular aggregation into resources such as the “State of Canada’s urban forests” report.
Investment and actions to promote collaboration between all levels of government. For example, responsibility and management costs for urban green spaces typically lie with the municipal authority, while health spending is under provincial and federal authority. Evidence for and clarification of relationships between agencies may be crucial for shifting policies to enhance fiscal responsibility and equitable cost sharing.
Conducting research to improve methods for eliciting the public’s values on urban forestry in order to improve understanding of Canadians’ perspectives and awareness of urban forests. This information could be used to develop guidance practices for informing and engaging communities in citizen science (e.g. urban forest monitoring) and management of urban greenery on public and private lands.
There is considerable potential for higher levels of regional, provincial and even federal government involvement in providing services and support for integrated planning and management and creating opportunities for knowledge exchange, policy leadership and programming in the field of urban forestry. There is also the need for provision and enhancement of new skills, education and awareness of urban forestry at various levels (e.g. high school through adult education) and retooling of practitioners in the broadening field of urban forestry.
As the practice of urban forestry develops in Canada, CFS could play a key role in helping to shape the future of Canada’s future urban forests, in order to maximize benefits and ensure their equitable distribution among urban residents. CFS could provide leadership by developing an urban forestry research program that addresses the widening range of issues affecting a crucial resource to Canadians that is sometimes taken for granted.

1
1 INTRODUCTION Today, the majority of the world’s population lives in urbanized areas. The United Nations Population Division estimates that over half of the global population currently lives in cities and urban populations are growing by about 2 percent annually (Population Division of the Department of Economic and Social Affairs of the United Nations Secretariat 2008). In North America, this trend towards urbanization is even stronger, especially in Canada and the United States (US), where approximately 80 percent of the population lives in urban environments (McPhearsonet al. 2013). As urbanization continues, urban greenery and the benefits it provides are playing an increasingly important role in creating liveable urban spaces and maintaining the well-‐being of the majority of Canadian and US residents (Thompson 2002; Hansmann et al. 2007; Giovanniet al. 2011b).
1.1 What is “urban forestry”?
“Urban forestry is the management of trees for their contribution to the physiological, sociological and economic well-‐being of urban society. Urban forestry deals with woodlands, groups of trees and individual trees, where people live -‐ it is multifaceted, for urban areas include a great variety of habitats (streets, parks, derelict corners, etc.) where trees bestow a great variety of benefits and problems.” (Carter 1993, adapted from Grey and Deneke 1986)
In this report, we use the terms “urban greenery” and “urban forest” to describe components such as parks, woodlands, street trees, greenways, private trees and shrubs, green walls and urban orchards. “Urban forestry” is the study and management of this urban greenery (Helms 1998). These components and their relationships to one another are illustrated in Figure 1.
Urban Forests / Urban Greenery
Parks
Recreational parks/sports fields Woodlands Pocket parks Rooftop parks Urban orchards
Streets Street trees and landscaping Greenways Urban orchards
Private gardens Trees/shrubs Urban agriculture Urban orchards
Green architecture Green roofs Green walls
Other Golf courses Cemeteries Community gardens
Figure 1. Urban forests/urban greenery and their component parts.

2
1.2 Urban forestry in Canada
Trees and green spaces are fundamentally important to human well-‐being and offer a wide range of services in urban environments (Canadian Urban Forest Network 2004). The fact that urban trees and green spaces provide environmental, physical, psychological, social and economic benefits is well established (Ulrich et al. 1991; Kuchelmeister 2000; Thompson, 2002; Konijnendijk et al. 2005; Heidt and Neef 2008; Poudyal et al. 2009; Kenney et al. 2011). Trees and green spaces reduce the “urban heat island effect” ( McPherson et al. 1999), improve air quality (Heidt and Neef 2008), reduce surface water runoff (Konijnendijk et al. 2005) and support urban biodiversity ( Rudd et al. 2002; Goddard et al. 2010). They help us recover from stress (Ulrich et al. 1991), increase property values (Poudyal et al. 2009), improve social cohesion (Kweon et al. 1998; Sullivan 2004), improve public health outcomes (Vries et al. 2003; Maas et al. 2006; Mitchell and Popham 2008) and may reduce violent crime (Kuo and Sullivan 2001). As more people make cities their home, we need to consider how best to maximize and maintain the benefits of urban greenery and ensure that urban residents are all able to experience these benefits.
Urban forests and the benefits they provide are receiving increasing attention in North America from the public and various levels of government. In recent years, municipalities have become increasingly aware of the benefits provided by urban forests and the public’s appreciation of them, leading to renewed investment in urban forestry in some municipalities such as Phoenix (City of Phoenix 2009; Harnik 2010), Toronto ( The Parks, Forestry and Recreation Division, City of Toronto 2013) and Vancouver (Poudyal et al. 2009; City of Vancouver, Greenest City 2020 and Vancouver Board of Parks and Recreation 2014; Vancouver Board of Parks and Recreation 2014). As populations grow and urban density increases, shared open green spaces will become more heavily used and the public will likely require increased access to green space (Kline 2006).
The Toronto Dominion (TD) Bank recently released two reports quantifying the value of urban forests in Toronto (Alexander and McDonald 2014) and in three other cities across Canada (Vancouver, Halifax and Montreal) (Alexander and DePratto 2014). The reports focused on quantifying the economic value of ecosystem services such as reduced flooding, improved air quality, energy savings from reduced urban temperature, carbon sequestration and reduced fossil fuel emissions from lower energy use. The value of these services was estimated in dollar values, providing one of the first tangible assessments of the value of Canada’s urban forests.
While these reports are an important tool for understanding and communicating the value of Canada’s urban forests, the benefits provided by urban forests are in fact much more complex and wide-‐ranging. This report goes beyond the TD Bank assessments to evaluate urban forest benefits much more broadly, in the hope that the full range of urban forest values and benefits can be included in urban forest planning and management in Canada, potentially positioning Canada as an urban forestry leader.

3
2 PURPOSE AND SCOPE The purpose of this report is to summarize the contribution of urban forests to the Canadian economy and society. It presents a review and synthesis of relevant and accessible research on valuing the various benefits of urban forests. This review goes beyond traditional economic valuations to include:
Ecosystem services, including aesthetic and cultural values Health/well-‐being/quality of life Property values Economic development Tourism and recreation
The review is focused on Canadian and North American studies, where possible, but also includes key examples of valuations and metrics from international studies. We have focused out attention primarily on urban environments and not on peri-‐urban issues such as large-‐scale water filtration and wildfire management. Our review does consider a range of community sizes in our discussion of urban forest values. Within this scope, the review identifies gaps and opportunities for future research.
Reflecting the importance of tools to support urban forest valuations, we present a review of the i-‐Tree suite of tools, their applications, limitations and areas for additional development. While i-‐Tree is currently one of the most widely-‐used urban forest valuation tools, the report reviews additional valuation tools that are currently being used by North American governments and private organizations, either in support of or instead of i-‐Tree.
Finally, we identify key opportunities for future research and collaboration at the national level in Canada and key messages and implications that could enhance policy making on urban forest management. We hope that this information will be useful to agencies such as the Canadian Forest Service and its partners in considering the case for further research, collaboration and knowledge transfer to support healthy and productive urban forests, integrated with prosperous and resilient communities.

4
2.1 Key terms
Several key terms are used throughout this report. The authors adopt the following definitions based on the work of The Economics of Ecosystems and Biodiversity (TEEB website)1 and the Millennium Ecosystem Assessment (Millennium Ecosystem Assessment (MA) 2005):
Ecosystem services (also “ecosystem goods and services”): The direct and indirect contributions of ecosystems to human well-‐being (Costanza et al. 1997; TEEB website n.d.). Authors such as Ango et al. (2014) extend this definition to reflect an anthropocentric perspective of ecosystem services (“beneficial”) and disservices (“problematic”).
Well-‐being (human): A context-‐and situation-‐dependent state, comprising basic material for a good life, freedom and choice, health and bodily well-‐being, good social relations, security, peace of mind and spiritual experience (MA 2005; TEEB website n.d.).
Ecosystem function: a subset of the interactions between ecosystem structure and processes that underpin the capacity of an ecosystem to provide goods and services.
Impact (on ecosystem services): Positive or negative changes in the quantity, quality, timing or location of one or more ecosystem services that result from a change in ecosystem function.2
Value: The contribution of an action or object to user-‐specified goals, objectives, or conditions (MA 2005; TEEB website n.d.). Throughout this report, we adopt a Total Economic Value approach, which defines value as "the sum of the values of all service flows that natural capital generates both now and in the future – appropriately discounted. TEV encompasses all components of (dis)utility derived from ecosystem services using a common unit of account: money or any market-‐based unit of measurement that allows comparisons of the benefits of various goods" (Pascual et al. 2010).
Valuation: The process of expressing a value for a particular good or service in a certain context (e.g., of decision-‐making) usually in terms of something that can be counted, often money (i.e. “economic valuation”), but also through methods and measures from other disciplines (sociology, ecology and so on) (MA 2005; TEEB website n.d.).
Cost-‐benefit analysis: A technique designed to determine the feasibility of a project or plan by quantifying its costs and benefits (MA 2005; TEEB website n.d.). A cost-‐benefit ratio (CBR) may be developed to summarize the overall value of a project or proposal.
1 TEEB website: http://www.teebweb.org/resources/glossary-‐of-‐terms/ 2 Adapted from WRI (2010).
5
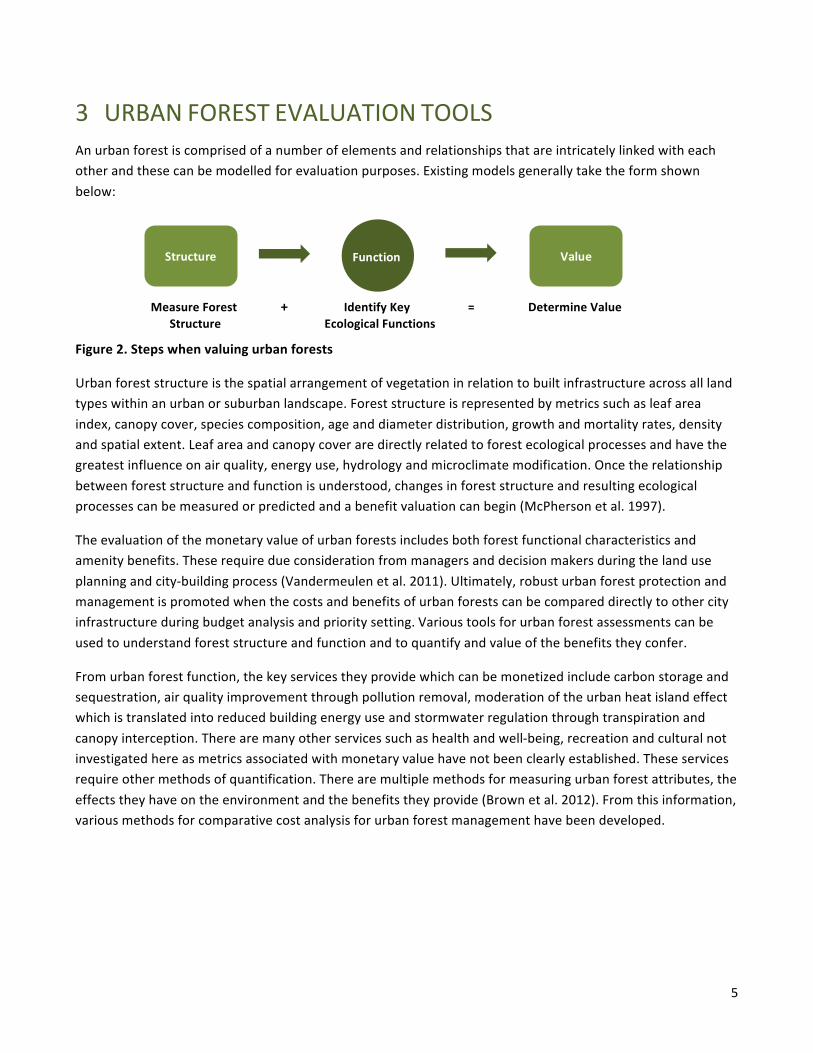
3 URBAN FOREST EVALUATION TOOLS An urban forest is comprised of a number of elements and relationships that are intricately linked with each other and these can be modelled for evaluation purposes. Existing models generally take the form shown below:
Measure Forest + Identify Key = Determine Value Structure Ecological Functions
Figure 2. Steps when valuing urban forests
Urban forest structure is the spatial arrangement of vegetation in relation to built infrastructure across all land types within an urban or suburban landscape. Forest structure is represented by metrics such as leaf area index, canopy cover, species composition, age and diameter distribution, growth and mortality rates, density and spatial extent. Leaf area and canopy cover are directly related to forest ecological processes and have the greatest influence on air quality, energy use, hydrology and microclimate modification. Once the relationship between forest structure and function is understood, changes in forest structure and resulting ecological processes can be measured or predicted and a benefit valuation can begin (McPherson et al. 1997).
The evaluation of the monetary value of urban forests includes both forest functional characteristics and amenity benefits. These require due consideration from managers and decision makers during the land use planning and city-‐building process (Vandermeulen et al. 2011). Ultimately, robust urban forest protection and management is promoted when the costs and benefits of urban forests can be compared directly to other city infrastructure during budget analysis and priority setting. Various tools for urban forest assessments can be used to understand forest structure and function and to quantify and value of the benefits they confer.
From urban forest function, the key services they provide which can be monetized include carbon storage and sequestration, air quality improvement through pollution removal, moderation of the urban heat island effect which is translated into reduced building energy use and stormwater regulation through transpiration and canopy interception. There are many other services such as health and well-‐being, recreation and cultural not investigated here as metrics associated with monetary value have not been clearly established. These services require other methods of quantification. There are multiple methods for measuring urban forest attributes, the effects they have on the environment and the benefits they provide (Brown et al. 2012). From this information, various methods for comparative cost analysis for urban forest management have been developed.
Structure Function Value

6
A review of arboriculture literature shows that individual tree appraisal is the most standard method for valuing trees, yet location, site index and tree condition produced a wide range of monetary values among cities (Gómez-‐Baggethun et al. 2013). Because of the altered character and heterogeneity of land within cityscapes, urban areas are stratified by land use (urban core, residential, industrial or park), by land ownership (private, public, utility ROW, transportation corridors, provincial) and by land cover (vegetation, building, water, agriculture and pavement). Urban forest assessment tools can be divided into data acquisition tools and decision support tools. This section provides an overview and analysis of key urban forest assessment tools in both categories, as well as a review of information gaps and highlights areas for future research.
3.1 Approaches to evaluating ecosystem services
Trees have various ameliorative effects in the urban environment that can be termed “ecosystem services”. For example, trees moderate temperature fluctuations, modify air and water flows and sequester and store CO2 (McPherson et al. 1997). The Millennium Ecosystem Assessment of 2005 defined four categories of ecosystem services: provisioning, regulating, supporting and cultural (see Table 1). Each category contains a unique set of characteristics conferring specific benefits (Millennium Ecosystem Assessment 2005).
Table 1. Categories of ecosystem services.
Categories Ecosystem services
Provisioning Tangible products such as timber or fuel
Regulating Functions such as carbon sequestration and climate modification through transpiration
Supporting Preservation of terrestrial and aquatic habitats
Cultural Aesthetics and liveability Within the context of urban forests, the term “ecosystem services”, applies specifically to the benefits provided to humans through functional processes and interactions with the surrounding environment and local ecology. In order to better manage, plan, understand and advocate for urban forests, it is necessary to quantify the ecosystem services they provide. The term “green infrastructure” is defined as the network of green places and water systems which deliver multiple environmental, social and economic values to urban communities. When considered as green infrastructure (Ely et al. 2013), urban forests are comparable to grey infrastructure, because both assets perform similar functions through the transmission of energy, nutrients and water between locations. Urban forests can also help mitigate the negative environmental effects of grey infrastructure, such as air pollution. Although both green and grey infrastructures have maintenance costs associated with them, grey infrastructure depreciates and loses value over time. In contrast, green infrastructure, such as an urban forest, is a dynamic living system that encompasses the full life cycle from initiation, establishment and growth, to eventual decline and death. If managed and planned effectively, an urban forest can grow and increase in value over time, although it will need replacement at some point in its life cycle.

7
3.2 i-‐Tree
The i-‐Tree method for the analysis of natural resources in cities began in the United States through vegetation mapping and site descriptions (Rogers et al. 1988). In the 1990s, an investigation by the USDA Forest Service Research Stations into urban forest research produced a series of prototype modelling programs. The UFORE (Urban Forest Effects) and STRATUM models were the first prototypes (Nowak et al. 2008). Subsequent collaboration between the USDA Forest Service, the horticulture and arboriculture industry, professional associations and not for profit societies lead to the suite of i-‐Tree tools, released in 2006 (www.itreetools.org). This modelling platform provides analysis and benefits assessment by quantitatively valuing ecosystem services provided by trees in urban situations. i-‐Tree’s strength lies in its ability to quantify and measure the Regulating category of Ecosystem Services, but it has limited capabilities for assessing the other categories (Table 2). At first intended for larger organizations such as counties and municipalities, i-‐Tree’s audience is now much wider and includes stewardship groups, homeowners, educators and volunteer and community organizations.
Table 2. The category of ecosystem services assessed by urban forest evaluation tools.3
Ecosystem Services
Provisioning Regulating Supporting Cultural
Urban Forests
i.e. Biomass, fuel and food
i.e Carbon storage and sequestration
i.e. Biodiversity i.e Aesthetics and recreation
3.2.1 Applications
i-‐Tree was designed to quantify the structure of an urban forest to promote understanding of tree and forest function and the ecosystem services they provide. It can be used at a wide range of spatial scales from the individual tree or tree grouping level to the stand level or city level. It includes various tools that support urban forest management, such as by helping to select the best tree planting locations and understanding how trees will respond to disturbance events or deteriorating conditions in the urban environment. Ultimately, i-‐Tree’s goal is to articulate the significance of urban and community trees for more informed forest management decisions, at a range of temporal scales, by setting priorities and demonstrating value. i-‐Tree’s primary goal is documentation and analysis of urban forest structure and function. However, the i-‐Tree suite of tools is also a forum for sharing research and information, exchanging ideas and ultimately planning for future growth by providing a decision-‐support framework. i-‐Tree uses methods and algorithms developed by forestry and arboricultural researchers and is thus science based. i-‐Tree uses inputs of baseline data from several sources including remote sensing, Google Maps and field observations. Climatic and meteorological data are used in measurements of air pollution, stormwater peak flows, air temperature and carbon sequestration rates, which can be used to assess homeowner values and energy savings. Because it was produced with public funds, i-‐Tree is freely accessible through the internet and does not require complicated or expensive software to operate. It is continually being updated with feedback from users, new scientific research and technological advancement. Ongoing technical support is also provided to users of the software. The i-‐Tree tools and their applications are
3 Source: www.itreetools.org

8
summarized in Table 3. Urban forest valuation is based on single tree valuation methods developed by the Council of Tree and Landscape Appraisers (CTLA). Compensatory or replacement value represents compensation for tree losses to owners and can be viewed as the value of the tree as a structural asset. It is narrowly defined because it focuses on individual tree value, yet is the baseline from which the value of an urban forest is extrapolated (Nowak 2002).

9
Table 3. Summary of i-‐Tree tools and their functions, requirements and limitations.
i-‐Tree Eco i-‐Tree Design i-‐Tree Canopy i-‐Tree Streets i-‐Tree Vue
Purpose Estimates benefits by analyzing forest structure
Estimates single and multiple tree benefits
Estimates canopy cover
Assessment of street tree populations
Land cover assessment
Ecosystem Services valuated:
Carbon storage ● ● ● ● ●
Pollution removal
● ● ● ● ●
Microclimate moderation
● ● ●
Stormwater regulation
● ●
Canopy interception
●
Aesthetics ●
Compensatory value
●
Spatial Scale Single tree, stand and city level
Single tree and tree grouping
Local scale to stand level
Stand level Stand and landscape level
Outputs Summary report including monetary valuation of urban forest benefits
Summary Report of Tree Benefits
Summary Report of percent cover plus estimate of benefits
Report with age distribution, growth models, replacement value
Summary report of benefits. Growth curves
Inputs Inventory or plot sampling by land use class with meterological and pollution data
Aerial map data Survey data by cover class. Uses EPA's BenMap program to assess pollution
Street tree inventory data
Satellite imagery derived from Landsat
Capabilities Calculates structural and functional information with algorithms
Simulation of scenarios to forecast future benefits
Evaluate effects of disturbance, growth and mortality rates
Compares benefits between locations. Pest detection
Models future effects of silviculture scenarios
Software Web-‐based Web based with Google Map interface
Web based limited to Google Map interface.
Software requirement -‐ not desktop
National Land Cover Database (NLCD)
Intended users Municipalities, stewardship groups, general public, educators
Arboriculture and design professions
Municipalities urban foresters,researchers
Urban foresters, stewardship groups
Municipalities, landowners, stewardship groups
Limitations Dependent on quality of meterological and air pollution data
GIS may be needed for complex projects.
Estimates present benefits of street trees only

10
i-‐Tree Species i-‐Tree Hydro i-‐Tree Storm i-‐Tree Pest Detection Purpose
Appropriate species selection
Quantify impacts of changes in tree and impervious cover
Provide reliable numbers for risk management
Pest detection and monitoring program
Ecosystem Services valuated:
Mitigation of storm damage through estimation of clean up efforts
Past pest disturbance events and pest population trends
Carbon storage ●
Pollution removal ●
Microclimate moderation
●
Stormwater regulation ● ●
Canopy interception
Aesthetics
Compensatory value
Spatial Scale Single tree level Watershed scale
Community and region level Single tree to city
Outputs Produces a ranked list of appropriate species
Summary report and DEM visualization
summary report and spreadsheet Summary report
Inputs USDA hardiness zones Hourly stream flow data Sample street segments
Inventory or plot sample data
Capabilities Relative rating of benefits at tree maturity
Simulates changes in water quality and quantity
Quantify damage from storm events
Integration of pest detection procedures
Software Web-‐based Stand alone application Web based
With i-‐Tree Eco + i-‐Tree Streets
Intended users Property owners, neighbourhood organizations
Urban planners and resource managers
Disaster prevention organizations
Municipalities, stewardship groups
Limitations Dependent primarily on hardiness zone criteria alone
Requires management of complex data sets
Requires management of complex data sets
Knowledge in pest detection required

11
i-‐Tree tools are categorized into three subgroups: Core, Secondary and Utility. Refer to Table 3 for a summary description of the complete suite of tools.
Core tools: i-‐Tree Eco, i-‐Tree Design, i-‐Tree Canopy and i-‐Tree Streets i-‐Tree Eco is a core tool that uses field data from simple random plots or inventory data to obtain overall urban forest structure information, analyze function and determine some benefits. It is used with pollution and meteorological data to estimate CO2 emissions, carbon sequestration, air pollution removal and canopy interception of rainfall. If adequate inventory data are collected, it has the capability to calculate information for each tree. If plot data are used, information is estimated at the population level. It can be used at multiple scales and has been used extensively for city scale projects in the USA, as well as in Canada and Australia. It requires precise data collection and can produce report summaries with dollar values attached to each ecosystem service. It is an adaptation of the UFORE (Urban Forest Effects) model.
i-‐Tree Design measures individual tree or tree grouping attributes for analysis of benefits at the site level and uses Google Maps imagery as the interface. i-‐Tree Design can be used to estimate the effect of existing or proposed trees on energy use, greenhouse gas mitigation, air quality and stormwater interception over time and compare the benefits of alternative species, locations or sizes.
i-‐Tree Canopy determines land cover types and percent tree cover based on Google Maps imagery. Users define a project area and context-‐specific land cover classes such as pavement, buildings, agriculture, lawn, water, etc., which i-‐Tree can then assign to each location using stratified sampling. It estimates values for air pollution reduction and the potential for capturing atmospheric carbon and then uses background technical information and calculations for determining methodologies for assigning monetary value to ecosystem services. The US Environmental Protection Agency’s BenMAP or Environmental Benefits and Analysis Program provides the technical rationale for assigning monetary value to urban forest benefits (Table 4). It estimates the health impacts and economic value of changes in air quality and calculates the number and economic value of pollution-‐related deaths and illnesses. Accuracy and standard error improves with the selection of more points and reduces the incidence of incorrectly assigning the wrong cover class based on limitations of the resolution and shadow in the Google imagery. A summary report of percent cover in table and graph format along with an estimation of tree benefits is produced.
i-‐Tree Streets uses inventory data to estimate the value of municipal street trees. It analyzes structure, management needs, costs and benefits of a municipality’s street trees based on either a complete or sampled inventory. It can be used by urban forest managers to set priorities, define goals and objectives, plan for tree replacements and identify sites for future planting programs. The cost-‐benefit analysis is particularly useful for staff managing a large and spread out population of street trees. This tool is an adaptation of STRATUM (Street Tree Resource Assessment Tool) modelling software by USDA Forest Service.

12
Secondary tools: i-‐Tree Vue, i-‐Tree Hydro, i-‐Tree Species i-‐Tree Vue uses the remotely sensed National Land Cover Database (NLCD) imagery to assess current land coverage and tree canopy, as well as modelling future planting scenarios. It produces multi-‐spectral data from Landsat sensors which measure the electromagnetic energy reflected and emitted from the Earth’s surface. This data and resultant imagery is at a spatial resolution of 30m and organized into 29 Land Cover classifications measuring percentages of selected attributes such as impervious cover, tree cover and salt and freshwater cover. i-‐Tree Hydro (beta) uses existing datasets to simulate changes to tree/impervious cover and effects on watersheds for watershed scale analyses. It was designed for urban planners to assess development effects on trees/vegetation and hydrology. It has two modules: one to simulate changes in hourly stream flow and another to simulate changes in water quality. The software produces visuals, reports and graphs which illustrate changes from an existing base case scenario. It has the ability to assess the influence green infrastructure exerts on peak flow intensities and microclimate moderation through plant processes, such as evapotranspiration as opposed to grey infrastructure. The software was developed at the State University of New York College of Environmental Science and Forestry (SUNY-‐ESF) in collaboration with the USDA Forest Service. i-‐Tree Species is a species selection tool. It rates and ranks environmental benefits by species with input data of hardiness zones, tree height constraints and desired tree functions at maturity. It was developed by the USDA Forest Service in collaboration with SUNY-‐ESF.
Utillity tools: i-‐Tree Pest Detection, i-‐Tree Storm i-‐Tree Pest Detection simulates pest disturbance event scenarios and their negative impacts on the urban forest’s ability to provide ecosystem services. i-‐Tree Storm is an assessment method for forecasting storm scenarios and quantifying the associated damage after a storm event. It is adaptable to various community sizes and types and provides information on the time and funds needed to mitigate storm damage. The development of the i-‐Tree suite of tools has transformed software based on urban, wildland and industrial forestry into an accessible format for use by government organizations, communities and professionals (McPherson et al. 2011). Technological advancements have made these tools accessible to a wide range of users. The rapid development and adoption of these tools in the urban forestry community highlights the dynamism of this sector.

13
3.2.2 Limitations
Although i-‐Tree is the most comprehensive urban assessment tool available, combining data-‐acquisition techniques with a methodology for decision support, i-‐Tree does have limitations and areas where future improvements could be made. With the exception of i-‐Tree Streets, which provides methods for assessing and evaluating aesthetics, i-‐Tree primarily captures the valuation of the regulating category of ecosystem services. The developers clearly state that it is not useful for valuing other ecosystem services, although research into methods for measuring wildlife biodiversity (supporting services) is in the formative stages. The calculations and algorithms use United States climate, geographic, tree growth and economic data. Therefore only approximate quantifications and valuations for other areas can be obtained. For a more precise analysis, location specific weather and pollution data are required as in a study (Findlay 2013) of the applicability of i-‐Tree Eco in New Zealand. Other local factors include the calibration of tree growth data and economic data (Soares et al. 2011). Although the suite of programs is free and easy to use, the required data acquisition and sampling may preclude its widespread use except for defined capital projects or volunteer/stewardship initiatives with access to existing tree inventory data.
i-‐Tree’s reliance on the compensatory or tree-‐replacement value approach does not reflect the full range of urban forest management costs and values. The Council of Tree and Landscape Appraisers method is the benchmark pricing system i-‐Tree uses to incorporate the monetary value of a tree or ‘private good’ from the perspective of individual tree owners. This precludes the inclusion of collective ‘public goods’ associated with tree and forest assets and therefore is somewhat restrictive in scope (Nowak et al. 2002).
Although i-‐Tree Design and i-‐Tree Canopy use a Google Map interface to define tree attributes and determine land cover types, the summary report information produced after analysis is a set of aspatial, graphs and tables. Linking this output data to a GIS, Google Earth or Street Vue visualization platform would improve communication of forest growth and decline over time, as well as identify key relationships with other land use components within the larger landscape.
Research into the methods i-‐Tree Streets adopts for the evaluation of aesthetics requires further investigation. Aesthetics is the critical study of culturally determined valuations of beauty. An aesthetic can only be described; it cannot be defined (Seamon 2000). Statements which attempt to define beauty or aesthetics in positive or negative terms should not be supported unless the spatial, temporal and cultural context is explicit (Ohta 2001). With an understanding of the value-‐laden judgements usually attached to notions of what constitutes beauty (i.e. beautiful is good, ugly is bad) developing a framework for the evaluation of the aesthetic benefits an urban forest provides may be possible.
Simulation of the complete life cycle of an urban forest or tree grouping from tree establishment through to decline and mortality demonstrates the age class at which benefits to ecosystem services are maximized. By determining site index, or the potential for trees to grow at a particular location or site, species-‐specific target age classes would provide useful information for planting and regeneration decisions. The rate of height growth is the most practical and consistent indicator of site quality. Understanding a site’s quality and the productivity it is capable of supporting and sustaining in terms of tree growth is the first step in determining long range planning objectives for urban forests. Conversely, determination of a disturbance index rating system to classify various sites would communicate the inherent character of a city as an ecosystem in a

14
constant state of disturbance and provide parameters understanding urban ecology for planting and maintenance activities.
To facilitate urban forest management and long-‐term planning, the organization of an urban forest into discrete units or stands based on ecological science (a concept taken from forestry), may be a useful strategy to ascertain current urban forest structural and functional conditions. This method would provide a more holistic interpretation of the urban forest and forego a reliance based solely on land use or cover class. For example, a municipality could delineate stand groups by land-‐use zoning areas (residential, industrial, commercial) with each park or neighbourhood comprising one stand. The urban / rural interface, waterfront and intertidal zones and natural areas such as stream corridors and ravines, etc could also each form the individual stands. Basing decisions on existing ecological realities will aid in projecting desired future conditions which could become the spatial blueprint for the definition and clarification of realization of management goals and objectives. Comparing the growth curves of these stands with trends in operational and maintenance costs over the stand life cycle could provide valuable information to decision makers for the estimation and allocation of budgets over time. i-‐Tree’s sophisticated analysis of forest attributes and function focuses on the trees primarily but leaves exploration of the ecological context and site conditions undetermined. For example, the question of existing soil and water resources to support robust tree growth is not assessed. Without an analysis of local ecosystem dynamics and processes, it is difficult to examine the assumptions implicit within the model (Rowntree 1984). Although i-‐Tree Storm is capable of assessing the impacts from storm events, useful assessments of other disturbance regimes and return events applicable to urban forests and urban regions could include snow, wind and fire.
Finally, the suitability of data sources, conversion equations and algorithms used to fit the growth / biomass equations to drive the valuation process for the Canadian context are difficult to source despite investigation (refer to Table 7 for a summary of i-‐Tree model descriptions). When criteria such as hardiness zone ratings, region, species, sample sizes and local climatic data are not transparent it becomes difficult for users, especially non-‐experts, to judge the applicability of the tool for a specific purpose or project. A wide gap exists between web site-‐level information and highly detailed scientific literature. i-‐Tree Technical Support Service staff inform that adapting the i-‐Tree Eco model to function in a country outside of the U.S. involves modifying existing databases and preprocessing required pollution and weather datasets to allow the model to automatically process submitted project data. The i-‐Tree Eco International Input Manual provides instructions for populating the international Input Form used only for Eco model development abroad (Al Zelaya, email communication 2015). The i-‐Tree website (http://www.itreetools.org/resources/archives.php) provides the best comprehensive listing of the literature and model descriptions for supporting the different tools (primarily i-‐Tree Eco). Findlay (2013) discovered that adopting i-‐Tree Eco to New Zealand required the involvement of the USDA Forest Service to upgrade the software before it could be used with accuracy.
3.2.3 Case studies: how is i-‐Tree being used?
Pothier et al. (2013) posit that i-‐Tree and other ecosystem services evaluation tools have the capability to refocus institutional and citizen awareness on the importance of urban forests and urban greenspaces and advocate for their continued investment. A number of high-‐profile studies explore the effectiveness of i-‐Tree in the valuation of different land types including institutional land (Pothier et al. 2013), urban parks (Millward et

15
al. 2011), canopy cover (McPherson et al. 2011), street trees (McPherson et al. 2007) and comprehensive municipal and regional studies such as those conducted in the City of Chicago (Nowak et al. 2013), City of Oakville (Nowak 2006) and City of Toronto (Nowak et al. 2013).
Cost-‐benefit analyses conducted for urban trees in US cities have estimated overall cost-‐benefit ratios ranging from 1.31 to 3.25 (McPherson et al. 1997, 2005; Soares et al. 2011). Net present value per tree was estimated at USD$402 in Chicago, compared to USD$5-‐113 in New York City, depending on location (e.g. yard, public park) and size (e.g. small, large) (McPherson 2007). In Los Angeles, the total annual value of benefits was USD$38 per tree for high mortality trees and USD$56 per tree for low mortality trees (McPherson et al. 2011). This brief review illustrated in Table 4 demonstrates that urban tree researchers do not have a uniformly-‐accepted or standardized way to determine the absolute benefits and costs of the urban forest (Roy et al. 2012).
Table 4. Urban Forest Economic Valuation Costs
City Year Cost-‐Benefit Ratio NPV / tree
USD$
Chicago 1997 2.83 $402
New York City 2007 n/a $5 – 13
Albuquerque 2011 1.31 n/a
Berkeley 2011 1.37 $24
Bismarck 2011 3.09 $37
Charlotte 2011 3.25 $48
Cheyenne 2011 2.09 $21
Ft. Collins 2011 2.18 $38
Glendale 2011 2.41 $18
Los Angeles 2011 n/a $38 -‐ 56
Santa Monica 2011 1.53 28
Lisbon, Portugal 2011 4.18 159
3.3 Other tools
There are multiple methods for measuring urban forest attributes, the effects they have on the environment and the benefits they provide. From this information, various methods for comparative cost analysis for urban forest management have been developed (Cullen 2002). A review of the arboriculture literature shows that individual tree appraisal is the most commonly-‐used method for valuing trees, yet location, site index and tree condition produced a wide range of monetary values among cities (Watson 2002).
As previously noted, urban forest assessment tools generally fall into two categories: Data Acquisition and Decision Support and an intermediary category of Data Compilation or Synthesis is a useful addition (Table 5). These categories are not mutually exclusive and in practice there are a number of case studies which

16
demonstrate that multiple tools have been used in combination or at different project phases to meet specific project or research goals (McGee et al. 2012). This section provides only a brief overview of tools as a more definitive evaluation of the advantages and disadvantages of these tools is beyond the scope of this report.
Table 5. Other urban forest assessment tools that provide data acquisition and decision support.
Tool Category and Type Data
Acquisition Data
Compilation Decision Support
Remote Sensing Software
LiDAR ●
Multi-‐spectral imagery ●
Biome -‐ BCG ●
GeoBia (Object-‐based imagery) ●
Hemispherical photos with Gap Light Analyzer (GLA) ●
Ground-‐based techniques
Citizen Science ●
Plot sampling/surveys ●
Spatial Analysis
GIS
●
Google Earth
●
Google Maps/ Street Vue ●
Aerial / ortho photographs ●
Data Analysis / Modelling
i-‐Tree ● ● ●
Allometric Equations / Regression Analysis
● ●
Urban Site Index
●
Community Viz ●
INVEST ● ●
CityGREEN ●
Environmental Protection Agency BenMAP ● ●
Park Calculator ●
Carbon Calculator ● ●
Green Values Stormwater Calculator ● ●
Pest Vulnerability Matrix ●
Urban Forestry Modeling & Prioritization Toolkit ● ●

17
3.3.1 Applications
Data acquisition
The use of aerial photography in land use planning is a technology widely embraced by municipal and other land holding organization as a way to capture the totality of an area in one image and assess and inventory their land base. Aerial photographs also form the basis of geometrically-‐corrected ortho photographs to account for distortion and scaling irregularities.
The Normalized Difference Vegetation Index (NDVI) is an index which measures the ratio between the visible (red) and near-‐infrared regions of multi-‐spectral imagery. It identifies and classifies land-‐cover and vegetation types and conditions based on reflectance levels. It uses data collected from high spatial resolution remote-‐sensing imagery and is used to detect live green plant canopies (Alonzo et al. 2014; Richardson et al. 2014).
Google Earth and Google Maps are integrated into many computer software programs and act as user-‐friendly interfaces with complex software to generate reproducible maps for baseline information (McGee et al. 2012).
Light Detection and Ranging (LiDAR) is a remote sensing technology that measures distance by illuminating a target with a laser. The resulting point scatter is then analyzed to produce high resolution 3-‐D maps. Airborne LiDAR is expensive but is increasingly used by municipalities for mapping urban forest canopy cover (Alonzo et al. 2014; Ye 2014). The resulting LiDAR point data allows for the analysis of many possible tree and stand attributes such as biomass, volume and percent canopy cover but has limited capabilities for the determination of species.
GEOBIA or geographic object-‐based image analysis was developed to automate methods to partition remote sensing imagery into meaningful geographically based image-‐objects and then has the capability to assess image characteristics through spatial, spectral and temporal scales. Its applications range from agriculture and natural resource management and is used in combination with high-‐resolution remote-‐sensing data, can accommodate a variety of data types, including LiDAR cloud point data, LiDAR, multispectral imagery and thematic GIS files. It provides a data-‐fusion capability that maximizes the value of existing geospatial data investments while minimizing or eliminating the need to acquire new datasets (O’Neil-‐Dunne et al. 2014).
The highly sophisticated Biome-‐BGC ecosystem process model, capable of analyzing nitrogen, carbon and water fluxes, becomes particularly useful for urban forest management when combined with i-‐Tree Eco. More detailed carbon allocation information can be accessed because it quantifies nitrogen uptake, often the limiting nutrient determining carbon storage in temperate areas and has simulation capabilities for long periods of time. i-‐Tree Eco can only quantify carbon and can simulate up to 1 year only (Brown et al. 2012).

18
The Geographic Information Systems (GIS) compile and display information from remote sensing and hyper spectral datasets. They are a powerful tool capable of analyzing spatial patterns in the landscape (Locke et al. 2010).
Hemispherical photographs using Gap Light Analyzer software have proven to be a unique method of understanding the relationship between tree and building-‐area cover and distinguishing between them (King et al. 2013).
Plot-‐ and ground-‐based survey techniques are detailed and information rich and can be performed by experts or trained volunteers depending on the accuracy required. Plots can be located via stratified, systematic or simple random sampling on public or private land to estimate forest or tree population attributes. Tree inventories are conducted on public lands and typically account for street, ornamental or heritage tree populations.
Decision support
Regression analysis can be used to model the growth of trees and canopy cover to create species-‐specific growth curves, which can be used by urban forest managers to estimate biomass or carbon accumulation, life cycle expectations of urban trees, tree replacement programs, maintenance schedules and therefore, by extension, maintenance costs (Wood 2014). Pre-‐existing data from municipal tree inventories or plots can be used to create the dataset to assess forest structure attributes such as diameter at breast height (DBH), height, Leaf Area Index (LAI) and tree canopy (Peper et al. 2003).
The Urban Site Index, developed by foresters at Indiana State University, is a microsite assessment tool to assess the relative fitness of a site to support tree growth. The Urban Site Index (USI) scores a potential street tree planting site on four soil parameters and four street parameters, which represent the relative suitability of the site for tree planting (Miller 2012). Soil observations include vegetation characteristics, surface compaction, soil penetration and soil development. Street parameters include speed limit, number of lanes, presence of parking and length between stop signs or lights. Site information is combined with observations of actual tree growth on sites with different USI scores and the general knowledge of tree hardiness and ultimate size for various cultivars to optimize tree selection decisions. USI is one of the few tools capable of assessing ecological site conditions for urban tree growth (Widney et al. 2013).
American Forests, a non-‐profit United States conservation organization, hosts a multiplicity of tools and initiated the Community Tree ReLeaf program in 2013, a program dedicated to the assessment, restoration and monitoring of urban forests.
CityGREEN (engineered as an extension to ESRI’s ArcGIS software) uses derived land cover data from sources such as aerial photography or satellite imagery provided by the user to model the effect of urban forests on air pollution removal, stormwater runoff and carbon storage and sequestration. It can also be used to perform alternate scenario modeling for presentation use in the planning process and as a decision-‐ aid tool for communities.

19
Community Viz is a geographic information system (GIS)-‐based modeling software program that allows users to envision changes to their current landscape (such as new trees, shrubs, etc.) and understand the ecosystem service impacts associated with those alternatives. Users create their own rules for procedural modelling of potential scenarios using spatial data and are able to analyze impacts in a realistic 3-‐D setting.
The Urban Forestry Modeling and Prioritization Tookit by Azavea is a suite of tools that allows users to model and create maps of trees in urban area. It adjusts for heat-‐island, stormwater and air-‐quality effects. Through digital tree planting, users can calculate the environmental impacts of trees and create alternative ‘what if’ scenarios.
The Integrated Valuation of Ecosystem Services Tool (INVEST) uses GIS maps, graphs and tables to help educate local and regional decision makers about the underlying values of ecosystem services associated with green infrastructure (Isely et al. 2010).
The Green Values Stormwater Calculator aims to achieve a full understanding of the role that green infrastructure (trees and vegetation) can play as an alternative infrastructure provider (Center for Neighbourhood Technology 2007) by studying the engineering qualities of tree effects in urban watersheds. The hydrological conditions of a site are assessed to determine stormwater benefits and their economic valuation for communities. The calculations used are based on the USDA’s Technical Report 55 ‘Urban Hydrology for Small Watersheds’ (USDA Forest Service 1986).
The Park Value Calculator from the USDA Forest Service quantifies the multi-‐dimensional values of parks to increase awareness of attributes and benefits that go beyond relaxation and recreation. It is a decision-‐support tool to quantify park benefits such as clean water and air, tourism, property values, health and community cohesion in monetary terms for improved support, funding and maintenance (McPherson 2010).
The Carbon Calculator developed by Tree Canada uses forest carbon modeling created by Natural Resources Canada’s Carbon Budget Model of the Canadian Forest Sector (CBM-‐CFS3) software. It uses emission factors from the Government of Canada and the UK Government to form the basis of the calculations to quantify rates of carbon storage and sequestration. Available to citizens, professionals and organizations alike, input data on transportation and energy use are used to calculate emissions in number of tonnes of CO2 (tCO2). Emission offsets by tree planting are calculated according to location (by province) and choice of desired tree species to plant. The updated calculator released in March 2015 is able to estimate urban forest attributes such as canopy area (Tree Canada 2015).
The Pest Vulnerability Matrix (PVM) is a computer program to quantify the extent and severity of insect pest outbreaks for defined tree populations used in coordination with i-‐Tree Streets, which monetizes the value of street trees and indicates the potential financial impact of pests borne by municipalities (McPherson et al. 2013). Report card ratings of indicators of species dominance, age structure, pest threat and potential asset loss can be used to highlight the green infrastructure benefits provided by urban forests.

20
3.3.2 Case studies
An assessment of the City of Vancouver’s tree canopy through LiDAR technology identified a decline in tree canopy cover from 22.5 percent in 1994 to 18 percent in 2014. In an effort to reverse the declining trend, Vancouver City Council formally endorsed a new Tree Protection Bylaw. The amendment ends the provision allowing private property owners to remove one healthy, mature tree per year without cause. With the new bylaw in place, only trees that are hazardous or interfere with drainage systems, sewage systems or utilities and accompanied by an arborist’s report, are eligible for removal. The ability of LiDAR to capture a snapshot of the state of Vancouver’s existing tree canopy cover was instrumental in providing key information to policy makers (City of Vancouver 2014).Through CityGREEN software, the Metropolitan Atlanta Region conducted a tree canopy analysis to report the measureable benefits accrued to the city through the urban forest and to highlight the environmental values the community holds in relation to its treed resources. It analyzed three sites that exist in most urban regions: a parking lot, a multi-‐use trail and a multi-‐family housing project. Existing conditions were recorded and effects of future effects of tree planting were modeled. The study used LandSat imagery, American Forests’ Urban Ecosystem Analysis techniques and CityGREEN planning software for calculation of the economic benefits provided by trees. Canopy-‐cover decline and economic impacts from tree loss, in the form of stormwater runoff, increased energy costs to homeowners and reduced air quality, were the significant findings of this project. CityGREEN software also provided a forum for engaging the public and stakeholders throughout the process (American Forests 2002).
3.3.3 Limitations
Given the multiplicity of tools available to communities, policy makers and land managers, their use in the management of urban forest resources will be determined by cost, data accessibility, available expertise, the goals and objectives of an organization and the particularities of a specific project. Remote sensing technology can be extremely powerful but may be expensive and require specialized expertise and infrastructure, although highly accessible interfaces such as Google Earth now have the capabilities to measure canopy dimensions. Remote sensing technology such as LiDAR, which is expensive, needs broad acceptance and relevance to other departments before its use can be justified for a municipal urban forest department (Young 2010). The engagement of citizens and stakeholders in the urban forest management process requires that their involvement is incorporated through processes such as the Urban Site Index and Urban Ecosystems Analysis tools. These processes would be a valuable addition to established civic consultation procedures and new tools such as the use of visualization techniques could engage the general public and stakeholders in the development of open space and green equity policies. Many of the tools need to be combined with other tools for data acquisition and data management. GIS, remotely-‐sensed imagery and guidelines for map/data interpretation usually need to be combined for an overall picture of the urban forest to be useful for decision makers (King et al. 2013). To-‐date, although is has its own limitations, i-‐Tree is the most comprehensive set of tools that combines data acquisition, description of urban forest structure and ecosystem services and economic valuation. With the release of version 5.0 in 2012, i-‐Tree Design and i-‐Tree Eco are capable of assessing urban forest conditions for Canadian and Australian users and provide valuable information for urban forest management decisions (Black 2012).

21
Table 6. Summary of i-‐Tree Model Descriptions
Air Quality Improvement Ecosystem Service
Urban Forest Structure Pollution removal Biogenic VOC Emissions
Purpose Measure forest structure attributes Hourly amount of pollution removal, monetary value and per cent (%) improved air quality
Estimates hourly Biogenic Volatile Organic Compound (VOC) emissions from vegetation
Attribute Measured
Leaf Area (LA ) Dry deposition of air pollution to trees of ozone (O3), sulfur dioxide (SO2), nitrogen dixide (NO2), carbon monoxide (CO) and particulate matter <10μm
Species, leaf dry weight biomass, air and leaf temperatures changes through transpiration
Leaf Area Index (LAI) Isoprenes, monoterpenes
Canopy Area Average VOC emissions annually
Considerations Sampling design/plot size Air pollutant flux (F) Land use type
Deciduous or coniferous Pollutant concentration in g/m3 (C) Genus or species type
Shading coefficient Aerodynamic resistance (Ra) Deciduous leaf-‐on estimates only
Condition class (0 -‐ 100%) Friction velocity Coniferous -‐ year round estimates
Land use class index Quasi-‐laminar boundary layer (Rb) Transpiration rate
Species diversity Index Canopy resistance (Rc) Inventory project
Insect pest effects Stomatal resistance Sample project
(CLE = 0-‐5); closed -‐ 0, open -‐ 5, Crown light exposure
Dry deposition velocity (Vd) from LAI. Median Vd is 0.0128 m/s
Economic Valuation
Compensatory Value -‐ is based on trunk area, species, condition and location
Monetary value (metric ton) -‐ 2007 Producer Price Index (PPI): CO-‐$1 407, NO2-‐$9 906, SO2-‐$2 425, PM10-‐$6 614
Conversion Factors and Equations
Leaf Area (m2) to Biomass (g/m3), for percent (%) improved air quality estimate: use local boundary layer height data (ht of pollutant mixing)
Genus-‐specific emission factors for 30 degrees C + PAR flux of 1000μ
LA = [ln(1-‐x)/-‐k * πr2 F = Vd*C: Pollutant flux (g/m2/s):
LAI = ln(I/Io)-‐k, Vd = 1 / (Ra+Rb+Rc) : Deposition velocity (m/s):
Crown parameters: Y=bo+b1H+b2D+b3S+b4
I = F / F + M: Air quality Improvement in % (where M is total air pollutant mass)
Dbh: Y = bo+b1X+b2S Other data required
Compensatory Values from ISA and Council of Landscape and Tree Appraisers (CTLA) publications,
Tree cover, hourly NCDC weather data, and US Environmental Protection Agency (EPA) pollution [] monitoring data.
Air temperature from National Climatic Data Center (NCDC). Total solar radiaion from the National Solar Radiation Model
Monetary value -‐ median externality values for each pollutant in the US in metric tons
Inventory System from the National Oceanic and Atmospheric section EPA
Limitations Update structural values Update median externality values Update Biogenic Emissions model
Dieback as proxy for condition Uses land class as a proxy for
location
Only 3 insect pests in model Literature Source
Nowak (2008) A Ground Based Method for Assessing Forest Structure and Ecosystem Services
Nowak (2006) Air Pollution Removal by Trees and Shrubs in the United States. Hirabayshi (2014) i-‐Tree Eco Dry Deposition Model Descriptions
Hirabayshi (2012) i-‐Tree Eco Biogenic Emissions Model Descriptions
Relevance to Canada
Inclusion of additional insect pests into model
Pollutant dollar value information required Canadian Biogenic VOC emissions inventory
Structural value of trees required

22
Ecosystem Service
Carbon Storage and Sequestration Energy Use Stormwater Regulation
Purpose Calculates total stored carbon and gross and net carbon sequestered annually
Estimates effects of trees on building energy use and consequent emissions from power plants
Estimates precipitation intercepted by vegetation reduction in stormwater
Attribute Measured
Estimation of tree biomass using forest derived allometric equations
Distance/direction to buildings. Trees< 6.1m ht. or > 18.3m distance to buildings are not
considered
Effect of vegetation in reducing surface runoff as net avoided runoff
Tree energy effects Hourly ppt
Shading, windbreak and local climate
Total annual surface runoff
Considerations Species average diameter (dbh) Percent cover (%) buildings vs trees Ttree species / Land Use Type
Tree condition Climate region Pervious vs impervious cover
Season = 153 frost free days/yr Deciduous vs coniferous (leaf type) Canopy ppt storage capacity
Standardized growth rates per tree
Tree size class Through canopy ppt
Building type (vintage) Evaporation
Infiltration time / Overland runoff
Depression storage
(CLE = 0-‐5); closed -‐ 0, open -‐ 5, Crown light exposure
Heating source type: electricity, natural gas, fuel oil, heat pump
Assumes precipitation (ppt) is uniformly distributed
Economic Valuation
Monetary value: $22.8t CO based on marginal social cost of CO emissions for 2001-‐2010
Estimated economic impact of change in building use: state average price per KWh
Value of ppt interception = net avoided runoff ($0.008963/gal.)
Conversion Factors and Equations
Above ground biomass to whole tree biomass uses a root to shoot ratio of 0.26
Amount of carbon avoided calculated in MWh (cooling), Mbtus+MWh (heating)
S (m3) = Rh -‐ Ra :Annual avoided surface runoff / yr Difference btwn hypothetical and actual
Open grown trees multiplier 0.8, closed canopy trees -‐ 1.0
0.5 + (0.5 * tree condition):Tree condition adjustment
S * LA / Σ LA for all trees = Ppt interception volume (m3)
Species/genus conversion: 0.48 conifers, 0.56 hardwoods
Tree condition = 1 -‐ % dieback
Total tree weight biomass to total stored carbon: multiply by 0.5
Convert plot and tree heating and cooling effects to the state specific equivalent
Other data required
Climate region's electricity emissions factors
Monetary value based on US Forest Service Tree Guide series
Energy Information Administration (2003) Consumer Price Index (2003)
Limitations Standard estimation error is difficult to derive
Updated energy tables of energy use in buildings
Reliance on hypothetical and actual scenarios
effect of regional variability No national database
Biomass equations for urban and ornamental tree species
magnitued of urban tree decay
Literature Source
Nowak (2002) Carbon Storage and Sequestration by urban trees in the United States
Simpson (1998) Urban Forest Impacts on regional cooling and heating energy use:Sacramento Case Study
Hirabayshi (2014) i-‐Tree Eco Precipitation Interception Model Descriptions
Relevance to Canada
Canadian carbon storage and sequestration data
Canadian building types and conversion factors
Value of ppt interception needed
Canadian climate regions needed
Calculates total stored carbon and gross and net carbon sequestered annually
Estimates effects of trees on building energy use and consequent emissions from power plants
Estimates precipitation intercepted by vegetation reduction in stormwater

23
4 URBAN FOREST BENEFITS
4.1 Ecosystem services
In the urban environment, ecosystem services, including ecosystem products, are functions and goods that urban ecosystems produce. These ecosystem services can provide a range of environmental benefits to Canada’s urban residents, such as improved air quality, microclimatic and hydrologic moderation, reduced noise pollution, carbon sequestration and storage, biodiversity maintenance, aesthetic and cultural values and products such as wood and food. For a comprehensive and practical review of ecosystem services and the benefits of urban nature, including practical applications and several Canadian examples, see Mooney and Brown (2013).
This section describes a range of ecosystem services that urban forest ecosystems can provide. Where possible, this section describes research on valuing ecosystem services, sometimes using economic evaluation.
4.1.1 Microclimate
Urban environments are fundamentally different from those found in nearby rural areas. For example, urban areas experience distinctive solar radiation, air quality, rainfall patterns, wind speeds, humidity and temperatures (Heidt and Neef 2008). These microclimatic elements are influenced by the built environment, the local topography and the surrounding natural environment (e.g. regional climate, soils and geology, hydrology, vegetation patterns). Cities are generally characterized by higher temperatures (“the urban heat-‐island effect”) (Oke 1973), higher levels of precipitation due to higher particulate concentrations (Bonan 2002) and increased flooding due to loss of canopy cover and abundant impermeable surfaces. The urban microclimate is also influenced on a smaller scale by specific features of the built environment, such as urban density, shade from buildings and the type and abundance of urban vegetation (Heidt and Neef 2008).
Current status
Temperature and energy use
Urban trees and green spaces can improve the urban environment for city residents. Urban vegetation reduces the urban heat-‐island effect by providing shade (McPherson et al. 1997). Even single trees provide shade and cool their immediate environment (McPherson et al. 1999). Evapotranspiration reduces air temperature through the conversion of sensible to latent heat and by adding water vapour to the air (Heidt and Neef 2008). In cooler seasons, trees can reduce space-‐heating needs by decreasing wind speeds and thus cold air infiltration into buildings (McPherson et al. 1997).

24
Using computer simulations of microclimates and building energy performance, McPherson et al. (1997) estimated that on average, trees in Chicago reduce annual cooling energy by about 7 percent or USD$15 per tree and reduce heating energy by about 1.3 percent or USD$10 per tree. The location of trees influences their effect on heating or cooling – trees located to the west and south of buildings reduce summertime energy use and peak cooling demand by shading buildings during the warmest times of day, although trees located to the south of buildings can block winter sunlight at midday when it is warmest, thereby increasing heating costs in cities that experience cold winter temperatures (McPherson et al. 1997). Trees located to the east of buildings have a cooling effect in summer but have limited impact on peak cooling demand as the warmest times of day occur when the summer sun is in the west. These results are supported by a more recent study of actual energy billing data in warmer climates in California – trees to the west and south of buildings reduced summertime electricity use by casting shadows at warm times of day whereas trees to the north of houses increased electricity use, possibly by decreasing air flow and thus the cooling effects of summer wind (Donovan and Butry 2009). This translated into annual average savings of USD$25.16 per household due to western and southern tree cover and annual costs of USD$7.48 for northern tree cover. These results and prices are context specific in that they reflect both the local climate and the local energy pricing system but there appears to be a consensus that trees located to the west of buildings are particularly valuable for reducing urban energy use in various environments as they are able to shade houses when the sun’s heat is most intense.
Surface Runoff and Flooding
When compared to natural forested environments, urban environments have decreased interception of precipitation via canopies and abundant impermeable surfaces, leading to higher flooding risk in urban environments. During peak precipitation events, water flows over the surface of the ground instead of infiltrating into it, creating high levels of surface runoff and flow through stormwater systems. Stormwater flooding can be exacerbated if tree leaves are allowed to block storm drain, leading to localized flooding (District of Columbia Department of Public Works 2015). Treating stormwater is expensive and untreated stormwater can pollute waterways and result in fines. Trees and the permeable soil in which they grow, can help regulate surface runoff by intercepting rainfall, evapotranspiring and increasing soil infiltration rates (Asadian 2010; Konijnendijk 2013). Trees can also be planted under permeable pavement to allow for increased infiltration and reduced flooding. The contribution of trees and green spaces to flooding reduction depends on tree species and condition, local precipitation rates and the design of associated infrastructure (e.g. park size and design, permeability of soils where trees are planted) (Asadian 2010; Konijnendijk 2013).
A study of five US cities attempted to quantify the benefit of stormwater runoff reductions and attach a dollar value to those reductions (McPherson 2005). Surface runoff reduction accounted for 51 percent of annual urban forest benefits in the case of one city and ranged from 8-‐19 percent in the other study cities, with a maximum annual economic benefit of USD$28 per tree. Economic benefits in the study cities varied according to interception rates and the local cost of runoff reductions using other methods, such a storm sewers. Although economic evaluations of the benefits and costs of urban trees tend to be highly context-‐specific, tools such as i-‐Tree, discussed above, allow individual municipalities to quantify urban forest benefits and costs for their cities and neighbourhoods.

25
Air quality
Trees and shrubs can improve air quality by intercepting and absorbing particulate pollution at street level (Nowak 1994; Heidt and Neef 2008), reducing urban ozone levels by lowering air temperatures through transpiration, removing air pollutants through surface deposition and reducing building temperatures and associated power plant emissions (Nowak et al. 2000, 2006), thereby improving air quality. Urban air quality is an important concern in Canadian cities, where traffic pollution causes annual premature deaths (Ligeti 2014). Urban trees remove various types of pollutants including: ozone (O3), particulate matter less than 10 μm (PM10), nitrogen dioxide (NO2), sulphur dioxide (SO2) and carbon monoxide (CO). The pollutants most commonly removed by urban trees in US cities are ozone and particulate matter (Nowak et al. 2006). Pollutant removal values vary among cities according to tree cover, pollution concentration, length of in-‐leaf season, precipitation levels and factors that affect tree transpiration and deposition velocities, such as wind speed.
Nowak et al. (2006) studied pollution concentration in 55 US cities and for the US as a whole and estimated that urban trees in the US remove about 711,000 metric tons of pollution annually, a benefit valued at USD$3.8 billion. Cities with large land area and high tree cover had the highest total pollution removal values, although per-‐tree values were lower than average. High per-‐tree values were associated with long in-‐leaf seasons, low levels of precipitation and high concentrations of pollutants. Low pollution removal values per unit of tree cover were associated with short in-‐leaf seasons. The annual value of pollution removal per city ranged from USD$60.7 million to USD$116,000. These results demonstrate that urban trees can be a significant source of air quality improvements, particularly if cities increase their urban tree canopy cover.
Urban forests are not uniformly distributed across cities, due to biophysical and socioeconomic factors. Escobedo and Nowak (2009) evaluated the effects of this uneven distribution on air pollution removal among varied socioeconomic subregions in Santiago, Chile. Pollution removal was generally the result of ambient pollution concentrations and urban forest cover type. Lower socioeconomic subregions with lower levels of tree cover and higher levels of PM10 concentration experienced the highest levels of per-‐tree PM10 removal, whereas higher socioeconomic subregions with high amounts of leaf area and tree and shrub cover experienced the highest removal rates for other pollutants. These differences suggest that urban forest managers could target urban forest management interventions to reflect local neighbourhood conditions and optimize benefits.
Gaps and future research
Taken together, the range of microclimatic benefits that trees provide make the urban environment more liveable and can help address environmental challenges faced by growing cities (McPherson et al. 1997; McPherson et al. 1999; Konijnendijk 2005; Heidt and Neef 2008; Konijnendijk et al. 2013). As municipalities seek to improve their urban environments through urban forest management, additional research is needed on how to plan and manage urban forests in concert with other urban infrastructure to increase local microclimatic benefits.

26
While we understand how tree placement affects energy conservation (McPherson et al. 1997; Donovan and Butry 2009), more research on species selection and interactions with local architecture would help municipalities target urban forest management to improve energy conservation and take a more holistic approach to urban design and development, integrating urban forest management with other urban management processes. Research in the arboriculture and landscape architecture disciplines may provide guidance in this area. Similarly, as we plan plantings, green space design and tree maintenance, research on the effects of green space size and structure, tree condition and seasonal variability in weather and leaf area index would facilitate more targeted urban forest management to reduce surface runoff and flooding (Asadian 2010; Konijnendijk et al. 2013). Finally, cities will need guidance on how to create policies and management practices that reflect the spatiotemporal heterogeneity of cities and urban forests (Escobedo and Nowak 2009). Cities are diverse and variable environments and urban forests will be able to provide microclimatic benefits most efficiently when they are managed to reflect fine-‐scale conditions in urban environments.
Inputs: Existing Conditions
4.1.2 Habitat provision and urban biodiversity
Current status
The contribution of urban greenery to biodiversity conservation is well established (Gilbert 1989; Fernández-‐Juricic 2000; G. Sanesi et al. 2011). Urban greenery provides important habitat for urban species and well-‐developed urban greenery helps maintain connectivity between habitat patches in the surrounding region ( Savard et al. 2000; Tjallingii 2000; Sanesi et al. 2011). This biodiversity conservation role is particularly important given that human settlements are often established in areas of higher biodiversity that have higher levels of resources to support human societies. An important benefit of urban biodiversity to human society is the role played by urban forests in maintaining pollinator habitat critical to urban food production (Gómez-‐Baggethun and Barton 2013; Mooney and Brown 2013).
Outputs: Ecosystem Services / Benefits
Quantified Outcomes
Economic Valuations Data Acquisition
Tools Decision
Support Tools
Inputs
Communication / Visualization Tools
Outputs: Canopy Cover DBH, Biomass etc.
Figure 3: The Role of Tools in the Ecosystem Services Valuation Process

27
The contribution of urban greenery to biodiversity conservation depends on the elements of biodiversity under examination and several other factors, such as connectivity, vegetation diversity, maturity of urban vegetation and urban density (Sanesi et al. 2009; Sanesi et al. 2011; Zhang and Jim 2014). Urban forests with lower levels of fragmentation are able to support higher levels of biodiversity, as are more mature forests with a higher diversity of vegetation species. When human settlements densify, the urban biodiversity of the area generally decreases. This is because the quality and connectivity of urban habitat often degrade as a result of densification (Sanesi et al. 2011). However, these general rules vary by individual species and the scale at which those species operate: woody species generally show the strongest positive response to increased habitat patch size and connectivity, while avian species’ habitat needs vary according to species and prey type and some insect species respond more strongly to microhabitat diversity than patch size (Morimoto 2011).
Gaps and future research
Urban densification is often promoted to increase the sustainability of urban areas, limiting urban sprawl and reducing urban residents’ energy use (Taylor 2012). However, increased urbanization and densification tend to reduce the abundance, quality and connectivity of greenspace. The effects of these changes on urban biodiversity can be expected to vary from region to region, warranting further investigation. In addition to planned greenspaces, vacant land in inner cities and older suburbs may be an important and relatively unstudied source of urban habitat (McPhearson et al. 2013). In the US, vacant land generally comprises between 12.5 percent and 25 percent of total land area, depending on population size and is often rehabilitated and used as space for community gardens, pocket parks, or sports fields (Kremer et al. 2013). While it is not clear how much vacant land exists in Canadian inner cities, similar suburbanization trends during the 20th century suggest that such vacant areas may exist in some Canadian cities and could be further investigated as areas for rehabilitation to increase urban green connectivity (Mieszkowski and Mills 1993). Urban biodiversity and ecological services could benefit greatly from further research that examines the role vacant land may play in biodiversity maintenance and how to integrate these areas into urban planning.
Biodiversity conservation in Canadian cities would benefit from increased information on land cover in Canadian cities. Land cover data would provide the necessary information to support targeted planning to support urban biodiversity. A centralized location for such information, such as a National Forest Inventory for urban forests would allow for baseline comparisons among Canadian cities and would support more robust urban forest planning and management.
4.1.3 Noise pollution control
Current status
Unwanted or excessive noise is common in many urban environments and is considered a type of environmental pollution, raising stress levels, disturbing sleep and potentially leading to hearing loss (Khilman 2004; Zannin et al. 2006). In response, many cities around the world have established noise emission limits in an attempt to maintain a healthy urban environment for residents. Noise traveling over terrain, vegetation, or other barriers, is attenuated by air and surface absorption, reflection, refraction, diffraction and scattering of the sound waves (Herrington 1974). Trees and other vegetation may reduce the amount of reverberation in

28
hard urban environments. Trees have been shown to be particularly effective at reducing urban noise when combined with walls or berms and in densely forested patches (Herrington 1974). Stands of mixed species are most useful for reducing urban noise pollution, as compared to single-‐species stands (Maleki and Hosseini 2011). While such plantings may not be possible in highly-‐dense urban environments, suburban environments present opportunities for noise reduction using trees and other vegetation. Wide bands of trees may be particularly useful for reducing noise pollution from travel corridors or industrial operations (Herrington 1974).
Gaps and future research
While lower levels of urban noise are often desirable (Zannin et al. 2006) and urban trees can help reduce urban noise, more recent research on urban noise is starting to focus on urban soundscapes rather than noise levels. When describing urban soundscapes, factors such as sound sources, temporality, seasonality and the background and preferences of the listener must be considered (Yang and Kang 2005; Botteldooren et al. 2006; Kang and Zhang 2010). For example, it appears that designers may have stronger preferences for natural sounds such as those produced by urban trees (Kang and Zhang 2010). In this context, there appears to be some scope for research on the contribution that urban trees can make to urban soundscapes, both positive and negative. Such a focus would go beyond an analysis of how urban trees can reduce noise to examine how this contribution may change temporally and seasonally and how this contribution might be perceived by city residents.
4.1.4 Climate change mitigation and adaptation
Current status
Urban forests offer two types of services related to climate change: mitigation and adaptation. The first refers to reducing the amount of greenhouse gases in the atmosphere and slowing the progression of climate change. The second refers to helping cities adapt to the environmental and social changes that climate change causes now and in the future.
Mitigation
Trees sequester carbon by fixing it during photosynthesis and storing it as biomass as they grow. Trees also produce litter and have fine root turnover, with seasonal cycles of production and loss. Some of this shed organic matter decomposes rapidly and some enters long-‐lived soil carbon pools. The long-‐term source/sink dynamics of forests change as trees grow and die and these dynamics are influenced by forest management (anthropogenic) actions and natural disturbances. Despite these fluxes, trees are generally assumed to provide a net storage benefit and thus increasing the number of trees reduces levels of atmospheric carbon (Richards and Stokes 2004). Urban trees can also play a role in reducing emissions of atmospheric CO2, through reduced building energy use, as discussed above.
Nowak and Crane (2002) have estimated the contribution of urban trees to carbon sequestration and storage for various US cities and at national, regional and state levels. Based on field data from ten US cities and data on national urban trees cover, the authors estimated that urban trees in the contiguous USA sequester 22.8 million tonnes of carbon per year (tC/yr) and stored (as of 2002) a total of 700 million tonnes of carbon. The

29
economic value of annual carbon sequestration was estimated at USD$460 million/year and the total value of carbon storage was estimated at USD$14,300 million.
More recently, the Normalized Difference Vegetation Index (NDVI), a measure of live green vegetation using reflectance values for different land covers obtained from multispectral remote sensing technology, was used to predict urban forest carbon storage in Syracuse, NY (Myeong et al. 2006). The carbon storage estimates based on the NDVI data were very similar to those estimated using field-‐based models. This method thus allows us to detect change in urban forest carbon storage over large areas using cost effective sources of data.
Another way that urban forests can store carbon is in urban soils. As organic matter decays and forms soils, carbon is stored in those soils. Soil organic carbon storage is affected by various factors such as organic matter inputs, temperature, precipitation, topography, urban microclimate and human disturbance and inputs (such as fertilizer), creating high levels of variability in soil organic carbon storage among soil patches (Pouyat et al. 2003). Research in US cities has shown that urban soils have the potential to store large amounts of carbon (Pouyat et al. 2006). While urban development in moist temperate regions tends to reduce soil organic carbon compared to natural ecosystems in these regions, urban development in more arid areas appears to increase soil organic carbon (Pouyat et al. 2006). Urban wetlands appear to be particularly effective at storing carbon.
Adaptation
As climate change progresses and increases in intensity, urban environments will experience a range of changes and pressures such as rising sea levels and increased storm surges, heat stress, extreme precipitation events, flooding caused by increased precipitation and snow melt, landslides, drought, increased aridity, water scarcity and air pollution (Revi et al. 2014). Although the specific impacts of climate change will vary by location, urban forests can play a key role in moderating the impacts of climate change and helping urban communities adapt to its effects. Urban forests can do this by providing microclimatic benefits and habitat provision and urban forest management can work in concert with other types of infrastructure and adaptation programming in comprehensive climate change adaptation strategies.
As discussed, above, urban greenery can improve urban air quality, reduce the urban heat island effect, reduce surface water runoff and flooding and maintain humidity in arid environments ( McPherson et al. 1999; Konijnendijk et al. 2005; Heidt and Neef 2008; Mathey et al. 2011). It can also help prevent flooding by providing permeable surfaces and by creating barriers to storm surges (Fields 2009; Tyler and Moench 2012; Revi et al. 2014). Urban forest design and management affect the ability of urban trees and green spaces to contribute to climate change adaptation. For example, large, connected green spaces with high-‐density vegetation have stronger cooling effects in urban areas and plant condition affects its ability to contribute to climate change adaptation (Mathey et al. 2011). Thus, urban forest managers will have to consider future climatic conditions and choose appropriate trees and shrub species for those future climates, while considering additional climate change impacts such as changes in the prevalence of urban forest insect pests and diseases as a result of changing climatic conditions.
Climate change may also have negative impacts on local populations of flora and fauna, particularly if populations are already stressed due to habitat fragmentation and degradation. Urban greenery, when managed to create connected green systems and corridors, can help maintain critically-‐important habitat for

30
local species, reducing the impacts of climate change on local populations and potentially facilitating the movement of species into new home ranges in response to changing climatic conditions (Morimoto 2011; Revi et al. 2014). Species selection and environmental design will affect how well urban forests fulfill this role.
As cities prepare for increasing climate change impacts, they are developing multi-‐disciplinary climate change adaptation frameworks and strategies (Revi et al. 2014). These strategies incorporate urban greenery in ways that address local climate change challenges and are appropriate to the local context (Fields 2009). Effective climate change planning should take place within a framework that integrates ecological, infrastructure, social and institutional factors in comprehensive planning processes. Adaptation frameworks such as that designed by Tyler and Moench (2012), promote multi-‐system integration and should provide guidance to local practitioners and planners. The Federation of Canadian Municipalities provides some guidance to Canadian municipalities in comprehensive climate change adaptation planning and it appears that several cities across Canada have undergone comprehensive climate change adaptation planning processes, including Calgary, Vancouver and Toronto (Federation of Canadian Municipalities 2009). Some cities and regions, such as the Metro Vancouver Region, are investigating how to strengthen urban green infrastructure networks to support climate change adaptation (Diamond Head Consulting 2014). This review does not investigate the details of these planning processes or how these plans incorporate urban greenery in climate change adaptation planning.
Gaps and future research
Mitigation
Urban forests are important for modifying present and future climates. However, to fully understand and evaluate their contribution, additional research is needed on tools to assess changes to urban forest carbon storage over time and over large areas and in a variety of urban environments (Myeong et al. 2006). In addition, research on urban forest carbon accounting should be extended to include potential atmospheric carbon inputs through urban forest management.
Similarly, research on carbon storage in urban forest soils would benefits from increased field testing in a variety of environments, in order to provide us with a more complete understanding of how urban soils can be managed to promote carbon storage in a range of contexts and how this storage can be valued in economic terms (Pouyat et al. 2006). Urban forest managers need guidance on management strategies to maximize urban forest carbon sequestration and storage.
Adaptation
The theoretical concepts and principles involved in urban forest planning and management for climate change adaptation are relatively clear. However, the practice of implementing these concepts in communities across North America and around the world, is more complex. Evidence from the practice of climate change adaptation planning would help verify whether proposed adaptation planning frameworks are working and how they could be improved to better meet local needs (Tyler and Moench 2012). Guidance on reconciling seemingly-‐opposing adaptation goals (such as increased densification and increased urban greenery) would be

31
particularly useful (Mathey et al. 2011; Revi et al. 2014), as would information on experiences in building public support for adaptation initiatives (Fields 2009).
4.1.5 Cultural services
Current status
Cultural ecosystem services, such as recreation, education and aesthetics, are important to urban communities but are somewhat different from the other services discussed above. These services are often intangible and experiential but are no less important for it. Perhaps due to their intangible nature, they are also difficult to define and measure. Mooney and Brown (2013) provide a useful definition of cultural services as “experiences and opportunities for mental or spiritual engagement with nature, such as recreation, education, artistic and religious experiences” (p.232). Fisher et al. (2009) describe cultural services as valuable benefits derived from ecosystems. Chan et al. (2012) specifically include “non-‐use” values in cultural services and argue that their inclusion in discussions of ecosystem services can help improve the cultural sensitivity and relevance of ecosystem services approaches to natural resource management.
Experiences of urban forest cultural services and perceptions of the benefits they provide, appear to be influenced by cultural background (Fraser and Kenney 2000; Buijs et al. 2009). This is particularly important in Canada, a country with large immigrant populations and which prides itself on its multicultural identity. If we are to successfully plan and manage our urban forests, we must consider the cultural services they can provide to various segments of the population. Divergent cultural experiences are also important because many urban trees grow on private property and the property owners will thus largely determine their management. Research in Toronto suggests that urban forest preferences of different cultural populations tend to align with traditional uses of trees in the culture of origin (Fraser and Kenney 2000). For example, members of communities of British origin had positive associations with shade trees, preferred higher-‐density plantings of trees on their properties and liked naturalized parks, including hiking trails. Members of communities of Chinese origin preferred landscapes without trees and did not want the additional yard maintenance associated with more trees. Italian and Portuguese communities preferred fruit-‐bearing trees and gardens and did not like shade trees that could conflict with gardens. These preferences appear to persist to some degree for generations in the new home country (Fraser and Kenney 2000). Related research in Europe showed similar outcomes, with native Dutch populations exhibiting strong preferences for wilderness landscape whereas immigrant populations from Islamic countries showed stronger support for “functional” landscapes and lower preferences for wilderness landscapes (Buijs et al. 2009). Despite these cultural differences, multi-‐cultural urban populations have also been shown to have preferences in common in their experiences of green spaces. Common preferences among all cultural backgrounds included green spaces as quiet spaces and well-‐maintained public green spaces (i.e. no litter or vandalism) (Rishbeth 2004).
Attitudes towards urban trees and urban forestry programs and willingness to contribute to these programs either with time or financially, appear to be influenced by age and socioeconomic status (Zhang et al. 2007). Public attitudes towards urban forests are of clear importance given their influence on budgeting and allocation of funds. Research in the US suggests that members of the public who are most likely to be willing to donate time and money to urban forestry programs are already aware of forestry programs, are employed full

32
time, are under 56 years of age and have an annual income greater than USD$75,000. Race and gender did not appear to affect willingness to donate time and money.
Given the importance of cultural ecosystem services, it is clear that good urban forest management should include cultural values in the decision-‐making process. However, it is somewhat unclear how we should evaluate cultural services and how to include them in decision-‐making processes. Peckham et al. (2013) used a qualitative approach to assess citizens’ cultural or non-‐use urban forest values in two Canadian cities (Halifax and Calgary) and found that citizens experience a wide range of such values from urban forests, including multiple aesthetic, educational and psychological values. Sinclair et al. (2014) undertook an innovative qualitative investigation of urban forest values in Winnipeg, uncovering a range of cultural or non-‐use values that were of primary importance to residents, including aesthetics and naturalness. Chan et al. (2012) present a system for valuing non-‐use and cultural values in which services may produce multiple benefits and the value of the service depends on the marginal value of the changes in the benefits it provides. This helps us manage the interdependency of benefits and the possibility for “double counting” that is so often a problem when valuing intangible cultural ecosystem services (Chan et al. 2012).
Hernández-‐Morcillo et al. (2013) discuss the use of cultural ecosystem service indicators in planning and decision making and conclude that 1) valuations and assessments should draw on a wide variety of cultural service indicators to reach a more holistic understanding of the factors affecting cultural services and benefits and 2) stakeholder involvement can greatly improve the quality of cultural ecosystem services indicators and that mapping can make the intangible more visible. Cultural ecosystem services are culture-‐ and context-‐ specific and thus inclusive planning processes can provide a more accurate and nuanced view of the nature and benefits of cultural services in local contexts.
Gaps and future research
There appears to be much scope for further research in the area of cultural ecosystem services, particularly on how to value cultural services and include them in decision-‐making processes. As cities grow and develop, we will also need to consider how changing demographics may influence future cultural values and residents’ experiences of Canada’s urban forests. The existing body of research suffers from a focus on economic methods of valuing ecosystem services (Chan et al. 2012). While this facilitates ecosystem services management, alternative methods of valuing cultural services will likely be necessary if we are to accurately represent their value. The fact that such methods may be “messy” is not adequate justification for avoiding their development and use. Research on humans “sense of place” in urban environments (e.g. Hayden 1997) may provide some guidance on non-‐economic methods for evaluating cultural ecosystem services in the urban forest context.
As such methods are developed, we should be careful to ensure that there is communication among disciplines to avoid heterogeneous approaches to assessing and valuing cultural ecosystem services (Hernández-‐Morcillo et al. 2013). While a diversity of approaches may be necessary to yield high-‐quality results, collaboration among disciplines and a common understanding of definitions and frameworks for understanding cultural services will facilitate the development of the field and more coherent approaches to measuring and applying cultural values. Such an approach may also help raise the profile of cultural services in planning processes, an important goal given the central role that such services play in our experience of and appreciation for, urban forests.

33
4.1.6 Products
Urban forests can produce products as well as services. Many of these products are useful to humans and thus provide benefits to urban populations. We discuss two urban forest products: waste wood and urban agriculture.
Current status
Waste wood
Waste wood from urban forests and treed landscapes can comprise significant volumes but usually fluctuates depending on the season, storm frequency and proximity to lakes, rivers and oceans in the form of driftwood (MacFarlane 2009). Tree decline and mortality through natural processes as well as standard tree removal within Tree Bylaw regulations and waste from the construction industry also contribute to wood waste. This resource has the potential to contribute biomass to local economies that could be used to produce local wood products and biologically-‐based power and heat.
An analysis of the region of Michigan, USA concluded that useable biomass from urban trees and wood waste is a currently underused and possibly substantial source of products that could contribute to local economies and reduce fossil fuel production (MacFarlane 2009). These products include biomass for energy production but also high-‐quality wood produced by tree removal, suggesting that urban trees can also be a source of high-‐quality timber. Construction, renovation and demolition also produce substantial waste streams that could provide biomass for local energy production (Macleod 2011).
This resource has the potential to be accessed and recycled through citizen participation if sufficient institutional structures are in place, which allow small amounts of wood to be milled with mobile units from specimen trees such as Quercus and Juglans spp. in the manufacture of high quality, artisan products. Areas where residual waste wood is stockpiled could allow for salvage operations where chainsaw use is permitted and free wood can be collected and gathered for home use.
Service et al. (2012) conclude that the role of gathering as an urban activity promotes the development of plant-‐human relationships and deserves a greater recognition in urban management. The study focuses on food gathering but there are other forest and tree by-‐products provided by urban vegetation, which are either not utilized or undervalued. These include seasonal products such as leaf litter that have the potential to contribute to soil and nutrient pools through composting and mulching. Prunings and green waste from care and maintenance operations and can also be recycled directly back into the urban forest through chipping and stumping processes. This avoids, at least partially, reliance on fossil fuels used in the transport of imported soil amendments, exported waste products and the cost of the materials themselves promoting environmental sustainability and responsible stewardship. Organizational acceptance, capital investment into operational requirements and the restructuring of schedules allocated for labour and equipment pools become a necessary pre-‐condition to capture the value of these existing resources.

34
Urban agriculture
Urban agriculture offers an alternative land use in urban areas and has been growing in popularity in cities across North America. This trend appears to be motivated by food security concerns, a desire to reconnect with nature in the city and growing urban sustainability movements (Lovell 2010). Urban agriculture provides urban populations with food and the opportunity to participate in its production. Research on urban agriculture, as it relates to urban forestry, is focused on agricultural design that supports urban biodiversity and urban forest planning to support food production.
The importance of urban agriculture for biodiversity conservation stems from the reality that much of the urban forest is located on private land and some of that private land is used to produce food for the landowner. These are not necessarily large urban farms, but private gardens managed by individuals or families (Goddard et al. 2010). Thus, networks of urban habitat to support biodiversity will have to include private gardens. This green connectivity is also important for pollinator movement and habitat, an essential part of successful urban food production. In this context, Goddard et al. (2010) suggest encouraging wildlife-‐friendly garden management for collections of gardens at scales beyond individual gardens.
In recognition of the important role that urban gardens can play in maintaining pollinator habitat and providing urban food, the Vancouver Park Board recently passed an urban agriculture policy to support urban food production. The policy focuses on edible landscaping, fruit and nut orchards, beekeeping and habitat provision for urban pollinators (Shore 2015).
As urban residents demand more opportunities for urban food production, including gardening, gathering, gleaning and livestock production, cities will need to adjust urban policies and planning practices and their conceptualization of urban forests and urban forest management. An interesting case study of this process is the Hidden Harvest Ottawa program in the City of Ottawa (Hidden Harvest Ottawa 2012). This project was developed through collaboration between community organizations such as Just Food and the Ottawa Foodbank, the City of Ottawa’s Sustainability Department and Ottawa’s Forestry Departments. Hidden Harvest harvests local food from local trees in Ottawa and sells edible trees to support ongoing urban food production. An important part of developing this project was high-‐quality data on the urban forest provided by the City of Ottawa. This data allowed interested non-‐governmental groups to identify urban agriculture resources in the city and work with relevant municipal organizations to develop an urban food harvesting program.
Another case study of collaboration in developing urban food production is the City of Seattle. Grassroots fruit gleaning groups have been able to work with the Seattle municipality to include fruit and nut orchards in parks and other public spaces in the city (McLain et al. 2012). These changes included a variety of commissions and departments responsible for managing Seattle’s trees, including the Urban Forestry Commission, the Department of Planning and Development, Seattle Parks and Recreation, Seattle Department of Transportation and the Department of Neighbourhoods. Grassroots organizations played an important part in changing how these departments work together to manage Seattle’s urban forest and were thus an essential element in establishing programs to produce edible products in Seattle’s urban forest (McLain et al. 2012).

35
Gaps and future research
Waste wood
Urban waste wood recycling is an emerging field, offering many opportunities for future research. While we understand the benefits of re-‐using waste wood to produce a variety of products, while potentially reducing fossil fuel consumption, it is unclear how benefits can be operationalized locally. Experiences using waste wood pellets to generate heat and electricity in European cities may provide some guidance to Canadian communities in this area (Lawrence 2013). Additional research on innovative case studies and the creation of local wood recycling economies would provide guidance to municipalities and regions seeking to exploit this resource.
Urban agriculture
Although we understand the importance of urban biodiversity and the role that individual gardens can play in its maintenance, maintaining urban biodiversity will require a landscape-‐level approach to managing urban gardens (Goddard et al. 2010). Future research could draw on landscape ecology tools to answer questions around optimal garden patch size and configuration for various urban species. In addition, we will need to investigate the policy and social tools available to facilitate the management of gardens at both neighbourhood and city scales.
The recent shift in interest towards producing and managing edible urban landscapes presents an excellent opportunity to learn from cities as they begin to implement new policies to promote urban food production (McLain et al. 2012). If urban agriculture, including food production in urban public spaces, is to be successful, cities and urban societies will need to create policies and incentives to manage the use of these spaces. Information sharing among practitioners will likely facilitate the sustainability of urban agriculture and gathering programs. The potential for pest impacts on commercial fruit production should be evaluated.
4.2 Human health and well-‐being
As our cities grow, academia, all levels of governments and private citizens are becoming increasingly interested in the human health benefits of urban trees and green space. Research has found that exposure to nature, especially forest-‐like settings, brings a myriad of human health benefits. Having natural, forested areas and trees close to homes promotes health and well-‐being because it gives people the opportunity to access trees in their everyday life. Urban green space is particularly important because of the large number of people it benefits. As Gómez-‐Baggethun and Barton (2013) argue, the “high density of beneficiaries relative to existing green infrastructure implies that the social and economic value of services provided locally by urban ecosystems can be surprisingly high” (p.243). With the global population moving to urban areas, it is becoming increasingly apparent that we must plan and provide urban forests for the health and well-‐being of urban residents.
Trees provide health benefits in a number of ways. Four mechanisms are most frequently mentioned in the literature: trees’ role in filtering air, increasing physical activity, reducing stress and increasing social cohesion within a community (Vries et al. 2003; Groenewegen et al. 2006; Maas et al. 2006; Mitchell and Popham 2007;

36
Mitchell and Popham 2008; Hartig et al. 2011; Groenwald et al. 2012). This review divides the various mechanisms into three categories, physical, mental and social health and concludes with a discussion of the equitable distribution of the benefits of urban forests.
4.2.1 Physical health
Air quality
Urban air quality is a serious health issue. A recent article in the New York Times cites a study by researchers from the University of Chicago, Yale and Harvard, that found that polluted air cuts 3.2 years off the life of people living in cities in India. When added together, this means “660 million Indians could lose 2.1 billion years as a result of air pollution at enormous cost to the country’s economy” (Harris 2015). Urban forests can play an important role in filtering urban air.
Mitigation of air quality by urban trees is the result of several complex processes, some of which operate in opposition. On the positive side, trees can uptake pollutants such as particulate matter, sequester carbon (see section 3.1.1) and reduce energy demand from buildings (see section 3.1.1). On the negative side, trees produce pollen and emit pollutants such as volatile organic compounds. Research has shown that the net balance is positive for human health (Hu et al. 2008; Bowler et al. 2010; Tallis et al. 2011; Nowak et al. 2013).
Many different types of pollutants affect human health. One of these is urban particulate matter (PM). Two types of particulate matter are studied: fine PM2.5 and course PM10 dust particles. Researchers used the opportunity of the Beijing Olympics to study the effects of air pollution on mortality. During the games, pollution-‐causing traffic was reduced, which reduced particulate matter pollution (PM10) by ten percent. The researchers found an associated 6.6 percent reduction in mortality. The results were extrapolated to all urban areas in China, resulting in an estimated CAD$76 billion to CAD$1.2 trillion in economic benefits of averted pre-‐mature deaths if PM10 concentrations were brought to the WHO guidelines (He et al. 2015).
So how well do urban forests filter particulate matter? A study in New York (Nowak 2013) found that PM2.5
removal by urban trees had a relatively small impact, preventing about one death per year in New York City. A study in London by Tallis et al. (2011) looked at larger particulate matter (PM10) and found greater potential for urban trees to filter the air. In this study, PM10 removal in London could be increased by ten percent if the tree canopy was increased by 4-‐17 percent. PM10 pollution is estimated to account for 1.9 percent of urban deaths in the UK. In the year 2002, this equalled approximately 6500 deaths and 6400 hospital admissions (Tallis et al. 2011). Other recent studies (Morani et al. 2011; Tallis et al. 2011; Nowak 2013) show the effect of trees mitigating other specific air pollutants, all with similar results – urban trees remove small percentages of each of a range of air pollutants.
Urban trees can also reduce air quality for those suffering from pollen allergy. Pollen allergy is a major health concern internationally. It is estimated that 30-‐40 percent of the world population has an allergic response to tree pollen. Some researchers have proposed that the direct costs of allergic rhinitis range from USD$2-‐5 billion per year (Cariñanos et al. 2014, p.135). Cariñanos et al. (2014) have developed a quantitative tool to help estimate allergenic potential to guide design and management of urban green spaces. In a test of the tool in

37
Grenada, Spain, they found that allergenicity of urban green spaces could be mitigated through planting a diversity of plant species and undertaking adequate management and maintenance (Cariñanos et al. 2014).
Increased recreation opportunities and physical activity
One of the most commonly understood uses of urban green spaces is for recreation. Urban parks, woodlands and greenways are examples of public or semi-‐private recreational areas. The list of possible recreational activities that may be undertaken in an urban park is almost infinite, but some of the most common are: walking, running, cycling, sitting, standing, lying down, reading, interacting with friends and playing sports. The health benefits of recreation in urban green spaces are clear. Even light exercise has positive physical and psychological impacts that improve human health, such as reduced body mass index, increased longevity and reduced stress (Takano et al. 2002; Hansmann et al. 2007; Bell et al. 2008; Bowler et al. 2010; Lovasi et al. 2011; Martens et al. 2011).
One study specifically related increased physical activity of urban seniors in green spaces to increased longevity. Takano et al. (2002) found that “living in areas with walkable green spaces positively influenced the longevity of urban senior citizens independent of their age, sex, marital status, baseline functional status and socioeconomic status” (p.913). Increased physical activity is also significant because increased walking and cycling could improve air quality by decreasing driving and its associated air pollution.
Childhood obesity is a growing concern in Canada. Some studies have looked into links between obesity and residential greenness. In a study of preschool aged children from low-‐income families in New York City, Lovasi et al. (2011) found a positive association between urban forests attributes and physical activity. Presence of street trees increased physical activity, while park access was associated with smaller skinfolds. Another study of children and youth in Indiana found a significant association between higher greenness and lower Body Mass Index (BMI) scores (Bell et al. 2008). Interestingly, the lower BMI scores were not associated with residential density characteristics. However, there is the question of scale. In a review of the health effects of the “greenness” of cities, Richardson et al. (2012) found no association between green space and health. In fact, mortality was higher in greener cities. The authors suggest that at the scale of the city, high green space is often associated with sprawling development, which tends to encourage a lifestyle centered on the automobile (Richardson et al. 2012).

38
Psychological impacts and physical activity
The positive psychological impact of physical activity in natural environments is the subject of a number of studies (Hansmann et al. 2007; Bowler et al. 2010; Annerstedt et al. 2012). In a review of studies that compared the effects on health and well-‐being of natural versus synthetic environments, Bowler et al. (2010) found evidence that a walk or run in a natural environment had a positive effect on health and well-‐being. Most of the measures were self-‐reported emotions. In a study of the association between park visit and well-‐being, researchers found a self-‐reported 87 percent reduction in stress and 52 percent reduction in headaches after a park visit (Hansmann et al. 2007). In a study in southern Sweden, Annerstedt et al. (2012) found little direct support for a link between access to green space and improved mental health, but they did find an additive effect between nature exposure and physical activity that contributed to better mental health.
Shinrin-‐yoku
A specific activity, the practice of forest bathing, or shinrin-‐yoku, has been studied in Japan (Yamaguchi et al. 2006; Morita et al. 2007; Park et al. 2010; Tsunetsugo et al. 2010; Lee et al. 2014). Much of the recent research has used new technologies to measure physiological symptoms of stress in subjects exposed to forested and non-‐forested settings. Yamaguchi et al. (2006) used salivary amylase activity, which is an indicator of sympathetic nervous activity in healthy subjects, to determine if shinrin-‐yoku decreased stress. Comparing exercise in forest environments versus urban environments with little to no vegetation, they found those who exercised in the forest had a salivary amylase activity 18.8 percent lower compared with that observed in subjects who exercised in the urban environment (Yamaguchi et al. 2006). Similarly, Lee et al. (2014) found significant differences in heart rate values, lower mean systolic blood pressure, increased parasympathetic nervous activity and significantly decreased sympathetic nervous activity when subjects walked in a forest environment compared with walking in an urban environment. The authors note “these trends in [heart rate variability] response are often detected in meditation or yoga therapies” (p.4). The concept is gaining ground in North America – the June 2014 issue of O Magazine (Oprah’s magazine) featured an article on shinrin-‐yoku (Frehsée 2014).
Pregnancy outcomes
There has been recent interest in the link between neighbourhood greenness and positive birth outcomes (Donovan et al. 2011; Dadvand et al. 2012a, 2012b; Hystad et al. 2014). Preventing adverse birth outcomes not only impacts infant health, it is also associated with the subsequent health of the individual throughout their life course. This represents a large potential burden on the healthcare system.
A study by Donovan et al. (2010) in Portland, Oregon found a positive correlation between tree canopy cover and pregnancy outcomes. The study found that a ten percent increase in canopy cover within 50 meters of a house was correlated with fewer small for gestational age births (1.42 per 1,000 births). An independent parallel study in Spain (Davadand et al. 2012) found that low-‐income mothers living in greener neighbourhoods experienced more positive birth outcomes. The researchers argue that this effect is due to lower income mothers spending more time close to home than other income brackets. Therefore, they speculate that tree canopy close to home has a greater impact on their lives.

39
A subsequent study in Vancouver, BC also found an association between residential greenness and better pregnancy outcomes. Women living in areas with higher green space had babies with higher term birth weight and a decreased likelihood for small for gestational age, preterm and moderately preterm births. When adjusting for other built environmental factors, such as air pollution and noise exposures, neighborhood walkability and park proximity these associations did not change (Hystad et al. 2014). The researchers suggest alternative pathways such as psychosocial and psychological mechanisms “may underlie associations between residential greenness and birth outcomes” (Hystad et al. 2014).
4.2.2 Mental health
Mental health is a growing concern across Canada. In 2012, the Mental Health Commission of Canada released the country’s first Mental Health Strategy (Mental Health Commission of Canada 2012). The commission estimates that mental health costs the Canadian economy about CAD$50 billion per year, or about 2.8 percent of gross national product. They estimate that the cost in support services over the next 30 years will cost more than CAD$2.5 trillion dollars (Mental Health Commission of Canada 2010). There is a growing body of evidence linking improvements in mental health and the presence of urban green space. Maller et al. (2006) suggest that “contact with nature may provide an effective population-‐wide strategy in prevention of mental ill health” (p.45).
A survey of recent literature on the mental health impacts of tree canopy includes a range of studies connecting access to nature and positive psychological impacts. Trees create pleasing visual contrast in highly built-‐up environments, reducing environmental fatigue (Pitt et al. 1979). Simply seeing and being in the presence of trees has been shown to reduce stress, improve emotional health and enhance general quality of life (Kaplan 1993; Velarde et al. 2007). A number of theories have been developed to explain this relationship. These include psycho-‐evolutionary theory, biophilia and attention restoration theory.
Psycho-‐evolutionary theory/biophilia and stress levels
Perhaps the most well-‐known study of the beneficial effects of viewing nature was Ulrich’s 1984 hospital study. The study found that patients in a hospital room overlooking a green, natural view recovered faster than patients whose hospital room looked at a brick wall (Ulrich 1986). The recovery rate was 8.5 percent faster and patients used fewer painkillers while in hospital. Since in-‐patient hospital time is expensive, the results show large potential cost savings. The authors of The Economics of Biophilia calculated that the 8.5 percent faster recovery time, when multiplied by comparable operational procedures across the United States, resulted in over USD$93 million in savings annually.
Ulrich attributes his results to psycho-‐evolutionary theory, arguing that humans have a pre-‐cognitive psychological reaction to non-‐threatening nature that can reduce stress. In a 1991 study, Ulrich tested physical stress reactions such as heart rate when subjects watched a nature video after a stressful workplace injury video. Within ten minutes, subjects who watched the nature video had heart rates at lower stress levels than before they entered the study (Ulrich 1991).
Edward O. Wilson, coined the term biophilia to describe humans’ emotional affiliation with other living organisms and warned about our increasing departure from engagement with the natural world. This can

40
include both passive and active engagement with the natural world. Recreation experiences that take place in urban forests connect people with nature. These opportunities for interactions with nature are important to foster an understanding and appreciation for the natural environment and the benefits and services that it can provide (see Section 4.2.1).
Passive engagement with the natural world includes viewing nature through a window. Examples of this connection can be seen in the growing evidence of workplace satisfaction and green space. Many studies find a connection between workplace satisfaction and job performance and access to a natural view (Kaplan 1988; Kaplan 2007; Lottrup 2013, 2015). In a review of research supporting biophilia-‐based design in workspaces, the authors found that architectural elements, particularly the quality of a worker’s view, explained ten percent of the variation in sick days taken (Elzeyadi 2011). Lottrup et al. (2013) found that access to greenery in the workplace lowered stress and increased positive attitudes. Kaplan et al. (1988) found that workers who had views to nature reported an average of 2.42 ailments in six months versus those without nature views who reported and average of 3.02 ailments. A study in 2007 found that less manicured views were preferred and that a few large trees enhanced the preference (Kaplan 2007). In The Economics of Biophilia, the authors calculate that employee absenteeism and presenteeism (workers who are present at work, but mentally not engaged), account for about four percent of a company’s bottom line. This equates to about USD$2,000 per employee per year in office costs (Terrapin 2012).
The idea of cost savings of creating happier, engaged employees by giving them access to nature at work is gaining ground. In New York City, the Bank of America Tower “was designed to ensure that 90 percent of all employees had views to parks, green roofs and/or rivers, specifically to create an iconic building with the explicit purpose of attracting and retaining the best employees” (Terrapin 2012).
Attention restoration theory
Rachael and Stephen Kaplan have documented similar effects of stress reduction and nature exposure. They theorize that nature restores one’s mental state by creating involuntary attention. Their attention restoration theory argues that if people have too much focused or directed attention, they will become mentally fatigued. Allowing time for involuntary attention, such as viewing nature, will restore one’s mental focus. Rachael Kaplan (2001) studied views from home and related stress reduction with the ability to view natural settings outside of one’s window. She suggests such views allow for many micro-‐restorative experiences throughout the day. As Frederick Law Olmstead famously said “the attention is aroused and the mind occupied without purpose” (Olmstead 1865) when viewing nature. Application of these theories could have wide implications for neighbourhood design and the health of residents.
Hartig et al. (2003) used a mixed methods approach to test both attention restoration and stress reduction theories. They found positive outcomes for both, suggesting “that the physiological and attentional restoration processes may complement one another, manifesting in different kinds of outcomes that emerge at different rates and persist to differing degrees” (p.121). They argue that like sleep, regular exposure to nature can interrupt processes that negatively affect health.

41
Mental well-‐being
A number of studies connect urban green space and mental well-‐being (Guite et al. 2006; Annerstedt et al. 2012; Groenewegen et al. 2012; White et al. 2013). Recent studies have linked increased exposure to nature with physiological characteristics of reduced stress (Ward Thompson et al. 2012; Roe et al. 2013; Jiang et al. 2014; Tyrväinen et al. 2014) and increased mental wellness, such as healthier cortisol levels (Roe and Ward-‐Thompson 2013), urine adrenaline and improved attention-‐deficit and hyper-‐activity disorder in children (Madren 2011).
Many studies on the connection of mental health and green space come from Europe. A national study in the Netherlands found “depression rates were 1.33 times higher in areas with little green space than in areas with very much green space” (Groenewegen et al. 2012). Taylor et al. (2015) found decrease of 1.18 anti-‐depressant prescriptions per thousand people for every additional tree per kilometer of street in London. A longitudinal study in the UK found that those living in areas with eighty one percent green space reported a 0.14 increase in General Health Quality and a 0.07 increase in life satisfaction versus those living in areas with forty-‐eight percent green space. While these numbers seem low, they are roughly 35 percent (GHQ) and 28 percent (life satisfaction) as large as the effect of being married (White et al. 2013), which is a well-‐known contributor to well-‐being. The authors suggest “that significant aggregate gains can be made from increasing the amount of green space in urban settings. Even small benefits to individuals can have large impacts if, like green space, they touch many people” (p.927).
Mental health and neighbourhood design
A study by Guite et al. (2006) confirms an association between the physical environment and mental well-‐being across a range of domains. The most important factors that operate independently are neighbour noise, sense of over-‐crowding in the home, escape facilities such as green spaces and community facilities and fear of crime. This study highlights the need to intervene on both design and social features of residential areas to promote mental well-‐being. While there is no conclusive evidence on amounts of green space that promote well-‐being, many studies have begun to approach the “dose of nature” necessary to foster positive mental health in a population. Grahn and Stigsdot (2003) found that the distance to green space reduces stress and that being within 300m of green space equalled about 3 visits to the space per week. Gidlöf-‐Gunnarsson (2007) looked at the associations between noisy environments, green space and mental health. Their study found that “for both those with and without access to a quiet side, the results show that “better” availability to nearby green areas is important for their well-‐being” (p.115). Another study found that use of these green spaces does not explain the positive effects seen and suggest that the general neighbourhood character plays an important role in supporting outdoor recreation and physical activity (Neilson and Hansen 2007). Dillen et al. (2012) found that “streetscape greenery is at least as strongly related to self-‐reported health as green areas (p.1). Finally, two studies (Mitchell and Popham 2007; De Vries et al. 2013) found that quality of the green space provided was as important as quantity.

42
Biodiversity
A few studies looked at the relationship between biodiversity of urban nature and well-‐being (Fuller et al. 2007; Carrus et al. 2015). In a study in Sheffield, UK, Fuller et al. found positive associations between the reported well-‐being of green space visitors and the species richness of the spaces they visited. In four Italian cities, Carrus et al. (2015) also found positive associations between the level of biodiversity and self-‐reported restorative benefits of visits to restorative environments. They suggest that “providing high-‐quality green spaces within the dense urban context will likely promote individuals’ appreciation of nature and foster more positive attitudes and behaviours towards nature itself, contributing to the overarching goal of creating more environmentally aware citizens” (p.227).
ADHD in children and exposure to nature.
Taylor and Kuo (2009) found a significant increase in concentration for children with ADHD who went for a 20-‐minute walk in the park compared to a similar group who walked downtown or within a neighbourhood. They suggest that “doses of nature” might serve as a safe, inexpensive, widely accessible new tool in the tool kit for managing ADHD symptoms (p.402). In The Economics of Biophilia, the authors calculate an annual savings of USD$228 million on ADHD medications in the US if children were able to walk in a park during the day (Terrapin 2012). Access to natural environments at school can offer positive benefits for all children. A recent study at the University of Colorado Boulder watched children in a variety of play settings at school. They found that natural-‐terrain schoolyards “foster supportive relationships and feelings of competence” (Chowla and Lock 2014). The natural areas were important for reducing the children’s stress levels.
4.2.3 Social health
Research shows that green spaces may help residents develop a sense of community and attachment to neighbourhoods, increase social contacts and decrease feelings of social isolation (Chenoweth and Gobster 1990; Hull et al. 1994; Kuo et al. 1998; Kuo 2003; Maas et al. 2009; Escobedo et al. 2011; Arnberger and Eder 2012). Most of this health research has been quantitative in nature, using surveys or health statistics to determine links between health and forests. Social health has been the least studied of the mechanisms between green space and human health. Studies by Sugiyama et al. (2008), Maas et al. (2009) and De Vries et al. (2013) found a strong correlation between social health, mental health and green space. Maas et al. (2009) studied the association between feelings of loneliness and perceived shortage of social support and percentage of green space surrounding residences. They found that greenness within one km had a positive effect on social well-‐being. The mechanisms for this effect are not fully understood. Urban forests provide recreation opportunities, gathering spaces, and aesthetic benefits which can all contribute to a greater sense of social well being.
Recreation is a socially significant pursuit: people often participate in recreation in groups, and recreation experiences provide for opportunities for socialization (Stokowski, 1990). Blackshaw & Long (1998) elaborate on this idea and note that leisure is not separate from other aspects of people’s lives; rather it is an intrinsic part of many different aspects of people’s lives. Through the creation of opportunities for socialization among like-‐minded people, leisure creates social capital (Hemingway, 1999). Social capital “refers to features of social organization such as networks, norms and social trust that facilitate coordination and cooperation for mutual

43
benefit” (Putnam, 1995a, p. 67). Further, these features of social life “enable participants to act together more effectively to pursue shared objectives” (Putnam, 1995b, p. 664-‐665). Social capital can be considered social goods, such as information and social influence, which are produced and dissipated through social relations. The basis of social capital is that an investment in social relationships can result in beneficial outcomes (Glover, 2004); in particular, “social capital is the consequence of investments in and cultivation of social relationships allowing an individual access to resources that would otherwise be unavailable to him or her” (Glover, Shinew & Parry, 2005, p. 87). Hemingway (1999) has suggested that leisure plays a role in the creation and fostering of associational memberships (both formal associations like club membership, or informal associations like a group of like-‐ minded friends), which in turn can lead to increases in social capital through the encouragement of the development of acquaintance relationships: “The forms, content, and distribution of leisure activities represents a major potential factor in the development of democratic social capital and thus in the stability of democratic society” (p. 157). Francis Kuo (2003) undertook a long-‐term study in a Chicago community, using qualitative methods such as interviews, participant observation and document analysis of police records. He found a marked decrease in crime in social housing projects with green space versus those without. The green spaces observed provided a place for local residents to gather. Within the projects that had green space, researchers observed more interaction between residents, more adult supervision of children and a decrease in crime as revealed by analysis of police records. The authors of The Economics of Biophilia calculate that the Illinois State Department of Corrections would save USD$162,000 per year from reduced crime if the public housing units in Kuo’s study were designed with access to nature.
Urban forests can also provide aesthetic benefits, such as a unique sense of place for a particular community. Community attachment is an indicator of the social health of a community. Following hurricane Hugo, Hull et al. (2004) asked residents of Charleston, South Carolina which elements of special significance were lost. Thirty percent of residents identified the urban forest, more than for any other feature. Churches were second in significance with 27 percent of people recognizing them as significant losses.
A discussion of the benefits of urban forests for human health and well-‐being would be remiss in excluding the negative effects of trees on residents’ quality of life (Nowak and Dwyer 2007). In a review of ecosystem services and disservices, Escobedo et al. (2011) present a wide-‐ranging list of potential social nuisances associated with urban forests:
Allergenic pollen and urushiol, refugia for vector-‐spread diseases: lyme disease, West Nile encephalitis, dengue fever, rabies, attraction of wild animals, damage to structures and ornamental plants, droppings, attacks on pets, annoyance to humans, wild animal bites, obscured views, decreased aesthetics, fear of crime, safety hazards from tree fall. (p. 2081)
Research to date has been limited on these negative effects. In a review of the relationship between urban design and human health, Laura Jackson (2003) found issues with the spread of low density development into previously forested or farmed areas. This spread has been linked to increases in Lyme disease, Hanta virus and exposure to farm nuisances such as pesticides and noise. While the forest interface was not specifically addressed in this study, it is an important consideration for many Canadian towns and cities.

44
4.2.4 Equitable access to urban greenery: green equity
The positive relationship between urban greenery public health and societal well-‐being raises questions about green equity in the urban environment (Maas et al. 2006; Mitchell and Popham 2008; Landry and Chakraborty 2009; Station 2010; Greene et al. 2011). Given the many benefits provided by urban greenery, urban residents who live in ethical, democratic and sustainable societies should all have more or less equal access to urban greenery, under similar geographic and ecological conditions. Equitable greenery access helps ensure that all residents have equitable access to the environmental services and the health and psychological benefits provided by urban greenery that may be associated with higher levels of societal well-‐being (Maas et al. 2006; Mitchell and Popham 2008; Sanesi et al. 2011a). However, various measures of the availability and the quality of urban greenery indicate that urban greenery access varies according to a series of factors including property values, socioeconomic status, level of education and age of housing stock. Five examples of measures that show this relationship include: (1) canopy cover (Heynen and Lindsey 2003); (2) distance to a public green space (Barbosa et al. 2007); (3) street tree abundance (Landry and Chakraborty 2009); (4) abundance of green as represented by the Normalized Difference Vegetation Index (NDVI) (Lafary et al. 2008); and (5) impervious land cover (Ogneva-‐Himmelberger et al. 2009). In general, it appears that higher levels of greenery are positively associated with higher incomes and education and older neighbourhoods.
It is not clear whether the above mentioned relationships exist to the same extent between different geographical areas, different cultures and cities with different development histories (Lafary et al. 2008). Research to date has focused on individual cities or regions and as a result appears to be contradictory in some cases (Barbosa et al. 2007; Lafary et al. 2008). For example, Heynen and Lindsey (2003) found that canopy cover is positively associated with higher levels of education and older housing stock but found no correlation with median household income. In contrast, Landry and Chakraborty (2009) found that tree cover on public land was lower in neighbourhoods with low-‐income residents. In Sheffield, UK, public greenery access was found to be slightly higher among more deprived groups (Barbosa et al. 2007). In South Africa, the availability of urban greenery is highly influenced by racial history (McConnachie and Shackleton 2010). Residential neighbourhoods with primarily white inhabitants and with a history of white habitation have the highest level of greenery access, while the primarily black population living in low-‐cost housing suburbs experiences the lowest levels of greenery access.
There is growing evidence of the positive impacts of urban greenery on health and mortality. Various studies have shown positive relationships between good health and abundant urban greenery (Groenewegen and Verheij 2006; Maas et al. 2006; Mitchell and Popham 2007, 2008; Vries et al. 2003). However, this relationship is not the same for all health indicators and all socioeconomic groups. The positive effects of urban greenery on health seem to be strongest among lower income groups (Mitchell and Popham 2007, 2008; Vries et al. 2003) and for mortality of all causes and circulatory disease (Mitchell and Popham 2008). The availability of urban greenery also appears to have a positive effect on residents’ perceived general health, once again with a stronger relationship observed in lower income groups (Maas et al. 2006).
Urban greenery has the strongest positive influence on the health of lower socioeconomic groups: those groups that are more likely to suffer poor health outcomes and higher levels of mortality (Mitchell and Popham 2008). This relationship and the apparent negative relationship between poverty and the availability of urban
45
greenery suggest that urban green inequity is a fundamentally important issue that should be addressed in urban planning.
Gaps and future research
The survey of recent urban forest literature above demonstrates a growing interest in connecting human health and access to urban nature. As Maas et al. (2006) argue “green space seems to be more than just a luxury and consequently the development of green space should be allocated a more central position in spatial planning policy” (p. 587).
Physical, mental and social health
The above studies all link various aspects of the urban forest, such as residential greenness, park spaces, street trees, etc. to a variety of physical, mental and social health benefits, yet few show the cumulative benefits of the variety of ways trees contribute to human health. The above research summary shows that research interest is accelerating in connecting green spaces with human health, but that most studies to date look at only a single health outcome and few demonstrate causal relationships. No studies were found that could demonstrate long-‐term health benefits of nature exposure.
Longitudinal research is needed to study the effects of nature across different age ranges and between different cultures. The studies on senior population mortality (Takano et al. 2002) and childhood ADHD symptoms (Taylor and Kuo 2009) show promise at both ends of the human lifespan for the positive effects urban green space can have on the human population. Ward Thompson and Aspinall (2009) argue that access to nature in childhood is important if we are to expect future adults to perceive natural environments as places for physical activity (p.252). Longitudinal studies can help us answer at which points in human life spans access to nature is more important (Astel-‐Burt et al. 2014).
The literature reviewed in this paper is primarily international; only one study from Canada was cited. In their review of the research on the connection between nature and health, Hartig et al. (2011) find that “the research on nature and health has not yet seen a sustained effort to address the possibility that there are systematic differences across individuals in responses to nature” (p. 159). In Canada’s multi-‐cultural urban environment, special attention must be paid to cultural differences in nature experience and appreciation. Urban forest values of a multi-‐cultural population are an important research area in our country. Canada’s cities are not just culturally diverse, they also all have unique urban design characteristics. Further research at the city-‐wide scale could yield important findings about impacts of density and urban design on green space and residents’ health.
Further research is needed about the effects of a variety of urban forest design parameters such as tree location and size, canopy stratification, tree density and species-‐specific effects. The “dose of nature” necessary for the positive benefits discussed is an area of ongoing and important inquiry. As Dr. John Innes, Dean of Forestry at UBC, believes “considerable areas of woodland should be managed specifically to improve the physical and mental health of local populations” (Merivale 2015). In a study in the Netherlands, Maas et al. (2009) found a relationship between morbidity and green space. Using morbidity data and percentage green space within a one and a three-‐kilometre radius of peoples’ homes, they found a relationship very similar to

46
the relationship between age and morbidity: “an increase in 1 percentage point of green space on physician assessed morbidity equals the effect of 1-‐year lower age” (p. 970). The effects were strongest for depression and anxiety disorders and for people with lower socio-‐economic status and children under 12. A similar study in Canada could yield important strategies for using urban green spaces to promote national health.
The following research highlight demonstrates the potential impact of future research connecting human health and urban forests:
The devastation caused by the Emerald Ash borer has provided researchers with a chance to study the cumulative health benefits of trees through a natural experiment. The loss of 100 million trees in the United States to the emerald ash borer within a relatively short time frame gave researchers the opportunity to compare before and after health data in affected towns. The research found that within the 15 states affected, “the borer was associated with an additional 6,113 deaths related to illness of the lower respiratory system and 15,080 cardiovascular-‐related deaths” (Donovan et al. 2013) that could not be attributed to any other covariates known to influence mortality from these diseases.
These numbers are significant. While causality could not be explained within the study parameters, the researchers speculate that it could be a combination of benefits, such as loss of air quality combined with decreased recreation and increased stress caused by loss of large areas of tree canopy in the urban areas studied. More research is needed to begin understanding these causal factors.
Equitable access to urban greenery
A diversity of study sites and measures of green cover and green access (or equity) has demonstrated general relationships between measures of privilege and urban green access but has yet to clarify the relative roles that these factors play. The underlying causes of urban green inequity remain unclear. For example, do low-‐income neighbourhoods experience lower access to urban greenery because there is low public investment in those neighbourhoods or because private properties tend to be smaller and have smaller private green spaces? Are levels of green equity comparable between street trees and urban parks? Are these patterns consistent among regions or are they influenced by local culture, political structures and public preference? There are many ways to define and measure urban green equity, which will affect the outcome of any analysis of the issue. Furthermore, in areas where urban green inequity is observed, it is not clear that factors are driving this inequity. If we hope to improve urban green equity, we must first have a better understanding of why green inequity exists.
The uncertainty surrounding this issue may in part be caused by variation in the way we understand and measure urban greenery and the standards we use to establish equitable access. Urban greenery is a diverse system made up of various distinct parts that are often managed separately. Street trees, recreational parks, natural woodlands, private gardens, boulevards and greenways are all important elements of urban greenery but are often managed by various different municipal bodies, private residents, or private foundations in public-‐private partnerships. An accurate assessment of urban green equity must include a variety of types of urban greenery and urban settings, yet the majority of the existing research uses one metric and one region only (Heynen and Lindsey 2003; Barbosa et al. 2007; Lafary et al. 2008; Ogneva-‐Himmelberger et al. 2009). Urban green equity analysis also suffers from inconsistent and arbitrary accessibility standards (Harnik 2010).

47
Standards that prescribe maximum distances to a park or green space from residents homes vary from municipality to municipality (e.g. Barbosa et al. 2007; Harnik 2010) and have little rationale to support their establishment.
4.3 Economic benefits
4.3.1 Property values
Forest cover in urban environments can occur in the form of public parks, protected forests, unprotected (or undeveloped) forest areas and trees growing in yards and along streets (Mansfield et al. 2005). Each type of forest cover provides different types of amenities on both public properties (e.g. parks, streetscapes) and private properties (e.g. residential, commercial, industrial). This has important implications for the costs and benefits of urban trees: on public lands, these are shared among taxpayers; on private lands, they accrue to individuals or companies (Zhu and Zhang 2008). Developers and city planners consider the expectations of urban citizens in regard to trees when choosing landscape and lot sizes. While public trees and private trees can serve as substitutes, Escobedo et al. (2006) observed that public urban forest structure is related to the socioeconomic strata in different municipalities: where property taxes were higher (i.e. neighbourhoods with higher socioeconomic status), the total public budget allocated to urban forest management was greater.
Current status
Urban trees can increase the aesthetic quality of neighbourhoods and boost the value of residential property (Payne and Strom 1975; Morales 1980; Anderson and Cordell, 1985; Anderson and Cordell 1988; Schroeder 1989). Researchers have been studying the economic contribution of urban trees to property values since the early 1970s. Peters (1971) conducted one of the earliest studies on the topic and concluded that shade trees contributed approximately 19 percent to the total appraised value of a 2.8-‐hectare urban property. His study was followed soon after by Payne (1973), who found that a single-‐family home surrounded by trees received a seven percent price premium over a home without trees.
A comprehensive study by Anderson and Cordell (1988) found that each large front-‐yard tree was associated with a 0.88 percent increase in sales price. Across several studies that have been conducted within the past 20 years, it appears that the presence of trees increases residential or commercial property value by approximately seven percent (Wolf 2012; TD Economics 2014). The costs (e.g. pruning) and benefits (e.g. lower energy use) associated with yard trees vary widely by size and between tree species: a study conducted in California found that plane trees carried the highest net benefits; pear trees carried the lowest net benefits (Maco and McPherson 2003; McPherson 2003).
Homes that are adjacent to parks and open spaces are typically appraised 8-‐20 percent higher than comparable homes elsewhere (Crompton 2001; Crompton 2005). Crompton (2001) demonstrated that a quality forest or green space has a positive economic ripple effect on nearby properties, i.e. beyond immediately adjacent properties; however, the relationship between proximity to forest and property values has been the subject of debate (Luttik 2000; Tyrväinen and Miettinen 2000; Thorsnes 2002). Mansfield et al. (2005) concluded that the relationship between proximity to an urban forest and property values is non-‐linear, which may provide some

48
clarification and resolution and that the presence of yard or street trees could serve as substitutes for proximity to a forest. Poudyal et al. (2009) also found that property values were positively related to the size and proximity of an urban park and that urban residents prefer larger parks to smaller ones, but exhibit a diminishing marginal willingness to pay for extra acreage.
Demand for urban park amenities associated with a property varies across demographics. Surprisingly, residents that had a college degree (as reported in US Census Bureau data for the year 2000) demonstrate less demand for larger park areas (Poudyal et al. 2009). Researchers have hypothesized that this could be due to higher opportunity cost of time for these individuals (i.e. less time spent in nearby parks) and a greater ability to afford alternative natural amenities (Poudyal et al. 2009). The percentage of African-‐American residents was also found to be negatively related to measured park size (Poudyal et al. 2009).
The type of forest, ownership (i.e. private or public) and level of protection (e.g. short-‐term, permanent) appears to influence the value of price premiums on property values (Kim and Johnson 2002; Mansfield et al. 2005). The presence of street trees adjacent to a property also decreases the time a house spends on the market prior to sale (Donovan and Butry 2010), while yard trees (i.e. on the property) have been linked to both higher property values and rental rates (Morales 1980; Anderson and Cordell 1988; Des Rosiers et al. 2002; Wolf 2012). The presence of trees can even ameliorate the negative impacts of the presence of an undesirable amenity, such as a chemical plant, on residential property values (Lee et al. 2008).
The effect on rental rates holds true for both residential and commercial properties (Morales 1980; Laverne and Winson-‐Geideman 2003). Crompton (2001) found that rental rates of commercial office properties located on a “high-‐quality landscape” which was defined as including trees, were about seven percent higher than those on lower-‐quality landscapes.
Zhu and Zhang (2008) also observed the reverse effect: namely, that demand for urban forest areas is elastic with respect to price and highly sensitive to changes in income. This relationship is explained by the fact that higher income populations can afford the expense of alternative land use (e.g. treed space that is unoccupied by buildings) and the planting and maintaining of urban trees. A similar relationship has been observed between income and demand for public parks and recreation services (Borcherding and Deacon 1972; Bergstrom and Goodman 1973; Perkins 1977; Santerre 1985) and environmental quality (Bender et al. 1980; Palmquist 1982; Zabel and Ziel 2000; Brasington and Hite 2005). Thus, it appears that the relationship between property values and urban forest is self-‐reinforcing: property values are higher in urban areas with trees; individuals with high socioeconomic status can afford to purchase these properties; these individuals demand access and proximity to urban forest areas.
Hedonic price analysis has been widely used to estimate the impact of proximity to trees and forests on urban property values since the mid-‐1970s (Payne and Strom 1975; Morales 1980; Anderson and Cordell 1988; Anderson and Cordell 1985; Anthon and Thorsen 2002; Anthon et al. 2005). Hedonic pricing involves estimating the value of a good or service (e.g. urban forest) by comparing observed market data in the presence and absence of that good or service (e.g. house prices or rents in areas with and without urban forests) (Palmquist 1991). The underlying assumption of hedonic pricing is that the price of a marketed good is related to its characteristics. Information about the implicit demand for urban forests is used to estimate a demand function

49
for property that either has trees or is near an urban forest (TEEB 2010). The value of a change in the availability of urban forest is then used to identify the value of urban forest areas. Price (2003) and Poudyal et al. (2009) have pointed out some critical errors that can occur in studies that use hedonic price analysis, including omission of key variables (e.g. whether the forest lies south or north of the house, variation in aesthetic quality of trees with age), failure to segment and account for differences at the sub-‐market level, selection of incorrect variables (e.g. substitution of estimates of old trees for young trees, landscape design), mischaracterization of linearity in functional relationships (e.g. relationship between aesthetic quality and density of tree cover) and failure to account to interaction between variables (e.g. size of urban forest, distance from a house, blocking of direct sunlight).
Alternatively, econometric analysis can be used to identify the strength and direction (e.g. positive, negative) of the relationship between variables such as income and demand for urban trees (Zhu and Zhang 2008). Regression analysis has been performed to compare the sales price of homes with a substantial amount of tree cover to those with no tree cover and identify the price premium for properties with trees (Morales 1980; Anderson and Cordell 1988; Thériault et al. 2002; Laverne and Winson-‐Geideman 2003).
Gaps and future research
Research has largely focused on the effect of urban trees on residential property values (Wolf 2012). The impact on commercial or institutional properties has received relatively little attention (Crompton 2005). Laverne and Winson-‐Geideman (2003) is one exception.
While there are several studies that document the benefits of urban forests, the negative effects of urban forest lands and potential strategies to mitigate those impacts, are far less commonly explored (Tyrväinen 2001). For example, urban trees can generate disadvantages to property owners by generating litter, falling fruit and pollen, which can accumulate on yards and vehicles and aggravate allergies (Escobedo et al. 2009). Trees also provide habitat for species of wildlife (e.g. rats) and insects (e.g. aphids) that may generate annoyance for property owners; they can damage buildings and infrastructure in windstorms and through natural growth (Wyman et al. 2012); and they can be time consuming and costly in terms of maintenance and removal (Escobedo et al. 2009). Tyrväinen (2001) also provides the hypothetical example of residents of a home located next to a public park that may receive benefits from the park but may also experience noise and congestion, shading or maintenance problems. Irwin (2002) observed a negative impact of increasing tree cover in a residential neighbourhood on property values, indicating that homeowners preferred open space. Laverne and Winson-‐Geideman (2003) report a negative impact of 7.5 percent on the rental value of office buildings from landscaping that provided a visual screen, suggesting that visibility takes priority over privacy in an office setting. Hardie and Nickerson (2004) observed a six percent decrease in residential property values where new legislation required retention or planting of trees on developed land. It is unclear whether this is related to property owners’ aversion to regulatory restrictions or to what degree the effect would persist over time. At present, there is little explanation as to the rationale for these differences in impact on property values, including variables to explain why some residents value trees and others prefer open space.
Researchers have also largely ignored the potential negative implications of increased property values, such as higher property tax rates and socioeconomic inequality. Crompton (2005) notes that appreciation of property

50
values may be unwelcome to those whose taxes increase or who, over time, become unable to afford to buy or rent property within certain neighbourhoods. Perkins et al. (2002) observe that trees are an important resource in the context of urbanization and quality of life and that unequal distribution of trees by urban forestry programs (e.g. planting on owner-‐occupied properties through the Greening Milwaukee program) can reinforce existing inequalities. Further research is required to identify equity-‐related issues and solutions.
Previous research provides a measure of the value of parks; recently, researchers have begun to employ cost-‐benefit analysis approaches (e.g. Peper et al. 2007) to build a case for investment in urban forests and parks by municipal officials who have traditionally focused on the costs of such amenities, rather than their multitude of benefits (Crompton 2005). According to Crompton (2005), future research is needed to strengthen existing cost-‐benefit analysis approaches for urban trees and forests to capture sensitivities to levels of maintenance, age and maturation of the trees or forest, influence of supply and demand, and type of use. The National Research Plan for Urban Forestry 2005-‐2015 echoes this call for better understanding of the benefits provided by urban forests, including their associated economic impact, cost/benefit ratios and other factors (Clark et al. 2007). Level of maintenance may influence the value generated by a forest, with higher levels of maintenance required in some areas or for some species. The benefit of a park may not accrue for several years after trees are planted, before they reach a stage of growth that offers adequate shade or aesthetic quality. In municipalities where the supply of urban trees and forest areas is greater, price premiums for properties may not be as great; more modest premiums may also occur for properties next to intensively used recreational forests.
Zhu and Zhang (2008) state that no data are currently available on the relative shares of public and private trees within US cities. This was identified as a potential area of future research to identify the effect of substitution and the effect on demand for urban forests. This type of research may be of interest to municipalities that are considering investing in urban forestry policies and strategies in order to identify the relative costs and benefits of investment, the potential effect of urban forests on their respective tax bases, and the potential implications of such investments on socioeconomic status of local residents.
4.3.2 Community economic development
Attractiveness, design and other aesthetic elements of the urban environment have become the focus of branding and marketing in many urban areas (Philo and Kearnes 1993; Holcomb 1994). The report of the Urban Task Force (Rogers 1999) suggested that an attractive, well-‐designed urban environment can serve as a catalyst for the pre-‐conditions for economic growth. Swedish economist Nils Lundgren was once quoted as claiming that a good urban environment is an important argument for regions when trying to attract a highly qualified workforce (Boland and Hunhammar 1999).
Current status
Central business districts have historically formed centres of economic activity in urban neighbourhoods and smaller cities; however, these areas now face stiff competition from big-‐box stores, power centres, mega-‐malls, and online shopping. Industry Canada (2005) reports that Canadian-‐based retailers are responding by transforming themselves, but that in some sectors, locally-‐based independent retailers have closed up shop.

51
Local business associations are seeking ways to revitalize central business districts and compete for customers based on the quality of the shopping experience, rather than on the price or accessibility of products (Wolf 2003; Wolf 2005; Gasca 2013). However, tree programs tend to be a low priority for merchants that are struggling to keep business afloat (Wolf 2003). Trees provide few, if any, direct financial returns on investment but instead generate indirect benefits that are important but difficult to assess (Wolf 2003). Wolf (2009) highlights the importance of educating retailers, who can be very influential over local government decision makers, about the indirect and long-‐term benefits of a quality urban forest.
Whitehead (2002) has explored the ways in which improvements in the quality of an urban environment (e.g. public transit accessibility, aesthetic image) can influence the location of local businesses, but only a handful of studies have looked specifically at the role of treed urban landscapes in a business context. Customer surveys have demonstrated higher ratings of visual quality, amenity and maintenance where trees are present (Wolf 2009). Products and merchants were judged more positively in forested places in terms of product value, product quality and merchant responsiveness (Wolf 2005, 2009). Studies conducted in retail areas have found that consumers are willing to pay approximately 11 percent more, on average, for products in downtown shopping areas with trees, compared to areas without trees, and are willing pay more for parking on streets with trees (Wolf 2005, 2009). Average willingness to pay for equivalent goods and services differed between small cities (+9 percent) and large cities (+12 percent) (Wolf 2005).
Customers in places with trees also report perceptions of better service, greater merchant helpfulness and higher product quality (Crompton 2001). Thus, consumers’ experiences begin to be shaped before even entering a store. They also reported greater expectation of patronage to stores in places with trees and are willing to travel more frequently, for longer durations and over greater distances to spend more time in a retail district that has trees (Wolf 2009). More time spent in a retail location could translate into greater total spending. Interestingly, Wolf (2004) uncovered a discrepancy between the perspectives of customers and merchants in terms of their preference for trees: while trees were highly preferred by both groups, business people expressed slightly lower liking for images containing trees. Business people rated their perceived benefits of trees significantly lower than shoppers.
Preference for treed streetscapes appears to be relatively consistent across demographic traits, proximity to home and levels of familiarity with the district; however, people in their 30s rated the least vegetated category as less appealing than both younger and older people (Wolf 2004). Survey participants who worked in the district rated images with no trees lower than other people, suggesting that employee satisfaction may be sensitive to the presence of trees (Wolf 2004). Consumers who self-‐identified as having minimalist shopping tendencies rated the visual quality of treed streetscapes lower than other people, indicating that their decisions are shaped by other factors (e.g. cost) (Wolf 2004).
Researchers recommend a district-‐wide urban forestry improvement program, rather than a piecemeal approach based on voluntary adoption by individual property owners, to attain an attractive visual aesthetic for consumers (Wolf 2005). A district or municipal approach is recommended to address issues associated with urban growing conditions (e.g. limited root and canopy volumes, compacted and low nutrient soils, water stress, interactions with utilities) that present challenges to urban forest management (Wolf 2005). Furthermore, this approach can produce a contiguous canopy and contribute to a sense of place for shoppers

52
using plant selections that create a “brand” for the district using a blend of texture, color and plant massing (Wolf 2009).
Cost presents a barrier to municipalities that wish to explore urban forest management for the purpose of economic development. Urban trees demand ongoing municipal investment in personnel, equipment and fuel to support maintenance, necessitating a strong business case for such investments (Escobedo and Seitz 2015). Across the US, maintenance of urban trees is estimated to cost municipalities between USD$12.87 and USD$65 per tree (McPherson et al. 2005). Municipalities may be convinced to invest in urban forests based on prospective increases in property tax revenue or reduced infrastructure costs. TD Economics (2014) reported results of a study from New York City, in which it was reported that having trees on, or near, a property could generate an additional US$90 in annual property taxes.4 The City of Toronto (2013) reports that properly-‐maintained trees in urban environments can help support and extend the life of grey infrastructure (e.g. sidewalks and roads), with implications for the cost of municipal infrastructure investments.
Many studies in this area tend to use qualitative, preference-‐based surveys that assess aspects such as perceptions of visual quality and place, patronage behaviour, product pricing and demographics (e.g. Wolf 2003, 2004, 2005, 2009). Descriptive statistics are collected and subject to factor analysis. Multivariate analysis (Wolf 2004) and models such as DELTA (Simmonds 1999, 2001; Whitehead et al. 2006) have been used to relate psychological notions of urban quality and decisions of actors within a system (e.g. regarding business location). Only a few studies (e.g. Wolf 2005) have used contingent valuation to identify consumers’ willingness to pay for goods and services sold in urban retail locations that feature trees.
Gaps and future research
Anecdotal evidence suggests that quality of urban life and recreational amenities, such as parks, can influence business investment decisions. For example, it is reported that a May 2001 decision by Boeing Co. to locate its new corporate headquarters in Chicago, Illinois was shaped, in part, by the city’s relatively higher quality of life (Cox 2001; Michaels 2002; Sherer 2006). The decision prompted officials from the City of Dallas, Texas, one of the competitors in the Boeing deal, to revitalize its downtown core; a plan which included expanding availability of parks and open spaces. However, preferences are shaped by social and cultural norms, suggesting a gap in the research: in an increasingly globalized economy, foreign companies may be attracted or repelled by the presence of urban forests. Furthermore, some characteristics of urban forests may be more or less desirable to high-‐ranking corporate representatives who are responsible for decisions regarding location or re-‐location of offices.
While several authors have made similar descriptive and anecdotal claims about the importance of urban quality (Urban Design Alliance and Institution of Civil Engineers 2001; Joseph Rowntree Foundation 2001), there is little published, quantitative information about the economic value of urban trees in the context of retail, commercial or institutional properties or business performance (e.g. prices, revenue and customer and employee satisfaction). Whitehead et al. (2006) attributes this lack of data to two factors: the difficulty of gathering reliable information on property attributes, market responses and willingness to pay and the
4 It is worth noting that the laws of supply and demand could be expected to influence the absolute value of any increase in property taxes, with more modest increases in areas where urban forest supply is already moderate or high.

53
confidential nature of such information where it has been collected. Any such studies are likely completed privately for real estate management corporations (e.g. hedonic studies on retail rents for the Eaton Corporation in North America that were described, but not reported, by Des Rosiers 2002). This type of research could help to characterize the relationship between urban forests (and urban forest characteristics) and economic development. A comparison of “Livability” Index rankings and urban forest cover could provide a first step in this research direction.
Retail research about “atmospherics” (e.g. interior qualities of retail spaces such as light, sound, colour and product placement) and their influence on reactions and behaviours is largely limited to store interiors (Turley and Milliman 2000). Wolf (2009) asserts that outdoor conditions deserve greater attention because they can create initial consumer impressions (favourable or negative) that influence shopping behaviour and spending patterns.
McLean et al. (2007) assert that the field of urban forestry could benefit from further qualitative research to deepen the current focus on economic and ecological costs and benefits. They propose further research to examine what factors cause people to be more (or less) willing to pay to rent buildings that have good quality landscaping and what types of landscaping are most valued by prospective tenants.
Florida (2005) describes sweeping changes that are transforming the way we think of cities. He describes a new economy that is based on desired human capital that includes highly educated and creative occupations, referred to as the “Creative Class” (Florida 2002; Gabe 2006). These creative people are at a premium because they drive the economy: their ideas create wealth (Florida 2002). Findings from Gabe (2007) at the county level corroborate this claim: a 10 percent increase in the creativity score lead to 12 percent higher average earnings.5 The Creative Class has doubled in size since 1980 and now makes up an estimated thirty percent of the United States workforce. Creativity is claimed to be a highly prized commodity that “is now the decisive source of competitive advantage” for local economies (Florida 2002; Lovett and Beesley 2014).
Sociologists are examining the role of cities as centres for experience, lifestyle, amenities, entertainment and creativity. Florida (2005) points to examples of San Francisco, Seattle, Boston and Chicago. Based on this trend, he suggests that further research is needed to identify the factors that attract and motivate creative people in cities and urban workplaces. While previous research has demonstrated a relationship between urban leaf area and urban quality of life, median income, and median housing value (Jensen et al. 2004), further research is required to characterize the direction of causality and evaluate the potential relationship with variables that attract the Creative Class. Building on recent studies that explore the influence of office design and flexible schedules on organizational behaviour and productivity, it may be valuable to investigate the role urban trees and forests have in attracting, retaining and nurturing a creative workforce.
To date, the majority of the research conducted on the relationship between urban trees or forests and economic development has been conducted by just one researcher: Dr. Katherine L. Wolf, from the University of Washington. The lack of attention paid to this topic by other researchers presents an opportunity for emerging scholars to carve out a niche in this area.
5 Interestingly, the positive effect held only for metropolitan counties; in non-‐metropolitan counties, creativity showed a negative effect on earnings. Since urban are the focus of this literature review, this effect is beyond the current scope.

54
Interest in sustainability is growing among local governments across Canada (Wolf 2014). With several cities are already implementing urban forest plans and strategies (e.g. Vancouver, Prince George, Kamloops, London, Oakville, Brampton, St. John’s), there will be a need to demonstrate the business case for investment in such policies over the long term. Quantitative research will be required to identify the economic benefits to municipalities (e.g. branding, marketing), business associations (e.g. Chambers of Commerce, Business Improvement Associations) and business owners in order to build support for urban forest investments and justify the costs of ongoing planting and maintenance.
4.3.3 Recreation and tourism
Urban green spaces are an important source of recreational opportunities (Jim and Chen 2006) for both residents and visitors from outside the region, i.e. tourists. While the recreational activities themselves may be similar for residents and tourists, they bear different implications for the local economy: expenditure by residents generates an induced effect on the tourism industry, while tourism expenditure can be considered an export of goods and services resulting in direct economic impact (Hotte and Sumaila 2012). Of the two, only tourism produces a net gain or loss in the local economy, while recreation by residents results in a transfer of revenue within the city but no associated gain or loss. However, avoided losses may be considered an economic benefit if residents choose to recreate within their own region rather than travelling elsewhere.
Cities can be stressful environments for citizens (Boland and Hunhammar 1999). The recreational, aesthetic and cultural aspects of urban green spaces, which offer opportunities to play and rest, may well be the highest-‐valued ecosystem service in cities (Boland and Hunhammar 1999). Botkin and Beveridge (1997) argue that vegetation is essential to achieving the high quality of life of a great city. In Canada, evidence of this is provided by the City of Vancouver. Ranked by The Economist as one of the world’s Most Livable Cities (Economist Intelligence Unit 2012), Vancouver also has the world’s Best Urban Park (Tripadvisor 2014). In 2006, when a wind storm transformed many of the park’s standing trees to large woody debris, the residents put forward CAD$10 million dollars in private donations to restore the park, despite the fact that the market value of the damaged trees was only CAD$1 million (Robbins et al. 2009).
Many urban and non-‐urban tourism industries depend on the quality of the natural environment to attract visitors. Tourism is one of the major drivers of urban economies (Majumdar et al. 2011). Urban forests attract tourists by enhancing the beauty of cities and complementing other urban attractions (Ashworth 2004; Deng et al. 2010). Consider the attraction of Central Park, an urban forest located in the heart of New York City, which receives some 40 million visitors each year.6 Vancouver’s Stanley Park attracts approximately eight million visitors each year;7 a number nearly 14 times the city’s population of 603,502 (Statistics Canada 2012).
Current status
Jim and Chen (2006) found that residents and family members in Guangzhou city, south China, actively used urban green spaces. Parks were the most popular locations, with visitation influenced by accessibility, amount of green coverage and quality of the ambience. Small and low-‐quality sites, even if located near residences,
6 See the Central Park visitors’ website: http://www.centralpark.com/guide/faq.html 7 Tourism Vancouver website: http://www.tourismvancouver.com/do/explore/stanley-‐park-‐complete-‐guide/

55
were underutilized. Because residents of the densely-‐populated city are accustomed to paying entrance fees to access green spaces, approximately 96 percent of survey respondents (i.e. notably more than other cities) expressed willingness-‐to-‐pay to access these locations. Average willingness-‐to-‐pay was RMB17.40 (approx. USD$2.10) per person per month, which was higher than the set entrance fee rate. Willingness-‐to-‐pay was positively related to income and urban green spaces may be characterized as superior goods (i.e. share of expenditure increases with rising income). The aggregate value of urban green spaces was estimated at RMB547 million per year; six times the city’s annual expenditure on green spaces.
A study conducted in Savannah, Georgia estimated the mean and median values of visits by tourists to urban forests at USD$11.25 and USD$2.10, respectively, per person per visit, resulting in a total annual value of urban forests to tourists of USD$81 million (mean) or $11.55 million (median), assuming at that least 50 percent of the tourists would pay the median amount (Majumdar et al. 2011). Individual willingness-‐to-‐pay for visits to urban forests was found to increase with tourists’ level of graduate school education, income and destination loyalty (i.e. number of previous visits) (Majumdar et al. 2011).
Urban forest-‐related festivals and events can also contribute to local economic activity. A study by Arano and Deng (2012) found that the Cherry Blossom Festival in Washington, D.C. generated USD$98.5 million in direct economic output. When indirect and induced economic effects of the event were also considered, the event accounted for USD$135.81 million in output.
The direct and indirect economic benefits of urban forests can be assessed using direct market valuation techniques (e.g. market price-‐based approaches, cost-‐based approaches, production function-‐based approaches), revealed preference techniques (e.g. travel cost method, hedonic pricing method) or stated preference techniques (e.g. contingent valuation methods, conjoint analysis methods such as contingent ranking and choice experiments) (Konijnendijk 2007; TEEB 2010).
Market price-‐based approaches use the price of a good or service (e.g. entry or parking fee for an urban forest area) multiplied by the marginal product of that good or service to estimate its value (TEEB 2010). Since price data may be readily available for some tourism and recreational activities, this approach can be employed at relatively low cost and may be less time-‐intensive than other valuation methods. Caution must be employed where markets are distorted (e.g. by subsidies, policy, or lack of competition) because prices will not accurately reflect preferences and marginal costs (TEEB 2010).
Revealed preference techniques utilize observations of individual choices in existing markets to infer willingness to pay for a particular good or service (TEEB 2010). The travel cost method, which is frequently used to estimate recreational value, is based on the rationale that recreational experiences carry an associated cost (i.e. direct expenses, opportunity costs of time). The value of a change in the quality or quantity of a recreational opportunity is inferred using the demand function for visiting the site (Bateman et al. 2002; Moons 2002; Kontoleon and Pascual 2007). Revealed preference methods offer the advantage of drawing results based on actual and observed behaviour; however, estimated values are strongly influenced by the variables (Moons 2002) and technical assumptions used by the researchers (Kontoleon and Pascual 2007). This type of analysis is complex and requires large volumes of good quality data, making it expensive and time-‐consuming (TEEB 2010).

56
Contingent valuation is the most widely used stated preference method for valuing environmental assets (Tyrväinen 2001) such as urban forests and green space. It is used to estimate the value of an environmental asset by using questionnaires to collect information about people’s individual willingness-‐to-‐pay (WTP) for some change in the provision of the asset or the minimum compensation that they would demand for its loss (Carson, 1991; Mitchell and Carson 1993; Bolund and Hunhammar 1999; Tyrväinen and Miettinen 2000; Tyrväinen 2001; Jim and Chen 2006; Lo and Jim 2010). One pitfall of this approach is the need for careful survey design and selection of variables (Carson 1991; Mitchell and Carson 1993; Arrow et al. 1993; Tyrväinen 2001). Different approaches may generate divergent results (Jim and Chen 2006).
Contingent valuation has not been applied as widely in China as it has in other countries, partly because public opinion was not factored into decision making during the era of centralized government control (Xu et al. 2003; Jim and Chen 2006). Chinese officials have tended to rely on benefit transfer methods for valuation (State Forestry Administration, P. R. China 2005; Xie et al. 2010). Lo and Jim (2010) was reported to be the first contingent valuation study completed on an environmental topic in Hong Kong.
Gaps and future research
In some countries where demand has grown for urban forests to provide recreation and tourism opportunities, forests are now being re-‐created or enhanced (Simpson et al. 2008). Andrada and Deng (2012) reported that tourists in Washington express preferences for plant and color variety, planting pattern and manner of growth (Andrada and Deng 2010). However, there appears to be a gap in the literature regarding the characteristics of urban forests that generate the highest valued recreation and tourism opportunities and the relative costs and benefits of urban forests, by forest type. This type of information could be used to guide investments in urban forests to maximize economic returns.
Jim and Chen (2006) report that cost-‐benefit analysis of recreation and tourism opportunities associated with urban forests can help to justify allocation of more government resources for their development and management and produce spinoff benefits in terms of urban sustainability. Simpson et al. (2008) also note that, while some North American studies have been conducted regarding the use of forests for recreation, the topic has received relatively little attention within Europe, despite growing interest on the part of the public in health and quality of life. The lack of information regarding the costs and benefits of recreation and tourism has reportedly presented challenges to implementing legislative and policy changes that support forest conservation and enhancement. Additional research could help to meet this need for support.
Land use in urban areas is highly competitive (Deng et al. 2010). Population growth and urban development are imposing ever-‐greater pressure on green and forested spaces in cities around the world (Majumdar et al. 2011). Conversion of forested areas to residential or commercial land use is occurring where the total economic value of urban forests is not being captured in land-‐use planning and property development (Tyrväinen 2001). Urban land use conversion contributes to the gradual degradation of the environment and quality of life and results on the loss of non-‐market benefits (Ode and Fry 2002; Pauleit et al. 2005).
Wang (2013) postulates that, as the number of wealthy, urban dwellers in Canada increases, so too will their demand for greater opportunities for forest recreational opportunities, resulting in higher values being placed on urban and peri-‐urban forests. This belief appears to be supported by evidence from Hong Kong that found

57
approximately 70 percent of those surveyed visited urban green spaces at least once per week (Lo and Jim 2010). Survey participants reported an average willingness to pay of HK$77.43 (approx. USD$9.90) per month per household for five years to prevent a 20 percent reduction in green space (Lo and Jim 2010). China has experienced rapid economic and social change in recent years and could provide evidence of socio-‐economic influence on changes in perception of the value of urban forests.
A planning framework for urban municipalities could be developed to appropriately consider and weight the relative costs and benefits of urban land use options (e.g. forest, commercial, residential). This framework could be used to prioritize areas for re-‐zoning and ensure that the highest-‐valued urban forest areas are conserved for recreation and tourism. Trees bear an associated opportunity cost in terms of land that they occupy and the cost of public funds for planting and maintenance (Zhu and Zhang 2008). Therefore, municipalities face trade offs in allocation of their fiscal budgets between planting trees and other alternative investments. Municipalities could implement strategies to capture the tourism benefits of urban forests in order to offset their maintenance costs (e.g. planting, pruning, mowing). Options could include collecting fees through coin-‐operated gates in forest areas or conducting spot checks of tickets from self-‐service machines (Majumdar et al. 2011). These options could help to capture some of the consumer surplus that is enjoyed by residents and tourists; however, the political palatability of such schemes would be strongly influenced by residents’ and tourists’ expectations about access to public lands. The City of Vancouver currently captures economic rent generated in Stanley Park using year-‐round pay parking throughout the Park. Passes are sold by the hour, day, season or year.8 Rates increase from CAD$2.25 per hour and CAD$6 per day in the off-‐season to CAD$3.25 per hour and CAD$11 per day during peak season.
The influence of changing urban demographics and ethnic profiles in cities also merits further research in terms of the implications for valued aspects of urban forests. Research has shown that outdoor recreational preferences, motivation and use differs between cultural and ethnic groups (Walker 2001; Johnson et al. 2004; Jay and Schraml 2009; Jay and Schraml 2014). Knowledge about the use, needs and values of urban forests for outdoor recreation among different groups can help to shape the decisions of managers, planners and policy-‐makers and meet the changing needs of the urban populous. In the absence of this information, managers may tend to rely on their own preferences when identifying important characteristics of urban forests and neglect the needs of other cultural groups. This field of research could be extended to identify ways to encourage the use of urban forests for recreation and tourism (e.g. Eriksson and Nordlund 2013).
Fialova (2010) identified several silvicultural techniques that could be used to attract recreational users to an urban forest (e.g. selection thinning and selection felling; leaving reserved or seed trees; creating shelterwood elements, stand and forest margins; and gradual and irregular transitions between stands). Additional quantitative research could be used to substantiate Fialova’s research by identifying willingness-‐to-‐pay for recreational opportunities in forests under different silvicultural regimes.
Demographic characteristics and destination loyalty appear to significantly influence tourists’ perceived value and WTP for urban forests. Results indicate a positive relationship between WTP among tourists and their level of education (i.e. graduate school), income and previous number of visits to a location (Majumdar et al. 2011).
8 For details, see: http://vancouver.ca/parks-‐recreation-‐culture/stanley-‐park-‐parking.aspx

58
For example, loyal tourists appear willing to pay more for urban forests than first-‐time visitors; however, both types of visitors are important contributors to a city’s tourism industry (Majumdar et al. 2011). Market research is needed to identify strategies to retain repeat visitors and increase overall WTP for urban forests. The income effect on WTP is corroborated by several studies (Zhu and Zang 2008).
59
5 DISCUSSION: IMPLICATIONS FOR URBAN FORESTRY IN
CANADA Canada’s urban forests provide its citizens with a range of benefits, as discussed above. This section identifies key opportunities and priorities for future research and analysis of urban forest benefits and costs in Canada. In order to maximize those benefits relative to costs, urban forest managers need to weigh them in urban forest management planning and implementation. Valuing urban forest benefits is an important step in this process and there is a range of tools and methods available for this purpose (summarized below). Finally, we draw out key implications for policy making, collaboration and knowledge transfer on urban forest planning and management.
5.1 Key findings and gaps
Based on the literature review documented in this report, a number of key conclusions emerge:
There is a considerable literature available that documents and/or estimates the value of urban forests and urban forestry (Table 5). However, the literature is widely dispersed across kinds of value, metrics of value, geographic context, and type of urban forests being considered. There is a need for more synthetic and aggregated studies, with consistent evaluation across a standard range of dimensions and metrics (both economic metrics and other kinds of quantification)
There are many values considered in the literature that go beyond those evaluated in the few comprehensive assessments conducted for Canadian cities (notably the TD Bank reports); presumably this means that the economic benefits of urban forests may be significantly higher than those estimated to date.
There is a strong need for systematic information at the local and national scales to support planning, baselines and inventory in urban forest management, particularly in the space between management and theoretical research.
There are some dimensions of urban forests, in more mature areas of research, for which economic data are already available (e.g. property values, energy use, stormwater management, certain recreation and tourism revenues, savings in certain hospital stays). There are also other rapidly emerging fields (e.g. wellbeing, cultural ecosystem services, encouraging green commuting, etc.) where little economic data are available so far and a considerable need exists for further economic evaluations.
Many evaluations do not fully reflect the economic costs of urban forests or the negative impacts of urban trees.
There are relatively few robust findings on future projected values, beyond i-‐Tree modelled estimates, which require various caveats in their interpretation. This is particularly true of projections that

60
consider climate change impacts and responses, which are likely to be substantial influences on urban forest health, productivity and costs in the future. This represents a major research deficiency, in light of other trends such as the decline of forest health from pests and losses of trees to densification/intensification of cities in Canada and elsewhere. Reversing these trends and establishing an expanded and healthy canopy in cities will be key to offsetting worsening heat impacts of climate change on vulnerable urban populations.
We found relatively few studies that assessed the effectiveness of monitoring programs, incentive schemes, policies and governance structures for urban forestry at the municipal scale.

61
Table 7. Summary of urban forest ecosystem services, metrics and key findings.
Ecosystem services (Costanza et al. 1997) and other benefits Metric
Monetary value? Key findings
Gas regulation Decreased ozone, particulate matter, nitrogen dioxide, sulphur dioxide and carbon monoxide
ü Air quality improvements from urban trees across the US produced an estimated annual benefit of USD$3.8 billion in 2006.
Climate regulation
Lower energy consumption
ü Trees to the south of buildings decrease summertime energy use without increasing wintertime energy use.
Tonnes of carbon sequestered annually, total carbon stored
ü Value of carbon sequestration estimated at USD$460 million/year; total value of carbon storage estimated at USD$14.3 billion in 2002.
Disturbance regulation
Lower damage and healthcare costs, following extreme weather events
Climate change adaptation requires strengthening the existing urban forest resources and taking targeted actions to increase benefits, such as cooling effects. The local value of adaptation benefits will depend on local climate change impacts and local economic context.
Water supply Lower infrastructure costs
ü Economic benefit of rainfall interception can be high, depending on the local cost of runoff reductions using other methods.
Refugia Greater species diversity and habitat connectivity
Urban forest connectivity is key to maintaining biodiversity and densification may provide connectivity challenges.
Food production
Increased local food production
Benefits include increased food security, connection with nature. Clear opportunities for economic and non-‐economic evaluations of benefits and costs.
Raw materials Lower energy costs and reduced carbon emissions
Potential uses include bio-‐based heat, timber/artisan products. Clear opportunities for economic evaluations of benefits and costs including avoided costs due to their diversion away from the waste stream.
Recreation Greater longevity and lower BMI
Recreation in green spaces increases seniors' longevity and reduces childhood obesity.
Tourist expenditure ü Estimated annual values of visits by tourists to urban forests in Georgia at USD$81 million (mean) or USD$11.55 million (median). Urban forest festivals can also generate revenue, estimated at USD$135.81 million in one case.

62
Ecosystem services (Costanza et al. 1997) and other benefits Metric
Monetary value? Key findings
Greater longevity ü Air quality improvements from urban trees could extend people’s lives, decrease mortality due to air pollution and reduce the chances of allergic reactions to pollen; estimated economic benefit of CAD$76 billion to CAD$1.2 trillion in China. Opportunities for future research on contribution of trees to these benefits.
Culture and Health
Lower noise levels and improved soundscape qualities
Wide bands of trees may reduce noise pollution and trees can improve urban soundscape.
Lower stress levels and fewer headaches
87 percent reduction in stress and 52 percent reduction in headaches after a park visit.
Lower measures of stress markers
Exercising in a forest environment can reduce salivary amylase by 18.8 percent and lower heart rates, blood pressure and sympathetic nervous activity.
Positive birth outcomes
Increased canopy cover correlated with positive birth outcomes.
Faster hospital recovery times, fewer employee ailments
ü Recovery times in hospitals were 8.5 percent faster when patients had a view of nature: estimated annual savings of USD$93 million. Employees with a view of nature at work reported fewer ailments and had lower absenteeism: estimated annual savings of USD$2,000 per employee.
Lower rates of depression and prescription drug use; higher "life satisfaction"
Depression rates and anti-‐depressant prescription use are negatively correlated with green space availability.
Lower cost of medication
ü Estimated annual savings of USD$228 million on ADHD medication in the US if children can walk in a park during the day.
Higher self-‐reported well being
ü Green space visitors reported higher levels of restorative benefits when visiting green spaces with high species richness.
Improved health outcomes among low income groups
Urban greenery abundance is positively associated with property values, socioeconomic status, education, age of housing stock. Health benefits of urban greenery are more pronounced in lower socioeconomic groups.

63
Ecosystem services (Costanza et al. 1997) and other benefits Metric
Monetary value? Key findings
Increased community cohesion, lower crime rates
ü Social housing projects with green space have decreased crime rates. Estimated savings to corrections departments of USD$162,000 if housing projects included an access to nature.
Local Economy Higher sale price for retail goods
ü Customers rate businesses in treed environments more favourably. Consumers are willing to pay 11 percent more for products in shopping areas with trees and more for parking on streets with trees. Merchants don't like treed environments.
Higher sale price for residential properties
ü Presence of trees on property increases property values by about 7 percent and increases rental rates. Costs of maintenance vary by context. Homes adjacent to parks are appraised 8-‐20 percent higher.
Higher property tax revenue
ü Trees on or near a property can generate an additional USD$90/year in property taxes. Well-‐maintained trees can extend the life of grey infrastructure.
A comparison of various studies on the balance of benefits and costs of urban forests indicates that total benefits generally outweigh total costs of their management and care, leading to overall net benefits. However, a comparison of costs from different studies becomes difficult because standardized calculations and assumptions do not exist. The concept of ecosystem disservices also affects cost-‐benefit analysis. Ecosystem disservices are perceived as negative to human well-‐being, based on anthropogenic notions which place human needs and values at the center of biodiversity management (McCauley 2006). Lyytimäki et al. (2009) cautions that the full cost of nuisances, such as leaf litter, aphid honeydew and heaved sidewalks from tree roots, require adequate attention during the cost and benefit comparisons.
There are a limited number of studies in Canada on eliciting the public’s values on urban forestry (Fraser and Kenney 2000; McFarlane et al. 2011; Peckham et al. 2013; Sinclair et al. 2014). This means that we know relatively little scientifically about how the mosaic of many different Canadian publics think about urban forestry, or what they know. It does appear that citizens often primarily value urban forests for social values, such as aesthetics and psychological benefits (Peckham et al. 2013), rather than the environmental or economic values that are more commonly quantified in the existing literature and urban forest management plans. Few studies have evaluated the extent and effectiveness of community engagement approaches (Beckley et al. 2006); thus, there is little consistent guidance on how to best to engage and inform communities on the care of urban forests, or on the emerging role of citizen science in monitoring and managing public and private trees (Janse and Konijnendijk 2007; Neighbourwoods 2015).

64
5.1.1 Urban forest evaluation tools
Urban forest evaluation tools tend to focus on forest structure and “regulating” ecosystem services: services provided by urban forests that regulate the urban environment, such as microclimate modification. These services are largely determined by urban forest structure and function. They are more clearly measureable and are the focus of the i-‐Tree suite of tools. A review of the urban forestry literature on costs, benefits and cost-‐benefit ratios reveals a number of valuation methodologies in use. These studies show that cost and benefits data are regionally or locally specific and heavily influenced by factors such as local economic conditions and infrastructure investment (Roy et al. 2012).
Research into the balance of the benefits and costs of urban forests indicates that the benefits urban forests confer generally outweigh the costs of their management and care. Lyytimäki et al. (2009) states that this may be an unbalanced way of approaching urban forest management and cautions that the full cost of nuisances, such as leaf litter, aphid honeydew and heaved sidewalks from tree roots, to name a few require adequate attention during the costs and benefit comparisons. Ordóñez (2013) reviewed 14 Canadian Urban Forest Management Plans within the last decade and discovered that current urban forest management practices and policies focus on single tree maintenance and planting-‐oriented programmes, suggesting a lack of other ecological, social and considerations. Room for the development of more inclusive best management practices is needed.
i-‐Tree is the most comprehensive suite of urban forest assessment tools available. It is the most widely used, because it combines data acquisition techniques with a methodology to apply these data to decision making and is easily accessible to users of various backgrounds. It offers a wide range of free urban forest assessment tools.
i-‐Tree is an evolving suite of tools that will likely develop in the coming years as more users share their experiences and as our understanding of urban forest values, such as cultural values, grows. As the i-‐Tree tools continue to be used and developed, some existing gaps and limitations will likely be minimized. Current limitations include a modelling methodology that focuses on the US, difficulty acquiring the necessary data for analysis and little to no coverage for urban forest benefits that fall outside of the regulating ecosystem services. In addition, data sources, conversion equations and algorithms used to fit the growth/biomass equations to drive the valuation process are often difficult to source. When criteria, such as hardiness zone ratings, region, species, sample sizes and local climatic data, are not transparent, it becomes difficult for users, especially non-‐experts, to judge the applicability of the tool for a specific purpose or project. A wide gap exists between the ‘grey literature’ (e.g. website-‐level information) and highly detailed scientific literature. The i-‐Tree website9 provides the best comprehensive listing of the literature supporting the different tools, although ascertaining the applicability of the information for the Canadian context proved difficult despite investigation. Findlay (2013) discovered that adopting i-‐Tree Eco to New Zealand required the involvement of the USDA Forest Service to upgrade the software before it could be used with accuracy. i-‐Tree has been adapted in the UK, for example, and is increasingly used there. There is however a need for more consistent evaluations of the utility of i-‐Tree in practice, particularly as applied in Canada’s forests and climatic conditions.
9 See: http://www.itreetools.org/resources/archives.php

65
There is a range of alternative or additional urban forest assessment tools that can help address the limitations of the i-‐Tree system. These range from high-‐quality, expensive data acquisition options such as LiDAR, to lower-‐quality sources such as Google Earth, and include decision-‐support tools for a range of applications. A key limitation to urban forest assessment is often data acquisition. The use of new innovative measurement and visualization tools such as smart phones, smart hydro meters and interactive real time gamification platforms may lead to advances in this area. As low-‐cost, easily accessible data sources develop and become more accurate and available, the potential for robust urban forest management based on scientific evidence will increase in Canada.
5.1.2 Urban forest benefits
Over the past 50 years, researchers have come a long way in valuing urban forest benefits such as reduced energy use, improved air quality and increased property values (Payne and Strom 1975; Morales 1980; Anderson and Cordell 1985; Anderson and Cordell 1988; Schroeder 1989; McPherson et al. 1997; Nowak et al. 2006). In recent years, researchers have also begun to develop reliable estimates of the value of carbon sequestration and storage by urban trees ( Nowak and Crane 2002; Myeong et al. 2006). Valuations to date have shown that urban forests and the services they provide are extremely valuable to our societies locally, regionally and nationally. However, the range of urban forest benefits is extensive and many benefits are extremely difficult to measure, particularly in economic terms. Research on urban forests and climate change adaptation; cultural services; urban forest products; physical, psychological and social health benefits; equitable access to urban forests; and community economic development is growing. Researchers are beginning to evaluate the value of these benefits, often in multiple ways. These topics are fundamentally important to human and societal well being and represent major contributions of urban forests to our daily lives. Valuation methods that help make these urban forest benefits more tangible and facilitate their inclusion in urban forest planning and management would be of great value to urban forest managers in Canada. These valuations, as shown by the TD Bank studies ( Alexander and DePratto 2014; Alexander and McDonald 2014), can also help convince citizens, businesses and elected officials of the importance of urban forests to the economic, social end ecological interests of Canadian communities. In the context of Canada’s existing strengths in forest management and science, the country could become an international leader in the growing field of urban forestry.
Key findings and highlights from the literature review are summarized in Table 5, which identifies values monetized in some way. A review of our findings highlights key gaps in our understanding of urban forest benefits. Our understanding of cultural values and social health appears to be particularly limited, as is our understanding of green equity and its influence on societal well being. While we have a somewhat better understanding of how urban forests contribute to climate change adaptation, urban forest products, physical and mental health and community economic development, we have not yet established reliable, consistent and easily-‐understandable metrics by which to evaluate urban forest contributions in these areas. Also absent from the literature is a comprehensive understanding of the cost implications of urban forests and particularly trade-‐offs between these costs and the benefits outlined in this report. Reviews have found that the benefits outweigh the costs of urban forests, though none were found for Canadian cities.

66
5.2 Future directions
Cities can be epicenters of economic and social development, creativity, innovation and political and cultural change. They are also sensitive to transformation by drivers of change such as urbanization; globalization, competition and trade; climate change; demographic shifts; technological advancement; government policies; and rising levels of community engagement. Aging of the population, increased immigration, urban population growth and new trade agreements such as the Trans-‐Pacific Partnership Agreement (TPPA) and Comprehensive Economic and Trade Agreement (CETA) are expected to continue to influence the growth and development of Canada’s urban centers, with implications for urban forest planning and management. This section explores the implications of these current trends and emerging needs, from the standpoint of Canadian institutions and government agencies. In particular, we focus on five key drivers of change acting upon Canada’s urban forests: urbanization, rising rates of chronic disease, shifting cultural identity, climate change and changing forms of community engagement.
5.2.1 Urbanization
Decreasing tax funding to Canadian municipalities (Federation of Canadian Municipalities (FCM) 2012) has increased pressures on municipalities to seek new sources of revenue for operations and to cut operating costs. Skyrocketing house prices in cities such as Toronto and Vancouver have heightened interest in property development.
A strong business case for urban forests is essential in order to compete with other land uses such as property development for residential, commercial, institutional and infrastructure purposes. Currently, there is a lack of peer-‐reviewed research regarding the many values of urban forests in Canada, the impact of urban forests on economic development and prosperity, and the social and cultural preferences of Canadians regarding urban forest planning and management. In alignment with its vision to optimize forest value and advance environmental leadership, CFS could adopt a broader approach that encompasses urban forest values and benefits, and supports urban forest management. This would require CFS to develop a strategy to support research about the value of urban forests in Canada that includes benefits and costs of urban forests as well as management strategies. Such information could be generated at various scales, with the intent to support planning and management at regional, municipal and possibly even neighbourhood levels.
A key component of this research will be the development of urban forest planning and management guidelines to address the needs of Canada’s changing socioeconomic landscape, including the needs of a diverse range of cultural groups. Abundant urban greenery is often associated with higher socioeconomic status (Heynen and Lindsey 2003; Landry and Chakraborty 2009), although the public health benefits of urban greenery appear to be greater in lower income groups (Vries et al. 2003; Mitchell and Popham 2007, 2008). Canadian municipalities will need to understand the causes of urban green inequity and work to ensure that all urban residents have sufficient and equitable access to urban greenery in their communities. Given that this is a national issue, with links to community well being, municipalities should be helped to become more aware of the importance of green equity and develop strategies for its promotion in their communities.
Refocusing the scale of urban landscape planning and management from individual trees (i.e. arboriculture) to urban forest systems and their associated green networks will be important in delivering large scale benefits

67
(e.g. downstream flood protection and offsetting urban heat islands) as well as providing useful information to Canadian municipal and regional decision makers. In order to effectively use urban forest assessment tools (e.g. i-‐Tree), users must have access to unique regional data regarding variables such as climate, physiography and location as well as algorithmic calculations for the estimation of benefits. CFS’s continued participation in research to generate these data can provide useful insights into the limitations, strengths and future direction for Canadian urban forest management. By supporting development of urban forest evaluation tools, CFS could help Canadian municipalities and regional districts to obtain science-‐based direction and ensure that urban forest management plans (UFMPs) and stewardship practices remain relevant to the social values (Ordóñez et al. 2013). Ongoing research can help to improve urban forest managers’ understanding of forest structure and function and the contribution of urban forests to ecosystem services such as carbon sequestration and storage, air pollution removal and energy savings (Nowak et al. 2006). Estimation of ecosystem services and disservices can include quantification of their monetary values for comparison to management costs in order to develop a business case for funding urban forest management.
5.2.2 Rising rates of chronic illness
As the Canadian population becomes increasingly urban, there is a growing need to examine the environments of cities to ensure that they support the health and well being of urban residents. As this document suggests, research connecting urban forests and human health is a relatively new and growing field. Little research to date has been specific to the Canadian context. Rates of chronic disease and deaths due to chronic disease, are rising each year in our country. According to Dr. Elmslie, Director General of the Centre for Chronic Disease Prevention (CCDP), of the Public Health Agency of Canada, the treatment of chronic disease costs the healthcare system CAD$68 billion annually and a further CAD$120 billion can be attributed to lost productivity (Elmslie 2010). At these levels, “health expenditures to treat chronic diseases are rising faster than our economic growth” (CCDPC 2010, p.12). With costs escalating at these rates, Canadians must work to find solutions that contribute to the prevention of chronic disease. Urban forests play a role in increasing the health and well being of residents in a variety of ways. Most of these contributions are in the realm of chronic disease reduction: increased physical activity of residents, improved mental health and better social health are all linked to the quality and quantity of urban green spaces.
Further research connecting urban forests with mental, physical and social health of Canadian communities is necessary. This research requires collaboration between various fields, including forestry, medicine and urban planning; CFS could be a networking partner in such research. Investment and actions that promote healthy urban forests that increase local residents’ well being require collaboration between all levels of government that may not currently work together. Responsibility and management costs for urban green spaces typically lie with the municipal authority, while health spending is under provincial and federal authority. Under the current system, the authorities making the investments do not recoup any financial savings in the health sector resulting from urban forestry investments. Evidence for and clarification of such relationships may be crucial in shifting policies to enhance fiscal responsibility and fair sharing of cost burdens.

68
5.2.3 Shifting cultural identity
As Canadian cities grow and change, Canada will need to ensure that our strong multicultural identity is reflected in our urban forests. Different cultures perceive and use our urban forests in different ways and our urban forests provide a range of cultural ecosystem services to urban residents (Fraser and Kenney 2000; Buijs et al. 2009; Chan et al. 2012). Canadian cities will need to find ways to quantify cultural ecosystem services to bring them into urban forest planning and management decisions and practice. CFS could help link researchers with practitioners and urban communities to facilitate discussions on how to define and measure cultural ecosystem services on the ground. Local communities should be a central part of defining and valuing cultural ecosystem services in local contexts. CFS could have a role building relationships between organizations and communities and developing tools to help residents document and communicate their experiences of cultural ecosystem services.
5.2.4 Climate change
Approximately 80 percent of Canadians live in urban communities of various sizes (McPherson et al. 2013) and many of these communities are increasingly vulnerable to the impacts of climate change (Revi et al. 2014). Urban forests already make an important contribution to creating liveable environments for their increasing urban populations and with future projections of climate change, healthy large-‐scale urban forests will be even more vital and valuable in helping urban communities adapt to negative impacts such as increasing heat waves and flooding. Much work needs to be done to develop regional guidelines for citizens and businesses to use urban trees for energy conservation and reduction of air-‐conditioning needs, in order to mitigate climate change and meet city greenhouse gas reduction targets. CFS could apply its expertise in climate change adaptation to the urban forest context and contribute to research that will improve urban forest managers’ understanding of how to select tree species for future climatic conditions and how trees can best support low-‐carbon, attractive and resilient communities (Sheppard et al. 2008).
5.2.5 Changing expectations for community engagement, governance and education
Cities are seeing an increasing demand for meaningful involvement and a public voice in decisions, as density increases and populations rise. Cities could see major benefits from this if citizens can be encouraged to help promote and maintain forest values, rather than ignoring or damaging them. The current trend towards community and stewardship group participation in urban forest management is, however, in part a reflection of dwindling government budgets (Satel 2005). The lack of available resources increases the difficulty that local governments face in spearheading long-‐term urban forest planning initiatives beyond routine operational and maintenance endeavors.
Other barriers and limitations in the practice and governance of urban forestry include the common fragmentation of disciplines and responsibilities into siloes, within the local governments tasked with managing most of Canada’s urban forests (Ordóñez and Duinker 2013; Baumeister 2014). It is not uncommon for municipalities to house urban forest planners, installation and maintenance staff in completely different units and for those with private land enforcement and communications responsibilities to be separate from those working in the adjoining public realm. There are also major jurisdictional barriers across broader land bases and

69
urban forest systems (e.g. between regional parks, private land, municipal parks and rights of way, Crown land). Peri-‐urban and urban forests can be viewed as an asset or a liability depending on the mandates of different disciplines (e.g., engineers, risk managers, ecologists, recreation providers). There is a potential role for higher levels of regional, provincial and even federal governments in providing services and integrated planning and managed in some of these situations. Thus, there are considerable opportunities for knowledge exchange, policy leadership and programming for agencies such as CFS in this arena. There is also a need (and it seems, considerable demand) for provision and enhancement of new skills, education and awareness of urban forestry at various levels, including high schools through to adult education, and retooling of practitioners in the broadening field of urban forestry.
The Canadian Urban Forest Network (CUFN) is an umbrella organization representing professional associations, businesses, educational institutions, community groups and the general public, in facilitating the exchange of information on urban forestry issues in Canada. The provincial and federal governments are represented through natural resource agencies (i.e. Natural Resources Canada -‐ NRCAN). The municipal level of government gains representation through individuals participating on the National Steering Committee. The function of the Committee is to review and update the Canadian Urban Forest Strategy (CUFN 2014). The structure of the CUFN aims to create an equal representation between members to foster dialogue and exchange of information on urban forestry. A review of applied urban forest management projects though, is initiated primarily at the municipal and community level. This reflects the ownership of land, control of zoning regulations and accountability to residents which municipalities are responsible for. This situation leaves opportunities for provincial and federal level of governments to contribute in other areas such as funding, research and extension.
As the practice of urban forestry develops in Canada, CFS could have a key role in helping to shape the future of Canada’s urban forests, in order to maximize the benefits and ensure their equitable distribution among urban residents. CFS could provide a leadership by developing an urban forestry research program that addresses the widening range of issues affecting a crucial resource to Canadians that is sometimes taken for granted.

70
6 CONCLUSIONS Priority areas for development in urban forestry in Canada include:
Developing an expanded economic analysis and solid business case for urban forestry. As reported above, there is much scattered information, but no clear or consistent patterns of values assigned to urban trees. It would be valuable for municipalities and home owners to know how much money these trees will cost them and when they can realize the net benefits.
Research to better understand the mechanisms by which urban forests provide cultural values and increased social health, and how green equity can influence the provision of urban forestry benefits and social well being.
Research and feedback from practitioners on how to evaluate urban forests’ contributions to climate change adaptation and mitigation, urban forest products, physical and mental health, and community economic development.
Development of aggregate valuation methods and results, such as by combining less tangible social and cultural benefits with monetized values (e.g. planting and maintaining trees on your property can reduce home heating costs by $x per year and reduce residents’ stress levels).
Tool development and refinement to expand or complement the i-‐Tree tools and facilitate assessment of non-‐regulating urban forest services and benefits.
Increased urban forest data sources and data sharing, from citizen science to national urban forest databases.
As the priority areas listed above are addressed, a key ingredient for success will be increased collaboration between all levels of government, academia, practitioners and citizen groups. As a national government agency with both research and practical expertise, the Canadian Forest Service could play a central role in facilitating this collaboration. The issues we are seeking to understand and integrate into urban forest policy, planning and management are complex and require a multi-‐faceted, collaborative approach to solve. Academia can provide theoretical guidance but will need to maintain strong relationships with practitioners and local communities to ensure that research is meeting practitioners’ needs and that useful research is being communicated and applied.
Government agencies such as the Canadian Forest Service could provide leadership in delivering urban forest assessment resources to the public and in coordinating data acquisition and sharing. Good policy and management is informed by high-‐quality data. The Canadian Forest Service could play a key role in gathering or generating data from various sources across the country, funding data acquisition initiatives and making it available to academia, practitioners and the public.
Finally, the Canadian Forest Service has an important role to play in educating and involving Canadian citizens in urban forest management. A first step could be to develop a national urban forest policy that would

71
facilitate engagement of CFS in urban forest research and engagement. If Canada is to successfully manage and improve its urban forests, the public must become more engaged through activities such as citizen science and data acquisition, tree management and urban forest education. Involving the public in urban forest management will help municipalities care for a valuable resource and will have added community cohesion benefits. Sustainable societies are about people, communities and governments working together to shape their ideal future forests.

72
7 REFERENCES Introduction
Alexander, C., & DePratto, B. (2014). Special Report Urban Forests: The Value of Urban Forests in Cities Across Canada. Retrieved from TD Economics website: https://www.td.com/document/PDF/economics/special/UrbanForestsInCanadianCities.pdf
Alexander, C., & McDonald, C. (2014). Special Report Urban Forests: The Value of Trees in the City of Toronto. Retrieved from TD Economics website: http://www.td.com/document/PDF/economics/special/UrbanForests.pdf
Ango , T.G., Börjeson, L., Senbeta, F. & Hylander, K. (2014). Balancing Ecosystem Services and Disservices: Smallholder Farmers’ Use and Management of Forest and Trees in an Agricultural Landscape in Southwestern Ethiopia. Ecology and Society, 19(1), 30.
Beckley, T.M., Parkins, J.R., & Sheppard, S.R.J. (2006). Public Participation in Sustainable Forest Management: A Reference Guide. Sustainable Forest Management Network, University of Alberta, Edmonton, AB.
Canadian Urban Forest Network (CUFN) (2004). Canadian Urban Forest Strategy 2004-‐2006. Retrieved from Canadian Urban Forest Strategy (CUFS) website: http://www.cufn.ca/#!canadian-‐urban-‐forest-‐strategy/c1gbp
Carter, J. (1993). The potential of urban forestry in developing countries: A concept paper. Rome: FAO. Retrieved March 19th, 2015 from http://www.fao.org/docrep/005/t1680e/t1680e01.htm
City of Phoenix. (2009). Red fields to green fields: transforming a desert city. Retrieved from Red Fields to Green Fields website: http://rftgf.org/PP/pdf-‐presentations/CityStudies/Phoenix. pdf
City of Vancouver, Greenest City 2020, & Vancouver Board of Parks and Recreation. (2014). City of Vancouver urban forest strategy. Retrieved from http://vancouver.ca/news-‐calendar/urban-‐forest-‐strategy.aspx.
Costanza, R., d’Arge, R., de-‐Groot, R., Farber, S., Grasso, M., Hannon, B., Limburg, K., Naeem, S., O’Neil, R., Paruelo, J., Raskin, R., Sutton, P. & van den Belt, J. (1997). The value of the worlds ecosystem services and natural capital. Ecological Economics, 25(1), 3–15.
Goddard, M. A., Dougill, A. J., & Benton, T. G. (2010). Scaling up from gardens: biodiversity conservation in urban environments. Trends in Ecology & Evolution, 25(2), 90–8. doi:10.1016/j.tree.2009.07.016
Hansmann, R., Hug, S. M., & Seeland, K. (2007). Restoration and stress relief through physical activities in forests and parks. Urban Forestry & Urban Greening, 6(4), 213–225. doi:10.1016/j.ufug.2007.08.004
Harnik, P. (2010). Urban Green: Innovative Parks for Resurgent Cities. Washington, DC: Island Press.
Heidt, V., & Neef, M. (2008). Benefits of Urban Green Space for Improving Urban Climate. In M. Carreiro, Y. Song, & J. Wu (Eds.), Ecology, Planning and Management of Urban Forests (pp. 84–96). New York: Springer.
Helms, J. A. (Ed.). (1998). The dictionary of forestry (p. 210). Bethesda, MD: Society of American Foresters.

73
Kenney, W. A., Wassenaer, P. J. E. Van, & Satel, A. L. (2011). Criteria and Indicators for Strategic Urban Forest Planning and Management, 37(3), 108–117.
Kline, J. D. (2006). Public Demand for Preserving Local Open Space. Society & Natural Resources, 19(7), 645–659. doi:10.1080/08941920600742419
Konijnendijk, C.C., Nilsson, K., Randrup, T., & Schipperijn, J. (2005). Urban forests and trees. (C. C. Konijnendijk, K. Nilsson, T. B. Randrup, & J. Schipperijn, Eds.) (p. 520). Berlin/Heidelberg: Springer-‐Verlag. Retrieved from http://link.springer.com/content/pdf/10.1007/3-‐540-‐27684-‐X.pdf
Kuchelmeister, G. (2000). Trees for the urban millennium: urban forestry update. Unasylva, 51, 49–55.
Kuo, F. E., & Sullivan, W. C. (2001). Environment and Crime in the Inner City: Does Vegetation Reduce Crime? Environment and Behavior, 33(3), 343–367. doi:10.1177/0013916501333002
Kweon, B. S., Sullivan, W. C., & Wiley, A. R. (1998). Green Common Spaces and the Social Integration of Inner-‐City Older Adults. Environment and Behavior, 30(6), 832–858. doi:10.1177/001391659803000605
Millennium Ecosystem Assessment (MA). (2005). Ecosystems and Human Well-‐being: Summary for Decision Makers. Washington D.C: Island Press.
Maas, J., Verheij, R. A., Groenewegen, P. P., de Vries, S., & Spreeuwenberg, P. (2006). Green space, urbanity and health: how strong is the relation? Journal of Epidemiology and Community Health, 60(7), 587–92. doi:10.1136/jech.2005.043125
McPhearson, T., Auch, R., & Alberti, M. (2013). Regional Assessment of North America: Urbanization Trends, Biodiversity Patterns and Ecosystem Services. In T. Elmqvist, M. Fragkias, J. Goodness, B. Güneralp, P. J. Marcotullio, R. I. McDonald, … C. Wilkinson (Eds.), Urbanization, Biodiversity and Ecosystem Services: Challenges and Opportunities (pp. 279–286). New York: Springer.
McPherson, G., Simpson, J. R., Peper, P. J., & Xiao, Q. (1999). Benefit-‐cost analysis of Modesto’s municipal urban forest. Journal of Arboriculture, 25, 235–248.
Mitchell, R., & Popham, F. (2008). Effect of exposure to natural environment on health inequalities: an observational population study. Lancet, 372(9650), 1655–60. doi:10.1016/S0140-‐6736(08)61689-‐X
Pascual, U., Muradian, R., Brander, L., Gómez-‐Baggethun, E., Martín-‐López, M, Verman, M., Armsworth, P., Christie, M., Cornelissen, H., Eppink, F., Farley, J., Loomis, J., Pearson, L., Perrings, C., & Polasky, S. (2010). Chapter 5: The economics of valuing ecosystem services and biodiversity. In Kumar, P. (Ed.), The Economics of Ecosystems and Biodiversity Ecological and Economic Foundations (pp. 183-‐256). London and Washington: Earthscan.
Peckham, S.C., Duinker, P.N., & Ordonez, C. (2013). Urban forest values in Canada: Views of citizens in Calgary and Halifax. Urban Forestry & Urban Greening, 12, 154– 162.
Population Division of the Department of Economic and Social Affairs of the United Nations Secretariat. (2008). World Urbanization Prospects: The 2007 Revision Highlights Report No. ESA/P/WP/205). Retrieved from http://www.un.org/esa/population/publications/wup2007/2007WUP_Highlights_web.pdf

74
Poudyal, N. C., Hodges, D. G., & Merrett, C. D. (2009). A hedonic analysis of the demand for and benefits of urban recreation parks. Land Use Policy, 26(4), 975–983. doi:10.1016/j.landusepol.2008.11.008
Rudd, H., Vala, J., & Schaefer, V. (2002). Importance of Backyard Habitat in a Comprehensive Biodiversity Conservation Strategy: A Connectivity Analysis of Urban Green Spaces. Restoration Ecology, 10(2), 368–375. doi:10.1046/j.1526-‐100X.2002.02041.x
Sanesi, G., Gallis, C., & Kasperidus, H. D. (2011). Urban forests and their ecosystem services in relation to human health. In K. Nilsson, M. Sangster, C. Gallis, T. Hartig, S. de Vries, K. Seeland, & J. Schipperijn (Eds.), Forests, Trees and Human Health (pp. 23–40). Dordrecht, Netherlands: Springer. doi:10.1007/978-‐90-‐481-‐9806-‐1
Sullivan, W. C. (2004). The Fruit of Urban Nature: Vital Neighborhood Spaces. Environment and Behavior, 36(5), 678–700. doi:10.1177/0193841X04264945
The Economics of Ecosystems & Biodiversity (TEEB). (n.d.). Glossary of Terms. Retrieved March 18th, 2015 from http://www.teebweb.org/resources/glossary-‐of-‐terms/
The Parks, Forestry and Recreation Division, City of Toronto. (2013). Sustaining and Expanding the Urban Forest: Toronto’s Strategic Forest Management Plan 2012–2022. Retrieved from City of Toronto website: http://www.toronto.ca/legdocs/mmis/2013/pe/bgrd/background file-‐55258.pdf
Thompson, C. W. (2002). Urban open space in the 21st century. Landscape and Urban Planning, 60(2), 59–72. doi:10.1016/S0169-‐2046(02)00059-‐2
Ulrich, R. S., Simons, R. F., Losito, B. D., Fiorito, E., Miles, M. a., & Zelson, M. (1991). Stress recovery during exposure to natural and urban environments. Journal of Environmental Psychology, 11(3), 201–230. doi:10.1016/S0272-‐4944(05)80184-‐7
Vancouver Board of Parks and Recreation. (2014). Rewilding Vancouver: From Sustaining to Flourishing. Retrieved from City of Vancouver website: http://vancouver.ca/files/cov/enviromental-‐education-‐stewardship-‐action-‐plan.pdf
Vries, S. De, Verheij, R. a, Groenewegen, P. P., & Spreeuwenberg, P. (2003). Natural environments -‐-‐ healthy environments? An exploratory analysis of the relationship between greenspace and health. Environment and Planning A, 35(10), 1717–1731. doi:10.1068/a35111
World Resources Institute. (2010). Weaving Ecosystem Services in Impact Assessment: A Step-‐by-‐Step Method. Retrieved March 18th, 2015 from http://www.wri.org/publication/weaving-‐ecosystem-‐services-‐into-‐impact-‐assessment
Urban Forest Evaluation Tools
Alonzo, M., Bookhagen, B., & Roberts, D. A. (2014). Urban tree species mapping using hyperspectral and lidar data fusion. Remote Sensing of Environment, 148, 70–83. doi:10.1016/j.rse.2014.03.018

75
American Forests. (2002). Projected Environmental Benefits of Community Tree Planting: A Multi-‐Site Model Urban Forest Project in Atlanta. Retrieved from http://www.systemecology.com/4_Past_Projects/AF_Atlanta2.pdf
American Forests. (2015). Community ReLeaf. Retrieved from http://www.americanforests.org/our-‐programs/urbanforests/community-‐releaf/
Black, J. (Ed.). (2012). Version 5 of i-‐Tree released: Includes more Canadian content and a smartphone & tablet app! Ontario Arborist (November/December). Retrieved from http://www.itreetools.org/news/articles/Ontario_Arborist_NovDec2012_article.pdf
Brown, M. E., Spence, C., College, S., Flake, L., College, S., Sarfraz, A., & College, S. (2012). Modelling the ecosystem services provided by trees in urban ecosystems using Biome-‐BGC to improve i-‐Tree Eco. Retrieved from NASA Technical Reports Server (NTRS) website: http://ntrs.nasa.gov/archive/nasa/casi.ntrs.nasa.gov/20120009798.pdf
Canadian Urban Forest Network (CUFN). (2014). Welcome to the Canadian Urban Forest Network! Retrieved from http://www.cufn.ca/
Center for Neighbourhood Technology. (2007). Green Values Stormwater Calculator Methodology. Retrieved from Green Values Stormwater Toolbox website: http://greenvalues.cnt.org/downloads/methodology.pdf
City of Vancouver (2014 April 16). Council approves a long-‐term strategy for our urban forest: Protection of Trees Bylaw updated. Retrieved from http://vancouver.ca/news-‐calendar/urban-‐forest-‐strategy.aspx
Cullen, S. (2002). Tree Appraisal : Can Depreciation Factors Be Rated Greater Than 100 %? Journal of Arboriculture, 28(3), 153–158.
Findlay, B. A. (2013). ADAPTATION OF I-‐TREE ECO TO NEW ZEALAND. Retrieved from i-‐Tree website: http://www.itreetools.org/eco/resources/Adaptation_of_iTree_Eco_to_New_Zealand_Findlay2013.pdf
i-‐Tree. (2015). i-‐Tree. Retrieved from www.itreetools.org
i-‐Tree. (2015). i-‐Tree-‐Archived Resources. Retrieved from www.itreetools.org/resources/archives.php
Isely, E. S., Isely, P., Seedang, S., Mulder, K., Thompson, K., & Steinman, A. D. (2010). Addressing the information gaps associated with valuing green infrastructure in west Michigan: Integrated Valuation of Ecosystem Services Tool (INVEST). Journal of Great Lakes Research, 36(3), 448–457. doi:10.1016/j.jglr.2010.04.003
King, K. L., & Locke, D. H. (2013). A Comparison of Three Methods for Measuring Local Urban Tree Canopy Cover. Arboriculture & Urban Forestry, 39(2), 62–67.
Locke, D. H., Grove, J. M., Lu, J. W. T., Troy, A., Neil-‐dunne, J. P. M. O., & Beck, B. D. (2010). Prioritizing Preferable Locations for Increasing Urban Tree Canopy in New York City. Cities and the Environment, 3(1), 1–18.
McCauley, D. J. (2006). Selling out on nature. Nature, 443(September), 27–28. doi:10.1038/443027a

76
McGee, J. a., Day, S. D., Wynne, R. H., & White, M. B. (2012). Using Geospatial Tools to Assess the Urban Tree Canopy: Decision Support for Local Governments. Journal of Forestry, 110(August), 275–286. doi:10.5849/jof.11-‐052
McPherson, E. G. (2007). Northeast Community Tree Guide: Benefits, Costs and Strategic Planting. Retrieved from i-‐Tree website: http://www.itreetools.org/streets/resources/Streets_CTG/PSW_GTR202_Northeast_CTG.pdf
McPherson, E. G. (2010). Tools for valuing tree and park services. Western Arborist, 36, 58-‐63.
McPherson, E. G., & Kotow, L. (2013). A municipal forest report card: Results for California, USA. Urban Forestry and Urban Greening, 12(2), 134–143. doi:10.1016/j.ufug.2013.01.003
McPherson, E. G., Nowak, D., Heisler, G., Grimmond, S., Souch, C., Grant, R., & Rowntree, R. (1997). Quantifying urban forest structure , function and value : the Chicago Urban Forest Climate Project. Urban Ecosystems, 1, 49–61.
McPherson, E. G., Simpson, J. R., Xiao, Q., & Wu, C. (2011). Million trees Los Angeles canopy cover and benefit assessment. Landscape and Urban Planning, 99(1), 40–50. doi:10.1016/j.landurbplan.2010.08.011
McPherson, G., Simpson, J. R., Peper, P. J., Maco, S. E., & Xiao, Q. (2005). Municipal Forest Benefits and Costs in Five US Cities. Journal of Forestry, 103, 411–416.
Millenium Ecosystem Assessment Board World Health Organization. (2005). Ecosystems and Human Well-‐being. Ecosystems, 5, 1–100. doi:10.1196/annals.1439.003
Miller, S. (2012). New Urban Forestry Management Tools. Presentation to the Indiana Urban Forest Council. Retrieved from http://www.iufc.org/2012Winter_Miller1.pdf
Millward, A. A., & Sabir, S. (2011). Benefits of a forested urban park: What is the value of Allan Gardens to the city of Toronto, Canada? Landscape and Urban Planning, 100(3), 177–188. doi:10.1016/j.landurbplan.2010.11.013
Nowak, D. J., Crane, D. E., & Stevens, J. C. (2006). Air pollution removal by urban trees and shrubs in the United States. Urban Forestry and Urban Greening, 4, 115–123. doi:10.1016/j.ufug.2006.01.007
Nowak, D. J., Crane, D. E., Stevens, J. C., Hoehn, R. E., Walton, J. T., & Bond, J. (2008). A Ground-‐Based Method of Assessing Urban Forest Structure and Ecosystem Services. Aboriculture & Urban Forestry, 34(November), 347–358. doi:10.1039/b712015j
Nowak, D. J., Hoehn, R. E. I., Bodine, A. R., Crane, D. E., Dwyer, J. F., Bonnewell, V., & Watson, G. (2013). Urban Trees and Forests of the Chicago Region (Resource Bulletin NRS-‐84). Newtown Square, PA: U.S. Department of Agriculture, Forest Service, Northern Research Station.
Nowak, D. J., Hoehn, R. E. I., Bodine, A. R., Greenfield, E. J., Ellis, A., Endreny, T. a., … Henry, R. (2013). Assessing Urban Forest Effects and Values: Toronto’s Urban Forest (Resource Bulletin NRS-‐79). Newtown Square, PA: US Department of Agriculture, Forest Service, Northern Research Station.

77
Nowark, D.J., Crane, D.E., & Dwyer, J.F. (2002). Compensatory value of urban trees in the United States. Journal of Arboriculture, 28(4), 194–199. Retrieved from https://www.itreetools.org/eco/resources/JA_Compensatory_2002.pdf
Ohta, H. (2001). A Phenomenological Approach To Natural Landscape Cognition. Journal of Environmental Psychology, 21, 387–403. doi:10.1006/jevp.2001.0233
O’Neil-‐Dunne, J., MacFaden, S., & Royar, A. (2014). A Versatile, Production-‐Oriented Approach to High-‐Resolution Tree-‐Canopy Mapping in Urban and Suburban Landscapes Using GEOBIA and Data Fusion. Remote Sensing, 6, 12837–12865. doi:10.3390/rs61212837
Ordóñez, C., & Duinker, P. N. (2013). An analysis of urban forest management plans in Canada: Implications for urban forest management. Landscape and Urban Planning, 116, 36–47. doi:10.1016/j.landurbplan.2013.04.007
Peper, P. J., & McPherson, E. G. (2003). Evaluation of four methods for estimating leaf area of isolated trees. Urban Forestry & Urban Greening, 2, 19–29. doi:10.1078/1618-‐8667-‐00020
Pitman, S., & Ely, M. (2014). From grey to green: Life support for human habitats. Retrieved from Botanical Garden of South Australia website: http://www.environment.sa.gov.au/botanicgardens/Learn/Green_Infrastructure
Pothier, A., & Millward, A. (2013). Valuing trees on city-‐centre institutional land: An opportunity for urban forest management. Journal of Environmental Planning and Management, 56(9), 1380–1402. doi:10.1080/09640568.2012.724666
Richardson, J. J., & Moskal, L. M. (2014). Uncertainty in urban forest canopy assessment: Lessons from seattle, WA, USA. Urban Forestry and Urban Greening, 13(1), 152–157. doi:10.1016/j.ufug.2013.07.003
Rogers, G. F., & Rowntree, R. A. (1988). Intensive surveys of structure and change in urban natural areas. Landscape and Urban Planning, 15, 59–78. doi:10.1016/0169-‐2046(88)90016-‐3
Rowntree, R. A. (1984). Ecology of the Urban Forest -‐ Introduction to Part I. Urban Ecology, (8), 1–11.
Roy, S., Byrne, J., & Pickering, C. (2012). A systematic quantitative review of urban tree benefits, costs and assessment methods across cities in different climatic zones. Urban Forestry and Urban Greening, 11(4), 351–363. doi:10.1016/j.ufug.2012.06.006
Seamon, D. (2000). Chapter 13: A way of seeing people and place. In S. Wapner, J. Demick, T. Yamamoto, & H. Minami (Eds.), Theoretical perspectives in environment-‐behavior research (pp. 157–178). New York: Springer. Retrieved from http://link.springer.com/chapter/10.1007/978-‐1-‐4615-‐4701-‐3_13
Soares, a. L., Rego, F. C., McPherson, E. G., Simpson, J. R., Peper, P. J., & Xiao, Q. (2011). Benefits and costs of street trees in Lisbon, Portugal. Urban Forestry & Urban Greening, 10(2), 69–78. doi:10.1016/j.ufug.2010.12.001
Stephen, B. (2015). Personal Communication. Vancouver Board of Parks and Recreation, City of Vancouver.
Tree Canada. (2015). Carbon Calculator. Retrieved from https://treecanada.ca/en/programs/grow-‐clean-‐air/carbon-‐calculator/

78
United States Department of Agriculture (USDA) Forest Service. (1986). Urban Hydrology for Small Watersheds, Technical Report TR-‐55 (Report No. 210-‐VI-‐TR-‐55). Retrieved from http://www.nrcs.usda.gov/Internet/FSE_DOCUMENTS/stelprdb1044171.pdf
Vandermeulen, V., Verspecht, A., Vermeire, B., Van Huylenbroeck, G., & Gellynck, X. (2011). The use of economic valuation to create public support for green infrastructure investments in urban areas. Landscape and Urban Planning, 103(2), 198–206. doi:10.1016/j.landurbplan.2011.07.010
Watson, G. (2002). Comparing formula methods of tree appraisal. Journal of Arboriculture, 28(January), 11–18.
Wood, C. (2014). Modeling Growth and Dimensions of Street Trees in the City of Vancouver Crispin Wood Masters of Sustainable Forest Management. University of British Columbia.
Ye, N. (2014). Comparison Between High-‐Resolution Aerial Imagery and LiDAR Data Classification of Canopy and Grass in the NESCO Neighbourhood, Indianapolis, Indiana (Master’s thesis). Retrived from http://graduate.iupui.edu/
Young, R. F. (2010). Managing municipal green space for ecosystem services. Urban Forestry and Urban Greening, 9(4), 313–321. doi:10.1016/j.ufug.2010.06.007
Ecosystem Services
Asadian, Y. (2010). Rainfall interception in an urban environment (Doctoral dissertation). Retrieved from the https://circle.ubc.ca/.
Bonan, G. B. (2002). Ecological Climatology: Concepts and Applications. Cambridge: Cambridge University Press.
Botteldooren, D., De Coensel, B., & De Muer, T. (2006). The temporal structure of urban soundscapes. Journal of Sound and Vibration, 292, 105–123.
Buijs, A. E., Elands, B. H. M., & Langers, F. (2009). No wilderness for immigrants: Cultural differences in images of nature and landscape preferences. Landscape and Urban Planning, 91, 113–123. doi:10.1016/j.landurbplan.2008.12.003
Chan, K. M. A., Satterfield, T., & Goldstein, J. (2012). Rethinking ecosystem services to better address and navigate cultural values. Ecological Economics, 74, 8–18.
Donovan, G. H., & Butry, D. T. (2009). The value of shade: Estimating the effect of urban trees on summertime electricity use. Energy and Buildings, 41(6), 662–668.
Escobedo, F. J., & Nowak, D. J. (2009). Spatial heterogeneity and air pollution removal by an urban forest. Landscape and Urban Planning, 90, 102–110.
Fernández-‐Juricic, E. (2000). Bird community composition patterns in urban parks or Madrid: the role of age, size and isolation. Ecological Research, 15(4), 373–383.
Fields, B. (2009). From Green Dots to Greenways: Planning in the Age of Climate Change in Post-‐Katrina New Orleans. Journal of Urban Design, 14(3), 325–344.

79
Fisher, B., Turner, R. K., & Morling, P. (2009). Defining and classifying ecosystem services for decision making. Ecological Economics, 68(3), 643–653.
Fraser, E. D. G., & Kenney, W. A. (2000). Cultural background and landscape history as factors affecting perceptions of the urban forest. Journal of Arboriculture, 26(2), 106–113.
Gilbert, O. L. (1989). The ecology of urban habitats. New York: Chapmann and Hall.
Gómez-‐Baggethun, E., & Barton, D. N. (2013). Classifying and valuing ecosystem services for urban planning. Ecological Economics, 86, 235–245. doi:10.1016/j.ecolecon.2012.08.019
Hernández-‐Morcillo, M., Plieninger, T., & Bieling, C. (2013). An empirical review of cultural ecosystem service indicators. Ecological Indicators, 29, 434–444. doi:10.1016/j.ecolind.2013.01.013
Herrington, L. P. (1974). Trees And Acoustics In Urban Areas. Journal of Forestry, 72(August), 462–465. Retrieved from http://www.ingentaconnect.com/content/saf/jof/1974/00000072/00000008/art00008
Kang, J., & Zhang, M. (2010). Semantic differential analysis of the soundscape in urban open public spaces. Building and Environment, 45(1), 150–157. doi:10.1016/j.buildenv.2009.05.014
Khilman, T. (2004). Noise pollution in cities, Curitiba and Gothenburg as examples. In Proceedings of the Seminar -‐ Environmental Aspects of Urbanization -‐ Seminar in Honor of Dr. Mostafa Kamal Tolba (p. in CD). Gothenburg, Sweden.
Konijnendijk, C. C. (2013). Benefits of Urban Parks -‐ A systematic review. International Federation of Parks and Recreation Administration, (January).
Kremer, P., Hamstead, Z. a., & McPhearson, T. (2013). A social-‐ecological assessment of vacant lots in New York City. Landscape and Urban Planning, 120, 218–233. doi:10.1016/j.landurbplan.2013.05.003
Lovell, S. T. (2010). Multifunctional urban agriculture for sustainable land use planning in the United States. Sustainability, 2, 2499–2522. doi:10.3390/su2082499
MacFarlane, D. W. (2009). Potential availability of urban wood biomass in Michigan: Implications for energy production, carbon sequestration and sustainable forest management in the U.S.A. Biomass and Bioenergy, 33(4), 628–634. doi:10.1016/j.biombioe.2008.10.004
Macleod, R. (2011). Utilizing wood waste from CR&D and urban forestry. Retrieved from Construction Resource Initiatives Council website: http://www.cricouncil.com/wp-‐content/uploads/2011/03/Wood-‐Utilization-‐CRI-‐Council.pdf
Maleki, K., & Hosseini, S. M. (2011). Investigation of the effect of leaves, branches and canopies of trees on noise pollution reduction. Annals of Environmental Science, 5, 13–21.
Mathey, J., Rößler, S., Lehmann, I., & Bräuer, A. (2011). Resilient Cities, 479–485. doi:10.1007/978-‐94-‐007-‐0785-‐6
McLain, R., Poe, M., Hurley, P. T., Lecompte-‐Mastenbrook, J., & Emery, M. R. (2012). Producing edible landscapes in Seattle’s urban forest. Urban Forestry & Urban Greening, 11(2), 187–194. doi:10.1016/j.ufug.2011.12.002

80
Mooney, P., & Brown, G. (2013). Ecosystem services, natural capital and nature’s benefits in the urban region: Information for professionals and citizens. Vancouver, BC: School of Architecture and Landscape Architecture, University of British Columbia.
Morimoto, Y. (2011). Biodiversity and ecosystem services in urban areas for smart adaptation to climate change: “Do you Kyoto”? Landscape and Ecological Engineering, 7(1), 9–16. doi:10.1007/s11355-‐010-‐0140-‐1
Myeong, S., Nowak, D. J., & Duggin, M. J. (2006). A temporal analysis of urban forest carbon storage using remote sensing. Remote Sensing of Environment, 101, 277–282. doi:10.1016/j.rse.2005.12.001
Nowak, D. J. (1994). Air pollution removal by Chicago’s urban forest. In E. McPherson & D. Nowak (Eds.), Chicago’s Urban Forest Ecosystem: Results of the Chicago Urban Forest Climate Project (pp. 63–81). Radnor: United States Department of Agriculture.
Nowak, D. J., Civerolo, K. L., Trivikrama Rao, S., Gopal Sistla, Luley, C. J., & E. Crane, D. (2000). A modeling study of the impact of urban trees on ozone. Atmospheric Environment, 34, 1601–1613. doi:10.1016/S1352-‐2310(99)00394-‐5
Nowak, D. J., & Crane, D. E. (2002). Carbon storage and sequestration by urban trees in the USA. Environmental Pollution, 116, 381–389.
Oke, T. R. (1973). City size and the urban heat island. Atmospheric Environment, 14, 769–779.
Pouyat, R. V., Russell-‐Anelli, J., Yseilonis, I. D., & Groffman, P. M. (2003). Soil carbon in urban forest ecosystems. In J. M. Kimble, R. Lal, R. Birdsey, & L. S. Heath (Eds.), The Potential of US Forest Soils to Sequester Carbon and Mitigate the Greenhouse Effect (pp. 347–362). Boca Raton, FL: CRC Press.
Pouyat, R. V., Yesilonis, I. D., & Nowak, D. J. (2006). Carbon Storage by Urban Soils in the United States. Journal of Environment Quality, 35(ii), 1566. doi:10.2134/jeq2005.0215
Revi, A., Satterthwaite, D. E., Aragón-‐Durand, F., Corfee-‐Morlot, J., Kiunsi, R. B. R., Pelling, M., … Solecki, W. (2014). Urban areas. In C. B. Field, V. R. Barros, D. J. Dokken, K. J. Mach, M. D. Mastrandrea, T. E. Bilir, … L. L. White (Eds.), Climate Change 2014: Impacts, Adaptation and Vulnerability. Part A: Global and Sectoral Aspects. Contribution of Working Group II to the Fifth Assessment Report of the Intergovernmental Panel on Climate Change (pp. 535–612). New York, NY: Cambridge University Press.
Richards, K. R., & Stokes, C. (2004). A review of forest carbon sequestration cost studies: A dozen years of research. Climate Change, 63, 1–48.
Rishbeth, C. (2004). Ethno-‐cultural representation in the urban landscape. Journal of Urban Design, 9(3), 311–333. doi:10.1080/1357480042000283878
Sanesi, G., Padoa-‐Schioppa, E., Lafortezza, R., Lorusso, L., & Bottoni, L. (2009). Avian ecological diversity as indicator of urban forest functionality. Results from two case studies in Northern and Southern Italy. Arboriculture and Urban Forestry, 35(2), 53–59.
Savard, J. L., Clergeau, P., & Mennechez, G. (2000). Biodiversity concepts and urban ecosystems. Landscape and Urban Planning, 48, 131–142.

81
Service, F., Mclain, R. J., Macfarland, K., Brody, L., Hebert, J., Hurley, P., … Charnley, S. (2012). Gathering in the City : An Annotated Bibliography and Review of the Literature About Human-‐Plant Interactions in Urban Ecosystems.
Shore, R. (2015, February 25). Vancouver’s city gardens branch out: New policy allows park projects to blossom, allowing for new forms of food production, including fruit and nut orchards and beekeeping. The Vancouver Sun. Retrieved from http://www.vancouversun.com/life/Vancouver+city+gardens+branch/10842736/story.html
Taylor, R. W. (2012). Urbanization, Local Government and Planning for Sustainability. In M. P. Weintsein & R. E. Turner (Eds.), Sustainability Science: The Emerging Paradigm and the Urban Environment (p. 293-‐313). New York: Springer. doi:10.1016/B978-‐0-‐444-‐62709-‐4.00003-‐8
Tjallingii, S. P. (2000). Ecology on the edge : Landscape and ecology between town and country. Landscape and Urban Planning, 48, 103–119.
Tyler, S., & Moench, M. (2012). A framework for urban climate resilience. Climate and Development, 4(4), 311–326. doi:10.1080/17565529.2012.745389
Yang, W., & Kang, J. (2005). Acoustic comfort evaluation in urban open public spaces. Applied Acoustics, 66, 211–229. doi:10.1016/j.apacoust.2004.07.011
Zannin, P. H. T., Ferreira, A. M. C., & Szeremetta, B. (2006). Evaluation of noise pollution in urban parks. Environmental Monitoring and Assessment, 118(1-‐3), 423–33. doi:10.1007/s10661-‐006-‐1506-‐6
Zhang, H., & Jim, C. Y. (2014). Species diversity and performance assessment of trees in domestic gardens. Landscape and Urban Planning, 128, 23–34. doi:10.1016/j.landurbplan.2014.04.017
Zhang, Y., Hussain, A., Deng, J., & Letson, N. (2007). Public Attitudes Toward Urban Trees and Supporting Urban Tree Programs. Environment and Behavior, 39(6), 797–814. doi:10.1177/0013916506292326
Human Health and Well-‐being
Annerstedt, M., Östergren, P.O., Björk, J., Grahn, J., Skärbäck, E., & Währborg, P. (2012). Green Qualities in the Neighbourhood and Mental Health – Results from a Longitudinal Cohort Study in Southern Sweden. BMC Public Health, 12 (1), 337. doi:10.1186/1471-‐2458-‐12-‐337
Arnberger, A., & Eder, R. (2012). The Influence of Green Space on Community Attachment of Urban and Suburban Residents. Urban Forestry & Urban Greening, 11 (1), 41–49. doi:10.1016/j.ufug.2011.11.003
Astell-‐Burt, T., Mitchell, R., & Hartig, T. (2014). The association between green space and mental health varies across the lifecourse. A longitudinal study. Journal of epidemiology and community health, 68(6), 578-‐583. doi:10.1136/jech-‐2013-‐203767
Barbosa, O., Tratalos, J. a., Armsworth, P. R., Davies, R. G., Fuller, R. a., Johnson, P., & Gaston, K. J. (2007). Who benefits from access to green space? A case study from Sheffield, UK. Landscape and Urban Planning, 83(2-‐3), 187–195. doi:10.1016/j.landurbplan.2007.04.004

82
Bell, J. F., Wilson, J. S., & Liu, G. C. (2008). Neighborhood greenness and 2-‐year changes in body mass index of children and youth. American journal of preventive medicine, 35(6), 547-‐553. doi:10.1016/j.amepre.2008.07.006
Blackshaw, T., & Long, J. (1998). A critical examination of the advantages of investigating community and leisure from a social network perspective. Leisure Studies, 17(4).
Bowler, D. E., Buyung-‐Ali, L. M., Knight, T. M., & Pullin, A. S. (2010). A systematic review of evidence for the added benefits to health of exposure to natural environments. BMC Public Health, 10(1), 456. doi:10.1186/1471-‐2458-‐10-‐456
Cariñanos, P., Casares-‐Porcel, M., & Quesada-‐Rubio, J.M. (2014). Estimating the Allergenic Potential of Urban Green Spaces: A Case-‐study in Granada, Spain. Landscape and Urban Planning, 123 (March), 134–144. doi:10.1016/j.landurbplan.2013.12.009
Carrus, G., Scopelliti, M., Lafortezza, R., Colangelo, G., Ferrini, F., Salbitano, F., Agrimi, Luigi Portoghesi, M., Semenzato, P., & Sanesi, G. (2015). Go Greener, Feel Better? The Positive Effects of Biodiversity on the Well-‐being of Individuals Visiting Urban and Peri-‐urban Green Areas. Landscape and Urban Planning, 134 (February), 221–228. doi:10.1016/j.landurbplan.2014.10.022
Chawla, L., & Lock, E. (2015). Natural-‐terrain Schoolyards Reduce Children’s Stress, Says CU-‐Boulder Study. Retrieved from University of Colorado Boulder website: http://www.colorado.edu/news/releases/2014/07/22/natural-‐terrain-‐schoolyards-‐reduce-‐children percentE2 percent80 percent99s-‐stress-‐says-‐cu-‐boulder-‐study
Collins, P. A., Hayes, M.V., & Oliver, L.N. (2009). Neighbourhood Quality and Self-‐rated Health: A Survey of Eight Suburban Neighbourhoods in the Vancouver Census Metropolitan Area. Health & Place, 15 (1), 156–64. doi:10.1016/j.healthplace.2008.03.008
Dadvand, P., De Nazelle, A., Figueras, F., Basagaña, X., Su, J., X Amoly, E., Jerrett, M., Vrijheid, M., Sunyer, J., & Nieuwenhuijsen, M.J. (2012). Green Space, Health Inequality and Pregnancy. Environment International, 40, 110–115. doi:10.1016/j.envint.2011.07.004
Dadvand, P., Sunyer, J., Basagaña, X., Ballester, F., Lertxundi, A., Fernández-‐Somoano, A., Estarlich, M., García-‐Esteban, R., Mende,z M.A., Nieuwenhuijsen, M.J. (2012). Surrounding Greenness and Pregnancy Outcomes in Four Spanish Birth Cohorts. Environ Health Perspect, 120(10), 1481–1487.
Donovan, G. H., Butry, D. T., Michael, Y. L., Prestemon, J. P., Liebhold, A. M., Gatziolis, D., & Mao, M. Y. (2013). The relationship between trees and human health: evidence from the spread of the emerald ash borer. American Journal of Preventive Medicine, 44(2), 139–145. doi:10.1016/j.amepre.2012.09.066
Donovan, G. H., Michael, Y. L., Butry, D. T., Sullivan, A. D., & Chase, J. M. (2011). Urban trees and the risk of poor birth outcomes. Health & Place, 17 (1), 390–393. doi:10.1016/j.healthplace.2010.11.004
Downing, L. (2015, February 2). Scientists Seeking to Save World Find Best Technology Is Trees. Bloomberg.com. Retrieved from http://www.bloomberg.com/news/articles/2015-‐02-‐03/scientists-‐seeking-‐to-‐save-‐world-‐find-‐best-‐technology-‐is-‐trees

83
Escobedo, F. J., Kroeger, T., & Wagner, J. E. (2011). Urban forests and pollution mitigation: Analyzing ecosystem services and disservices. Environmental Pollution, 159(8–9), 2078–2087.
Federal, P. (2014). 2012 Canadian Nature Survey: Awareness, participation, and expendatures in nature-‐related recreation, conservation, and subsistence activities (p. 181). Ottawa, ON: Canadian Councils of Resource Ministers.
Florida, R. (2014, December 11). Walkability Is Good for You. CityLab. Retrieved from http://www.citylab.com/design/2014/12/growing-‐evidence-‐shows-‐walkability-‐is-‐good-‐for-‐you-‐and-‐for-‐cities/383612/
Frehsée, N. (2014, June). Shinrin-‐Yoku: The Japanese Practice That Could Transform Your Day. Oprah.com. Retrieved from http://www.oprah.com/spirit/Shinrin-‐Yoku-‐Health-‐Benefits-‐of-‐Walking-‐Outside
Fuller, R. A., Irvine, K.N., Devine-‐Wright, P., Warren, P.H. and Gaston, K.J. (2007). Psychological Benefits of Greenspace Increase with Biodiversity. Biology Letters, 3(4), 390–394. doi:10.1098/rsbl.2007.0149
Gardiner, H. (2015, February 21). Polluted Air Cuts Years Off Lives of Millions in India, Study Finds. The New York Times. Retrieved from http://www.nytimes.com/2015/02/22/world/asia/polluted-‐air-‐cuts-‐years-‐off-‐lives-‐of-‐millions-‐in-‐india-‐study-‐finds.html
Gidlöf-‐Gunnarsson, A., & Öhrström, E. (2007). Noise and well-‐being in urban residential environments: The potential role of perceived availability to nearby green areas. Landscape and Urban Planning, 83(2), 115-‐126. doi:10.1016/j.landurbplan.2007.03.003
Glover, T. D. (2004). Social capital in the lived experiences of community gardeners. Leisure Sciences, 26(2), 143-‐162. Glover, T., Shinew, K., & Parry, D. (2005). Association, sociability, and civic culture: The democratic effect of
community gardening. Leisure Sciences, 27(1), 75-‐92.
Grahn, P., & Stigsdotter, U. A. (2003). Landscape planning and stress. Urban Forestry & Urban Greening, 2(1), 1–18. doi:10.1078/1618-‐8667-‐00019
Greene, C. S., Millward, A. A.., & Ceh, B. (2011). Who is likely to plant a tree? The use of public socio-‐demographic data to characterize client participants in a private urban forestation program. Urban Forestry & Urban Greening, 10(1), 29–38. doi:10.1016/j.ufug.2010.11.004
Groenewegen, P. P., Van den Berg, A. E., Vries, S. De, & Verheij, R. A. (2006). Vitamin G: effects of green space on health, well-‐being and social safety. BMC Public Health, 6(1), 149. doi:10.1186/1471-‐2458-‐6-‐149
Groenewegen, P. P., Van den Berg, A. E., Maas, J., Verheij, R. A., & Vries, S. De. (2012). Is a green residential environment better for health? If so, why? Annals of the Association of American Geographers, 102(5), 996-‐1003. doi:10.1080/00045608.2012.674899
Guite, H. F., Clark, C., & Ackrill, G. (2006). The impact of the physical and urban environment on mental well-‐being. Public health, 120(12), 1117-‐1126. doi:10.1016/j.puhe.2006.10.005

84
Hartig, T., Evans, G. W., Jamner, L. D., Davis, D. S., & Gärling, T. (2003). Tracking restoration in natural and urban field settings. Journal of Environmental Psychology, 23(2), 109–123. doi:10.1016/S0272-‐4944(02)00109-‐3
Hartig, T., van den Berg, A. E., Hagerhall, C. M., Tomalak, M., Bauer, N., Hansmann, R., ... & Waaseth, G. (2011). Health benefits of nature experience: Psychological, social and cultural processes. In K. Nilsson, M. Sangster, C. Gallis, T. Hartig, S. de Vries, K. Seeland, & J. Schipperijn (Eds.), Forests, Trees and Human Health (pp. 127–168). Dordrecht, Netherlands: Springer. Retrieved from http://link.springer.com/chapter/10.1007/978-‐90-‐481-‐9806-‐1_5
Hartig, T., Mitchell, R., Vries, S. De, & Frumkin, H. (2014). Nature and Health. Annual Review of Public Health, 35(1), 207–228. doi:10.1146/annurev-‐publhealth-‐032013-‐182443
He, G., Fan, M., & Zhou, M. (2015). The Effect of Air Pollution on Mortality in China: Evidence from the 2008 Beijing Olympic Games. SSRN Scholarly Paper ID 2554217. Rochester, NY: Social Science Research Network. Retrieved from http://papers.ssrn.com/abstract=2554217
Hemingway, J.L. (1999). Leisure, social capital, and democratic citizenship. Journal of Leisure Research, 31(2), 150-‐165.
Heynen, N. C., & Lindsey, G. (2003). Correlates of urban forest canopy cover: Implications for local public works. Public Works Management and Policy, 8(1), 33–47. doi:10.1177/1087724X03253604
Herzog, T. R., Maguire, P., & Nebel, M. B. (2003). Assessing the restorative components of environments. Journal of Environmental Psychology, 23(2), 159–70. doi:10.1016/S0272-‐4944(02)00113-‐5
Hu, Z., Liebens, J., & Rao, K. R. (2008). Linking stroke mortality with air pollution, income and greenness in northwest Florida: An ecological geographical study. International Journal of Health Geographics, 7 (May), 20. doi:10.1186/1476-‐072X-‐7-‐20
Hull, R. B., Lam, M., & Vigo, G. (1994). Place identity: symbols of self in the urban fabric. Landscape and Urban Planning, 28 (2–3), 109–120. doi:10.1016/0169-‐2046(94)90001-‐9
Hystad, P., Davies, H. W., Frank, L., Van Loon, J., Gehring, U., Tamburic, L., & Brauer, M. (2014). Residential greenness and birth outcomes: evaluating the influence of spatially correlated built-‐environment factors. Environ Health Perspectives, 122, 1095–1102.
Jackson, L.E. (2003). The Relationship of Urban Design to Human Health and Condition. Landscape and Urban Planning, 64(4), 191–200. doi:10.1016/S0169-‐2046(02)00230-‐X
Jenkins, R. (2015, January 22). HEALTHY PARKS, HEALTHY PERSON: Applying the Golden Rule to Nature and People: The New Nature Movement [web blog message]. Children & Nature Network. Retrieved from http://blog.childrenandnature.org/2015/01/22/healthy-‐parks-‐healthy-‐person-‐applying-‐the-‐golden-‐rule-‐to-‐nature-‐and-‐people/
Jiang, B., Chang, C. Y., & Sullivan, W. C. (2014). A dose of nature: Tree cover, stress reduction and gender differences. Landscape and Urban Planning, 132(December), 26–36. doi:10.1016/j.landurbplan.2014.08.005

85
Kaplan, R. (1993). The role of nature in the context of the workplace. Landscape and Urban Planning, 26(1–4), 193–201. doi:10.1016/0169-‐2046(93)90016-‐7
Kaplan, R. (2001). The Nature of the View from Home Psychological Benefits. Environment and Behavior, 33(4), 507–42. doi:10.1177/00139160121973115
Kaplan, R. (2007). Employees’ Reactions to Nearby Nature at Their Workplace: The Wild and the Tame. Landscape and Urban Planning, 82 (1–2), 17–24. doi:10.1016/j.landurbplan.2007.01.012
Kaplan, R., & Kaplan, S. (1989) The Experience of Nature: A Psychological Perspective. Cambridge: Cambridge University Press.
Konijnendijk, C., Annerstedt, M., Nielsen, A.B., & Maruthaveeran, S. (2013). Benefits of Urban Parks: A Systematic Review. IPFRA World, 2012(6), 10-‐12.
Kuo, F.E. (2003). The Role of Arboriculture in a Healthy Social Ecology. Journal of Arboriculture, 29(3), 148–155.
Kuo, F. E., Sullivan, W. C., Coley, R. L., & Brunson, L. (1998). Fertile ground for community: Inner-‐city neighborhood common spaces. American Journal of Community Psychology, 26(6), 823–851. doi:10.1023/A:1022294028903
Lafary, E. W., Gatrell, J. D., & Jensen, R. R. (2008). People, pixels and weights in Vanderburgh County, Indiana: toward a new urban geography of human-‐environment interactions. Geocarto International, 23(1), 53–66. doi:10.1080/10106040701494575
Landry, S. M., & Chakraborty, J. (2009). Street trees and equity: evaluating the spatial distribution of an urban amenity. Environment and Planning A, 41(11), 2651–2670. doi:10.1068/a41236
Laskow, S. (2015, February 3). How Trees Can Make City People Happier (and Vice Versa). Nextcity.org. Retrieved from http://nextcity.org/daily/entry/city-‐trees-‐care-‐tending-‐people-‐happiness
Lee, A. C. K., & Maheswaran, R. (2011). The health benefits of urban green spaces: a review of the evidence. Journal of Public Health, 33(2), 212–222. doi:10.1093/pubmed/fdq068
Lee, J., Tsunetsugu, Y., Takayama, N., Park, B. J., Li, Q., Song, C., ... & Miyazaki, Y. (2014). Influence of forest therapy on cardiovascular relaxation in young adults. Evidence-‐Based Complementary and Alternative Medicine, 2014 (February), e834360. doi:10.1155/2014/834360
Lottrup, L., Grahn, P., & Stigsdotter, U. K. (2013). Workplace greenery and perceived level of stress: Benefits of access to a green outdoor environment at the workplace. Landscape and Urban Planning, 110 (February), 5–11. doi:10.1016/j.landurbplan.2012.09.002
Lovasi, G. S., Jacobson, J. S., Quinn, J. W., Neckerman, K. M., Ashby-‐Thompson, M. N., & Rundle, A. (2011). Is the environment near home and school associated with physical activity and adiposity of urban preschool children? Journal of Urban Health, 88 (6), 1143–1157. doi:10.1007/s11524-‐011-‐9604-‐3
Maas, J., Van Dillen, S. M., Verheij, R. A., & Groenewegen, P. P. (2009). Social contacts as a possible mechanism behind the relation between green space and health. Health & Place, 15(2), 586–595. doi:10.1016/j.healthplace.2008.09.006

86
Maas, J., Verheij, R. A., Vries, S. De, Spreeuwenberg, P., Schellevis, F. G., & Groenewegen, P. P. (2009). Morbidity is related to a green living environment. Journal of Epidemiology and Community Health, 63(12), 967–973. doi:10.1136/jech.2008.079038
Madren, C. (2011). A Tree-‐lined Path to Good Health. American Forests Magazine. Retrieved from http://www.americanforests.org/magazine/article/a-‐tree-‐lined-‐path-‐to-‐good-‐health/
Maller, C., Townsend, M., Pryor, A., Brown, P., & St Leger, L. (2006). Healthy nature healthy people: contact with nature as an upstream health promotion intervention for populations. Health Promotion International, 21(1), 45–54. doi:10.1093/heapro/dai032
Martens, D., Gutscher, H., & Bauer, N. (2011). Walking in “wild” and “tended” urban forests: The impact on psychological well-‐being. Journal of Environmental Psychology, 31(1), 36-‐44. doi:10.1016/j.jenvp.2010.11.001
Matsuoka, R. H., & Kaplan, R. (2008). People needs in the urban landscape: analysis of landscape and urban planning contributions. Landscape and urban planning, 84(1), 7-‐19. doi:10.1016/j.landurbplan.2007.09.009
Matsuoka, R. H., & Sullivan, W. (2010). Urban Nature: Human Psychological and Community Health. In I. Douglas, D., Goode, M., Houck, & R., Wang (Eds.), The Routledge Handbook of Urban Ecology (pp. 408-‐423). Oxon OX: Routledge, Taylor & Francis Group. Retrieved from http://willsull.net/resources/Sullivan-‐papers/MatsuokaSullivan2011.pdf
Matthew McConnachie, M., & Shackleton, C. M. (2010). Public green space inequality in small towns in South Africa. Habitat International, 34(2), 244–248. doi:10.1016/j.habitatint.2009.09.009
Mental Health Commission of Canada. (2010). Making the Case for Investing in mental health. Retrieved from http://www.mentalhealthcommission.ca/English/system/files/private/document/Investing_in_Mental_Health_FINAL_Version_ENG.pdf
Merivale, W. (2015 February 4). Tree Therapy Is Not Just for for the Birds. Independent.ie. Retrieved from http://www.independent.ie/business/farming/tree-‐therapy-‐is-‐not-‐just-‐for-‐for-‐the-‐birds-‐30957614.html
Mitchell, R., & Popham, F. (2007). Greenspace, Urbanity and Health: Relationships in England. Journal of Epidemiology and Community Health, 61(8), 681–683. doi:10.1136/jech.2006.053553
Morani, A., Nowak, D. J., Hirabayashi, S., & Calfapietra, C. (2011). How to select the best tree planting locations to enhance air pollution removal in the MillionTreesNYC initiative. Environmental Pollution, 159(5), 1040-‐1047. doi:10.1016/j.envpol.2010.11.022
Morita, E., Fukuda, S., Nagano, J., Hamajima, N., Yamamoto, H., Iwai, Y., ... & Shirakawa, T. (2007). Psychological effects of forest environments on healthy adults: Shinrin-‐yoku (forest-‐air bathing, walking) as a possible method of stress reduction. Public health, 121(1), 54-‐63. doi:10.1016/j.puhe.2006.05.024
Nielsen, T. S., & Hansen, K. B. (2007). Do green areas affect health? Results from a Danish survey on the use of green areas and health indicators. Health & place, 13(4), 839-‐850. doi:10.1016/j.healthplace.2007.02.001

87
Nowak, D. J., & Dwyer, J. F. (2007). Understanding the benefits and costs of urban forest ecosystems. In Kuser, J.E. (Eds.), Urban and community forestry in the northeast (pp. 25-‐46). Netherlands: Springer. Retrieved from http://link.springer.com/chapter/10.1007/978-‐1-‐4020-‐4289-‐8_2
Nowak, D. J., Hirabayashi, S., Bodine, A., & Hoehn, R. (2013). Modeled PM 2.5 removal by trees in ten US cities and associated health effects. Environmental Pollution, 178, 395-‐402. doi:10.1016/j.envpol.2013.03.050
Ogneva-‐Himmelberger, Y., Pearsall, H., & Rakshit, R. (2009). Concrete evidence & geographically weighted regression: A regional analysis of wealth and the land cover in Massachusetts. Applied Geography, 29(4), 478–487. doi:10.1016/j.apgeog.2009.03.001
Olmstead, F. L. (1865). Yosemite and the Mariposa Grove: A Preliminary Report. Retrieved from http://www.yosemite.ca.us/library/olmsted/report.html
Park, B. J., Tsunetsugu, Y., Kasetani, T., Kagawa, T., & Miyazaki, Y. (2010). The physiological effects of Shinrin-‐yoku (taking in the forest atmosphere or forest bathing): evidence from field experiments in 24 forests across Japan. Environmental health and preventive medicine, 15(1), 18-‐26.
Putnam, R.D. (1995a). Tuning in, tuning out: The strange disappearance of social capital in America. PS: Political Science and Politics, 28(4), 664-‐683.
Putnam, R.D. (1995b). Bowling alone: America’s declining social capital. Journal of Democracy, 6(1), 65-‐ 78.
Richardson, E. A., Mitchell, R., Hartig, T., Vries, S. De, Astell-‐Burt, T., & Frumkin, H. (2012). Green cities and health: a question of scale? Journal of epidemiology and community health, 66(2), 160-‐165. doi:10.1136/jech.2011.137240
Robledo, C. A., Yeung, E., Mendola, P., Sundaram, R., Maisog, J., Sweeney, A. M., ... & Louis, G. M. B. (2014). Preconception Maternal and Paternal Exposure to Persistent Organic Pollutants and Birth Size: The LIFE Study. Environmental health perspectives, 123(1), 88. doi:10.1289/ehp.1308016
Roe, J. J., Thompson, C. W., Aspinall, P. A., Brewer, M. J., Duff, E. I., Miller, D., ... & Clow, A. (2013). Green space and stress: Evidence from cortisol measures in deprived urban communities. International journal of environmental research and public health, 10(9), 4086-‐4103. doi:10.3390/ijerph10094086
Sapkota, A., Chelikowsky, A. P., Nachman, K. E., Cohen, A. J., & Ritz, B. (2012). Exposure to particulate matter and adverse birth outcomes: a comprehensive review and meta-‐analysis. Air Quality, Atmosphere & Health, 5(4), 369-‐381. doi:10.1007/s11869-‐010-‐0106-‐3
Skiera, J. (2014, December 8). ‘Urban Forestry’ for Public Health Benefits with Jim Skiera. Public Health Newswire. Retrieved from http://www.publichealthnewswire.org/?p=11755
Station, P. N. R. (2010). Calculating the green in green: what’s an urban tree worth? Science Findings, 126, 1–6.
Stokowski, P. A. (1990). Extending the social groups model: Social network analysis in recreation research. Leisure Sciences, 12(3), 251-‐263.
Stone, B., Hess, J. J., & Frumkin, H. (2010). Urban form and extreme heat events: are sprawling cities more vulnerable to climate change than compact cities. Environmental health perspectives, 118(10), 1425-‐1428. doi:10.1289/ehp.0901879

88
Sugiyama, T., Leslie, E., Giles-‐Corti, B., & Owen, N. (2008). Associations of neighbourhood greenness with physical and mental health: do walking, social coherence and local social interaction explain the relationships? Journal of Epidemiology and Community Health, 62(5), 1-‐6. doi:10.1136/jech.2007.064287
Takano, T., Nakamura, K., & Watanabe, M. (2002). Urban residential environments and senior citizens’ longevity in megacity areas: the importance of walkable green spaces. Journal of epidemiology and community health, 56(12), 913-‐918. doi:10.1136/jech.56.12.913
Tallis, M., Taylor, G., Sinnett, D., & Freer-‐Smith, P. (2011). Estimating the removal of atmospheric particulate pollution by the urban tree canopy of London, under current and future environments. Landscape and Urban Planning, 103(2), 129-‐138. doi:10.1016/j.landurbplan.2011.07.003
Taylor, A. F., & Kuo, F. E. (2009). Children with attention deficits concentrate better after walk in the park. Journal of attention disorders, 12(5), 402-‐409. doi:10.1177/1087054708323000
Taylor, M. S., Wheeler, B. W., White, M. P., Economou, T., & Osborne, N. J. (2015). Research note: Urban street tree density and antidepressant prescription rates—A cross-‐sectional study in London, UK. Landscape and Urban Planning, 136, 174-‐179. doi:10.1016/j.landurbplan.2014.12.005
Terrapin Bright Green. (2015). 14 Patterns of Biophilic Design: Improving Health & Well-‐being in the Built Environment. Retrieved February 25, 2015 from http://clients.edmullen.com/terrapin/
Thompson, C. W. (2011). Linking landscape and health: The recurring theme. Landscape and Urban Planning, 99(3), 187-‐195. doi:10.1016/j.landurbplan.2010.10.006
Thompson, C.W., & Aspinall, P. A. (2011). Natural environments and their impact on activity, health and quality of life. Applied Psychology: Health and Well-‐Being, 3(3), 230-‐260. doi:10.1111/j.1758-‐0854.2011.01053.x
Thompson, C. W., Roe, J., Aspinall, P., Mitchell, R., Clow, A., & Miller, D. (2012). More green space is linked to less stress in deprived communities: Evidence from salivary cortisol patterns. Landscape and Urban Planning, 105(3), 221-‐229. doi:10.1016/j.landurbplan.2011.12.015.
Tsunetsugu, Y., Lee, J., Park, B. J., Tyrväinen, L., Kagawa, T., & Miyazaki, Y. (2013). Physiological and psychological effects of viewing urban forest landscapes assessed by multiple measurements. Landscape and Urban Planning, 113(May), 90-‐93. doi:10.1016/j.landurbplan.2013.01.014
Tsunetsugu, Y., Park, B. J., & Miyazaki, Y. (2010). Trends in research related to “Shinrin-‐yoku” (taking in the forest atmosphere or forest bathing) in Japan. Environmental health and preventive medicine, 15(1), 27-‐37. doi:10.1007/s12199-‐009-‐0091-‐z
Tyrväinen, L., Ojala, A., Korpela, K., Lanki, T., Tsunetsugu, Y., & Kagawa, T. (2014). The influence of urban green environments on stress relief measures: A field experiment. Journal of Environmental Psychology, 38(June), 1-‐9. doi:10.1016/j.jenvp.2013.12.005
Tzoulas, K., Korpela, K., Venn, S., Yli-‐Pelkonen, V., Kaźmierczak, A., Niemela, J., & James, P. (2007). Promoting Ecosystem and Human Health in Urban Areas Using Green Infrastructure: A Literature Review. Landscape and urban planning, 81(3), 167-‐178. doi:10.1016/j.landurbplan.2007.02.001
Ulrich, R. S. (1986). Human Responses to Vegetation and Landscapes. Landscape and Urban Planning, 13, 29–44. doi:10.1016/0169-‐2046(86)90005-‐8

89
Van den Berg, A. E., Maas, J., Verheij, R.A., & Groenewegen, P.P. (2010). Green Space as a Buffer between Stressful Life Events and Health. Social Science & Medicine, 70(8), 1203–1210. doi:10.1016/j.socscimed.2010.01.002
Van Dillen, S. M., Vries, S. De, Groenewegen, P. P., & Spreeuwenberg, P. (2012). Greenspace in urban neighbourhoods and residents' health: adding quality to quantity. Journal of Epidemiology and Community Health, 66(6), 1-‐5. doi:10.1136/jech.2009.104695
Velarde, M. D., Fry, G., & Tveit, M. (2007). Health Effects of Viewing Landscapes – Landscape Types in Environmental Psychology. Urban Forestry & Urban Greening, 6(4), 199–212. doi:10.1016/j.ufug.2007.07.001
Vries, S. De, van Dillen, S. M., Groenewegen, P. P., & Spreeuwenberg, P. (2013). Streetscape greenery and health: Stress, social cohesion and physical activity as mediators. Social Science & Medicine, 94, 26–33. doi:10.1016/j.socscimed.2013.06.030
White, M. P., Alcock, I., Wheeler, B. W., & Depledge, M. H. (2013). Would you be happier living in a greener urban area? A fixed-‐effects analysis of panel data. Psychological science, 24 (6), 920–928. doi:10.1177/0956797612464659
Williams, K., O'Brien, L., & Stewart, A. (2013). Urban health and urban forestry: How can forest management agencies help?. Arboricultural Journal: The International Journal of Urban Forestry, 35(3), 119-‐133. doi:10.1080/03071375.2013.852358
Yamaguchi, M., Deguchi, M., & Miyazaki, Y. (2006). The effects of exercise in forest and urban environments on sympathetic nervous activity of normal young adults. Journal of International Medical Research, 34(2), 152-‐159. doi:10.1177/147323000603400204
Economic Benefits
Anderson, L.M. & Cordell, H.K. (1985). Residential property values improve by landscaping with trees. Southern Journal of Applied Forestry, 9, 162–166.
Anderson, L.M. & Cordell, H.K. (1988). Influence of trees on residential property values in Athens, Georgia (U.S.A.): a survey based on actual sales prices. Landscape and Urban Planning, 15, 153–164.
Andrada, R. & Deng, J. (2012). Enjoying green cities: Assessing visitors’ attitude and preferences of urban forests in Washington, D.C. In C.L. Fisher and C.E. Watts, Jr. (Eds.), Proceedings of the 2010 Northeastern Recreation Research Symposium (Report No. GTR-‐NRS-‐P-‐94) (pp. 168-‐174). Newtown Square, PA: U.S. Department of Agriculture, Forest Service, Northern Research Station.
Anthon, S. & Thorsen, B. J. (2002). Værdisætning af statslig skovrejsning (Valuation of state afforestation). Dansk Skovbrugs Tidsskrift, 87, 73-‐108 (in Danish).
Anthon, S., Thorsen, B. J., & Helles, F. (2005). Urban-‐fringe afforestation projects and taxable hedonic values. Urban forestry & urban greening, 3(2), 79-‐91.

90
Arano, K. & Deng, J. (2012). Economic impact analysis of tree festivals: The case of the National Cherry Blossom Festival, Washington D.C. Presentation at 2012 Southern Forest Economic Workers Annual Meeting, March 19-‐21, Charlotte, North Carolina. Retrieved from http://community.wvu.edu/~jd021/Urban_Forest/Presentations/SOFEW.pdf
Arrow, K., Solow, R., Leamer, E., Portney, P., Randner, R., & Schuman H. (1993). Report of the NOAA Panel on Contingent Valuations. US Federal Register, 58(10), 4601–4614.
Ashworth, G. J. (2004). The blue-‐grey transition: heritage in the reinvention of the tourism resort. Retrieved from http://www.thebestinheritage.com/files/pdf/the_blue-‐grey_transition.pdf
Bateman, I. J., & Turner, R. K. (1993). Valuation of the Environment, Methods and Techniques: The Contingent Valuation Method. In Turner, R.K. (Ed.), Sustainable Economics and Management: Principles and Practice (pp. 120-‐191). London: Belhaven Press.
Bender, B., Gronberg, T. J., & Hwang, H. S. (1980). Choice of functional form and the demand for air quality. The Review of Economics and Statistics, 62(4), 638-‐643.
Bergstrom, T. C., & Goodman, R. P. (1973). Private demands for public goods. The American Economic Review, 63, 280-‐296.
Bolund, P., & Hunhammar, S. (1999). Ecosystem services in urban areas. Ecological Economics, 29, 293–301.
Borcherding, T. E., & Deacon, R. T. (1972). The demand for the services of non-‐federal governments. The American economic review, 62, 891-‐901.
Botkin, D.B., & Beveridge, C.E. (1997). Cities as environments. Urban Ecosystems, 1, 3–19.
Brasington, D.M., & Hite, D. (2005). Demand for environmental quality: a spatial hedonic analysis. Regional Science and Urban Economics, 35(1), 57-‐82.
Carson, R.T. (1991). Constructed markets. In J.B. Braden & C.D. Kolstad (Eds.), Measuring the Demand for Environmental Quality (pp. 121–162). Amsterdam: Elsevier Science Publishers B.V.
Clark, J., Kruidenier, W., & Wolf, K. (2007) National Research Plan for Urban Forestry, 2005-‐2015. National Urban and Community Forestry Advisory Council, USDA Forest Service. Retrieved from http://staff.washington.edu/kwolf/Reports/NUCFAC_Ntnl percent20UF percent20Rsrch percent20Plan.pdf
Cox, B. (2001, Mary 11). Boeing to Move Headquarters to Chicago. Fort Worth Star-‐Telegram.
Crompton, J.L. (2001). Parks and Economic Development (Report No. 502). Chicago, IL: American Planning Association.
Deng, J., Arano, K. G., Pierskalla, C., & McNeel, J. (2010). Linking urban forests and urban tourism: A case of Savannah, Georgia. Tourism Analysis, 15(2), 167-‐181.
Des Rosiers, F., Theriault, M., Kestens, Y., & Villeneuve, P. (2002). Landscaping and house values: An empirical investigation. Journal of real estate research, 23(1), 139-‐162.

91
Dombrow, J., Rodriguez, M., & Sirmans, C.F. (2000). The Market Value of Mature Trees in Single-‐Family Housing Markets. Appraisal Journal, 68(1), 39-‐43.
Donovan, G. H., & Butry, D. T. (2010). Trees in the city: Valuing street trees in Portland, Oregon. Landscape and Urban Planning, 94(2), 77-‐83.
Eriksson, L., & Nordlund, A. (2013). How is setting preference related to intention to engage in forest recreation activities? Urban Forestry & Urban Greening, 12(4), 481-‐489.
Escobedo, F., Northrop, R., Orfanedes, M., & Iaconna, A. (2009). FOR230/FR292: Comparison of Community Leader Perceptions on Urban Forests in Florida. School of Forest Resources and Conservation Department, Florida Cooperative Extension Service, Institute of Food and Agricultural Sciences, University of Florida. Retrieved from http://edis.ifas.ufl.edu/fr292
Escobedo, F., & Seitz, J. (2015). FOR217/FR279: The Costs of Managing an Urban Forest. School of Forest Resources and Conservation Department, Florida Cooperative Extension Service, Institute of Food and Agricultural Sciences, University of Florida. Retrieved from http://edis.ifas.ufl.edu/fr279
Escobedo, F. J., Nowak, D. J., Wagner, J. E., De la Maza, C. L., Rodríguez, M., Crane, D. E., & Hernández, J. (2006). The socioeconomics and management of Santiago de Chile's public urban forests. Urban Forestry & Urban Greening, 4(3), 105-‐114.
Florida, R. (2002). The Rise Of The Creative Class: And How It's Transforming Work, Leisure, Community And Everyday Life. New York: Basic Books.
Florida, R. (2005). Cities and the Creative Class. New York: Routledge.
Gabe, T. (2006). The Value of Creativity in the Northeastern United States. Paper presented to the NAREA Opportunities and Challenges Facing the Rural Creative Economy workshop, June 2006, Mystic, CT.
Gabe, T. M., Colby, K., & Bell, K. P. (2007). The effects of workforce creativity on earnings in US counties. Agricultural and Resource Economics Review, 36(1), 71-‐83.
Gasca, P. (2013, January 8). 5 Ways Small Retailers Can Compete (& Win). Inc. Magazine. Retrieved from http://www.inc.com/peter-‐gasca/5-‐ways-‐small-‐retailers-‐can-‐compete-‐win.html
Hardie, I., & Nickerson, C. (2004). The Effect of a Forest Conservation Regulation on the Value of Subdivisions in Maryland. WP 03-‐01 (Revised). Department of Agricultural and Resource Economics, University of Maryland, College Park. Retrieved from http://ageconsearch.umn.edu/bitstream/28575/1/wp03-‐01.pdf
Holcomb, B. (1994). City make-‐overs: marketing the post-‐industrial city. In J. Gold, & S. Ward (Eds.), Place Promotion: The Use of Publicity and Marketing to Sell Towns and Regions (pp. 115-‐132). Chichester, Sussex: John Wiley & Sons Ltd.
Hotte, N., & Sumaila, R. (2012). Potential economic impact of a tanker spill on ocean-‐based industries in British Columbia. Fisheries Centre Research, 20(7). Retrieved from http://www.fisheries.ubc.ca/webfm_send/155
Hurt, V. (2010). Silvicultural and composition measures in forests with the increased recreation function. In J. Fialova, J. (Ed.), Recreation and Environmental Protection, Proceedings of the Conference on Recreation and Conservation (pp. 103-‐110). Czech Republic: Kritiny.

92
Industry Canada. (2005). The Consumer Trends Report. Retrieved from https://www.ic.gc.ca/eic/site/oca-‐bc.nsf/vwapj/EN_CTR.pdf/$FILE/EN_CTR.pdf
Irwin, E.G. (2002). The effects of open space on residential property values. Land Economics, 78(4), 465-‐480.
Jay, M., & Schraml, U. (2010). Understanding the role of urban forests for migrants–uses, perception and integrative potential. Urban forestry & urban greening, 8(4), 283-‐294.
Jay, M., & Schraml, U. (2014). Diversity in mind: Towards a differentiated understanding of migrants’ recreational practices in urban forests. Urban Forestry & Urban Greening, 13(1), 38-‐47.
Jensen, R., Gatrell, J., Boulton, J., & Harper, B. (2004). Using remote sensing and geographic information systems to study urban quality of life and urban forest amenities. Ecology and Society, 9(5), 1-‐5.
Jim, C. Y., & Chen, W. Y. (2006). Recreation–amenity use and contingent valuation of urban greenspaces in Guangzhou, China. Landscape and urban planning, 75(1), 81-‐96.
Johnson, C. Y., Bowker, J. M., Bergstrom, J. C., & Ken Cordell, H. (2004). Wilderness values in America: does immigrant status or ethnicity matter? Society and Natural Resources, 17(7), 611-‐628.
Joseph Rowntree Foundation. (2001). Findings-‐Retailing, Sustainability and Neighbourhood Regeneration. Retrieved from http://www.jrf.org.uk/sites/files/jrf/1859354041.pdf
Kim, Y.S., & Johnson, R. (2002). The impact of forests and forest management on neighboring property values. Society and Natural Resources, 15, 887-‐901.
Konijnendijk, C.C. (2007). Decision-‐support for land-‐use planning through valuation of urban forest benefits. Allgemeine Forst-‐ und Jagdzeitung, 178(4), 7-‐84.
Kontoleon, A., & Pascual, U. (2007). Incorporating Biodiversity into Integrated Assessments of Trade Policy in the Agricultural Sector. Volume II: Reference Manual. Retrieved from United Nations Environment Programme (UNEP) website: http://www.unep.ch/etb/pdf/UNEP percent20T+B percent20Manual.Vol percent20II.Draft percent20June07.pdf
Laverne, R.J., Winson-‐Geideman, K. (2003). The influence of trees and landscaping on rental rates at office buildings. Journal of Arboriculture, 29(5), 281-‐290.
Lee, S. W., Taylor, P. D., & Hong, S. K. (2008). Moderating effect of forest cover on the effect of proximity to chemical facilities on property values. Landscape and Urban Planning, 86(2), 171-‐176.
Lo, A. Y., & Jim, C. Y. (2010). Willingness of residents to pay and motives for conservation of urban green spaces in the compact city of Hong Kong. Urban Forestry & Urban Greening, 9(2), 113-‐120.
Lovett, C., & Beesley, K. B. (2007). Where to live? Rural Canada’s creative class and residential preferences. Prairie perspectives: Geographical essays, 10(1), 47-‐66.
Luttik, J. (2000). The value of trees, water and open space as reflected by house prices in the Netherlands. Landscape and Urban Planning, 48, 161-‐167.
Maco, S. E., & McPherson, E. G. (2003). A practical approach to assessing structure, function and value of street tree populations in small communities. Journal of Arboriculture, 29(2), 84-‐97.

93
Mansfield, C., Pattanayak, S. K., McDow, W., McDonald, R., & Halpin, P. (2005). Shades of green: measuring the value of urban forests in the housing market. Journal of forest economics, 11(3), 177-‐199.
McLean, D. D., Jensen, R. R., & Hurd, A. R. (2007). Seeing the urban forest through the trees: building depth through qualitative research. Arboriculture and Urban Forestry, 33(5), 304-‐308.
McPherson, E.G. (2003). A benefit-‐cost analysis of ten street tree species. Journal of Arboriculture, 29(1), 1-‐8.
McPherson, E. G., Simpson, J. R., Gardner, S. L., Vargas, K. E., Xiao, Q., & WATT, F. (2007). New York City, New York: Municipal Forest Resource Analysis. New York: Center for Urban Forest Research, USDA Forest Service, Pacific Southwest Research Station. Retrieved from http://www.fs.fed.us/psw/programs/uesd/uep/products/2/psw_cufr687_NYC_MFRA.pdf
Michaels, D. (2002, January 24). Panel Backs Aid for Downtown, Victory; Task Force Pushes Tax Dollars for Projects, Asks Developers to Cooperate. Dallas Morning News.
Mitchell, R. C., & Carson, R. T. (2013). Using surveys to value public goods: the contingent valuation method. Resources for the future. Washington, DC: Resources for the Future.
Moons, E. (2002) Cost-‐benefit analysis of the location of new forest land. Working Paper Series n°2002-‐05. (Report No. K.U.Leuven-‐CES-‐ETE). Retrieved from Katholieke Universiteit Leuven website: http://feb.kuleuven.be/ete/downloads/ete-‐wp02-‐05.pdf
Morales, D.J. (1980). The contribution of trees to residential property value. Journal of Arboriculture, 1, 109-‐112.
Ode, Å. K., & Fry, G. L. (2002). Visual aspects in urban woodland management. Urban Forestry & Urban Greening, 1(1), 15-‐24.
Palmquist, R.B. (1982). Estimating the Demand for Air Quality from Property Value Studies. Manuscript. Raleigh: North Carolina State University.
Payne, B.R. (1973). The twenty-‐nine tree home improvement plan. Natural History, 82, 74-‐75.
Payne, B. R., & Strom, S. (1975). The contribution of trees to the appraised value of unimproved residential land. Valuation, 22(2), 36-‐45.
Perkins, G.M. (1977). The demand for local public goods: elasticities of demand for own price, cross prices and income. National Tax Journal, 30, 411-‐422.
Perkins, H. A., Heynen, N., & Wilson, J. (2004). Inequitable access to urban reforestation: the impact of urban political economy on housing tenure and urban forests. Cities, 21(4), 291-‐299.
Peters, K., Elands, B., & Buijs, A. (2010). Social interactions in urban parks: Stimulating social cohesion? Urban forestry & urban greening, 9(2), 93-‐100.
Philo, C., & Kearnes, G. (1993). Culture, history, capital: a critical introduction to the selling of places. In C. Philo and G. Kearnes (Eds.), Selling Places: The City as Cultural Capital, Past and Present (pp. 1–32). Oxford: Pergamon.

94
Price, C. (2003). Quantifying the Aesthetic Benefits of Urban Forestry. Urban Forestry and Urban Greening, 1, 123-‐133.
Robbins, M., Olewiler, N., & Robinson, M. (2009). An Estimate of the Public Amenity Benefits and Ecological Goods Provided by Farmland in Metro Vancouver. Retrieved from http://www.agf.gov.bc.ca/resmgmt/sf/publications/800100-‐5_PublicAmenity_ExecSummary_MetroVanc.pdf
Rogers, R.G. (1999). Towards an Urban Renaissance-‐Final Report of the Urban Task Force. London: Routledge.
Santerre, R.E. (1985). Spatial differences in the demands for local public goods. Land Economics, 61, 119-‐128.
Sherer, P. (2006). The Benefits of Parks: Why America Needs More City Parks and Open Space. San Francisco, California: The Trust for Public Land. Retrieved from http://www.eastshorepark.org/benefits_of_parks percent20tpl.pdf
Simmonds, D.C. (1999). The design of the DELTA land-‐use modelling package. Environment and Planning B, 26, 665-‐684.
Simmonds, D.C. (2001). The objectives and design of a new land-‐use modelling package: DELTA. In G. Clarke, M. Madden (Eds.), Regional Science in Business (pp. 159-‐188). Berlin: Springer.
Simpson, M.C., Pilcher, V., Tyrväinen, L., Collins, K., Martin, S., Strange, N., & Vuletic, D. (2008). The economic and social values of forests for recreation and nature tourism: a research overview. Cost Action E33: Forests for Recreation and Nature Tourism (FORREC). Retrieved from http://www.openspace.eca.ed.ac.uk/coste33/pdf/WG1_Values_and_benefits_of_Forests_for_Recreation_and_Nature_Tourism.pdf
State Forestry Administration, P. R. China. (2005). Forestry Yearbook of China 2004. Beijing: China Forestry Publishing House (in Chinese).
Statistics Canada. (2012). Focus on Geography Series, 2011 Census. Statistics Canada Catalogue no. 98-‐310-‐XWE2011004. Ottawa, Ontario. Analytical products, 2011 Census.Retrieved from https://www12.statcan.gc.ca/census-‐recensement/2011/as-‐sa/fogs-‐spg/Facts-‐csd-‐eng.cfm?Lang=eng&GK=CSD&GC=5915022
The Economist Intelligence Unit. (2014). Global Liveability Ranking and Report August 2014. Retrieved from http://www.eiu.com/public/topical_report.aspx?campaignid=Liveability2014
Thériault, M., Kestens, Y., & Rosiers, F.D. (2002). The Impact of Mature Trees on House Values and on Residential Location Choices in Quebec City. In Rizzoli, A.E. and A.J. Jakeman (Eds.), Integrated Assessment and Decision Support, Proceedings of the First Biennial Meeting of the International Environmental Modeling and Software Society (Vol. 2, pp. 478-‐483). Retrieved from http://www.iemss.org/iemss2002/proceedings/pdf/volume percent20due/191.pdf
Thorsnes, P. (2002). The value of a suburban forest preserve: estimates from sales of vacant residential building lots. Land Economics, 78(3), 426-‐441.
Tripadvisor. (2014) Top 25 Parks – World. Retrieved from http://www.tripadvisor.ca/TravelersChoice-‐Attractions-‐cParks-‐g1
95
Turley, L.W. & Milliman, R.E. (2000). Atmospheric effects on shopping behavior: A review of the experimental evidence. Journal of Business Research, 49, 193-‐211.
Tyrväinen, L. (2001). Economic valuation of urban forest benefits in Finland. Journal of Environmental Management, 62, 75–92.
Tyrväinen, L., & Miettinen, A. (2000). Property prices and urban forest amenities. Journal of environmental economics and management, 39(2), 205-‐223.
Urban Design Alliance and Institution of Civil Engineers. (2001). Better Places for Business.
Vesely, É.-‐T. (2007). Green for green: The perceived value of a quantitative change in the urban tree estate of New Zealand. Ecological Economics of Coastal Disasters — Coastal Disasters Special Section, 63(2-‐3), 605-‐615.
Walker, G. J., Deng, J., & Dieser, R. B. (2001). Ethnicity, acculturation, self-‐construal and motivations for outdoor recreation. Leisure Sciences, 23(4), 263-‐283.
Wang, S. (2013). Forest economics in an increasingly urbanized society: The next frontier. Forest Policy and Economics, 35, 45-‐49.
Whitehead, T. (2002). Road user charging and business performance: identifying the processes of economic change. Transport Policy, 9(4), 47-‐66.
Whitehead, T., Simmonds, D., & Preston, J. (2006). The effect of urban quality improvements on economic activity. Journal of Environmental Management, 80(1), 1-‐12.
Wolf, K.L. (2004). Nature in the retail environment: Comparing consumer and business response to urban forest conditions. Landscape Journal, 23(1), 40-‐51.
Wolf, K.L. (2005). Business district streetscapes, trees and consumer response. Journal of Forestry, 103(8), 396–400.
Wolf, K.L. (2009). More in Store: Research on city trees and retail. Arborist News, 18(2), 22-‐27. Retrieved from http://www.naturewithin.info/CityBiz/ArbNews.BizTrees.4.09.pdf
Wolf, K.L. (2012 October 20). Economics of City Trees. Sitelines: Landscape Architecture in BC, 14-‐17. Retrieved from http://www.naturewithin.info/New/BCSLA percent20Sitelines_October percent202012.Wolf.pdf
Wolf, K.L. (2014). Chapter 9: City trees and consumer response in retail business districts. In F. Musso and E. Druica (Eds.), Handbook of Research on Retailer-‐Consumer Relationship Development. Hershey PA: Business Science Reference.
Wyman, M., Escobedo, F., Stein, T., Orfanedes, M., & Northrop, R. (2012). Community leader perceptions towards coastal urban forests and hurricanes in Florida. Southern Journal of Applied Forestry, 36(3), 152-‐157.
Xie, G., Li, W., Xiao, Y., Zhang, B., Lu, C., An, K., ... & Wang, J. (2010). Forest ecosystem services and their values in Beijing. Chinese Geographical Science, 20(1), 51-‐58.

96
Xu, Z., Cheng, G., Zhang, Z., Su, Z., & Loomis, J. (2003). Applying contingent valuation in China to measure the total economic value of restoring ecosystem services in Ejina region. Ecological Economics, 44(2), 345-‐358.
Zabel, J. E., & Kiel, K. A. (2000). Estimating the demand for air quality in four US cities. Land Economics, 76(2), 174-‐194.
Zhu, P., & Zhang, Y. (2008). Demand for urban forests in United States cities. Landscape and urban planning, 84(3-‐4), 293-‐300.
Discussion
Baumeister, C. F. (2014). Higher education in urban forestry in North America and Europe: Profiling skills and competencies for the labor market of today and tomorrow (Master’s thesis). University of British Columbia, Vancouver, BC.
Federation of Canadian Municipalities (2012). The State of Canada’s Cities and Communities 2012. Retrieved from http://www.fcm.ca/Documents/reports/The_State_of_Canadas_Cities_and_Communities_2012_EN.pdf
Janse, G. & Konijnendijk, C. C. (2007). Commuication between science, policy and citizens in public participation in urban forestry – Experiences from the Neighbourhoods project. Urban Forestry and Urban Greening, 6(1), 23-‐40.
McFarlane, B. L., Beckley, T. M., Huddart-‐Kennedy, E., Nadeau, S., Wyatt, S. (2011). Public views on forest management: value orientation and forest dependency as indicators of diversity. Canadian Journal of Forest Research, 41(4), 740-‐749.
Neighbourwoods. (2015). About. Retrieved March 24, 2015 from http://neighbourwoods.org/index.html
Sheppard, S.R.J., Pond, E., & Campbell, C. (2008). Low-‐carbon, attractive, resilient communities: New imperatives for sustainable redevelopment. Conference Proceedings for 2008 Climate Change and Urban Design Council for European Urbanism Conference, Oslo, Norway. Conference Reader pp. 42-‐58.
Sinclair, A. J., Diduck, J., & Duinker, P. N. (2014). Elicitation of urban forest values from residents in Winnipeg, Canada. Canadian Journal of Forest Research, 44, 922-‐930.

i-‐Tree Eco i-‐Tree Design i-‐Tree Canopy i-‐Tree Streets i-‐Tree Vue i-‐Tree Species i-‐Tree Hydro i-‐Tree Storm i-‐Tree Pest Detection
Purpose Estimates benefits by analyzing forest structure
Estimates single and multiple tree benefits
Estimates canopy cover Assessment of street tree populations
Land cover assessment Appropriate species selection
Quantify impacts of changes in tree and impervious cover
Provide reliable numbers for risk management
Pest detection and monitoring program
Ecosystem Services valuated:Carbon storage ● ● ● ● ● ●
Pollution removal ● ● ● ● ● ●
Microclimate moderation ● ● ● ●
Stormwater regulation ● ● ● ●
Canopy interception ●
Aesthetics ●
Compensatory value ●
Spatial Scale Single tree, stand and city level Single tree and tree grouping Local scale to stand level Stand level Stand and landscape level Single tree level Watershed scale Community and region level
Single tree to city
Outputs Summary report including monetary valuation of urban forest benefits
Summary Report of Tree Benefits
Summary Report of percent cover plus estimate of benefits
Report with age distribution, growth models, replacement value
Summary report of benefits. Growth curves
Produces a ranked list of appropriate species
Summary report and DEM visualization
summary report and spreadsheet
Summary report
Inputs Inventory or plot sampling by land use class with meterological and pollution data
Aerial map data Survey data by cover class. Uses EPA's BenMap program to assess pollution
Street tree inventory data Satellite imagery derived from Landsat
USDA hardiness zones Hourly stream flow data Sample street segments Inventory or plot sample data
Capabilities Calculates structural and functional information with algorithms
Simulation of scenarios to forecast future benefits
Evaluate effects of disturbance, growth and mortality rates
Compares benefits between locations. Pest detection
Models future effects of silviculture scenarios
Relative rating of benefits at tree maturity
Simulates changes in water quality and quantity
Quantify damage from storm events
Integration of pest detection procedures
Software Web-‐based Web based with Google Map interface
Web based limited to Google Map interface.
Software requirement -‐ not desktop
National Land Cover Database (NLCD)
Web-‐based Stand alone application Web based With i-‐Tree Eco + i-‐Tree Streets
Intended users Municipalities, stewardship groups, general public, educators
Arboriculture and design professions
Municipalities urban foresters,researchers
Urban foresters, stewardship groups
Municipalities, landowners, stewardship groups
Property owners, neighbourhood organizations
Urban planners and resource managers
Disaster prevention organizations
Municipalities, stewardship groups
Limitations Dependent on quality of meterological and air pollution data
GIS may be needed for complex projects.
Estimates present benefits of street trees only
Dependent primarily on hardiness zone criteria alone
Requires management of complex data sets
Requires management of complex data sets
Knowledge in pest detection required
Summary of i-‐Tree Tools
Mitigation of storm damage through estimation of clean up efforts
Past pest disturbance events and pest population trends
Table 3. Summary of i-Tree tools and their functions, requirements and limitations.
8 APPENDIX
www.itreetools.org/resoures/archives.php
97

Pollution removal Biogenic VOC EmissionsPurpose Measure forest structure attributes Hourly amount of pollution removal, monetary value and
per cent (%) improved air qualityEstimates hourly Biogenic Volatile Organic Compound (VOC) emissions from vegetation
Calculates total stored carbon and gross and net carbon sequestered annually
Estimates effects of trees on building energy use and consequent emissions from power plants
Estimates precipitation intercepted by vegetation reduction in stormwater
Leaf Area (LA) Dry deposition of air pollution to trees of ozone (O3), sulfur dioxide (SO2), nitrogen dixide (NO2), carbon monoxide (CO) and particulate matter <10μm
Species, leaf dry weight biomass, air and leaf temperatures changes through transpiration
Estimation of tree biomass using forest derived allometric equations
Distance/direction to buildings. Trees< 6.1m ht. or > 18.3m distance to buildings are not considered
Effect of vegetation in reducing surface runoff as net avoided runoff
Leaf Area Index (LAI) Isoprenes, monoterpenes Tree energy effects Hourly ppt
Canopy Area Average VOC emissions annually Shading, windbreak and local climate Total annual surface runoff
Sampling design/plot size Air pollutant flux (F) Land use type species average diameter (dbh) Percent cover (%) buildings vs trees Ttree species / Land Use Type
Deciduous or coniferous Pollutant concentration in g/m3 (C) Genus or species type Tree condition Climate region Pervious vs impervious cover
Shading coefficient Aerodynamic resistance (Ra) Deciduous leaf-‐on estimates only Season = 153 frost free days/yr Deciduous vs coniferous (leaf type) Canopy ppt storage capacity
Condition class (0 -‐ 100%) Friction velocity Coniferous -‐ year round estimates Standardized growth rates per tree Tree size class Through canopy ppt
Land use class index Quasi-‐laminar boundary layer (Rb) Transpiration rate Building type (vintage) Evaporation
Species diversity Index Canopy resistance (Rc) Inventory project Infiltration time / Overland runoff
Insect pest effects Stomatal resistance Sample project Depression storage
(CLE = 0-‐5); closed -‐ 0, open -‐ 5, Crown light exposure
Dry deposition velocity (Vd) from LAI. Median Vd is 0.0128 m/s (CLE = 0-‐5); closed -‐ 0, open -‐ 5, Crown light exposure
Heating source type: electricity, natural gas, fuel oil, heat pump
Assumes precipitation (ppt) is uniformly distributed
EconomicValuation
Compensatory Value -‐ is based on trunk area, species, condition and location
Monetary value (metric ton) -‐ 2007 Producer Price Index (PPI): CO-‐$1 407, NO2-‐$9 906, SO2-‐$2 425, PM10-‐$6 614
Monetary value: $22.8t CO based on marginal social cost of CO emissions for 2001-‐2010
Estimated economic impact of change in building use: state average price per KWh
Value of ppt interception = net avoided runoff ($0.008963/gal.)
Leaf Area (m2) to Biomass (g/m3), for percent (%) improved air quality estimate: use local boundary layer height data (ht of pollutant mixing)
Genus-‐specific emission factors for 30 degrees C + PAR flux of 1000μ
Above ground biomass to whole tree biomass uses a root to shoot ratio of 0.26
Amount of carbon avoided calculated in MWh (cooling), Mbtus+MWh (heating)
S (m3) = Rh -‐ Ra :Annual avoided surface runoff / yr Difference btwn hypothetical and actual
LA = [ln(1-‐x)/-‐k * πr2 F = Vd*C: Pollutant flux (g/m2/s): Open grown trees multiplier 0.8, closed canopy trees -‐ 1.0
0.5 + (0.5 * tree condition):Tree condition adjustment S * LA / Σ LA for all trees = Ppt interception volume (m3)
LAI = ln(I/Io)-‐k, Vd = 1 / (Ra+Rb+Rc) : Deposition velocity (m/s): Species/genus conversion: 0.48 conifers, 0.56 hardwoods
Tree condition = 1 -‐ % dieback
Crown parameters: Y=bo+b1H+b2D+b3S+b4 I = F / F + M: Air quality Improvement in % (where M is total air pollutant mass)
Total tree weight biomass to total stored carbon: multiply by 0.5
Convert plot and tree heating and cooling effects to the state specific equivalent
Dbh: Y = bo+b1X+b2S
Compensatory Values from ISA and Council of Landscape and Tree Appraisers (CTLA) publications,
Tree cover, hourly NCDC weather data, and US Environmental Protection Agency (EPA) pollution [] monitoring data.
Air temperature from National Climatic Data Center (NCDC). Total solar radiaion from the National Solar Radiation Model
Climate region's electricity emissions factors Monetary value based on US Forest Service Tree Guide series
Monetary value -‐ median externality values for each pollutant in the US in metric tons
Inventory System from the National Oceanic and Atmospheric section EPA
Energy Information Administration (2003) Consumer Price Index (2003)
Update structural values Update median externality values Update Biogenic Emissions model Standard estimation error is difficult to derive Updated energy tables of energy use in buildings Reliance on hypothetical and actual scenarios
Dieback as proxy for condition effect of regional variability No national databaseUses land class as a proxy for location Biomass equations for urban and ornamental tree
species
Only 3 insect pests in model magnitued of urban tree decay
Literature Source
Nowak (2008) A Ground Based Method for Assessing Forest Structure and Ecosystem Services
Nowak (2006) Air Pollution Removal by Trees and Shrubs in the United States. Hirabayshi (2014) i-‐Tree Eco Dry Deposition Model Descriptions
Hirabayshi (2012) i-‐Tree Eco Biogenic Emissions Model Descriptions
Nowak (2002) Carbon Storage and Sequestration by urban trees in the United States
Simpson (1998) Urban Forest Impacts on regional cooling and heating energy use:Sacramento Case Study
Hirabayshi (2014) i-‐Tree Eco Precipitation Interception Model Descriptions
Inclusion of additional insect pests into model Pollutant dollar value information required Canadian Biogenic VOC emissions inventory Canadian carbon storage and sequestration data Canadian building types and conversion factors Value of ppt interception needed
Structural value of trees required Canadian climate regions needed
Relevance to Canada
Attribute Measured
Limitations
Other data required
Energy Use Stormwater Regulation
Conversion Factors and Equations
Summary of i-‐Tree's Model Descriptions
Air Quality ImprovementEcosystem Service Urban Forest Structure Carbon Storage and Sequestration
Considerations
Table 6. Summary of i-Tree Model Descriptions
www.itreetools.org/resources/archives.php
98