The Snowball Project · The Snowball Project. Kathy Brownridge, ... Anna Clements, Enterprise...
20
Agreeing metrics for research information management Kathy Brownridge Sarah Chaytor Anna Clements Lisa Colledge Stephen Conway Nick Fowler John Green Richard Lamont Abrams David Langley Ian McArdle Mary Phillips Scott Rutherford Peta Stevens UNIVERSITY OF CAMBRIDGE The Snowball Project
Transcript of The Snowball Project · The Snowball Project. Kathy Brownridge, ... Anna Clements, Enterprise...
Agreeing metrics for research information management Kathy Brownridge Sarah Chaytor Anna Clements Lisa Colledge Stephen Conway Nick Fowler John Green Richard Lamont Abrams David Langley Ian McArdle Mary Phillips Scott Rutherford Peta Stevens
UNIVERSITY OF
CAMBRIDGE
The Snowball Project

Kathy Brownridge, Director of Research and Innovation Services, University of Leeds, Leeds LS2 9JT.
Sarah Chaytor, Senior Research Associate, University College London, 2 Taviton Street, London WC1H 0BT. Anna Clements, Enterprise Architect, University of St Andrews, St Andrews, Fife KY16 9AJ. Dr Lisa Colledge, Snowball Project Manager, Elsevier, Radarweg 29, 1043 NX, Amsterdam. Dr Stephen Conway, Associate Director Research Services, University of Oxford, Wellington Square, Oxford OX1 2JD. Dr Nick Fowler, Director of Global Strategy, Elsevier, Radarweg 29, 1043 NX, Amsterdam. [email protected] Dr John Green, Honorary Research Associate, Imperial College London, London SW7 2AZ. [email protected] Richard Lamont Abrams, Analysis and Reporting Manager, University of Cambridge, Research Office, 16 Mill Lane, Cambridge CB2 1SB. Dr David Langley, Director Research and Enterprise Development, University of Bristol, Senate House, Tyndall Avenue, Bristol BS8 1TH. Ian McArdle, Research Systems and Information Manager, Imperial College London, London SW7 2AZ. Dr Mary Phillips, Director of Research Planning, University College London, 2 Taviton Street, London WC1H 0BT. Scott Rutherford, Director of Research and Enterprise, Queen’s University Belfast, Belfast, University Road, Belfast BT7 1NN. Peta Stevens, Principal Assistant Registrary, University of Cambridge, Academic Division, The Old Schools, Trinity Lane, Cambridge CB2 1TT.

1
evaluated and compared the tools that universities currently use to manage data related to research. It also aimed to identify problems with the approaches used and to publicise elements of good practice. The key conclusions were that:
• Institutions should work more collaboratively toharmonise their approach to research management processes and to minimise wasteful duplication of investment in research management systems
• Institutions and funders should work more col-laboratively to identify commonality in systems and processes so they might share data in more cost-effective and less resource-intensive ways
• Institutions should develop stronger relationshipswith suppliers and work with them to define theirneeds more clearly
• Anationalframeworkfordataandmetricstandardsshould be developed with stakeholders and used across the sector
• Suppliersshouldparticipate in thedevelopmentofdata standards with the sector in an effort to drive consistency in research systems
• Institutions, supported by funding organisations,should be encouraged to develop long-term system strategies focussed upon core research manage-ment processes and information needs
The study revealed that institutions and funders recog-nise data as an essential element in strategic manage-mentanddecisionmaking,but that there isa lackofconsensus among stakeholders on the metrics that should be used for measurement and evaluation (Fig-ure1).Thestudyshowedthat,withoutclearandsharedmetrics, institutionsfind that it isalmost impossible tobenchmark meaningfully and that as a result they are hampered in their ability to establish strategic direction.
Thelackofashareddefinitionofmetricsmakesitdif-ficult for institutions tomeasure performance againstpeer institutions and plan for the long term. It mitigates against suppliers developing data systems that could be used across the sector as each institution wants different data structures andmetrics. In part, this in-consistency is driven by the different perspectives of
Background
There is a growing recognition within universities of the need for research intelligence and performance man-agement frameworks. These can focus institutional strategies on research quality, raise the profile of aninstitution'sresearch,managetalent,andbuildahigh-qualityresearchenvironment.Thereis,however,con-siderable dissatisfaction with the data and tools avail-able to integrate information fromdisparate systems,anda frustration thatdifferentstakeholders, includingfunders,demandsimilarinformationindifferingformatswithdifferingdefinitions.Institutionsandfundershavetended to implement their own bespoke solutions and examples of success from collaborative approaches arefewandfarbetween,whetherwithinoroutsidethesector.Thisleadstoduplicatedeffort,systemsthataremanuallyintensive,andinefficiencyoverall.
This situation exists in all research-intensive countries aroundtheworld.IntheUnitedStates,forexample,therecently launchedSTARMETRICSprojectaddressesthe need to establish and measure how higher educa-tion institutions spend government grants.1Theprojectaims to create a repository of data and tools that will beuseful inassessing the impactof federalR&D in-vestments,agoalakintothatoftheUnitedKingdom’sresearchcouncils.Other,similarprojectsareunderwayinEurope.Itisclearthatthereisanappetiteformoredetailed research intelligence and for more sophisti-cated data tools and systems that extends beyond the UnitedKingdom.
research information management study, 2010
Toaddresssomeoftheseissues,during2010ImperialCollegeLondonandElsevierconducteda jointJISC-funded study of research information management within the higher education sector in England.2 The study reviewed the sector's efforts and experiences of implementing researchmanagementsystems,and
1MoreinformationontheSTARMETRICSprojectisavailableatwww.starmetrics.nih.gov 2JohnGreen,JoyvanBaren,etal.,Research information management: Developing tools to inform the management of research and translating existing good practice(2010).Availableatwww.researchdatatools.com/downloads/2010-research-information-management-2.pdf
agreeing metrics for research information management: the snowball Project

2
funders
• Institutionsandfundersshould work more collabora-tively to identify commonality insystemsandprocesses,so they may share data in more cost-effective and less resource-intensive ways
• Institutionsandfunders should be encouraged to develop long-term system strategies focussed upon core research management processes and information needs
• Suppliers should participate in the development of data standards with the sector in an effort to drive consistency in research systems
• Institutions should work more collaboratively to harmonise their approach to research managementprocesses,andtominimise wasteful duplication of investment in research management systems
• Institutions should develop stronger relationships with suppliers and work with them to definetheirneedsmoreclearly
a national framework fordatastandardsshould
bedevelopedwith stakeholders,andused
across the sector suPPliers
institutions
Figure1:SummaryofrecommendationsfromResearch information management: Developing tools to inform the management of research and translating existing good practice(2010)
different stakeholders; each regards their own way of interpretingthedatathroughspecificmetricsascritical,rather than considering it as one particular view on what could essentially be a common set of metrics shared byallstakeholders.Withnoholisticapproach,itisnotunusual for institutions to submit different values for the same data point in various external data-gathering exercises in order tomaximise the benefit to the in-stitution(forexample,byinterpretingthedefinitionsofspecific data points, such as the precisemeaning of'researcher',tosuitthepurposeathand).
The focus on and pressures of external data requests have meant that institutions have allowed the demands of other stakeholders to determine the data and the data-definitionstheycollectandmeasure,ratherthanconsidering what would be best suited to their own pur-poses. The study suggested that an agreed framework of metrics that could be shared and used across the sector would ensure cost-effectiveness in the long run and,itwashoped,increasethecompetitivenessoftheUKasawhole.
The results of the study were presented at a sector-wideworkshopheldatImperialCollegeLondoninAu-gust2010.Stakeholdersatthisworkshopagreedthatit was essential that the issues and opportunities for improvementidentifiedbythestudybeaddressed,andthat the recommendations made in the study should formthebasisoffurtherwork.Manywhoparticipatedin either the study or the results workshop voiced their belief that work needed to be done to harmonise re-searchinformationsystems,andthatthejointImperialCollege/Elsevier study shouldnot gather dust on theshelf and have no practical application.
second Phase Project: snowBall
Following the completion of the JISC-funded studyand the publication of the final project report, theImperial College/Elsevier team set about planning asecond phase of work that would address and build on the recommendations. This was launched as a
3
self-funded,voluntaryprojectinNovember2010.Theprojectobjectiveswereagreedas:
• Defineasetofmetricsneededforeffectiveandlong-term institutional research information management and reach a consensus on how these metrics should be calculated
• Defineallpossiblesourcesofthedataelementsofthe metrics calculations
• Establishathree-yearroadmaptoenabletheadop-tion of that vision within the higher education sector andacrosskeystakeholdergroups(HEIs,funders,research councils, government departments andother agencies, private funding bodies, suppliers,and other administrative entities)
The initial JISC-funded study found that theways inwhich institutions hold research-related data and perform calculations based on that data differ across thesector,andthatbecauseofthislackofconsistency,making meaningful comparisons between institutions isdifficult.Thefocusofthesecondphaseprojectistoaddress these issues by enabling institutions to bench-mark against key research performance and activity metrics on a like-with-like basis.
The Snowball team is aware that there are severalcommerciallyavailablebenchmarkingproducts,includ-ingElsevier’sSciValStrata,ThomsonReuter’sInCites,andAcademicAnalytics’FacultyScholarlyProductivitydatabase.Nevertheless, the teamconsiders it impor-tant to reach consensus on a common set of metrics and comparisons that could be adopted in the UK,regardless of the more customised work being done elsewhere. It is expected that this consensus will en-able leaders of research and research strategy within institutions to better monitor and manage their research activities,and,inturn,thatitwillinformdecisions(e.g.by key funders and government) that have the potential toincreasetheefficiencyandeffectivenessoftheUKresearch base as a whole.
The JISC-funded study also found that many of theresearchinformationsystemsspecifiedbyuniversitiesinEngland tried tomeet theneedsofmultiple, oftencompeting,stakeholders.Theseattemptstosatisfyasmany internal stakeholders as possible often resulted only in widespread disillusionment and dissatisfaction with the systems eventually implemented. The les-sons of this have been applied to the second phase projectasawhole,whichdoesnotattempttoaddressall the issues faced by the sector. For example, theprojectwilladdresssomeof theneedsrelated to the
2014 Research Excellence Framework (REF) wheretheycoincidewithbroaderaims,butthesearenottheproject'sprimaryobjectivesanditdoesnotseektocre-ate the optimalREFmanagement tool. Similarly, theprojectdoesnotaimtoreplicate, redesignorreplaceinternal research management systems (including op-erationalsystemssuchasresearchcostingorfinancesystems) or metrics whose value is primarily internal within individual institutions.
Rather, theproject hasa tightly definedoverall goal:to facilitate external benchmarking by ensuring that institutions canconfidently compare researchdata ina like-with-like manner. It aspires to facilitate and drive the storage and provision of meaningful data for use by higher education institutions and other stakehold-ers.BybuildingontheresultsoftheinitialJISC-fundedstudy to develop and share an understanding of the needs of higher education institutions for metrics and for the data elements needed to calculate them, theprojectaimstomakethepracticeofresearchinforma-tionmanagementeasierandmoreefficient.Achievinga consistent understanding of metrics will simplify interactionbetweeninstitutions,suppliersandfunders,enablemoreeffectivebenchmarking,andimprovetheefficiencyofdatamanagement.
Thescopeofthesecondphaseprojectwasexpandedbeyond England to ensure that consensus was asbroadly relevant as possible. Eight universities havebeen approached and have agreed to collaborate on the project. These are: Imperial College London,Queen'sUniversityBelfast,UniversityCollegeLondon,UniversityofBristol,UniversityofCambridge,Univer-sity of Leeds,University ofOxford, andUniversity ofStAndrews.Ofthese,sixhadparticipatedintheinitialJISC-fundedstudyandweresupportiveofactingonitsrecommendations(StAndrewsandQueen’sUniversityBelfast were not included in the initial project as itsscopewaslimitedtoEnglishinstitutions).TheSnowballteamiscomprisedofthecoreElsevier/ImperialCollegeteamthatconductedtheinitialJISC-fundedstudyanda representative from each of the Snowball partnerinstitutions, typically directors of research offices orsenior staff responsible for research management and strategy.By linking institutionswithasupplierandbybringinginfunders'perspectiveswhereverpossible,itishoped that a holistic view of the system will be realised. Starting inNovember2010,aseriesof regularwork-shops–heldatUCLandfacilitatedbythecoreteam–wereorganised.Thesehaveallowed theSnowballpartner institutions to shape the project's objectives,toagreedefinitionsofmetricsandsourcesofdata,to

4
core team:ImperialCollegeLondonteam+Elsevier
snowball team:coreteam+voluntary partner institutions
Earlyconverts:Snowballteam+enablersinbroaderhigher education• PVCRsofSnowballpartnerinstitutions• OtherHEIsthatcomeonboard• Otherenablingstakeholders,e.g.suppliers,
fundingbodies,administrativeentities
core team:• Getstheballrolling,keeps
it rolling• Managesscope,deliverables,
timing• Doesworkshoppreparation
and write-ups• Leadscommunicationof
recommendations and follow-up• Contributesresourcesand
assets as needed
snowball team:• Helpsrefinedeliverablesand
buildconsensusforthemetrics,sources,andplanstodeliver
• Sustainsandbuildsmomentum;shares metrics and data internally,bringsonboardothers internally and externally
Earlyconverts:• Adoptagreedmetrics• Facilitateandpromotetheir
adoption by others
Figure2:‘Snowballeffect’
shareexperiencesandknowledge,andtodiscussanddeterminetheproject'sprogressandoutcomes.
Thesecondphaseprojecthasbeennamed'Snowball'because it aims to create a 'snowball effect' across thesector.In2009-10theeightuniversitieswithintheSnowballpartnershipaccountedfor37%ofthevalueof competitive research proposals awarded by the UKresearchcouncilsandwere responsible forover37%ofUK-authoredarticlesand38%ofUKcitations.Taken together, they therefore providea strongandinfluential core fromwhich to enlarge the sphere of
influenceacrossthesector.ItishopedthattheeightSnowball partner institutions will drive momentumand build support for a set of standardizedmetrics,sourcesandmethodologiessharedacrossUKhighereducation institutions, funding bodies, and otherstakeholders (Figure 2), and that by developing aconsensusondefinedmetrics,datasources,andanimplementation roadmap, the sector as awholewillbe encouraged to adopt standardised metrics. With thisframeworkdefinedandagreed,itwillallowinstitu-tions to develop their own tools that can benchmark consistently in the external context.

5
definition of the landscaPe of research activities
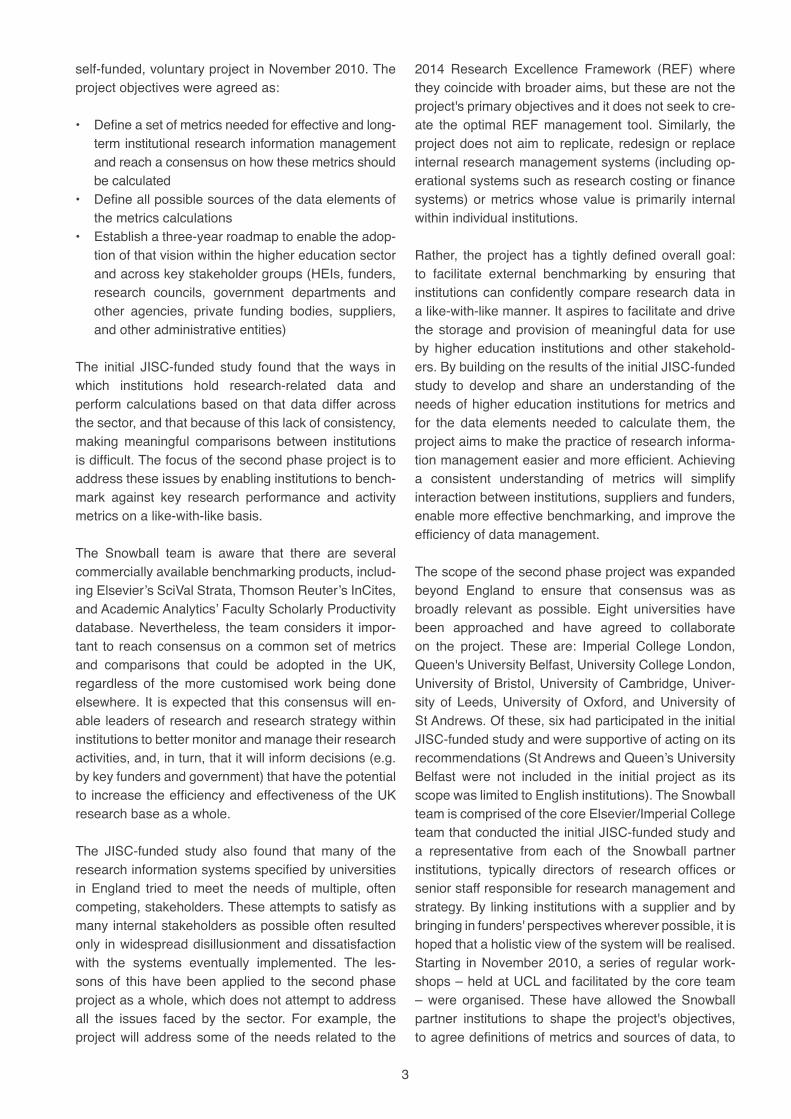
Previousresearchhasshownthatuniversityresearchmanagementofficesareaskedtoperformamultitudeof functions.3ThefirsttaskoftheSnowballteamwasthereforetodefinethelandscapeofresearchactivitiesthat would be included in the project's scope. Thisincludedconsiderationofinputs,throughputs,andout-putsoftheresearchprocess,andidentifiedbroadsetsofmeasures thatwere associatedwith each. Inputs,throughputs, and outputs were further distinguishedin three ways: those connected to research grants,postgraduateeducation,andenterpriseactivities.TheSnowballteamalsoidentifiedacommonsetofdenomi-nators that could be applied to metrics at various levels of aggregation, such as principal investigator, unit ofassessment,orfundingbodycategoriesandthemes.
Within this landscape of research activities and de-nominators, the Snowball team decided to prioritiseand develop metrics for a subset of core research (as opposed to educational) activities. It was similarly de-cided to focus on a subset of denominators that would be agreed by theSnowball teamas themost usefulandpractical,andonesforwhichtherecouldbeagreedand robust data sources (Figure 3).
definition and Prioritisation of snowBall Project metrics
Theprimarygoaloftheprojectwastodeliverasetofconsistentlydefinedmetricsthatcouldbeusedbyinsti-tutions for external benchmarking. Within the prioritised areasofresearchactivity,theSnowballteamidentifiedsixty-six separate metrics. These reflected Snowballteam members' experience and knowledge of internal and external stakeholders’ demands for information,and their understanding of the type of information that is,orcouldbe,collectedinternallyandexternally.
TheSnowball team isaware thatavarietyofstake-holderscollectverysimilardatabutthatthedefinitions theyusevaryconsiderably;‘grantsuccessrates’and‘researcher’,forexample,arecalculatedanddefined
inavarietyofwaysbydifferent institutions.Discus-sions in the Snowball team workshops have beeninvaluable in exposing these differences and explor-ing how core terms like these can be aligned across the sector.
Therearealsodifficultiesandsomeresistancetotheuse of any kind of metrics in the arts and humanities. Reasonsforthisincludethepoorcoverageofthemajordatabases, differences in referencing behaviour, andthe speed of publication. While recognising that some metricswillbemorerelevantinsomefieldsthanothers,theprojectaimstobeinclusiveacrossallsubjectfieldsrepresented within an institution. Differences acrossdisciplines were kept in mind during discussions.
Snowball partner institutionswereclear in their com-mitment to identifying a shared framework for research metrics, butwere also keen that any presentation ofthedatashouldallow for flexible interrogation.By itsnature, institutional benchmarking requires users to‘slice and dice’ data in a number ofways to answerkeyquestions.Toensurethiswaspossible,thepivotalunits – the denominators – through which data could be manipulatedwereidentifiedbytheSnowballteam.AlltheSnowballpartnerinstitutionsexpressedadesiretomeasure performance and activity through volumes of researchgrantapplicationsandawardsovertime,forexample,andwantedtointerrogatethismetricfromanumber of perspectives, including by department, byfunder type, byUnit ofAssessment, or by a specificresearchtheme.Denominatorslikethesewouldenabledetailed interrogation of key benchmark measures and giveuserstheflexibilitytoperformmeaningfulanalysisof the data.
Snowball team members were asked to rate eachmetric in terms of importance and perceived ease of capture in an attempt to identify a manageable number forthepurposesoftheproject.Theresponsesshowedthat almost all themetrics identifiedwere thought tobe important but that team members felt ill-equipped tomakea fully informed judgementon theeffort thatcouldberequiredtocaptureeachmetric.Asaconse-quence, itwasagreedtoworkonall themetrics thatscored highly for importance. The result was a list of aroundfiftymetricsthatwereagreedtobecrucialforthepurposesofresearchmanagement(Figure4).
3JohnGreenandDavidLangley,Professionalising Research Management(2009). Availableatwww.researchdatatools.com/downloads/2009-professionalising-research-management-2.pdf
6
Figure3:Definitionofthelandscapeofresearchactivities
Measuresinscope forProjectSnowball (current phase)
• ResearchGrants
1. research inPuts
1a)Researchapplications1b)Researchawards• Price/Overhead
recovery• Philanthropy
2a)Researchspend(income)
• Spaceutilisation• Staffrecruitment• Start/enddate
slippage
3a)Publicationsandcitations
3b)Esteemmeasures3c)Collaboration
(co-authorship)• Socio-economic
impact
1c)PGRvolumes• PGTvolumes• InternationalPGT
volumes• UGtoPGconversion
rates
• PGExperience–contact time
• PGExperience– facilities
• Alumni/destinationofleavers
3d)Completionrates• Skillsdevelopment
(impact)
1d) Industrial income• Industryengagement
• Researcher,authors• Principal/Co-
investigators• Academicstaffby
category• Researchassistants• PGRStudents• UG/PGTStudents• Postdoctoralstaff• Supportstaff
• Institution• Faculty• Department/School• UnitofAssessment
(UoA)• HESAcostcentre• Groups/clusters• Fundersbytype:RC
etc.• Centres/Institutes
• Standardgrants• Strategicinitiatives
(Calls)• Grandchallenges• Subjectareas• Keywords
• Contractturnaroundtimes
• Industryresearchspend (income)
• UGtoPGconversionrates
3e)Patenting3f)Licensingincome3g)Spin-outgeneration/
income• KTPsnumbers• Consultancyincome
2. research Process
3.RESEaRch outPuts/outcomes
• Enterpriseactivities
4) denominators 4a. (numBer of) PeoPle
4B. organisations 4c. themes/ schemes
• PostGraduateEducation

7
data collection exPeriment
With fifty or so metrics and a set of denominatorsidentified,theSnowball teamdecidedthattotesttheconcept, itwouldtrytogatherthedataandcalculateanddelivermetricstotheSnowballpartnerinstitutions.Asa result, theSnowball teamsetabout testing theviability of data collection and metrics calculation by calculating the metrics for a small number of research-ers at each partner institution. It was agreed that each oftheSnowballpartner institutionswouldcollectandcontribute data on ten anonymised researchers in chemistry, and that Elsevier would contribute Sco-pusdataoneach identifiedresearcher toenable thecompletion of publication, citation, and collaborationmetrics.4Snowballpartner institutionswereasked tocomplete an Excel-based template of data compo-nents for eachmetric,whichwas fed to the productdevelopment team at Elsevier, who constructed asimple prototype analytical benchmarking tool in the formofabasicdashboard.Confidentialitywasaconcern:partneruniversitiesadheredtoconfidentialityagreements and it was agreed that metrics calculated for individual researchers (as opposed to aggregated data) would only be accessible by the university with which the researcher was connected and which had supplied the relevant data.
Theexercisewasinformativeandrevealing.Providingdata on just ten researchers within an agreed threeweek timeframe proved to be a huge challenge for theSnowballpartner institutions.Estimationsofeaseof capture proved to be way off mark; information on publications, citations, andcollaboration thatwas ini-tiallythoughttobedifficulttofindprovedtobereadilyobtainablethroughScopus,whileotherinformationthathad been thought easy to capture remained elusive. None of the Snowball partner institutions were abletoprovideallthedataagreedupon,andallfoundthismethod of data collection time consuming and labour intensive. One institution could not provide any data in the required timeframe. Institutions submitted the data to theElsevierproductdevelopment teamindifferentformats that reflected their different approaches andsystems,andasaresultsignificantdatacleansingwasnecessary before any form of cross comparison could
be made. The key challenges institutions faced when they attempted to collect the agreed data included:
• Datawerenotreadilyavailable• Therequesthadtobecompletedmanually• Data were spread across multiple departments
and/or systems with different ownerships within the institution and therefore permissions were needed to access it
• Thetimeperiodtogatherthedatawastooshort• Some concerns about confidentiality remained,
especially in relation to third stream (i.e. commercial) activity;spin-out,patenting,andlicensinginformationwasviewedascommerciallyconfidential
• Engagementwithindustrywasdifficulttoreportassome of these activities were not mapped to the researchers involved
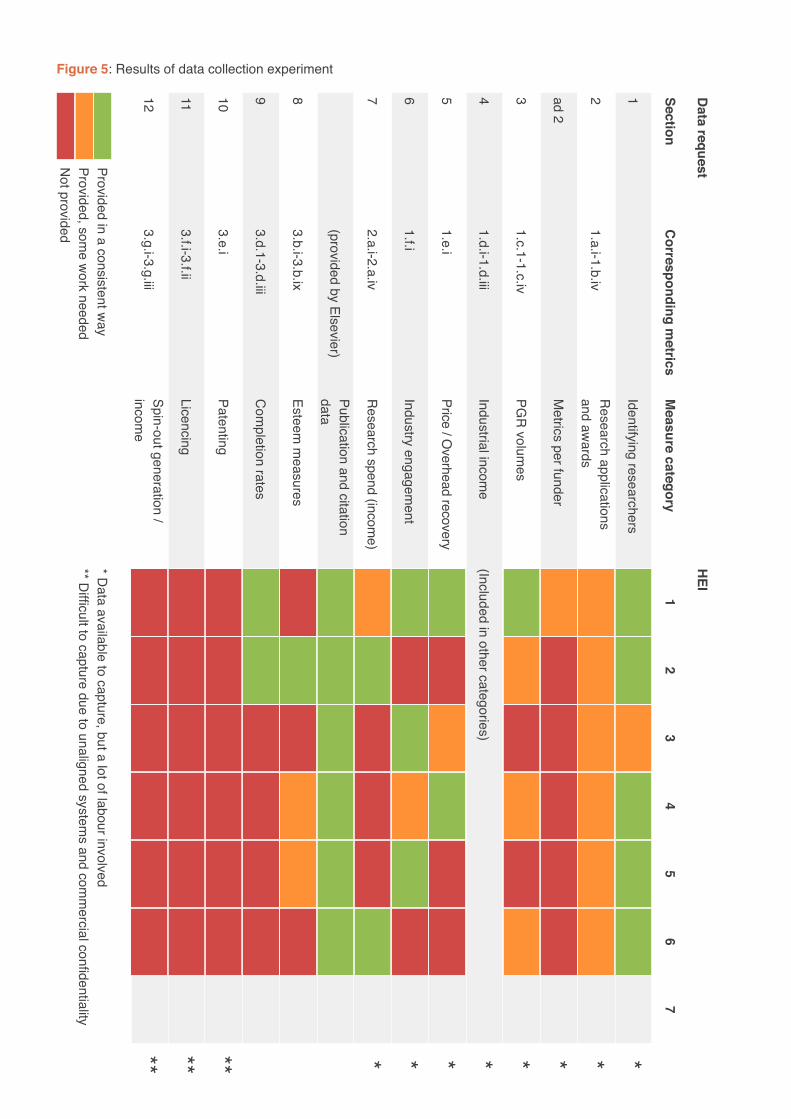
A further challenge, encountered when the develop-ment team began to combine the data to calculate the metrics, was that some institutions had preferred toprovide the data as information aggregated for all ten chemistryresearchers,asopposedtoindividually.Asaresultofthesechallenges,themetricsthatcouldbecal-culated for each institution were patchy and incomplete (Figure 5). It was quickly concluded that it would not be possibletoscale-uptheapproachused,andthatitwasunrealistic to think that it would be possible to populate pre-definedtemplatesofdatacomponentsevenforalargersubsetof researcherswithinan institution,andcertainly not across the whole sector.
Key lessons thatwere taken from thedatacollectionexperiment included:
The availability of data• Snowball partner institutions were mostly able to
provide application and award data, postgraduateresearchvolumes,andcompletion rates,butdataon industrial consultancy, patenting and licensing,and esteem measures were either not readily avail-ablewithintheirresearchmanagementsystems,orinstitutions were not prepared to share this poten-tially sensitive information.
• Implication: TheSnowball team agreed that alter-nativemethodsandsourcestocaptureandreflectpatenting and licensing, and esteem measuresneeded to be sought.
4SevenoftheeightSnowballpartnerinstitutionsparticipatedinthedatacollectionexperimentandprototypebenchmarkingtool; StAndrewshadnotformallyjoinedtheprojectwhentheexperimentcommenced.

8
Figure4:Resultsofmetricsprioritisation
Important,perceivedashardtoget
1.b.i Percentofgrantswonvspercentofgrantsavailable1.b.ii Amountofgrantswonvsamountofgrantsavailable1.e.i FECversusamountawarded1.f.i Numberofacademicsinvolvedinenterpriseactivities3.a.ii Total number of articles authored over lifetime3.a.iv Total citations per article3.a.vi Averagecitationsperarticle3.a.vii FieldWeightedCitationImpact3.a.viii FWCIperarticle3.a.x Field normalized h-index3.a.xi PercentageofarticlesintopXpercentileofcitationsreceived3.a.xii Numberofbooksauthoredinprioryear3.a.xiii Total number of books authored over lifetime3.a.xiv Numberofbookchaptersauthoredinprioryear3.a.xv Total number of book chapters authored over lifetime3.a.xvi Numberofconferenceproceedingsauthoredinprioryear3.a.xviii Numberof[X]authoredinprioryear3.a.xix Numberof[X]authoredoverlifetime3.b.i Numberofspecific,highquality(competitive)awards3.b.iii Numberofmembershipstohighqualityorganisations/learnedsocietieseachyear3.b.v Numberofprestigiousawards/medalsbyyear3.b.vi Numberofnationalhonoursawarded3.b.x Numberofoutreachactivities(publiclectures,exhibitions,workshopsetc.)3.b.xi Contributionstopublicpolicy3.b.xii Numberofvisitstopolicy-makers3.b.xiv Journaleditorialboardmembership3.c.i Percentofarticlesco-authoredwithanon-homeHEIauthor3.c.ii Percentofarticlesco-authoredwithanon-UKauthor,20093.d.i Percentagepassrateforresearchmasters3.d.ii Percentagepassrateforresearchdoctorates3.d.iii Percentageresearchdoctoratescompletedwithinthreeyears3.e.i Numberofpatentsgrantedperyear3.e.ii Incomefrompatentsperyear,beforeinternaldistribution3.f.i Numberoflicensesgrantedperyear3.g.ii Numberofspin-outslastingthreeyears3.g.iii Income from spin-out activity per year
Lessimportant,perceivedashardtoget
2.a.iv Percentageofactualspendversusbudgetedspendbymonth3.a.ix h-index3.a.xvii Numberofmeetingabstractsauthoredinprioryear3.b.ii Numberofprize‘placings’3.b.iv Numberofmajorindustrialadvisorshipseachyear3.b.vii Numberofspeakerinvitationsperyear3.b.viii Numberofconferencesparticipatedin/organisedperyear3.b.ix Numberofmediaappearancesperyear3.c.iii Percentofarticlesco-authoredwithanauthorex-discipline3.c.iv NumberofdistinctivecompetenciesperHEI3.c.v Percentofbooksco-authoredwithanon-homeHEIauthor3.c.vi Percentofbooksco-authoredwithanon-UKauthor3.c.vii Percentofbooksco-authoredwithanauthorex-discipline

9
Important,perceivedaseasytoget
1.a.i Percentofgrantapplicationsperyearthataresuccessful1.b.iii Numberofgrantswonperyear,identifyingadhominem1.b.iv Amountofgrantfundswonperyear,identifyingadhominem1.c.ii Numberofpostgraduatesregisteredforresearchdoctoraldegreesbyyear1.c.iv Numberofresearchdoctoraldegreesawarded/year1.d.i Volumeofindustrialincomeyearonyear1.d.ii Volumeofindustrialincomeperyearversus3yearaverage1.d.iii Top10industryfundersovertime2.a.i Volumeofresearchspendbymonth2.a.ii Volumeofresearchspendbyyear2.a.iii Ratioofresearchspendfromgovernment:vs.nongovernmentsources3.a.i Numberofarticlesauthoredinprioryear3.a.iii Total citations per article3.a.v Averagecitationsperarticle3.b.viii Numberofconferencesparticipatedin/organisedperyear3.f.ii Income from licensing activity per year before internal distribution3.g.i Numberofspin-outsformedperyear
Lessimportant,perceivedaseasytoget
1.c.i Numbersofpostgraduatesregisteredforresearchmastersdegreesbyyear1.c.iii Numberofresearchmastersdegreesawarded/year
10
1.a.i-1.b.iv2
Researchapplications
and awards
ad2Metricsperfunder
1.c.1-1.c.iv3
PGRvolum
es
1.d.i-1.d.iii4
Industrial income
1.e.i5
Price/Overheadrecovery
1.f.i6
Industry engagement
2.a.i-2.a.iv7
Researchspend(income)
(providedbyElsevier)Publicationandcitationdata
3.b.i-3.b.ix8
Esteemmeasures
3.d.1-3.d.iii9
Com
pletionrates
3.e.i10
Patenting
3.f.i-3.f.ii11
Licencing
3.g.i-3.g.iii12
Spin-outgeneration/incom
e
1Identifying researchers
correspondingm
etricssection
Datarequest
Measurecategory
*Dataavailabletocapture,butalotoflabourinvolved
Providedinaconsistentway
**Difficulttocaptureduetounalignedsystem
sandcommercialconfidentiality
Provided,somew
orkneededNotprovided
(Included in other categories)
12
34
56
7
********** ** **
hei
Figure5:Resultsofdatacollectionexperiment
11
Manuallabourindatacollection• Wheredatawereavailable, itoften tookconsider-
ableefforttoprovideitintherequestedformat.MostSnowball partner institutions found it difficult andlabour-intensive to gather all funding data for justten researchers.
• Implication: The Snowball team agreed that on alarger scale an automated or decentralized approach would be necessary and that where possible the group should consider working directly with potential central data providers (e.g. funding bodies).
Definitions• The Snowball partner institutions have in-depth
knowledge of research administration and engag-ingwith industry throughpatenting, licensing,andspin-outs,butmechanismsneedtobeidentifiedsothat data can be reported in a suitable way.
• Implication: The Snowball team agreed to form aworkinggroupofexpertstorefineandagreedefini-tions,andtoeliminateinconsistencies.
Confidentiality• SomeSnowballpartnerinstitutionschosenottolink
fundingdatatoresearchersdespiteaconfidentialityagreement that information on individual research-ers would only be available to the institution with which that individual was connected.
• Commercial confidentiality prevented universitiesfrom reporting on patenting and licensing metrics.
• Implication: The Snowball team agreed that theyshouldconsiderstrengtheninglegalassurances,whilecontinuing to gather metrics on an opt-in basis.
PrototyPe Benchmarking tool
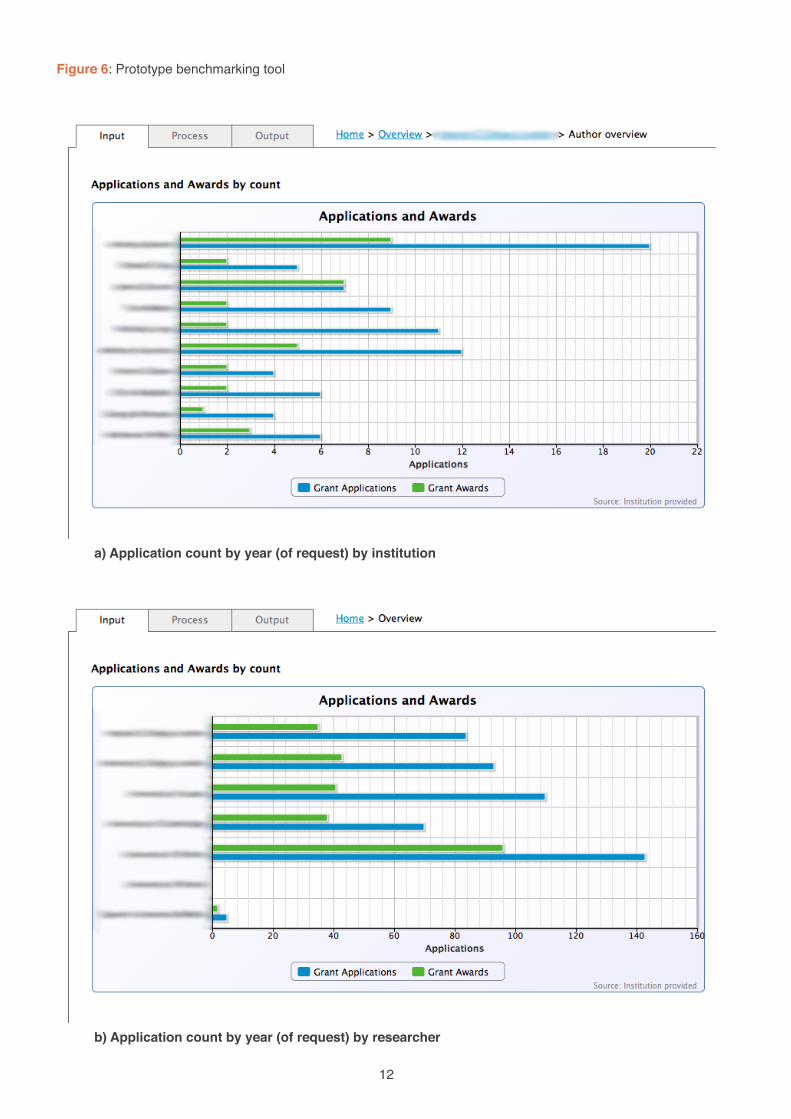
Despitetheconsiderablechallengesofgatheringandcleaning the data, the Elsevier product developmentteam was able to create a simple analytical bench-marking tool (Figure 6). This dashboard was shared among the Snowball partner institutions, who wereable to compare and interrogate the data that had been collected. The prototype allowed basic benchmarking against a series of metrics with two denominators: allSnowballpartner institutionscouldaccessabasic
aggregation of ten chemistry researchers at each in-stitution,andtheinstitutionwithwhichtheresearcherswere connected could view individual data for each of their researchers. The prototype tool included basic drag-and-drop functionality and provided links to the underlying data to allow users to drill down into data sets.Publication,citation,andcollaborationdatawerelinkeddirectlytoScopustoallowtheabstractsofrel-evantarticlestobeviewed.Noattemptwasmadeatthisstage,however,tolinktheinput(e.g.awards)andoutput (e.g. publications) data.
FeedbackfromtheSnowballpartnerinstitutionsontheprototypewasextremelypositive.Despiteitslimitationsandrestrictednature,itwasregardedasapowerfulaf-firmationofthevisionforanexternalbenchmarkingtoolbasedonconsistentlydefinedandsourcedmetrics.Allagreed that the toolwas "veryworthwhile", "the rightthingtobedoing",and"hugelyvaluable".ItwasfeltthatthetoolcouldbeextremelyhelpfulwiththeREF,eventhoughallreaffirmedthatSnowball’sremitwasbroaderthantheREF,andthatitwasanimportantfirststeponthewaytowardtheholistic,sector-wide,standardisedmetrics needed by universities to proactively manage research.Subsequentfeedbackfromotherstakehold-ers, especially funders, within the sector has beenequally positive.
The key conclusions from the data collection experi-ment and the development of the prototype were:
• There is strong support for the concept of con-sistently defined, standardised metrics to enablecross-institutional benchmarking from common datasources,withanalyticaltoolsontop
• Thereisastrongneedtointegratedatafromdiffer-ent sources to increase the scope of the metrics that can be generated
• The method of data collection employed was astruggle and not scalable
• Despite thesignificantchallenges identified,all in-volved strongly endorsed the concept of an analyti-cal tool that enables comparison and benchmarking between institutions and across denominators
12
Figure6:Prototypebenchmarkingtool
a)applicationcountbyyear(ofrequest)byinstitution
b)applicationcountbyyear(ofrequest)byresearcher

13
d)Publicationcountbyresearcher
c)Publicationcountbyinstitution
14
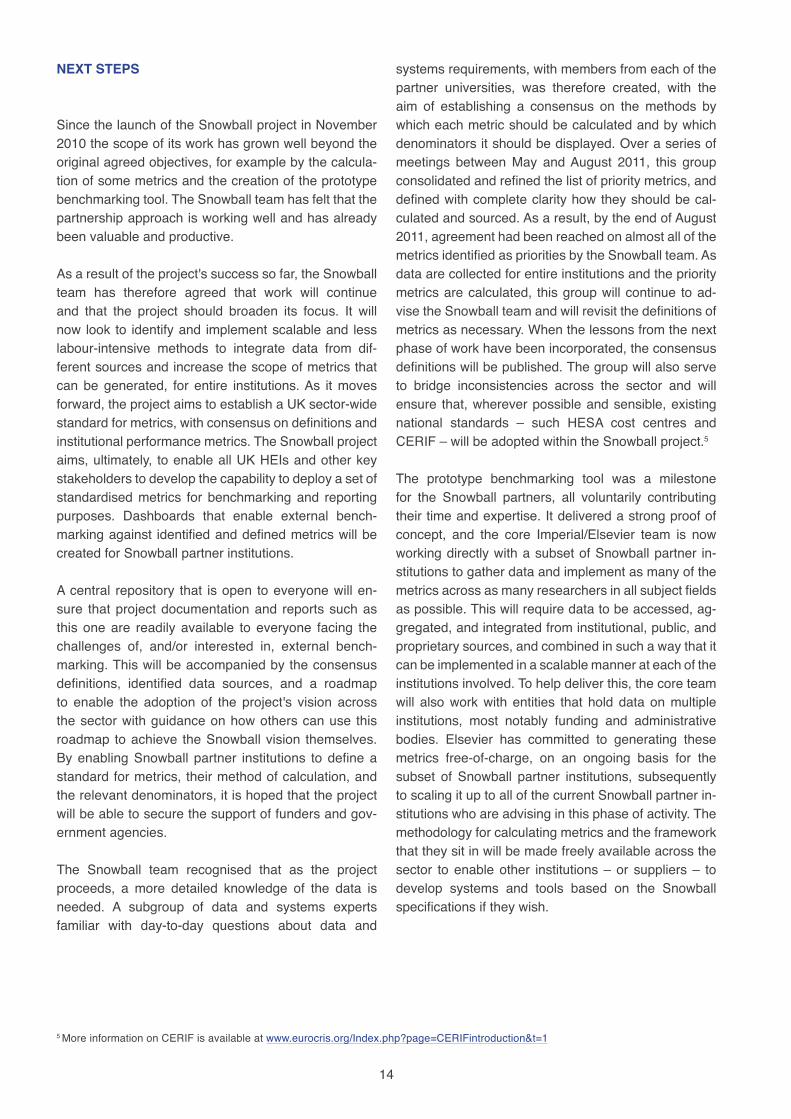
next stePs
SincethelaunchoftheSnowballprojectinNovember2010thescopeofitsworkhasgrownwellbeyondtheoriginalagreedobjectives,forexamplebythecalcula-tion of some metrics and the creation of the prototype benchmarkingtool.TheSnowballteamhasfeltthatthepartnership approach is working well and has already been valuable and productive.
Asaresultoftheproject'ssuccesssofar,theSnowballteam has therefore agreed that work will continue and that the project should broaden its focus. It willnow look to identify and implement scalable and less labour-intensive methods to integrate data from dif-ferent sources and increase the scope of metrics that canbegenerated, for entire institutions.As itmovesforward,theprojectaimstoestablishaUKsector-widestandardformetrics,withconsensusondefinitionsandinstitutionalperformancemetrics.TheSnowballprojectaims,ultimately, toenableallUKHEIsandotherkeystakeholders to develop the capability to deploy a set of standardised metrics for benchmarking and reporting purposes. Dashboards that enable external bench-markingagainst identifiedanddefinedmetricswillbecreatedforSnowballpartnerinstitutions.
Acentral repository that isopen toeveryonewillen-sure thatprojectdocumentationand reportssuchasthis one are readily available to everyone facing the challenges of, and/or interested in, external bench-marking. This will be accompanied by the consensus definitions, identified data sources, and a roadmapto enable the adoption of the project's vision acrossthe sector with guidance on how others can use this roadmap toachieve theSnowballvision themselves.ByenablingSnowball partner institutions todefineastandardformetrics,theirmethodofcalculation,andtherelevantdenominators,itishopedthattheprojectwill be able to secure the support of funders and gov-ernment agencies.
The Snowball team recognised that as the projectproceeds, a more detailed knowledge of the data isneeded. A subgroup of data and systems expertsfamiliar with day-to-day questions about data and
systemsrequirements,withmembersfromeachofthepartner universities, was therefore created, with theaim of establishing a consensus on the methods by which each metric should be calculated and by which denominators it should be displayed. Over a series of meetings betweenMay andAugust 2011, this groupconsolidatedandrefinedthelistofprioritymetrics,anddefinedwithcompleteclarityhowtheyshouldbecal-culatedandsourced.Asaresult,bytheendofAugust2011,agreementhadbeenreachedonalmostallofthemetricsidentifiedasprioritiesbytheSnowballteam.Asdata are collected for entire institutions and the priority metricsarecalculated, thisgroupwillcontinue toad-visetheSnowballteamandwillrevisitthedefinitionsofmetrics as necessary. When the lessons from the next phaseofworkhavebeenincorporated,theconsensusdefinitionswillbepublished.Thegroupwillalsoserveto bridge inconsistencies across the sector and will ensure that,whereverpossibleandsensible,existingnational standards – such HESA cost centres andCERIF–willbeadoptedwithintheSnowballproject.5
The prototype benchmarking tool was a milestone for the Snowball partners, all voluntarily contributingtheir time and expertise. It delivered a strong proof of concept, and the core Imperial/Elsevier team is nowworkingdirectlywithasubsetofSnowballpartner in-stitutions to gather data and implement as many of the metricsacrossasmanyresearchersinallsubjectfieldsaspossible.Thiswillrequiredatatobeaccessed,ag-gregated,andintegratedfrominstitutional,public,andproprietarysources,andcombinedinsuchawaythatitcan be implemented in a scalable manner at each of the institutionsinvolved.Tohelpdeliverthis,thecoreteamwill also work with entities that hold data on multiple institutions, most notably funding and administrativebodies. Elsevier has committed to generating thesemetrics free-of-charge, on an ongoing basis for thesubset of Snowball partner institutions, subsequentlytoscalingituptoallofthecurrentSnowballpartnerin-stitutions who are advising in this phase of activity. The methodology for calculating metrics and the framework that they sit in will be made freely available across the sector to enable other institutions – or suppliers – to develop systems and tools based on the Snowballspecificationsiftheywish.
5 MoreinformationonCERIFisavailableatwww.eurocris.org/Index.php?page=CERIFintroduction&t=1

15
conclusion
In the past, institutions and other stakeholders havebeen guilty of 'reinventing the wheel': creating individu-alised metrics and systems of measurement without realisingthatsimilarobjectivesaresharedacrossthesector. Furthermore, suppliers as a whole have nottaken the necessary time to understand the complexity of data needed to drive strategic research manage-ment.Bycomingtoashared,agreedunderstandingofwhatinstitutions,funders,andotherstakeholderswishtomeasure and benchmark against, it is hoped thattheSnowballprojectwill leadtoeasiercollaborationswith suppliers and more effective and efficient datamanagementacrosstheboard,andthatultimately,thiswillincreasetheefficiencyandcompetitivenessofthesector as a whole.
Inthemeantime,theSnowballteamplanstocontinueto provide updates on progress and intends to publish outputs with practical value for the sector. If you are in-terested,wouldliketocomment,orwanttobeinvolvedwith theproject,pleasecontacteitherJohnGreenorNickFowler.


DrNickFowlerDirectorofGlobalStrategyElsevierRadarweg291043NXAmsterdamTheNetherlandsn.fowler@elsevier.com
DrJohnGreenHonoraryResearchAssociateImperialCollegeLondonLondonSW72AZUnitedKingdomj.green@imperial.ac.uk