The snow and glacier melt components of streamflow of the ... · the river Rhine and its...
22
Ice melt runoff from glaciers Snowmelt Ice melt Rainfall runoff generation Q R Q I Internationale Kommission für die Hydrologie des Rheingebietes International Commission for the Hydrology of the Rhine Basin The snow and glacier melt components of streamflow of the river Rhine and its tributaries considering the influence of climate change Synthesis report Kerstin Stahl, Markus Weiler, Irene Kohn, Daphné Freudiger, Jan Seibert, Marc Vis, Kai Gerlinger, Mario Böhm Report No. I-25 of the CHR
Transcript of The snow and glacier melt components of streamflow of the ... · the river Rhine and its...
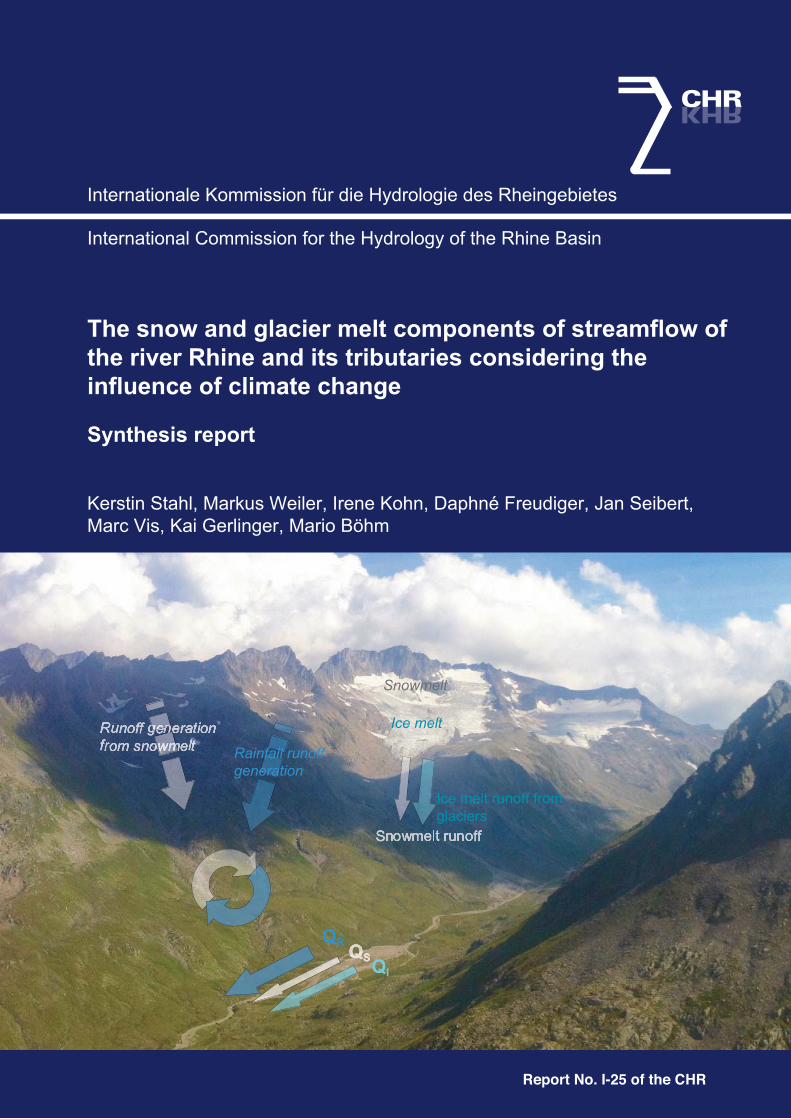
Ice melt runoff fromglaciers
Snowmelt
Ice melt
Rainfall runoffgeneration
QR
QI
Internationale Kommission für die Hydrologie des Rheingebietes
International Commission for the Hydrology of the Rhine Basin
The snow and glacier melt components of streamflow ofthe river Rhine and its tributaries considering theinfluence of climate change
Synthesis report
Kerstin Stahl, Markus Weiler, Irene Kohn, Daphné Freudiger, Jan Seibert,Marc Vis, Kai Gerlinger, Mario Böhm
Report No. I-25 of the CHR

1
Internationale Kommission für die Hydrologie des Rheingebietes
International Commission for the Hydrology of the Rhine Basin
The snow and glacier melt components of streamflow ofthe river Rhine and its tributaries considering theinfluence of climate change
Synthesis report
Kerstin Stahl, University Freiburg, Germany
Markus Weiler, University Freiburg, Germany
Irene Kohn, University Freiburg, Germany
Daphné Freudiger, University Freiburg, Germany
Jan Seibert, University Zürich, Switzerland
Marc Vis, University Zürich, Switzerland
Kai Gerlinger, HYDRON GmbH, Karlsruhe, Germany
Mario Böhm, HYDRON GmbH, Karlsruhe, Germany
2
���� ���� ���� ���� ����
Publisher International Commission for the Hydrology of the Rhine Basin (KHR/CHR)
Date of Publication December 2016
ISBN/EAN 978-90-70980-38-2
Project management Jörg Uwe Belz, Federal Institute of Hydrology (Germany)
Steering group Eric Sprokkereef, Secretary of the KHR/CHR (Ministry of Infrastructure andthe Environment, The Netherlands)Dr. Manfred Bremicker (Landesanstalt für Umwelt, Messungen undNaturschutz, Baden-Württemberg, Germany)Peter Krahe (Federal Institute of Hydrology, Germany)Dr. Gabriele Müller (Bundesministerium für Land- und Forstwirtschaft,Umwelt und Wasserwirtschaft, Austria)Prof. Dr. Hans-Peter Nachtnebel (University fof Natural Resources and LifeSciences, Vienna)Dr. Felix Naef (ETH Zurich, Switzerland)Dr. Petra Schmocker-Fackel (Federal Office for the Environment,Switzerland)Prof. Dr. Wolfgang Schöner (University of Graz)Dr. ir. Frederiek Sperna Weiland (Deltares, The Netherlands)
Based on Results of the research project „The snow and glacier melt components ofstreamflow of the river Rhine and its tributaries considering the influence ofclimate change (ASG-Rhine)"
Print rombach digitale manufaktur, Freiburg
Available from International Commission for the Hydrology of the Rhine basinSecretariat: PO Box 178200 AA Lelystad, The NetherlandsT +31 320 298 603email: [email protected]://www.chr-khr.org/en/publications
Picture credits Cover: Markus Weiler, View from Piz Tagliola into the Val Maighels and the"Glatscher da Maighels" (Vorderrhein, Switzerland)
Headers: Simulated daily streamflow components 1916-2006 from rain(blue), snowmelt (white) and ice melt (turquoise) at the gauge Brienzwiler,Aare, Switzerland
Conventions Place names are used in their local versions.

3
Preface
The need for international cooperation in general, and in particular in the field of hydrology, is not a brand-new
insight: rivers do not stop at national borders and groundwater does not recognize the territorial jurisdiction of
administrative authorities. At an expert level, at least, approaching hydrological questions and issues on a cross-border
level should be a matter of course. But even today, in times of EU-wide cooperation, collecting basic data for large-
scale scientific work continues to be a challenge in almost every respect. For decades, and on behalf of the national
states (however, without any political leverage), the International Commission for theHydrology of the Rhine Basin
(CHR/KHR) has been addressing vital questions with regard to the international hydrology of the Rhine. Practical
experiences gained so far, in decades of cooperation, prove that the assumptions leading to the establishment of the
CHRwere correct.Namely, that a panel of selected experts from all Rhine riparian states will share findings andmake
knowledge and information resources accessible, which would otherwise – seen from a purely national perspective
– not be available.
Beginning with the large Rhine monograph of 1978, numerous CHR publications on the hydrology of the Rhine
and its tributaries have beenmade available since the 1970ies. Findings thereof have been incorporated into adminis-
trative actions and political governance. For almost two decades, the CHR has been devoting special attention to the
long-term evolution of discharge patterns and climate change and its impact on the hydrology of the Rhine basin.
In the course of the work on CHR-projects such as the "Discharge Regime of the Rhine and its Tributaries in the
20th Century" (CHR report I-22), with its retrospective approach in investigating the hydrological regime structure
and the forward-looking “RheinBlick 2050 /Assessment ofClimateChange Impacts onDischarge in theRhineRiver
Basin "(CHR report I-23), it became also evident that any reliable quantification of the snow and glacialmelt fraction
of the total streamflow along the Rhine has been lacking so far. This knowledge gap is or was in strong contrast to
the offensiveway inwhich the consequences ofmelting glaciers in theAlpswere portrayed by bothmedia and popular
science. Retrospectively, this gap in knowledge has been closed at least for the period from 1901 to 2006 with the
completion of the CHR project "ASG-Rhine I/ The snow and glacier melt components of streamflow of the river
Rhine and its tributaries considering the influence of climate change". Hence, there is nothing standing in the way
of a respectable, scientifically proven approach to this subject - for the first time worldwide with respect to such an
important river basin.
In view of the methods developed and the insights gained in the course of the project, the CHR is planning a
continuation of ASG-Rhine with a prospective approach. This is intended to answer any open questions about the
future scope of melting water contribution to the Rhine discharge over the coming decades.
TheCommissionwould like to express its gratitude and appreciation to the participating scientists, to the universities
of Freiburg andZurich formaking the project team available, toHYDRONGmbH for providing their project team,
and to the project-accompanying active supervisory group, for the work they have accomplished.
Jörg Uwe Belz
Federal Institute of Hydrology, Germany
Project Manager
���� ���� ��� ��� ����
4
The Rhine is one of the largest rivers in Europe and its
flow is crucial for a number of water uses such as energy
production, water-borne transportation, water supply
for irrigation, industry, and as drinking water. With its
headwaters in the Alps and several major tributaries
from other central European mountain ranges on its
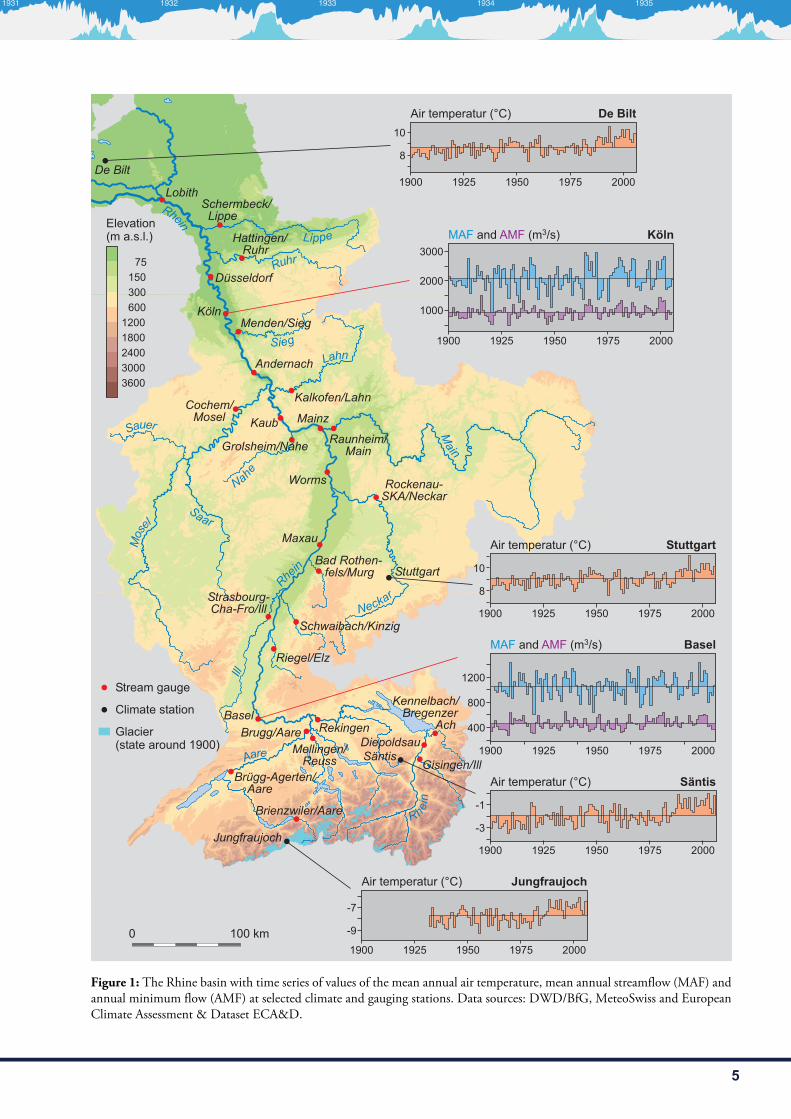
course to theNorthSea (Fig. 1), thehydrological regime
of the Rhine is influenced by meltwater during spring
and summer. The highest elevation areas of the river
basin in the Swiss andAustrianAlps are partially glacier-
ized. These glaciers have retreated considerably as air
temperatures have warmed, particularly in recent
decades (Fig.1). As a result, snowmelt and glacier ice
melt have undergone changes as well. Hence, it can be
expected that the contributions of rain, snowmelt, and
glacier icemelt that comprise the river’s streamflowhave
also changed during that time. The project investigated
these streamflow components in more detail.
The influence of climate change is visible particularly in
the temporal shifts of seasonal minima and maxima of
the hydrological regimes of snowand glaciermelt domi-
nated alpine headwater catchments. Regime changes
have already been shown based on observed streamflow
time series in the Rhine basin (Belz et al., 2007). Fur-
thermore, future projections of climate change (Görgen
et al., 2010; BAFU, 2012) suggest they are among the
most important changes expected to influencewater use
and resourcesmanagement in the future. In this context
a correct quantification of the contribution of snow and
glacier melt runoff in the Rhine basin to the streamflow
along the riverbecomes an important task.Thedifferent
runoff contributions control the hydrological regimes
through the runoff generation processes and thus deter-
mine spatial differences in the evolution of the stream-
flow and its availability for different water uses.
The quantities of the streamflow components of the
river Rhine are particularly interesting during summer
low flow situations in the downstream reaches of the
Rhine when natural catchment storages feeding lows
flows have been depleted due to a long dryweather peri-
od. In those situations, the glacier melt water compo-
nent from the Alps becomes particularly important. In
the past, such extreme summer low flow situations oc-
curred in 1921, several times in the 1940s and 1950s,
and more recently in 2003, as can be seen in the exam-
ples of observed streamflow time series at the gauging
stations in Basel and Köln (Fig. 1). In light of this issue,
model-based studies have previously calculated the con-
tribution of glacier melt runoff to the downstream
streamflow at various gauging stations of the Rhine,
including the drought of 2003, and its changes over
time (e.g.,Huss, 2011).These studiesmostly computed
the contributing glacier melt runoff on a monthly, sea-
sonal, or annual basis and did not consider the temporal
delay due to the channel routing, lake retention, and the
mixing of the glacier runoff contribution with the rain
and snowmelt runoff from the non-glacierized parts of
the basin in great detail. However, for the economy and
ecology during low flow events, the influence of glacier
melt augmentation of flow may also matter at shorter
time scales.
The ASG-Rhine project’s aim was therefore to analyse
and simulate the changes in the streamflow components
of the Rhine from glacierized and non-glacierized parts
of the basins together for the first time. Specifically, the
project aimed at the determination of the streamflow
components from rain, snowmelt, and icemelt at a daily
resolution over the long period from1901–2006.Mod-
elling at a daily resolution allows the studying of the
different contributions to extreme events, in particular
low flows. The analysis of the long time period allows
the investigation of trends and changes, in particular
those related to the retreat of glaciers. Throughout the
study, a detailed consideration and analysis of observa-
tional data supported the largely model-based results.
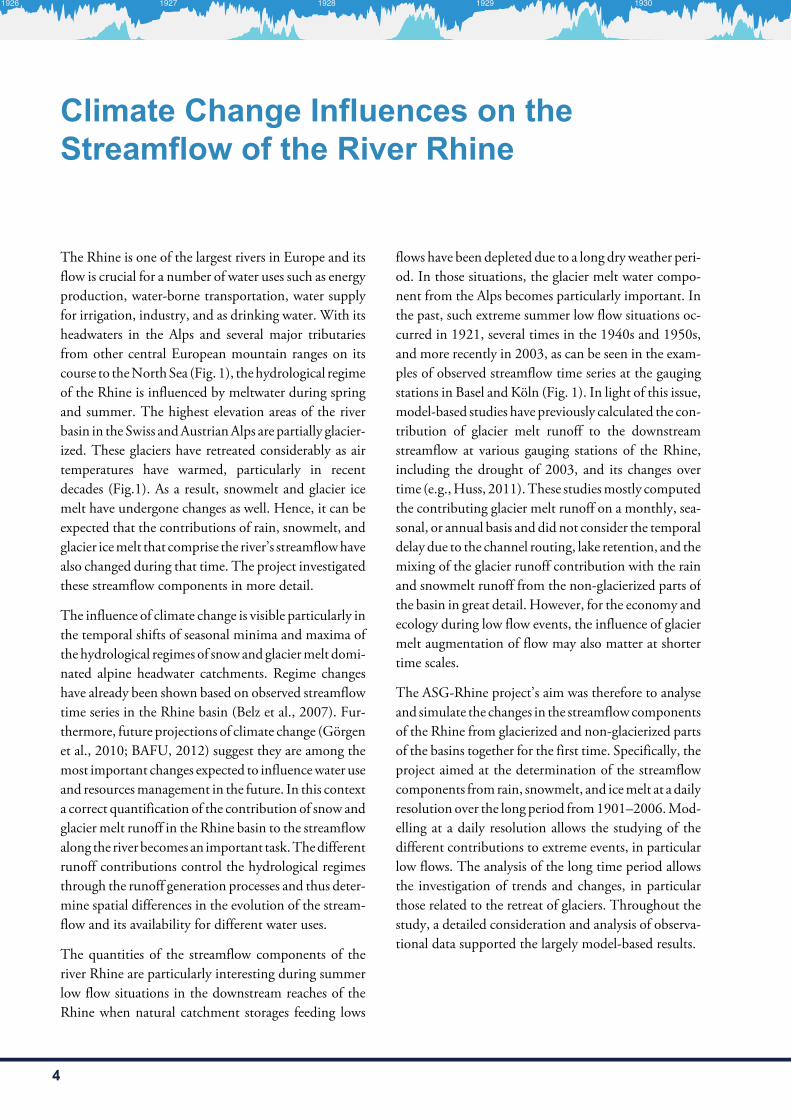
Climate Change Influences on theStreamflow of the River Rhine
���� ���� ���� ���� ���
5
�����
�����
��
����
� ��
���
��
� ��
� ��
����
���
�����
� �
�����
� �
�
�������
����� �
������
���� ����
���� ������!����� �
����"#���!� �
$�������!���
������%�
&�����' ��!��������"�����������������
���!� ����������!
����
��������� ���
������!(�"
���# �' ��!&��"��
�� �'�� )� *�!���
� +
� %������� �������!��
������ �&�!����
,�-�
& '
$������-!� ��� ����-!
� ��
� ��"
& ������!� ��)����-!
�����
��%�� ��
���%��!����&.��
������%��
��'���
/ �������!�����
����-'���!�������
�
��
������� ������� �������
���� ���� ���� ���� ����
�
��
������� ������� ����� �
���� ���� ���� ���� ����
��
��
������� ������� �����
���� ���� ���� ���� ����
��
��
������� ������� ���� �����
���� ���� ���� ���� ����
���
����
���� ������������� �����
���� ���� ���� ���� ����
���
����
����
���� ������������� ����
���� ���� ���� ���� ����
����
� ���� �
��
�!��
������!��
����������������
"#$ �%���� &�&#&�
'# (���� � �%���������
�#�� �� �%�
)� ��* �*
Figure 1: The Rhine basin with time series of values of the mean annual air temperature, mean annual streamflow (MAF) and
annual minimum flow (AMF) at selected climate and gauging stations. Data sources: DWD/BfG, MeteoSwiss and European
Climate Assessment & Dataset ECA&D.
���� ���� ���� ��� ����
6
Data and General Approach
����������������� ����
������� ������
������������������
����� ���� ������������
����� ���� ���������! ��������
����"��� �����#� ��������
����"���$ ���"������%��� �������&�����
������� �������������'
��(�����)�����'���
*������#�����+��,
�������
��� ����������
��� ����������
������������������������ ������������ $ ����' "����
������� ���������+��,
��(����� ��(�
*������#���,
*������#������
-����� ����'���
-����� ������������� ��(�
-�����������
�����+��,���(����� �����
.��������' ����'���(������$ ��������&�����$
��/��� ���#
0��� ����� � ������ � �/�����
1���������
2���
����'���
���������
������
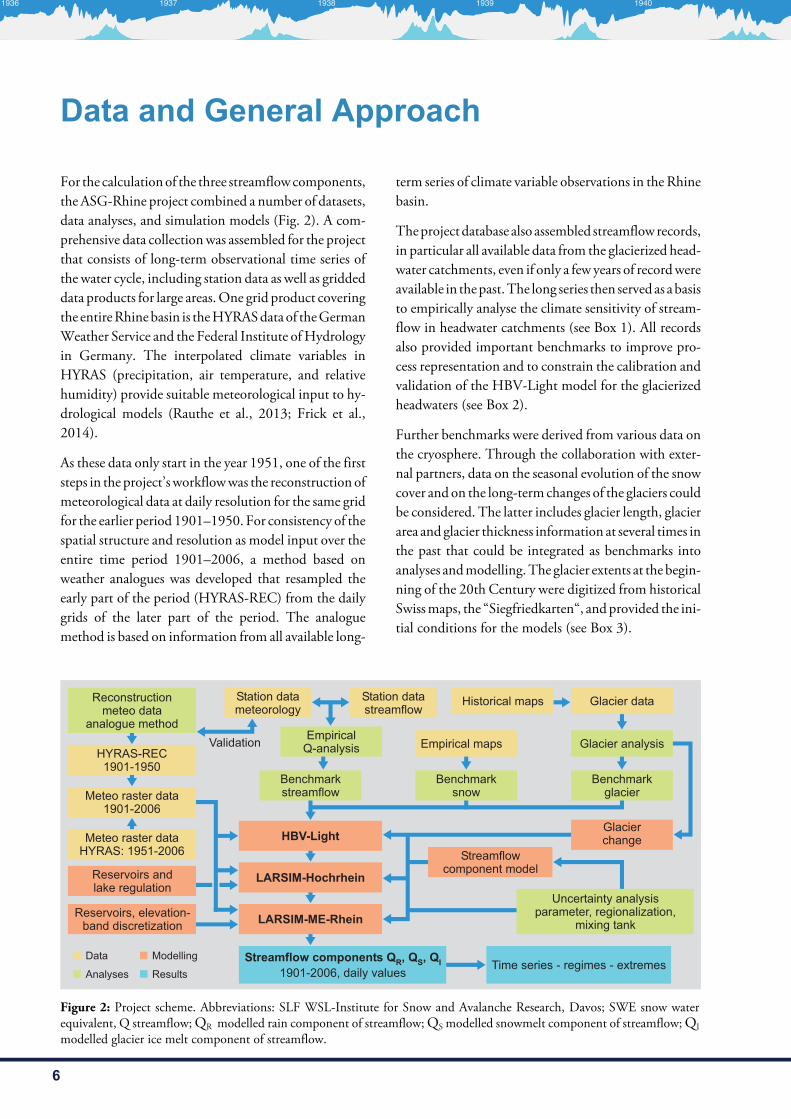
Figure 2: Project scheme. Abbreviations: SLF WSL-Institute for Snow and Avalanche Research, Davos; SWE snow water
equivalent, Q streamflow; QR modelled rain component of streamflow; QS modelled snowmelt component of streamflow; QI
modelled glacier ice melt component of streamflow.
For the calculationof the three streamflowcomponents,
the ASG-Rhine project combined a number of datasets,
data analyses, and simulation models (Fig. 2). A com-
prehensive data collectionwas assembled for the project
that consists of long-term observational time series of
the water cycle, including station data as well as gridded
data products for large areas.One grid product covering
the entireRhinebasin is theHYRASdata of theGerman
Weather Service and the Federal Institute ofHydrology
in Germany. The interpolated climate variables in
HYRAS (precipitation, air temperature, and relative
humidity) provide suitable meteorological input to hy-
drological models (Rauthe et al., 2013; Frick et al.,
2014).
As these data only start in the year 1951, one of the first
steps in the project’sworkflowwas the reconstruction of
meteorological data at daily resolution for the same grid
for the earlier period 1901–1950. For consistency of the
spatial structure and resolution as model input over the
entire time period 1901–2006, a method based on
weather analogues was developed that resampled the
early part of the period (HYRAS-REC) from the daily
grids of the later part of the period. The analogue
method is based on information from all available long-
term series of climate variable observations in the Rhine
basin.
Theprojectdatabase also assembled streamflowrecords,
in particular all available data from the glacierized head-
water catchments, even if only a few years of recordwere
available in thepast.The long series then servedas abasis
to empirically analyse the climate sensitivity of stream-
flow in headwater catchments (see Box 1). All records
also provided important benchmarks to improve pro-
cess representation and to constrain the calibration and
validation of the HBV-Light model for the glacierized
headwaters (see Box 2).
Further benchmarks were derived from various data on
the cryosphere. Through the collaboration with exter-
nal partners, data on the seasonal evolution of the snow
cover and on the long-term changes of the glaciers could
be considered. The latter includes glacier length, glacier
area and glacier thickness information at several times in
the past that could be integrated as benchmarks into
analyses andmodelling.The glacier extents at the begin-
ning of the 20th Century were digitized from historical
Swissmaps, the “Siegfriedkarten“, andprovided the ini-
tial conditions for the models (see Box 3).
���� ���� ���� ���� ���
7
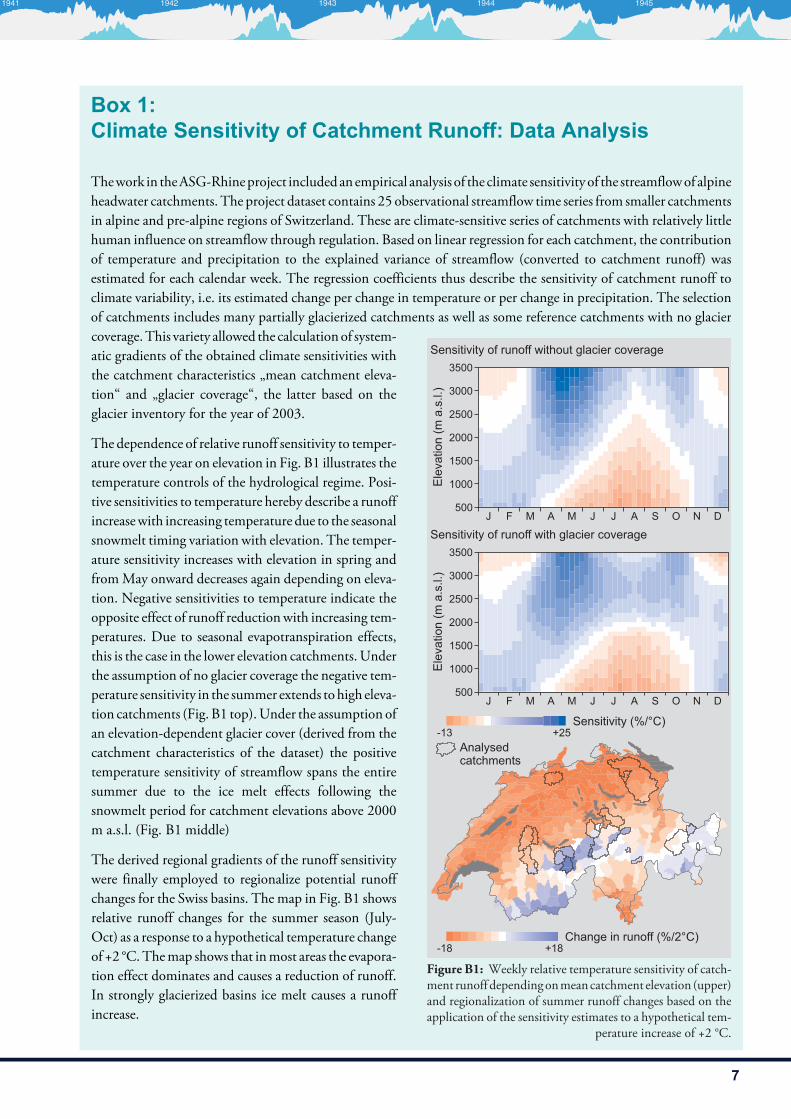
Box 1:Climate Sensitivity of Catchment Runoff: Data Analysis
coverage.This variety allowed the calculationof system-
atic gradients of the obtained climate sensitivities with
the catchment characteristics „mean catchment eleva-
tion“ and „glacier coverage“, the latter based on the
glacier inventory for the year of 2003.
The dependence of relative runoff sensitivity to temper-
ature over the year on elevation in Fig. B1 illustrates the
temperature controls of the hydrological regime. Posi-
tive sensitivities to temperature hereby describe a runoff
increasewith increasing temperature due to the seasonal
snowmelt timing variation with elevation. The temper-
ature sensitivity increases with elevation in spring and
fromMay onward decreases again depending on eleva-
tion. Negative sensitivities to temperature indicate the
opposite effect of runoff reductionwith increasing tem-
peratures. Due to seasonal evapotranspiration effects,
this is the case in the lower elevation catchments. Under
the assumption of no glacier coverage the negative tem-
perature sensitivity in the summer extends tohigh eleva-
tion catchments (Fig. B1 top).Under the assumption of
an elevation-dependent glacier cover (derived from the
catchment characteristics of the dataset) the positive
temperature sensitivity of streamflow spans the entire
summer due to the ice melt effects following the
snowmelt period for catchment elevations above 2000
m a.s.l. (Fig. B1 middle)
The derived regional gradients of the runoff sensitivity
were finally employed to regionalize potential runoff
changes for the Swiss basins. The map in Fig. B1 shows
relative runoff changes for the summer season (July-
Oct) as a response to a hypothetical temperature change
of +2 °C.Themap shows that inmost areas the evapora-
tion effect dominates and causes a reduction of runoff.
In strongly glacierized basins ice melt causes a runoff
increase.
Thework in theASG-Rhineproject includedanempirical analysis of the climate sensitivityof the streamflowof alpine
headwater catchments. The project dataset contains 25 observational streamflow time series from smaller catchments
in alpine and pre-alpine regions of Switzerland. These are climate-sensitive series of catchments with relatively little
human influence on streamflow through regulation. Based on linear regression for each catchment, the contribution
of temperature and precipitation to the explained variance of streamflow (converted to catchment runoff) was
estimated for each calendar week. The regression coefficients thus describe the sensitivity of catchment runoff to
climate variability, i.e. its estimated change per change in temperature or per change in precipitation. The selection
of catchments includes many partially glacierized catchments as well as some reference catchments with no glacier
������������ ������ ���
�����������������
��������� �!""�� ������# ��#
$
��%%
����������!"� �!""&���! ���������!������
'������!���
�(�(�(�
�%%
�%%%
��%%
�%%%
��%%
�%%%
) * � * $ $ � � + , -
$
��%%
����������!"� �!""&�����������!������
'������!���
�(�(�(�
�%%
�%%%
��%%
�%%%
��%%
�%%%
) * � * $ $ � � + , -
Figure B1: Weekly relative temperature sensitivity of catch-
ment runoffdependingonmeancatchment elevation (upper)
and regionalization of summer runoff changes based on the
application of the sensitivity estimates to a hypothetical tem-
perature increase of +2 °C.
���� ��� ���� ���� ����
8
A model chain was developed to model the streamflow
components in the Rhine and its tributaries. From up-
stream to downstream, this model chain works in the
following way (Fig. 3):
The HBV-Light model simulates all glacierized head-
water catchments separately at the hydrological meso-
scale. This semi-distributed conceptual hydrological
model includes a snow and glacier routine. For the
glacierized headwater catchments it was important to
model the long-term glacier change and the streamflow
evolution similarly well. To achieve this, a new snow
distribution approach was developed for themodel that
accumulates snow over multiple years at high altitudes
only on the accumulation areas of glaciers. The glacier
adaptation routine according to the “δhmethod“ (Huss
et al., 2010) was developed further to allow not only
glacier retreat but also transient glacier advances during
the long simulation period.
TheWater Balance model LARSIM simulates the re-
maining parts of the Rhine basin down to Lobith at the
Dutch–German border. Two different grid based ver-
sions of LARSIM were used that differ in the spatial
resolution of themodel grid and in some of the concep-
tual representation of the hydrological processes. A
1x1km² model was used in the “LARSIM-Hochrhein“
for the basin upstream of Basel, and a 5x5km² version
wasused for “LARSIM-ME-Rhein“ for thebasindown-
stream of Basel. In both LARSIM model versions, the
snow routine was adapted and evaluated for the project
and in the lower resolution LARSIM-ME-Rhein, a new
elevation-band discretization per grid cell was intro-
duced (Fig. 3). In addition, the development of river
regulation in the Rhine basin had to be considered. In
particular, the successive increase in reservoir storage for
hydropower production over the modelling period was
accounted for. In the alpine part of the Rhine basin, a
simplified schemewith four reservoirs that conceptually
summarize the increasing storage of many small reser-
voirs in the Alps throughout the 20th Century was im-
plemented. Furthermore, 17 reservoirs in the mid- and
lower reaches of the Rhine basin were implemented di-
rectly in the river network. The models also include
regulation schemes for the large pre-alpine lakes.
As a special feature of the ASG-Rhine project all mod-
els in the model chain track the rainfall component ofstreamflow (QR), snowmelt component of stream-flow (QS), and glacier icemelt component of stream-flow (QI) from their respective runoff generation
through runoff concentration in the sub-catchments
through lakes and along the tributaries and in the main
river. To provide quantitative estimates of the three
components on their way through the model system, a
method was developed that calculates the fractions of
the three components in a system of ‚virtual mixing
tanks’ that runs parallel to the system of storages and
fluxes of the actual hydrological model. In each spatial
model element, for each time step, the generated and
already stored components are completely mixed ac-
cording to the localwaterbalanceof fluxes in andout the
mixing tank. Water is then released to the next model
elementwith the resulting new composition of the three
components.
As opposed to the calibrated model storages, however,
themixing tanks’ capacities needed to be limited. If they
had a similarly large capacity as the real groundwater
and lake storages, the assumption of a complete mixing
would result in a released flux with a constant ratio of
components year-round. Limiting the mixing tank ca-
pacity instead allows estimating the direct response of
streamflow components to the three different incoming
runoff generation components and their runoff concen-
tration. This addition to the models and their routing
along the river network thus allows the simulationof the
individual streamflow components in every model ele-
ment for every day during the simulation period of
1901–2006.
Models for the Simulation of StreamflowComponents of the River Rhine
���� ���� ���� ���� ���

9
Figure 3: Scheme of the model chain and particularities of the models employed in the ASG-Rhine project. For general details
on the HBV-Light model see Seibert & Vis (2012) for the LARSIM model see Ludwig & Bremicker (2006).
���� ��� ���� ���� ����
10
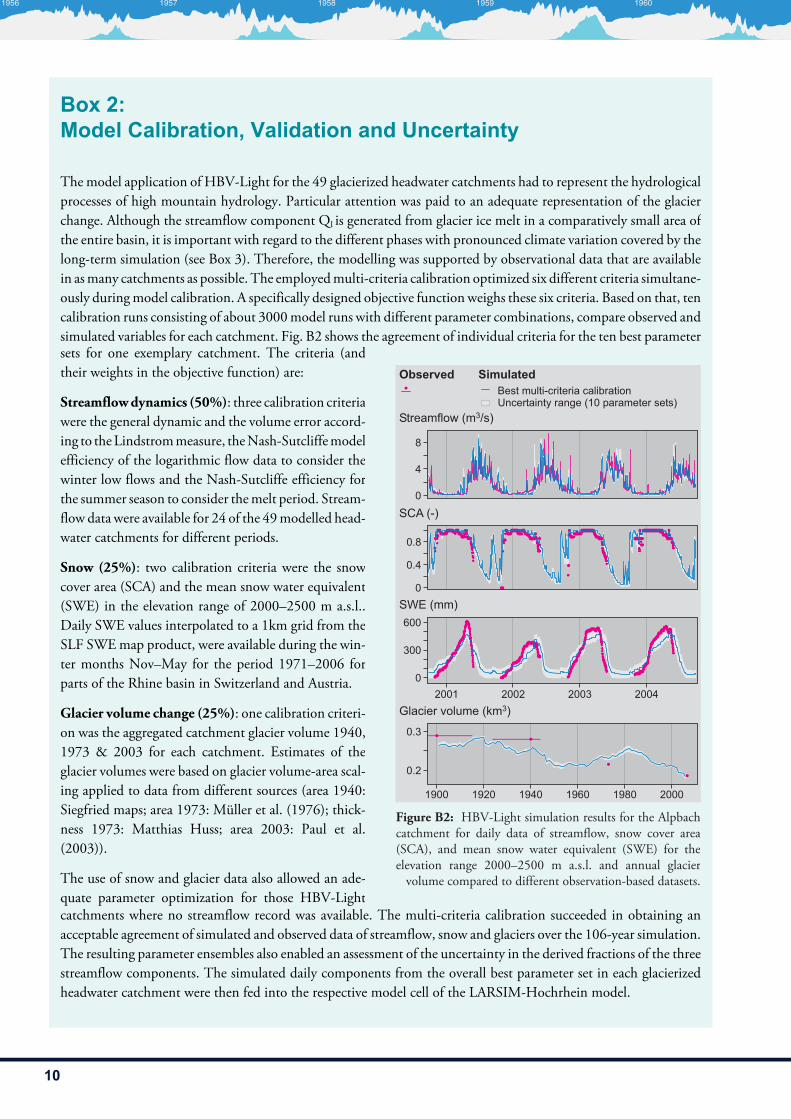
Box 2:Model Calibration, Validation and Uncertainty
������������������ �� ����� �������� ������ ����������� ����� ������
�� ����
�� �������������
�
�
�
�!�
�!
�"#����
�$%�����
&���&���&��&&���
�
'��
���
(��� �)������*���
�!&
�!�
�+�� �+&� �+�� �+'� �+ � &���
Figure B2: HBV-Light simulation results for the Alpbach
catchment for daily data of streamflow, snow cover area
(SCA), and mean snow water equivalent (SWE) for the
elevation range 2000–2500 m a.s.l. and annual glacier
volume compared to different observation-based datasets.
The model application of HBV-Light for the 49 glacierized headwater catchments had to represent the hydrological
processes of high mountain hydrology. Particular attention was paid to an adequate representation of the glacier
change. Although the streamflow component QI is generated from glacier ice melt in a comparatively small area of
the entire basin, it is important with regard to the different phases with pronounced climate variation covered by the
long-term simulation (see Box 3). Therefore, the modelling was supported by observational data that are available
in asmany catchments as possible. The employedmulti-criteria calibration optimized six different criteria simultane-
ously duringmodel calibration. A specifically designed objective function weighs these six criteria. Based on that, ten
calibration runs consisting of about 3000model runs with different parameter combinations, compare observed and
simulated variables for each catchment. Fig. B2 shows the agreement of individual criteria for the ten best parametersets for one exemplary catchment. The criteria (and
their weights in the objective function) are:
Streamflowdynamics (50%): three calibration criteriawere the general dynamic and the volume error accord-
ing to theLindstrommeasure, theNash-Sutcliffemodel
efficiency of the logarithmic flow data to consider the
winter low flows and the Nash-Sutcliffe efficiency for
the summer season to consider themelt period. Stream-
flow data were available for 24 of the 49modelled head-
water catchments for different periods.
Snow (25%): two calibration criteria were the snow
cover area (SCA) and the mean snow water equivalent
(SWE) in the elevation range of 2000–2500 m a.s.l..
Daily SWE values interpolated to a 1km grid from the
SLF SWEmap product, were available during the win-
ter months Nov–May for the period 1971–2006 for
parts of the Rhine basin in Switzerland and Austria.
Glacier volume change (25%): one calibration criteri-on was the aggregated catchment glacier volume 1940,
1973 & 2003 for each catchment. Estimates of the
glacier volumes were based on glacier volume-area scal-
ing applied to data from different sources (area 1940:
Siegfried maps; area 1973: Müller et al. (1976); thick-
ness 1973: Matthias Huss; area 2003: Paul et al.
(2003)).
The use of snow and glacier data also allowed an ade-
quate parameter optimization for those HBV-Lightcatchments where no streamflow record was available. The multi-criteria calibration succeeded in obtaining an
acceptable agreement of simulated and observed data of streamflow, snow and glaciers over the 106-year simulation.
The resulting parameter ensembles also enabled an assessment of the uncertainty in the derived fractions of the three
streamflow components. The simulated daily components from the overall best parameter set in each glacierized
headwater catchment were then fed into the respective model cell of the LARSIM-Hochrhein model.
���� ���� ���� ���� ����
11
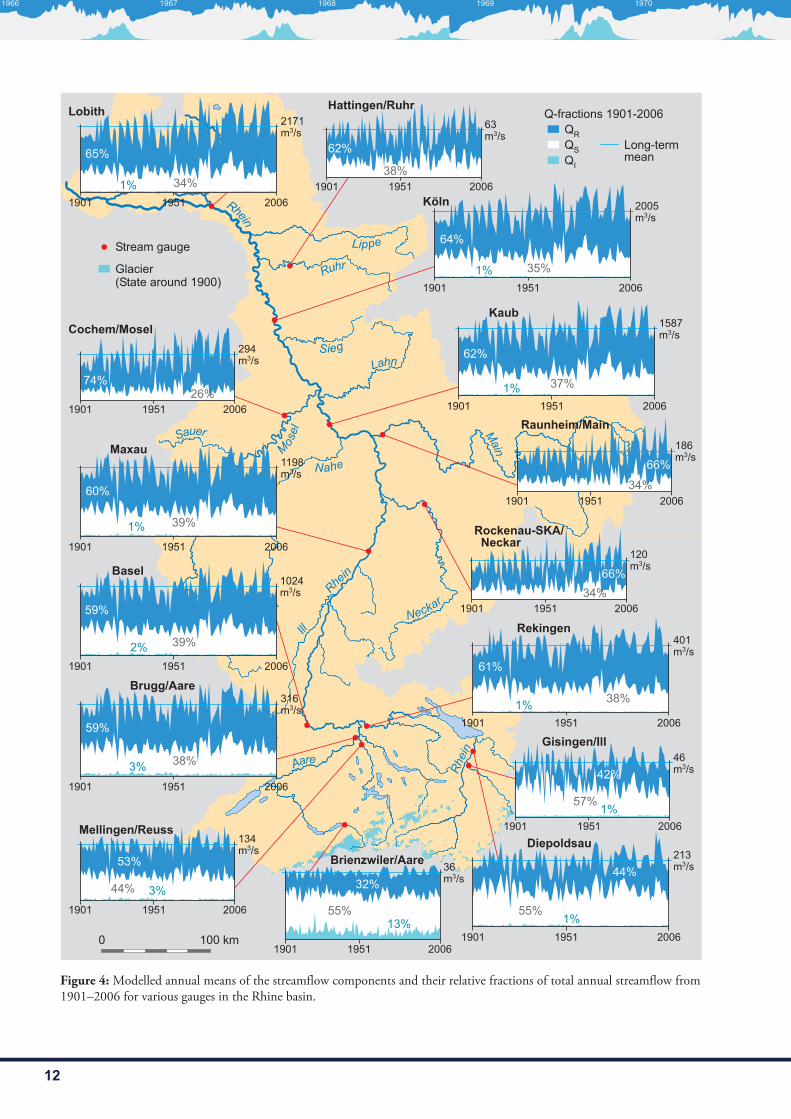
The modelled time series of the annual streamflowcomponents at gauges along the Rhine illustrate the
different magnitudes as well as the variability of the
components from year to year (Fig. 4). On average over
the study period 1901-2006 the icemelt componentQI
comprises the smallest fraction of the streamflow com-
ponents at all stations shown on the map.
In the Rhine basin upstream of Basel, the Aare river
contributes the largest QI. At the gauging station Brien-
zwilerQI is on average close to ten percent of the annual
streamflow. In the Reuss river and the Alpine Rhine,
where the basins’ headwaters are less glacierizedQI plays
a less important role. The snowmelt component QS
comprises the highest fractions of annual streamflow in
the alpine headwaters. Downstream of the tributaries
Aare, Reuss, and Alpine Rhine to the ‚High Rhine’,
however, the rain componentQRdominates the stream-
flow composition. At the gauging station Basel, QR
comprises close to 60% of the annual flow.
Downstream of Basel along the Rhine, the relative frac-
tions of the ice melt and snowmelt components decline
further, while the fraction of the rain component in-
creases.On average during the study period 1901–2006
the fractions of QI downstream of Basel amount to less
than 2% with 0.8% at Lobith. The average fraction of
the snowmelt component QS amounts to 39% in Basel
and 34% in Lobith. For the larger tributaries that have
their headwaters in the various central Europeanmoun-
tain ranges QS fractions around 20–45% were estimat-
ed.
Visually, it is difficult to detect uniform long-term
changes governing the entire Rhine basin. The inter-
annual variability of the annual mean values of the
streamflow components is high. High streamflow years
generally reflect wet years with large rain and snowmelt
components. Low streamflow years, on the other hand,
reflect years with small rain and snowmelt components.
The inter-annual variability of both components
amounts to about 25% of the annual flow for the river
reaches downstream of Basel.
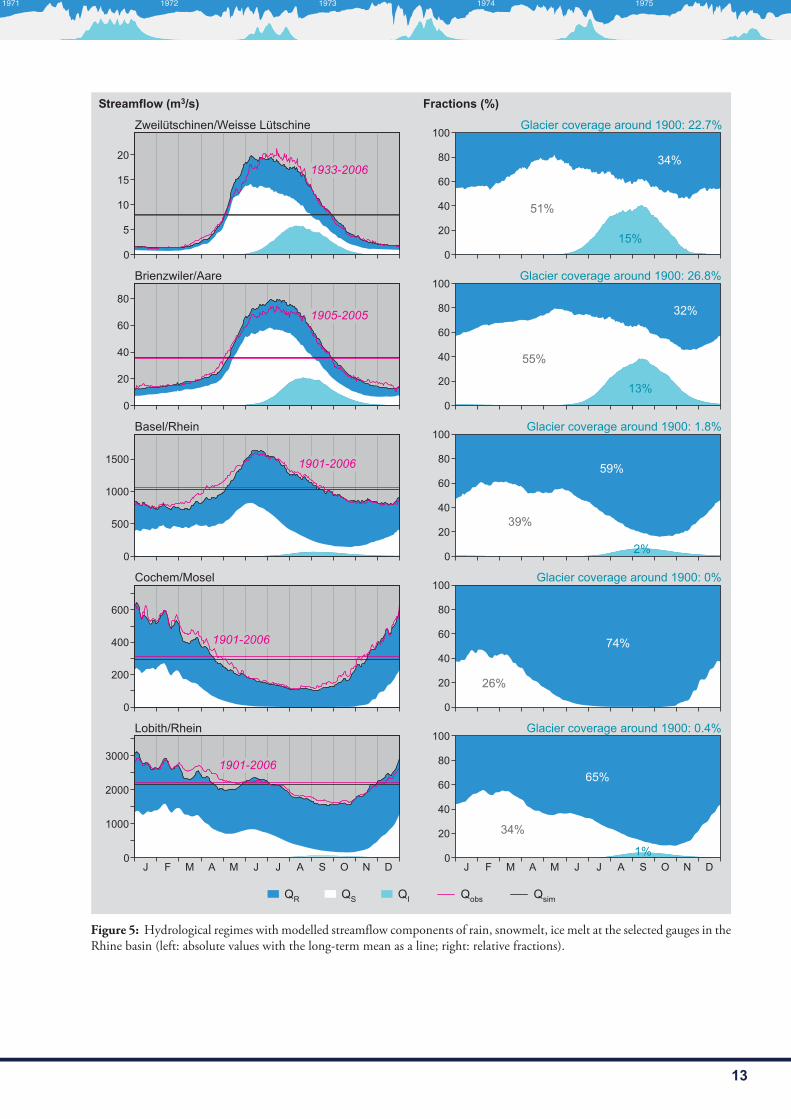
The hydrological regimes can also be divided into thethree streamflow components based on the modelled
time series. Fig. 5 shows the results for some examples:
the snow and glacier melt dominated regimes of the
Weisse Lütschine, one of the heavily glacierized catch-
ments modelled with HBV, as well as the Aare river at
the gauging station Brienzwiler, and the Rhine at Basel.
The rain-dominated regime can be seen for theMosel at
Cochem and the complex regime of the middle and
lower Rhine river. The seasonal variation of the three
components directly illustrates themain controls on the
hydrological regimes. The component QI contributes
only seasonally to streamflow and peaks in August and
September in the glacierizedheadwaters and in theAare.
From November to June, however, fractions of QI are
negligible everywhere. In the Mosel, the snow compo-
nent is present only seasonally fromNovember toMay/
June. On the contrary, in the Rhine, QS was modelled
to contribute to streamflow throughout the year. In the
headwaters of the Alps QS generally peaks in June, fur-
ther downstream, the largest fractions of QS are mod-
elled to occur considerably earlier in the year.
At the gauge inBasel, the percentage ofQI wasmodelled
to amount to 4.5% in August and approx. 6% in
September while at Lobith it is 2.6% in August and
4.2% in September. Thus the relative values are higher
in September. The reason is that the streamflow in
September is generally lower than in August, while the
ice melt component still remains high and its relative
percentage hence increases in September. In addition,
the modelled retention of streamflow in the reservoirs
and lakes and in the river network causes the occurrence
of the maximum fraction of the ice melt component of
streamflow in September.
Streamflow Components:the Long-term Averages
���� ��� ��� ���� ����
12
�����
�����
��
����
� ��
���
�� � ��
����
���
�����
� � ���
��� ��
� �
�����������
���� ���� ����
���
�
���
�����������
���� ���� ����
���
��
����
�����������
���� ���� ����
������
�����
������������������
���� ���� ����
���
��
�����
�������������
���� ���� ����
��
���
����
�
�����������
���� ���� ����
���
��
����
���
� ���� ��� �� �
���� ���� ����
��
��
���
���
������
!�"���
���� ���� ����
���
��
������
��
#��$��%���
���� ���� ����
���
���
����
��
�������
���� ���� ����
���
�
�����
��
�&��
���� ���� ����
���
��
������
��
���"
���� ���� ����
���
��
�����
��
��'��
���� ���� ����
���
��
�����
��
�����
���� ���� ����
���
����
� ����� �
���� ���� ����
���
�
����
�
� ������
�������������������������
�������!��!�
"#
"$
"�
"%&������� �����%����
'��!%��������
Figure 4: Modelled annual means of the streamflow components and their relative fractions of total annual streamflow from
1901–2006 for various gauges in the Rhine basin.
���� ���� ���� ���� ����
13
��������� ����� ��������� ��
��
����
����
����
� � � � � � � ��
��
��
��
��
� � � � � � �
�
���
���
���
�
����
����
���
�
��
��
��
��
�
��
��
��
�
���
�
��
��
��
��
���
�
��
��
��
��
���
�
��
��
��
��
���
�
��
��
��
��
������������������������� ��������
!"���#����"�$"�
!$����%����
&'���(��'���
')����%����
���������
�������
���������
���������
���������
*�$���"��'+�"$,��$"'-�.��/��0���123
*�$���"��'+�"$,��$"'-�.��/��0���1�3
*�$���"��'+�"$,��$"'-�.��/��0��1�3
*�$���"��'+�"$,��$"'-�.��/��0��3
*�$���"��'+�"$,��$"'-�.��/��0��1�3
�3
�3
��3
��3
��3
��3
�/3
2�3
��3
��3
��3
�/3
��3
��3
44% 45 4')� 4��(
Figure 5: Hydrological regimes with modelled streamflow components of rain, snowmelt, ice melt at the selected gauges in the
Rhine basin (left: absolute values with the long-term mean as a line; right: relative fractions).
���� ���� ��� ��� ����
14
Box 3:Changes in the Ice Melt Component in the 20th Century
��������������� ������������
���
���
���� ���� ���� ���� ���� ����
���
���
��������
����������������������
����
����
�
�������
�������
�������
����� �
�������
�������
�������
�������
�������
�������
�� ����
!������"�����##"������"�#$����%!�&�
�
��
�
�
�
�
�
�
�� ���� ���
����
���
���
��� ��
!������%!������� ���'� �����(�������������
��
��
�
� ��
� �����
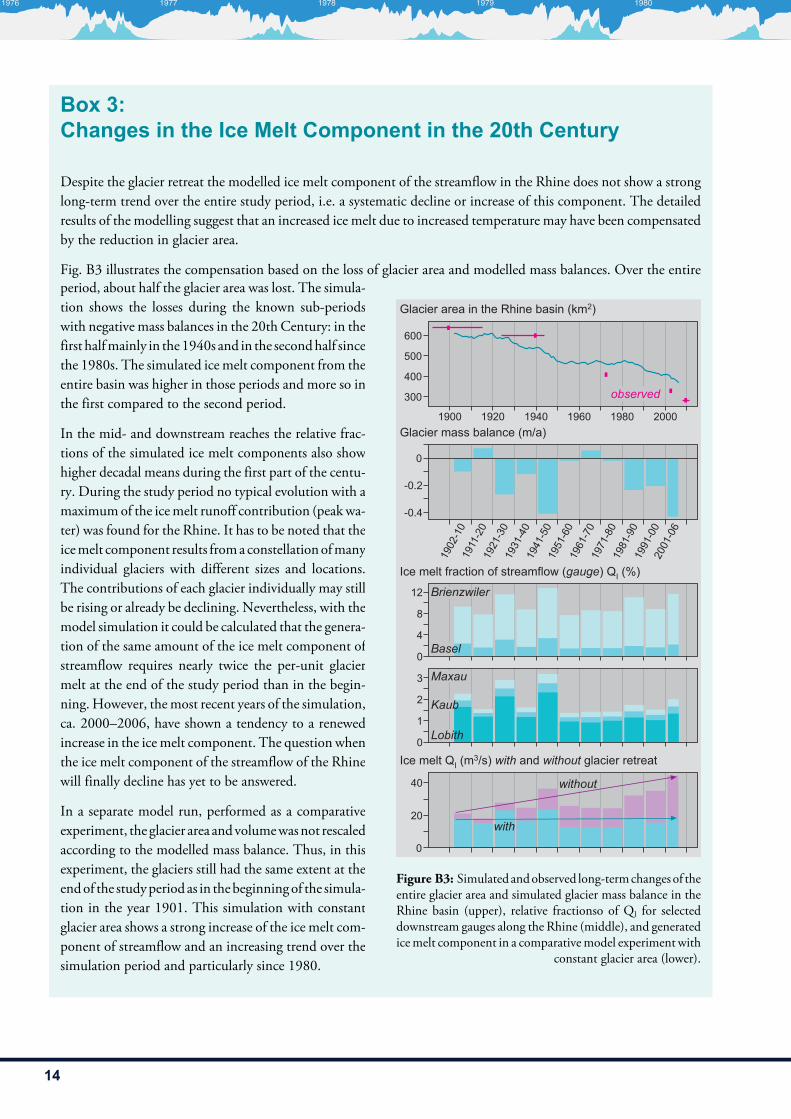
Figure B3: Simulated andobserved long-termchangesof the
entire glacier area and simulated glacier mass balance in the
Rhine basin (upper), relative fractionso of QI for selected
downstream gauges along the Rhine (middle), and generated
icemelt component in a comparativemodel experiment with
constant glacier area (lower).
Despite the glacier retreat the modelled ice melt component of the streamflow in the Rhine does not show a strong
long-term trend over the entire study period, i.e. a systematic decline or increase of this component. The detailed
results of the modelling suggest that an increased ice melt due to increased temperature may have been compensated
by the reduction in glacier area.
Fig. B3 illustrates the compensation based on the loss of glacier area and modelled mass balances. Over the entire
period, about half the glacier area was lost. The simula-
tion shows the losses during the known sub-periods
with negative mass balances in the 20th Century: in the
first halfmainly in the1940s and in the secondhalf since
the 1980s. The simulated ice melt component from the
entire basin was higher in those periods and more so in
the first compared to the second period.
In the mid- and downstream reaches the relative frac-
tions of the simulated ice melt components also show
higher decadal means during the first part of the centu-
ry. During the study period no typical evolution with a
maximumof the icemelt runoff contribution (peakwa-
ter) was found for the Rhine. It has to be noted that the
icemelt component results froma constellationofmany
individual glaciers with different sizes and locations.
The contributions of each glacier individually may still
be rising or already be declining. Nevertheless, with the
model simulation it could be calculated that the genera-
tion of the same amount of the ice melt component of
streamflow requires nearly twice the per-unit glacier
melt at the end of the study period than in the begin-
ning. However, themost recent years of the simulation,
ca. 2000–2006, have shown a tendency to a renewed
increase in the ice melt component. The question when
the ice melt component of the streamflow of the Rhine
will finally decline has yet to be answered.
In a separate model run, performed as a comparative
experiment, the glacier area andvolumewasnot rescaled
according to the modelled mass balance. Thus, in this
experiment, the glaciers still had the same extent at the
endof the studyperiod as in thebeginningof the simula-
tion in the year 1901. This simulation with constant
glacier area shows a strong increase of the ice melt com-
ponent of streamflow and an increasing trend over the
simulation period and particularly since 1980.
���� ���� ���� ���� ����
15
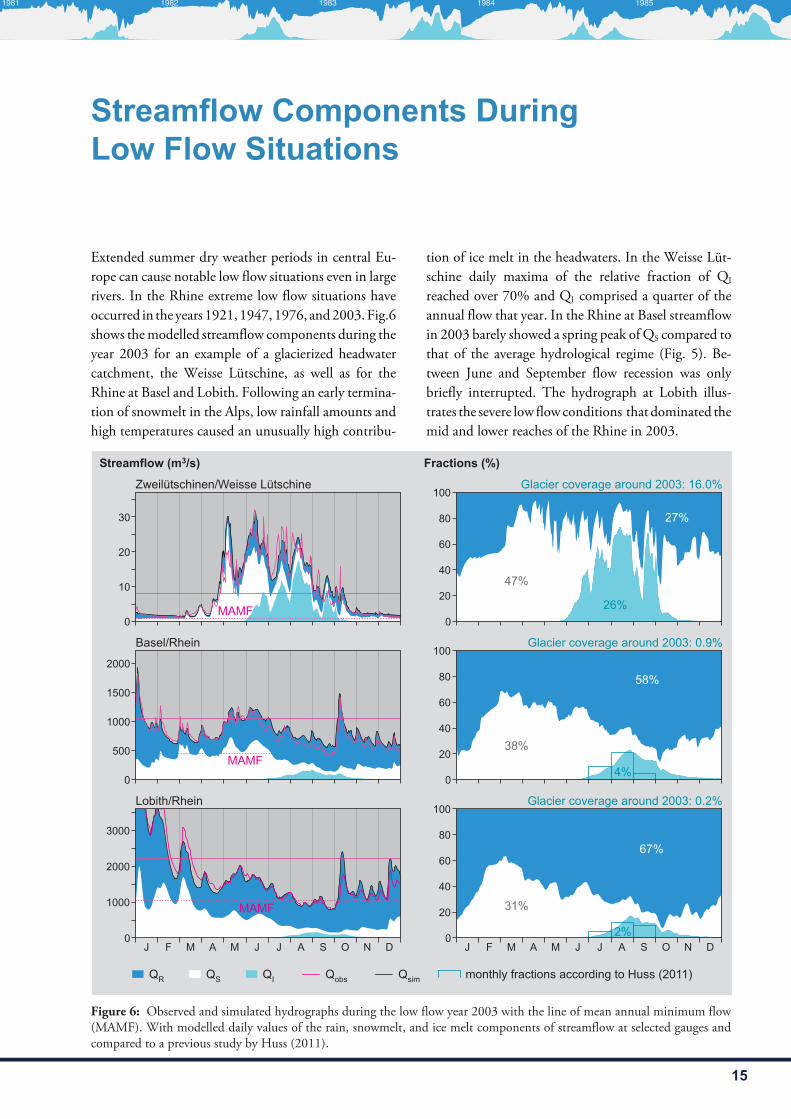
Extended summer dry weather periods in central Eu-
rope can cause notable low flow situations even in large
rivers. In the Rhine extreme low flow situations have
occurred in the years 1921,1947,1976, and2003.Fig.6
shows themodelled streamflow components during the
year 2003 for an example of a glacierized headwater
catchment, the Weisse Lütschine, as well as for the
Rhine at Basel and Lobith. Following an early termina-
tion of snowmelt in the Alps, low rainfall amounts and
high temperatures caused an unusually high contribu-
tion of ice melt in the headwaters. In the Weisse Lüt-
schine daily maxima of the relative fraction of QI
reached over 70% and QI comprised a quarter of the
annual flow that year. In the Rhine at Basel streamflow
in 2003 barely showed a spring peak of QS compared to
that of the average hydrological regime (Fig. 5). Be-
tween June and September flow recession was only
briefly interrupted. The hydrograph at Lobith illus-
trates the severe low flowconditions that dominated the
mid and lower reaches of the Rhine in 2003.
Streamflow Components DuringLow Flow Situations
Figure 6: Observed and simulated hydrographs during the low flow year 2003 with the line of mean annual minimum flow
(MAMF). With modelled daily values of the rain, snowmelt, and ice melt components of streamflow at selected gauges and
compared to a previous study by Huss (2011).
���� ���� ��� ��� ����
16
���� ���� ���� ��� ��� ��� ���
��� ������������������
�������������
� ��
���
���
���
���
�
�� ��
�!��"���
#$�
% "�� ���
#��
&������'���
'� (
)�� ����'�
*���
'�+��
)���� ��,�#
%�-�����
.���
)�� /�
.��//�%���
'��� /� �)��
#� �� (�.�"� ��
.�!//,0/���� �%���
��1��"��
.�� (�����%���
2 /� �3��
#� �� ����.��/� (���%��
4���
����
5���
��
5���
��
55��
��55
����
566
��
566
��
566
��
��6
����6�
���
�����
��������
���6�56
���
��������
�454
���
��
�45�
�46
����
�� �� �
7
777
77
777
77
77
77
777
7 77
8,������ 8)
83
8�
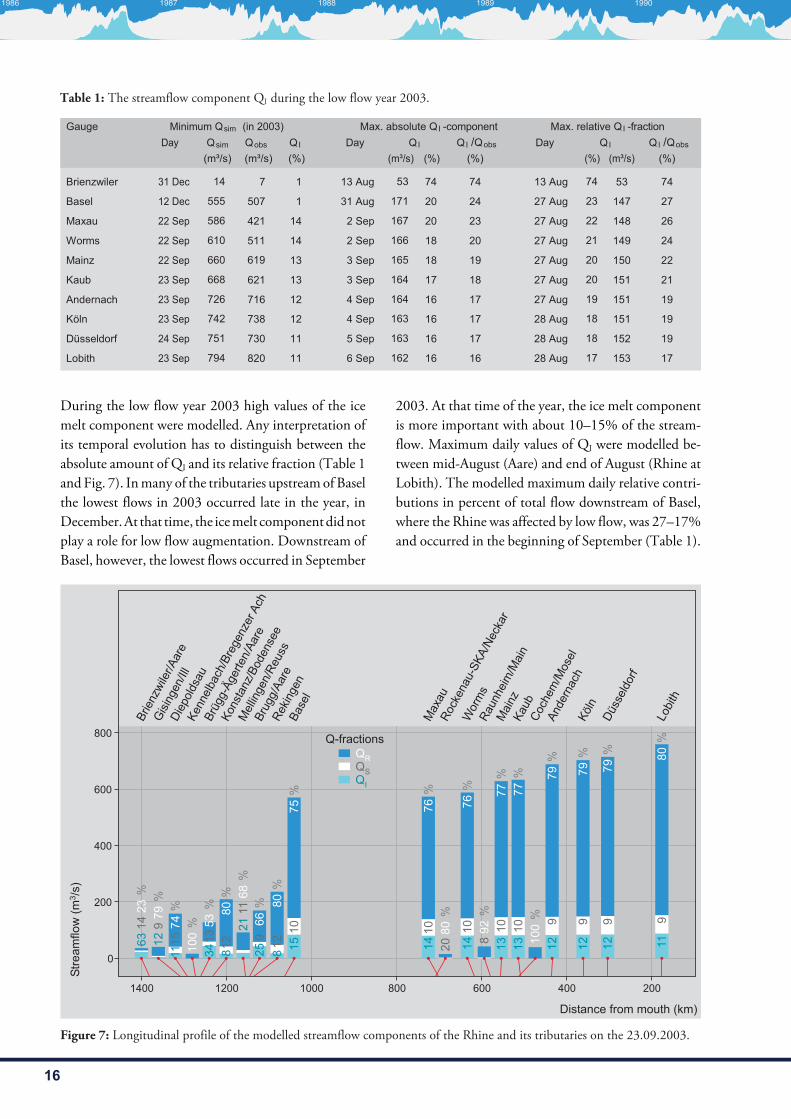
During the low flow year 2003 high values of the ice
melt component were modelled. Any interpretation of
its temporal evolution has to distinguish between the
absolute amount of QI and its relative fraction (Table 1
and Fig. 7). Inmany of the tributaries upstreamof Basel
the lowest flows in 2003 occurred late in the year, in
December.At that time, the icemelt componentdidnot
play a role for low flow augmentation. Downstream of
Basel, however, the lowest flows occurred in September
2003. At that time of the year, the ice melt component
is more important with about 10–15% of the stream-
flow. Maximum daily values of QI were modelled be-
tween mid-August (Aare) and end of August (Rhine at
Lobith). The modelled maximum daily relative contri-
butions in percent of total flow downstream of Basel,
where the Rhine was affected by low flow, was 27–17%
and occurred in the beginning of September (Table 1).
Figure 7: Longitudinal profile of the modelled streamflow components of the Rhine and its tributaries on the 23.09.2003.
Table 1: The streamflow component QI during the low flow year 2003.
�����
����� ��
����
�����
�����
���
����
�������
��
����� ����
�����
���� !�� " #$$%&��' !�� !��� !(
"�)*�& "�)*�& "+&
%, ��� ,- . ,
,# ��� /// /$. ,
## 0�1 /23 -#, ,-
## 0�1 3,$ /,, ,-
## 0�1 33$ ,%
#% 0�1 332 3#, ,%
#% 0�1 .#3 .,3 ,#
#% 0�1 .-# .%2 ,#
#- 0�1 ./, .%$ ,,
#% 0�1 .4- 2#$ ,,
3,4
���5 ���� ��� !(
��' !(
"�)*�& "+& "+&
,% ��� /% .- .-
%, ��� ,., #$ #-
# 0�1 ,3. #$ #%
# 0�1 ,33 ,2 #$
% 0�1 ,3/ ,2
% 0�1 ,3- ,. ,2
- 0�1 ,3- ,3 ,.
- 0�1 ,3% ,3 ,.
/ 0�1 ,3% ,3 ,.
3 0�1 ,3# ,3 ,3
,4
6���1���!( *!���
���5 �� ��7� !( 6������
,% ��� .- /% .-
#. ��� #% ,-. #.
#. ��� ## ,-2 #3
#. ��� #, ,-4 #-
#. ��� #$ ,/$
#. ��� #$ ,/, #,
#. ��� ,4 ,/, ,4
#2 ��� ,2 ,/, ,4
#2 ��� ,2 ,/# ,4
#2 ��� ,. ,/% ,.
##
��' !(
"+& "�)*�& "+&!( *!���
���� ���� ���� ���� ����
17
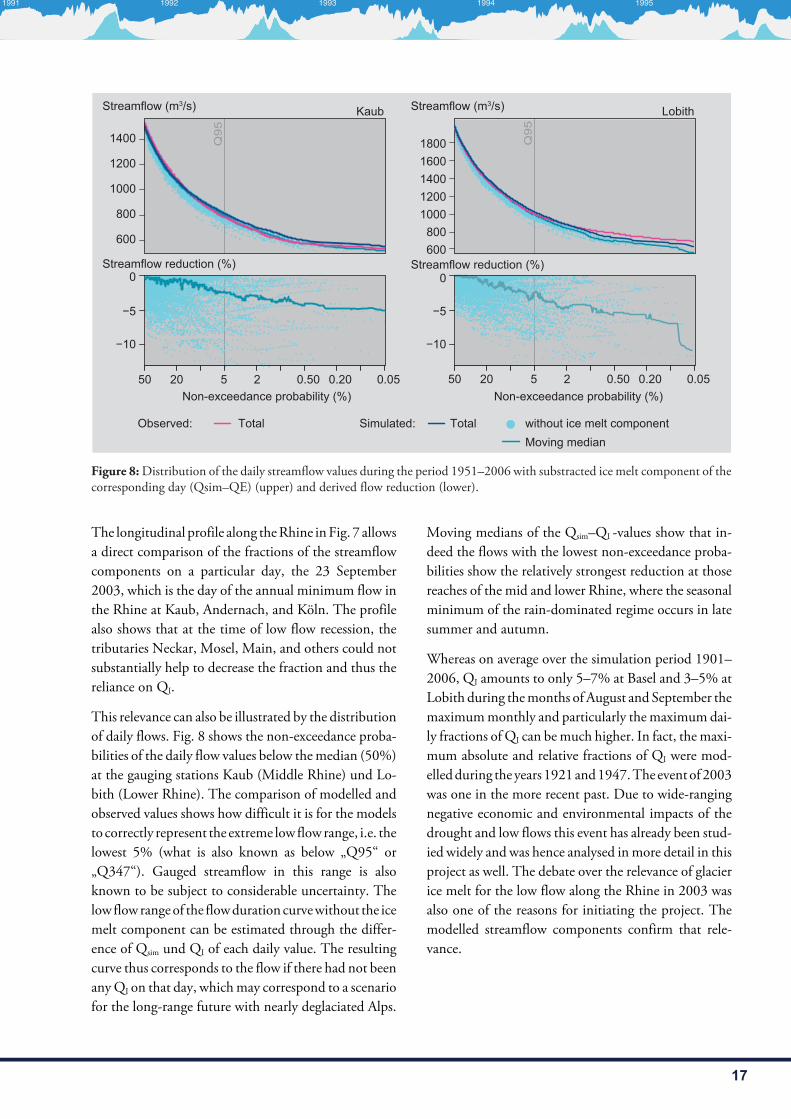
Figure 8:Distribution of the daily streamflow values during the period 1951–2006 with substracted ice melt component of the
corresponding day (Qsim–QE) (upper) and derived flow reduction (lower).
���
���
�� �� � � ���� ���� ����
��
�� �� � � ���� ���� ����
� ����������� ��������
������� !� ������ ! " �� ���� ���#�������# �$ %�%�& ��%'��� �%�
( %)�*#�� %#��$� ������+��,� ( %)�*#�� %#��$� ������+��,�
" ��
�������� ���� #�� %��,�
-��
.��
-��.��
������� ��������
������� ���� #�� %��,��
The longitudinal profile along theRhine inFig. 7 allows
a direct comparison of the fractions of the streamflow
components on a particular day, the 23 September
2003, which is the day of the annual minimum flow in
the Rhine at Kaub, Andernach, and Köln. The profile
also shows that at the time of low flow recession, the
tributaries Neckar, Mosel, Main, and others could not
substantially help to decrease the fraction and thus the
reliance on QI.
This relevance can also be illustrated by the distribution
of daily flows. Fig. 8 shows the non-exceedance proba-
bilities of the daily flow values below themedian (50%)
at the gauging stations Kaub (Middle Rhine) und Lo-
bith (Lower Rhine). The comparison of modelled and
observed values shows how difficult it is for the models
to correctly represent the extreme low flowrange, i.e. the
lowest 5% (what is also known as below „Q95“ or
„Q347“). Gauged streamflow in this range is also
known to be subject to considerable uncertainty. The
low flowrangeof the flowdurationcurvewithout the ice
melt component can be estimated through the differ-
ence of Qsim und QI of each daily value. The resulting
curve thus corresponds to the flow if there had not been
anyQI on that day, whichmay correspond to a scenario
for the long-range future with nearly deglaciated Alps.
Moving medians of the Qsim–QI -values show that in-
deed the flows with the lowest non-exceedance proba-
bilities show the relatively strongest reduction at those
reaches of the mid and lower Rhine, where the seasonal
minimum of the rain-dominated regime occurs in late
summer and autumn.
Whereas on average over the simulation period 1901–
2006, QI amounts to only 5–7% at Basel and 3–5% at
Lobith during themonths of August and September the
maximummonthly and particularly the maximum dai-
ly fractions of QI can bemuch higher. In fact, the maxi-
mum absolute and relative fractions of QI were mod-
elledduring theyears 1921and1947.The eventof2003
was one in the more recent past. Due to wide-ranging
negative economic and environmental impacts of the
drought and low flows this event has already been stud-
ied widely and was hence analysed inmore detail in this
project as well. The debate over the relevance of glacier
ice melt for the low flow along the Rhine in 2003 was
also one of the reasons for initiating the project. The
modelled streamflow components confirm that rele-
vance.
���� ���� ��� ��� ����

18
For the first time, theASG-Rhine project quantified the
daily fractions of the rain, snowmelt, andglacier icemelt
components of streamflow over the long period from
1901–2006 for the entire Rhine basin. As with every
model simulation, the results contain a number of un-
certainties due to uncertainties in the underlying data,
the simplifiedprocess representationby themodels, and
model parameterization.Theproject carried out anum-
ber of analyses to improve the understanding of these
uncertainties.Overall, the conclusion is that theydonot
affect the principal findings, which is owed in particular
to the detailed consideration of observation-based data
of glacier change as well as of the dynamics of snow and
runoff generation processes in the models. The elabo-
rate model chain adapted for this project, which allows
the tracking and analysis of the three streamflow com-
ponents through the system, also offers a new tool for
the analysis of climate and regulation scenarios.
Three results appear to be particularly important with
regard to climate change and the expectation that sum-
mers will get warmer and drier in the future:
The considerable fraction of the snowmelt compo-nent of streamflow along the entire Rhine over the
whole year highlights the relevance of further research
especially on this component. For the hydrological
regime and the seasonal water balance one question is
whether the projected increased winter precipitation
can compensate for the expected future reduction of the
snowmelt component. Considering the relevance of the
snowmelt component for streamflow, in particular an
improved analysis and integration of observation data
into the models will be important.
The onlyminor change in the glacier icemelt compo-nent of streamflow over the long time period 1901–
2006 canbe attributed to the process of an increasing ice
melt compensated by a simultaneous glacier retreat.
Due to data availability, the modelling period ended in
2006. Since then, however, several exceptionally warm
summers with high glacier melt rates have occurred.
With respect to climate change, the question of when
the ice melt component at the scale of the entire Rhine
basin will definitely start to decline is thus still unre-
solved. Nevertheless, the modelling suggests that at the
end of the study period a runoff generation nearly twice
as high as in the beginning was needed per unit area of
glacier to generate the same amount of ice melt in the
basin as in the early 20th Century.
Currently, theglacier icemelt component still plays animportant role for the sustenance of low flows alongthe mid and lower reaches of the Rhine, where extreme
low flows often occur in late summer. The results of the
daily modelling suggest that during extreme situations
as in 1921, 1947, and 2003 for example, low flows in
August and September had high maximum daily frac-
tions of ice melt that amounted to a third of the total
streamflow atBasel and a fifth of the flow at Lobith.The
modelling confirmed that the drought and heat wave in
2003 might have caused a considerably less severe low
flow situation, had it occurred earlier in the study peri-
od, when glaciers were still larger andwould have gener-
ated more melt water.
Conclusions
���� ���� ���� ���� ����
19
BAFU (Hrsg.) 2012: Auswirkungen der Klimaänderung auf Wasserressourcen und Gewässer. Synthesebericht zum Projekt
«Klimaänderung und Hydrologie in der Schweiz» (CCHydro). Umwelt-Wissen Nr. 1217. Bundesamt für Umwelt
(BAFU), Bern.
Belz J.U., Brahmer G., Buiteveld H., Engel H., Grabher R., Hodel H., Krahe P., Lammersen R., Larina M., Mendel H.-G.,
Meuser A.,Müller G., Plonka B., Pfister L., VuurenW. v. (2007): Das Abflussregime des Rheins und seinerNebenflüsse
im 20. Jahrhundert, Analyse, Veränderungen, Trends, Bericht Nr. I-22 der KHR, Lelystad.
Fischer M., Huss M., Barboux C., Hoelzle M. (2014): The new Swiss Glacier Inventory SGI2010: relevance of using high-
resolution source data in areas dominated by very small glaciers. Arctic, Antarctic and Alpine Research, 46(4), 933–945.
Frick C., Steiner H.,Mazurkiewicz A., Riediger U., RautheM., Reich T., Gratzki A. (2014): Central European high-resolution
gridded daily data sets (HYRAS): Mean temperature and relative humidity. Meteorologische Zeitschrift 23, 15–32.
Görgen K., Beersma J., Brahmer G., Buiteveld H., Carambia M., De Keizer O.,Krahe P., Nilson E., Lammersen R., Perrin C.,
Volken, D. (2010): Assessment of climate change impacts on discharge in the Rhine River Basin: results of the Rhein-
Blick2050 project, Bericht Nr. I-23 der KHR, Lelystad.
HussM. (2011): Present and future contribution of glacier storage change to runoff frommacroscale drainage basins in Europe.
Water Resources Research 47, W07511, doi: 10.1029/2010WR010299 .
HussM., JouvetG., Farinotti D., Bauder A. (2010): Future high-mountain hydrology: a new parameterization of glacier retreat.
Hydrology and Earth System Sciences 14, 815–829.
Ludwig K., BremickerM. (Hrsg.) (2006): TheWater BalanceModel LARSIM -Design, Content and Applications. Freiburger
Schriften zur Hydrologie 22, Institut für Hydrologie der Universität Freiburg, Freiburg. www.hydrology.uni-
freiburg.de/publika/FSH-Bd22-Bremicker-Ludwig.pdf
Maisch M., Wipf A., Denneler B., Battaglia J., Benz C. (2000): Die Gletscher der Schweizer Alpen: Gletscherstand 1850,
Aktuelle Vergletscherung, Gletscherschwundszenarien. Schlussbericht NFP 31. vdf Hochschulverlag ETH Zürich,
Zürich.
Müller F., Caflish T., Müller G. (1976): Firn und Eis der Schweizer Alpen, Gletscherinventar. Vdf Hochschulverlag ETH
Zürich, Zürich.
Paul F., FreyH., Le Bris R. (2011): A new glacier inventory for the European Alps from Landsat TM scenes of 2003: Challenges
and results. Annals of Glaciology 52, 144–152.
Rauthe M., Steiner H., Riediger U., Mazurkiewicz A., Gratzki A. (2013): A Central European precipitation climatology – Part
I: Generation and validation of a high-resolution gridded daily data set (HYRAS). Meteorologische Zeitschrift 22, 235–
256, doi: 10.1127/0941-2948/2013/0436.
Seibert J., Vis M.J.P. (2012): Teaching hydrological modeling with a user-friendly catchment-runoff-model software package.
Hydrology and Earth System Sciences 16, 3315–3325, doi: 10.5194/hess-16-3315-2012.
Stahl K., Weiler M., Freudiger D., Kohn I., Seibert J., Vis M., Gerlinger K., BöhmM. (2016): Abflussanteile aus Schnee- und
Gletscherschmelze im Rhein und seinen Zuflüssen vor dem Hintergrund des Klimawandels. Abschlussbericht an die
Internationale Kommission für die Hydrologie des Rheingebietes (KHR). Bericht CHR 00-2016 2016. www.chr-
khr.org/en/publications
References
���� ���� ��� ��� ����
20
Acknowledgements
The following institutions and persons provided data, models or graphics for the report and project: AVLR (Amt der
Vorarlberger Landesregierung), AWA (Amt fürWasser undAbfall) des Kantons Bern, FOEN (FederalOffice for the
Environment), BfG (Federal Institute of Hydrology, Germany), BMLFUW (Bundesministerium für Land- und
Forstwirtschaft,Umwelt undWasserwirtschaft,Austria, http://ehyd.gv.at/),CRU(University ofEastAngliaClimate
Research Unit, DWD (Deutscher Wetterdienst), ECA&D (European Climate Assessment & Dataset, http://
eca.knmi.nl),MatthiasHuss (Université de Fribourg /ETHZurich), the “LARSIM-developer community ”, LUBW
(Landesanstalt für Umwelt, Messungen und Naturschutz Baden-Württemberg), MeteoSwiss (Bundesamt für
Meteorologie und Klimatologie, Switzerland), Tobias Jonas and Nena Griessinger from SLF (WSL-Institute for
Snow and Avalanche Research), swisstopo (Bundesamt für Landestopografie, Switzerland),WGMS (World Glacier
Monitoring Service, http://wgms.ch/), ZAMG (Zentralanstalt fürMeteorologie undGeodynamik, Austria) and the
authors of the glacier inventories: Fischer et al. (2014), Maisch et al. (2000), Müller et al. (1976), and Paul et al.
(2011).
Besides the authors, the following colleagues and former students worked on specific aspects of the project: Dirk
Aigner, DamarisDe, SimonEtter, David Finger, Claudius Fleischer, Barbara Frielingsdorf, ClaraHohmann,Nicole
Henn, Robert Schweppe, Andreas Steinbrich, and Juliane Schillinger.
We finally thank Jürgen Strub for his work on the graphics of this report, and Stefan Pohl,Michael Stoelzle, andDan
Moore for valuable comments.