The Smaller and Greater English Vowel Spaces of … › files › public › 3 › 32048 › ...The...
31
The Smaller and Greater English Vowel Spaces of Japanese Speakers Kaoru Tomita, Yamagata University, Jun Yamada, Hiroshima University, and Shigenobu Takatsuka, Okayama University
Transcript of The Smaller and Greater English Vowel Spaces of … › files › public › 3 › 32048 › ...The...

The Smaller and Greater English Vowel Spaces of Japanese Speakers
Kaoru Tomita, Yamagata University,
Jun Yamada, Hiroshima University,
and
Shigenobu Takatsuka, Okayama University

2
Abstract
This study investigated how Japanese-speaking learners of English pronounce the three
point vowels /i/, /u/, and /ɑ/ appearing in the first and second monosyllabic words of
noun phrases, and the schwa /ə/ appearing in disyllabic words. First and second
formant (F1 and F2) values were measured for four Japanese speakers and two
American English speakers. The hypothesis that the area encompassed by the point
vowels in the F1/F2 vowel space tends to be smaller for the Japanese speakers than for
the English speakers was verified. The hypothesis that the area formed by the three
schwas in chicken, spoonful, and Tarzan is greater for the Japanese speakers than for
the English speakers and its related hypothesis were largely upheld. Implications for
further research are briefly discussed.

3
Introduction
A standard textbook of Japanese-English phonetics and phonology states that Japanese
vowels are relatively more centralized in a vowel chart as compared to English vowels
(e.g., Homma, 1992; Ito, 1987; Matsui, 1996). It is said, for example, that the
Japanese low vowels /a/ and /o/ are higher than their English counterparts /ɑ/ and /o/
while the Japanese back vowel /u/ is more fronted than English /u/ and /ʊ/. These
phonologically different patterns between English and Japanese invite several
questions as to Japanese speakers learning English. For example, one may ask to
what extent Japanese speakers‟ /ɑ/ in car is different from English speakers‟ in terms of
acoustic properties such as first and second formant (F1 and F2) frequencies.
To our knowledge, however, this and other related questions have not thus far
been addressed. In the current study, we first examined the hypothesis concerning the
English point vowels.
(1) The smaller point-vowel space hypothesis: The triangle area encompassed by
the three English point vowels /i/, /u/, and /ɑ/ in the F1/F2 vowel space is smaller for
Japanese speakers learning English as a second language than for native English
speakers.
This hypothesis is based on two assumptions. First, the effect of L1 (Language
One) interference is so potent that the English vowel space of Japanese learners at the
intermediate level of English becomes smaller. This assumption, however, must
empirically be tested. The second assumption is that the English point vowels are
most spread out in the vowel F1-F2 space when they are accented in clear speech. In
other words, the difference in vowel space between English speakers and Japanese
speakers of English would become great when the accented point vowels are produced
in clear speech, e.g., in citation form. On this assumption, we use an experimental
task in which subjects produce words and phrases in citation form.
We note also that the spectral characteristics may vary substantially due to
coarticulatiory effects depending on specific phonological environments. For

4
example, the /i/ in tea spoon may not be the same as /i/ in true peace if the /i/ in the
first case provides anticipatory front-back information about the following vowel /u/ in
spoon (cf. Alfonso & Baer, 1982). That is, the F2 value of the /i/ in tea may be lower
than that of the /i/ in peace. Note also that the distance between /i/ and /u/ for tea
spoon may turn out to be approximately the same as that between /u/ and /i/ for true
peace if the F2 value of the /u/ in true gets greater to the same extent as the F2 value of
the /i/ in tea gets smaller. Given these possibilities, we need to select and compare
point vowels in two phrases such as tea spoon and true peace.
An equally intriguing issue concerning Japanese speakers‟ vowel space in
English is the issue of the vowel space formed by schwas or schwa-like vowels, which
do not exist as such in Japanese. The nonexistence of the schwa naturally leads the
Japanese speaker to substitute one of the five Japanese vowels /i, u, a, o, e/ for it in
various linguistic environments. Some English loanword in Japanese attests to this
linguistic phenomenon; for example, the first and second vowels in loanwords or
loanword-like words such as chicken, spoonful, and Tarzan are similarly pronounced,
i.e., /ʧikin/, /spu:nful/, and /ta:zan/, respectively. An empirical question here is
whether Japanese speakers at an intermediate level of English have acquired the
English-like schwa /ə/. The following hypotheses are formulated from this question.
(2) The greater schwa-space hypothesis: The schwa triangle area formed by
chicken, Tarzan, and spoonful in the F1/F2 space is greater for Japanese speakers than
for native English speakers.
(3) The shorter vowel-distance hypothesis: The first and second vowels in word
such as chicken and Tarzan are the same or similar for Japanese speakers, so that the
distances between theses vowels in words are shorter for Japanese speakers than for
native English speakers.
Two previous studies are relevant to these hypotheses. One is Kondo (2000), in
which advanced- and intermediate-level Japanese speakers of English were asked to
read English sentences which included an unstressed form of the indefinite article a.

5
The results revealed that the intermediate-level learners‟ schwas varied greatly in F2,
indicating that some were characterized as low vowels, whereas the advanced-level
speakers‟ were by and large native-like. However, Kondo failed to point out that at
least some tokens of the schwa that those intermediate-level speakers produced were
also native-like in terms of both F1 and F2 values (see Figure 2.1, p. 34).
The other study of relevance to our study was conducted by Lee, Guion, and
Harada (2006). These researchers found that late Japanese-English bilinguals
produced English schwas which were more dispersed in the vowel space than native
English speakers and early Japanese-English bilinguals, thereby showing that the mean
distance between the schwas in words such as introduce and kangaroo in the vowel
space was longer for the late Japanese-English bilinguals than for the latter two groups.
In this regard, our study may be taken as a replication study using less proficient
Japanese-English bilinguals, but we would, in addition, attempt to ascertain whether
these hypotheses are tenable in all word contexts. Just like Kondo (2000), Lee et al.
(2006) indicated only a general tendency for less fluent Japanese English learners to
expand the English schwa. Although the F1 and F2 values of the „idealized‟ schwa
may be 500 Hz and 1,500 Hz (e.g., Lieberman & Blumstein, 1988, p. 37), several
studies suggest that coarticulatiory effects are so great that the schwa is viewed as a
vowel with no articulatory target position or a vowel having no acoustic identity of its
own (e.g., Browman & Goldstein, 1992, cf. van Bergem, 1994). In this study, we
wanted to learn more about F1 and F2 values of the schwa in various linguistic
environments
Method
Subjects
One female and one male speaker of American English (hereafter FE and ME)
and two female and two male Japanese speakers (FJ1, FJ2, MJ1, and MJ2) served as
subjects. The native English speakers aged xx and xx years were both from Texas
and had a minimum of 18 years experience as English teachers at the college level in

6
Japan. The four Japanese speakers who were from Northern or Central Japan were
college students and their ages ranged from 19 to 23 years. The TOEIC® scores were
645, 755, 495, and 750 points for FJ1, FJ2, MJ1, and MJ2, respectively, and they were
regarded as intermediate-level learners of college English.
Stimuli
The stimuli consisted of three pairs of noun phrases and five disyllabic words.
The phrase stimuli were (1) tea spoon (/i-u/) and true peace (/u-i/), (2) car user (/a-u/)
and blue car (/u-a/), and (3) Far east (/a-i/) and peace march (/i-a/). Each stimulus
item was printed in a carrier phrase “the ” on a x cm × x cm sheet of
paper.
The disyllabic words were (1) spoonful, (2) chicken, (3) Tarzan, (4) redden, and
(5) common. While the words chicken, Tarzan, and common are used as English
loanwords in everyday Japanese, the words spoonful and redden are not loanwords but
spoon and red are. As stated in the Introduction, the second vowels in these words
may be pronounced in the same manner as the first vowels in the same words. But
one exception may be redden due to the possible effects of English words that Japanese
learners are likely to learn in early stages of English language learning. There seem
to be two sets of words in which the <-den> and /-den/ association competes with the
<-den> and /-dun/ or /-don/ association in the learners‟ mental lexicons. The first set
includes words such as garden (pronounced /ga:den/ by Japanese learners of English)
and Sweden (/swe:den/), and the second includes words such as sudden (/sadun/ or
/sadon/) and widen (/waidun/). If the effect of the second set wins out, the distance
between the vowels in redden would be longer than those for the other words.
Each word item was printed in isolation on a x cm × x cm sheet of paper.
Procedure
Each speaker was presented with each test sheet and asked to clearly produce
each test item 10 times. Each was instructed to pronounce each word as clearly as
possible. This instruction was important particularly for native English speakers

7
because schwa elision in conversational speech is not uncommon.
Recordings were made of 110 items (6 speakers×11 items×10 times) per
subject using a Sony unidirectional dynamic microphone (F-V640) and a Marantz solid
state recorder (PMD670) in a sound treated room. The microphone was positioned at
a lip-to-mouth distance of approximately five cm.
Acoustic measurements
The speech samples were analyzed using the Praat speech analyzing software
(http: www.praat.org). The sampling rate was 44.1 kHz with a 16 bit resolution. For
each vowel, an attempt was made to select some duration of the steady-state segment,
and the mean F1 and F2 values were used for analysis. The durations ranged from xx
to xx msec.
Measurements could be difficult especially when we missed one of the formants.
To avoid missing formants, we used example formant data from previous studies
(Hillenbrand, Getty, Clark, & Wheeler, 1995; Labov, Ash, & Boberh, 2006) as a guide
to where we should expect the target formats to occur.
Analysis
F1 and F2 values were compared between same gender subjects but not between
female and male subjects. This was done because gender effects on acoustic
properties could be far greater than the factors considered in this study (see
Hillenbrand et al., 1995; Huber et al., 1999). An analysis of variance (ANOVA) with
repeated measures was a basic tool used for mean comparisons.
Results
Point vowels
The mean F1 and F2 values of the point vowels appearing in first and second
word positions in the experimental phrases for each subject in the female and male
groups are shown in Tables 1 and 2.

8
-------------------------------------------------
TABLES 1 AND 2 GO ABOUT HERE
-------------------------------------------------
A 2 × 3 ANOVA with two word positions and three speakers was performed to
examine the speaker effect in each gender. The patterns of results appeared similar
between the female and male speakers, and we will describe the major results of the
female speakers and add those of the male speakers, if informative.
For /i/, the F1 values in the first word position were significantly lower for the
English speaker than for the Japanese speakers (see Table 1), thereby suggesting that
the tongue height of the Japanese speakers was lower than that of the English speaker.
The same tendency, though somewhat weak, was observed in the second word position.
On the other hand, the F2 values relating to the front-back feature did not very clearly
distinguish between the English speaker and the Japanese speakers. However, the
male English speaker was more different both in F1 and in F2 in each word position
from the male Japanese speakers.
For /u/, the F1 values in the first word position were significantly lower for the
English speaker than for one or both of the Japanese speakers, the results of which may
be attributable to the Japanese speakers‟ characteristic feature [- rounding]. The F1
values in the second word position were relatively higher even for the English speaker
and did not exhibit a simple pattern. This is probably because the vowel in this
position was unstressed and reduced to a somewhat schwa-like vowel. Evidence in
support of this interpretation was the lower mean F0 value in the second word position
than that in the first for the English speaker. The patterns of the F2 values were more
complicated than those of the F1 values, but evidently related to accent patterns. We
will discuss some of them later.
For /ɑ/, the F1 and F2 values varied according to individuals and items. The
English speaker‟s F1 value for car user was significantly higher than Japanese speaker
2‟s but did not differ from Japanese speaker 1‟s. The English speaker‟s F1 value for
9
Far East was lower than Japanese speaker 1‟s but approximately the same as Japanese
speaker 2‟s. It may be noted that the F 1 value of the English speaker was
significantly lower for Far East than for car user. Again, this may be due to the
result that the English speaker less accented Far as compared to car. Such a tendency
was not observed for the Japanese speakers. The F2 values did not seem to show the
results which are consistent with the smaller point-vowel space hypothesis.
In summary, the results shown in Tables 1 and 2 were that while some accented
point vowels produced by the English speakers were more peripherally placed in the
F1/F2 space than the Japanese speakers, unaccented point vowels distinguished to a
lesser degree between the English speakers and the Japanese speakers.
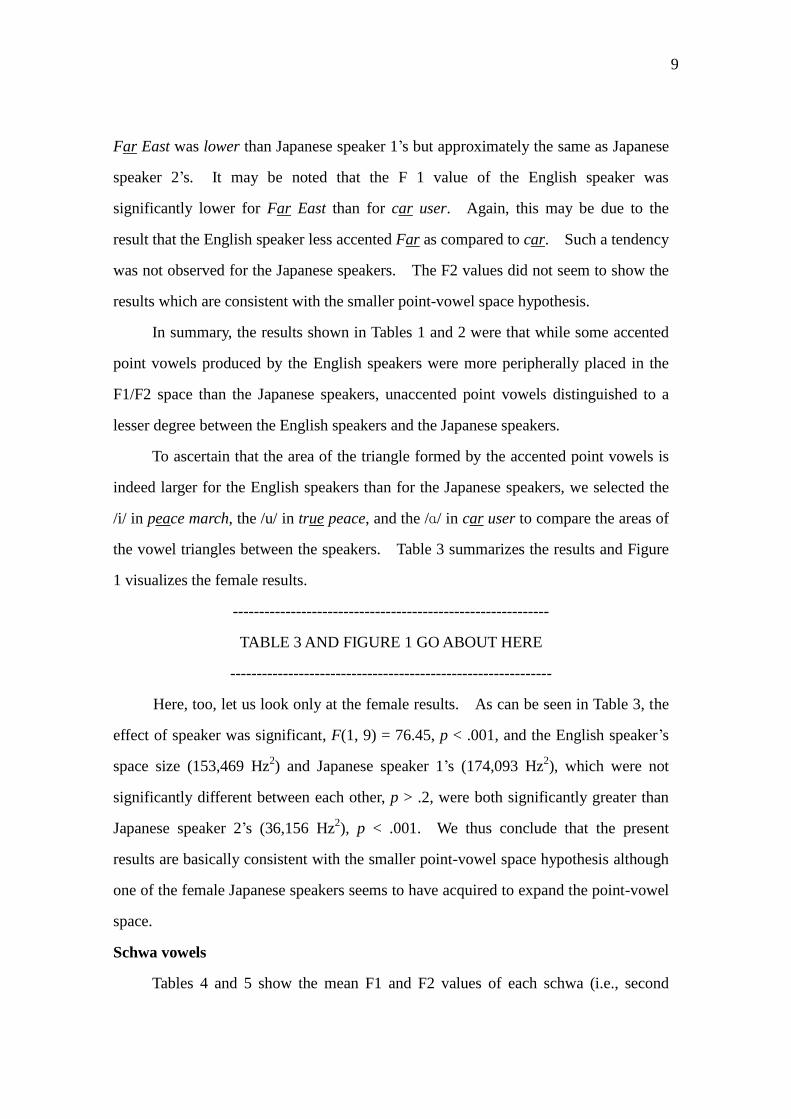
To ascertain that the area of the triangle formed by the accented point vowels is
indeed larger for the English speakers than for the Japanese speakers, we selected the
/i/ in peace march, the /u/ in true peace, and the /ɑ/ in car user to compare the areas of
the vowel triangles between the speakers. Table 3 summarizes the results and Figure
1 visualizes the female results.
------------------------------------------------------------
TABLE 3 AND FIGURE 1 GO ABOUT HERE
-------------------------------------------------------------
Here, too, let us look only at the female results. As can be seen in Table 3, the
effect of speaker was significant, F(1, 9) = 76.45, p < .001, and the English speaker‟s
space size (153,469 Hz2) and Japanese speaker 1‟s (174,093 Hz
2), which were not
significantly different between each other, p > .2, were both significantly greater than
Japanese speaker 2‟s (36,156 Hz2), p < .001. We thus conclude that the present
results are basically consistent with the smaller point-vowel space hypothesis although
one of the female Japanese speakers seems to have acquired to expand the point-vowel
space.
Schwa vowels
Tables 4 and 5 show the mean F1 and F2 values of each schwa (i.e., second

10
vowel) of the five experimental words for the female and male speakers, respectively.
--------------------------------------------------
TABLES 4 AND 5 GO ABOUT HERE
--------------------------------------------------
Here, too, we describe only the major results from the female speakers in some detail.
As can be seen from Table 4, the F1 and F2 values greatly vary across the words, and
the word spoonful seems to be an exception for all three speakers. Thus, with
spoonful excluded, the difference between the highest and lowest F1 values for the
English speaker was found to be only 28 Hz and the difference between the highest and
lowest F2 values, 276 Hz although the effects of word on those values were still
significant. In contrast, the differences between the highest and lowest F1 and F2
values were 473 Hz and 857 Hz for Japanese speaker 1 and 334 Hz and 1321 Hz for
Japanese speaker 2, respectively. These findings are consistent with the greater
schwa-space hypothesis for Japanese speakers. Figure 2 also indicates the validity of
this hypothesis regarding the schwa voweos in chicken, Tarzan, and spoonful. To
statistically verify the hypothesis, we compared the triangle areas between the speakers.
The effect of speaker was highly significant, F(2, 9) = 296.36, p < .001. The mean
area 12,280 Hz2 for the female English speaker was far smaller than those 103,654 Hz
2
and 148,123 Hz2 for female Japanese speakers 1 and 2, these latter speakers‟ areas
were not significantly different between them. Basically the same results were
observed for the male speakers. We thus conclude that the present findings are
consistent with the greater schwa-space hypothesis, namely that the Japanese speakers‟
schwa vowels span greater vowel space in the F1-F2 vowel space than do the native
English speakers‟.
-------------------------------------------
FIGURE 2 GOES ABOUT HERE
-------------------------------------------
As was expected, the effects of word on F1 and F2 values for schwas, however,

11
varied greatly across individual words and speakers, and we tested the longer
vowel-distance hypothesis taking the variability in account. The results are presented
in Tables 6 and 7 for the female and male speakers.
--------------------------------------------------
TABLES 6 AND 7 GO ABOUT HERE
--------------------------------------------------
From Tables 6 and 7 we see that common is the only word that is consistent with the
shorter vowel-distance hypothesis, the vowel distance clearly distinguishing between
the English speakers and the Japanese speakers.
Related to this, inspection of the first and second vowels common suggested that
the Japanese speakers‟ second vowel was not schwa-like but somewhat similar to the
first vowel. More specifically, the same vowel-schwa hypothesis was tested by
comparing the F1 and F2 values of the first vowel and those of the schwa in each word.
The results are shown in Table 8.
-----------------------------------------
TABLE 8 GOES ABOUT HERE
-----------------------------------------
As can be seen from Table 8, the first part of the longer vowel-distance hypothesis (i.e.,
the first and second vowels in word such as chicken and Tarzan are the same or similar
for Japanese speakers) is not fully supported; instead, only a general tendency for the
Japanese speakers‟ first vowel and second schwa to be more similar than the English
speakers‟ is suggested. For example, for female Japanese FJ2, the F1 values were not
significantly different between the first vowel and schwa for redden and spoonful; and
the F2 values were not significantly different between these vowels for common. By
contrast, for the female English speaker, the F1 and F2 values were greatly different
between these vowels except for the F1 value of spoonful.
Discussion
A precise description of English vowel quality of Japanese speakers of English

12
has been unavailable. This study examined the smaller point-vowel space hypothesis
for the three point vowels /i, u, ɑ/ and the greater schwa-space and longer
vowel-distance hypotheses for the schwa vowel.
The smaller point-vowel space hypothesis
The smaller point-vowel space hypothesis that Japanese speakers‟ point-vowel
space formed in the F1-F2 vowel space is smaller than English speakers‟ when the
point vowels /i, u, ɑ/ are accented in clear speech was basically supported, and one of
the female Japanese speakers produced as large a vowel space as the female English
speaker (see Figure 1). Probably, this female Japanese speaker had acquired the
vowel space of these English point vowels. If so, it would indicate that L1
interference, though real and prevalent extensively, is relatively easier to overcome.
The reduction of vowel space in Japanese speakers, however, does not mean that
the vowel space uniformly shrinks across the board. Rather, the tongue height and
front-back features vary depending on individual point vowels and also on linguistic
contexts. Specifically, for the accented /i/, the Japanese speakers showed a lower
degree of tongue height (see Table 1 and Figure1), but were generally the same as the
English speakers in terms of the front-back dimension. Likewise, for the accented /u/,
the Japanese speakers‟ F1 values tended to be lower as compared to the English
speakers‟ (Table 1 and Figure 1). We don‟t know whether this indicates that the
Japanese speakers‟ tongue height was lower than the English speakers‟ or whether that
is attributable to the possibility that the Japanese speakers have the [-rounding] feature
for /u/ or both.
The greater schwa-space and longer vowel-distance hypotheses
In marked contrast to the smaller point-vowel space hypothesis was the greater
schwa-space hypothesis, the finding which suggests that the effect of L1 was so potent
that none of the Japanese speakers were able to reduce the schwas (Figure 2). While
the general picture which emerged here was expanded schwa space for the Japanese
speakers, the patterns of the relations of their schwas to the English speakers‟ greatly

13
varied depending on the word contexts, and we will take a brief look at each case for
the female group below.
For common, the Japanese speakers‟ schwas were more outwardly located with
the place much lower and more backed than the English speakers‟, so that they
resemble Japanese /a/ rather than its /o/ (cf. Vance, 2008, p. 70). This case may be
viewed as a paradigm example of L1 interference if we assume that the difference
between Japanese /a/ and /o/ is not very large.
For chicken, the Japanese speakers‟ F2 values were greater than the English
speaker‟s, thus suggesting that their schwas are more peripherally placed in the
front-back dimension, i.e., more /i/-like in this respect although Japanese speaker 2‟s
F1 value is much higher than the typical F1 value of /i/. However, note also that
Japanese speaker 1 produced higher F1 and higher F2 values for the schwa in chicken
(579 Hz and 2,348 Hz) than the point vowel in peace (268 Hz and 2,903 Hz), thus
indicating that she had acquired the basic features of English schwa.
Tarzan is of interest in that the two Japanese speakers differentially learned the
target F1 and F2 values; that is, Japanese speaker 1 had a F2 value of 1,922 Hz, which
was close to the English speaker‟s 1,937 Hz, whereas her F1 value 677 Hz was
significantly different from the English speaker‟s 490 Hz (Table 4). Japanese speaker
2 exhibited an opposite pattern, whose F1 value 482 Hz was not significantly different
from the English speaker‟s but her F2 value 1,840 Hz was significantly lower than the
English speaker‟s.
Redden is also of interest in that it shows a difference between the Japanese
speakers. In the Method section, we hypothesized that if the effect of the learning of
the <-den> and /-dun/ or /-don/ association is great enough, the distance between the
vowels in redden would be longer than those for the other words. However, Japanese
speaker 2 exhibited a reverse pattern, i.e., the distance between the vowels being the
shortest for this word than for the other words, which indicates that this speaker
pronounced red and den in redden in a more similar manner than the two vowels in the

14
other words (see Tables 6 and 8).
For spoonful, Japanese speaker 1 had a similar F2 value to, but a different F1
value from, the English speaker‟s, whereas Japanese speaker 2 had a similar F1 value
to, but a different F2 value from, the English speaker‟s. Just like the case of Tarzan,
the Japanese speakers might differentially have acquired the features of the schwa in
this condition.
Finally, the findings shown in Table 8 are interpreted as partial support for the
first part of the longer vowel-distance hypothesis. While the English speakers
showed great differences in F1 and F2 between the first and second vowels in all words
except spoonful, some similarities between the vowels were observed for the Japanese
speakers except for Tarzan. Regarding Tarzan, however, inspection of the F1 and F2
values indicates that the Japanese speakers‟ schwas were less reduced or centralized as
compared the English speakers‟
Further research
The present study has taken only a first step in broader research on Japanese
learners‟ vowel quality in English. As such, many questions remain for future
investigations, and we mention some of them here.
A first question to ask may be whether and how vowel quality as found in this
study contributes to the putatively low intelligibility noted for spoken English words
produced by Japanese speakers. Perceptual research is needed to provide an answer
to this question, in which the quality of vowels in words such as pin/pen, cut/cot, and
set/sat produced by Japanese speakers may be examined using identification and
discrimination tasks.
A second question of interest may be what English vowels are difficult for
Japanese (and other language) speakers to acquire and why. The schwas in some
context may be more difficult than those in other context. The relationship between
Japanese and English vowel reduction in Japanese speakers remains largely unknown.
While Kondo (2000, p. 30) says that “there is no phonological reduction in Japanese,”

15
Vance (2009, p. 69) states that “Japanese vowels in connected speech tend to become
centralized, which makes them less distinct from each other.” Vowel reduction itself
would be a natural phenomenon whatever language one may speak, but the learnability
of the vowel reduction in a particular context in a target language is a separate issue to
be addressed in future research. This study suggests, for example, that, of the five
word conditions, the schwa in common is most different between the English speakers
and the Japanese speakers (see Tables 4 and 5) and thus probably most difficult for
Japanese learners to acquire.
A third question which we find interesting involves the possible variability in
vowel quality within speakers. In the case of English speakers who read a passage
out loud, vowels tend to be reduced when the words including them appear the second
time in the text (Tomita, 2006). We compared the F1 and F2 values of vowels
produced on the first and second trials. The patterns were rather complicated, some
vowels being reduced and centralized and other remaining invariant. This issue
seems important because Smiljanic and Bradlow (2005) concerning clear speech in
Japanese assert that “it is likely that Japanese talkers would not expand their vowel
space in clear speech” (p. 1684). However, Jean Andruski (personal communication),
who carried out a study of Japanese infant-directed speech, states that Japanese
mothers‟ increases in vowel space size were not as great as they saw in American
English, Swedish, and Russian mothers‟ speech. This may be interpreted as
suggesting that there is less vowel space expansion and reduction in Japanese. This
possibility thus involves the learnability of the English point vowels.

16
References
Alfonso, P. J. and Baer, T. (1982). Dynamics of vowel articulation. Language and
Speech, 25, 151-173.
Browman, C. P. and Goldstein, L. (1992). “Targetless” schwa: an articulatory analysis.
In J. Kingston and M. E. Beckman (Eds.). Papers in laboratory phonology II, pp.
26-56. Cambridge: Cambridge University Press.
Hillenbrand, J. M., Getty, L. A., Clark, M. J., and Wheeler, K. (1995). Acoustic
Characteristics of American English vowels. Journal of the Acoustical Society of
America, 97, 3099-3111.
Homma, Y. (1992). Acoustic phonetics in English & Japanese. Kyoto: Yamaguchi
Shoten.
Ito, K. (1986). Gendai eigo hatsuon no kiso: Nichiei onsei hikaku [The foundation of
modern English pronunciation: Comparison of Japanese and English sounds].
Tokyo: Kenkyusha.
Kondo, Y. (2000). Production of schwa by Japanese speakers: an acoustic study of
shifts in coarticulatiory strategies from L1 to L2. In M. B. Broe and J. B.
Pierrehumbert (Eds.). Papers in laboratory phonology, V. Acquisition and the
lexicon, pp. 29-39. Cambridge: Cambridge University Press.
Labov, W., Ash, S., and Boberh, C. (2006). The atlas of North American English:
Phonetics, phonology and sound change. Berlin: Mouton de Gruyter.
Lee, B., Guion, S. G., and Harada, T. (2006). Acoustic analysis of the production of
unstressed English vowels by early and late Korean and Japanese bilinguals.
Studies in Second Language Acquisition, 28, 487-513.
Lieberman, P. and Blumstein, S. E. (1988). Speech physiology, speech perception, and
acoustic phonetics. Cambridge: Cambridge University Press.
Matsui, C. (1996). Eigo onseigaku: Nihongo tono hikaku ni yoru. [English phonetics:
A comparison of English and Japanese. Tokyo: Asahi Shuppan.
Smiljanic, R. and Bradlow, A. R. (2005). Production and perception of clear speech in

17
Croatian and English. Journal of the Acoustical Society of America, 118,
1677-1688.
Tomita, K. (2006). Effects of word familiarity in contexts on speaker‟s vowel
articulation. The Yamagata University Journal: Humanities, 16, 55-67
van Bergem, D. R. (1994). A model of coarticulatiory effects on the schwa. Speech
Communication, 14, 143-162.
Vance, T. J. (2008). The sounds of Japanese. Cambridge: Cambridge University Press.

18
Table 1
Mean F1 and F2 Values of Three Point Vowels for the Female Speakers
/i/ FE FJ1 FJ2 Mean F-valuea p-value Comparison
tea* F1 276 296 335 302 49.44 < .001 FE < FJ1 < FJ2
F2 2783 2845 2866 2831 0.64 n.s. FE, FJ1, FJ2
peace* F1 268 331 322 307 44.18 < .001 FE < FJ2, FJ1
F2 2903 2956 2646 2835 29.17 < .001 FJ2 < FE, FJ1
Mean F1 272 313 328 305
F-value 3.12b 13.39
b 10.32
b
p-value > .05 < .01 < .01
Mean F2 2843 2901 2756
F-valueb 1.42 5.50 41.83
p-value n.s. < .05 < .001
peace** F1 316 350 313 326 6.99 < .01 FJ2, FE < FJ1
F2 2920 2861 2899 2893 2.73 > .05 FJ1, FJ2, FE
East** F1 295 362 359 339 63.95 < .001 FE < FJ2, FJ1
F2 2949 3032 2747 2909 117.5 < .001 FJ2 < FE < FJ1
Mean F1 272 313 328 305
F-valueb 3.86 3.28 17.70
p-value > .05 > .10 < .01
Mean F2 2935 2947 2823
F-valueb 1.88 50.25 37.23
p-value n.s. < .001 < .001
a The degrees of freedom are all 2 and 29.
b The degrees of freedom are all 1 and 9.
* First position, ** Second position.

19
Table 1 (cont.)
/u/ FE FJ1 FJ2 Mean F-valuea p-value Comparison
true* F1 352 392 393 379 10.43 < .001 FE < FJ1, FJ2
F2 2000 1806 1755 1854 12.22 < .001 FJ2, FJ1 < FE
two* F1 331 385 362 359 36.49 < .001 FE < FJ2 < FJ1
F2 1839 1988 1606 1811 29.81 < .001 FJ2 < FJ1
Mean F1 342 389 378 370
F-value 25.22 0.25 15.15
p-value < .001 > .05 n.s.
Mean F2 1920 1897 1681
F-valueb 11.19 21.79 7.35
p-value < .01 < .001 < .05
spoon** F1 430 396 318 381 35.08 < .001 FJ2 < FJ1 < FE
F2 2210 1464 1188 1621 98.66 < .001 FJ2 < FJ1 < FE
pool** F1 381 361 391 378 4.40 < .05 FJ1 < FJ2***
F2 836 915 978 910 18.37 < .001 FE < FJ1 < FJ2
Mean F1 405 379 354 379
F-value 17.18b
12.62b
31.36b
p-value < .01 < .001 < .01
Mean F2 1523 1190 1083
F-valueb 2012 506.7 6.21
p-value < .001 < .001 < .05
a The degrees of freedom are all 2 and 29.
b The degrees of freedom are all 1 and 9.
* First position, ** Second position. *** FJ1, FE & FE, FJ2, where neither the
difference between FJ1 and FE nor that between FE and FJ2 was significant.

20
Table 1 (cont.)
/ɑ/ FE FJ1 FJ2 Mean F-valuea p-value Comparison
car* F1 754 731 524 670 47.86 < .001 FJ2 < FJ1, FE
F2 1374 1127 1018 1173 48.26 < .001 FJ2 < FJ1 < FE
Far* F1 681 781 522 661 154.6 < .001 FJ2 < FE < FJ1
F2 1139 1154 1501 1265 35.54 < .001 FE, FJ1 < FJ2
Mean F1 718 756 523 666
F-value 7.34 4.89 0.04
p-value < .05 < .06 n.s.
Mean F2 1256 1141 1259
F-valueb 31.91 1.71 78.34
p-value < .001 n.s. < .001
Arms** F1 482 808 458 583 75.43 < .001 FJ2, FE < FJ1
F2 993 1084 1063 1047 7.29 < .01 FE < FJ2, FJ1
March**F1 451 827 423 567 262.2 < .001 FJ2, FE < FJ1
F2 1200 1111 1239 1183 2.81 > .05 FJ1, FE, FJ2
Mean F1 467 817 440 575
F-value 5.30 0.53 1.02
p-value < .05 n.s. n.s.
Mean F2 1920 1897 1681 1833
F-valueb 11.19 21.79 7.35
p-value < .01 < .001 < .05
a The degrees of freedom are all 2 and 29.
b The degrees of freedom are all 1 and 9.
* First position, ** Second position.

21
Table 2
Mean F1 and F2 Values of Three Point Vowels for the Male Speakers
/i/ ME MJ1 MJ2 Mean F-valuea p-value Comparison
tea* F1 251 278 273 267 35.01 < .001 ME < MJ2, MJ1
F2 2317 2206 2073 2199 28.87 < .001 MJ2 < MJ1 < MJ1
peace* F1 264 276 265 269 5.03 < .05 ME, MJ2 < MJ1
F2 2414 2252 2152 2273 28.58 < .001 MJ2 < MJ1 < ME
Mean F1 258 277 269
F-value b 9.02 0.26 7.10
p-value < .05 n.s. < .05
Mean F2 2366 2229 2113
F-valueb 5.64 2.79 12.30
p-value < .05 > .10 < .001
peace** F1 251 270 227 249 21.21 < .001 MJ2 < ME < MJ1
F2 2339 2238 2154 2244 12.27 < .001 MJ2 < MJ1 < ME
East** F1 223 267 256 249 68.17 < .001 ME < MJ2 < MJ1
F2 2355 2265 2183 2268 20.83 < .001 MJ2 < MJ1 < ME
Mean F1 237 269 241
F-valueb 58.67 0.39 14.75
p-value < .001 n.s. < .01
Mean F2 2347 2252 2169
F-valueb 0.60 0.71 0.99
p-value n.s. n.s. n.s.
a The degrees of freedom are all 2 and 27.
b The degrees of freedom are all 1 and 9.
* First position, ** Second position.

22
Table 2 (cont.)
/u/ ME MJ1 MJ2 Mean F-valuea p-value Comparison
true* F1 307 309 293 303 8.42 < .001 MJ2 < ME, MJ1
F2 1293 1178 1678 1381 65.60 < .001 MJ1 < ME < MJ2
two* F1 289 279 292 287 3.56 < .05 MJ1, ME < ME, MJ2
F2 1348 1312 1852 1504 42.19 < .001 MJ1, ME < MJ2
Mean F1 298 294 293
F-value 12.79 60.18 0.07
p-value < .01 < .001 n.s.
Mean F2 1320 1245 1762
F-valueb 1.28 3.25 22.83
p-value n.s. > .10 < .001
spoon** F1 325 310 245 293 7.25 < .001 MJ2 < MJ1 < ME
F2 1419 1023 1120 1187 43.98 < .001 MJ1, MJ2 < ME
pool** F1 323 296 317 312 5.85 < .01 MJ1 < MJ2, ME
F2 675 972 1353 1000 184.2 < .001 MJ1 < MJ2, ME
Mean F1 324 303 281
F-valueb
0.14 1.56 8.88
p-value n.s. n.s. < .02
Mean F2 1047 997 1236
F-valueb 850.5 4.76 12.03
p-value < .001 < .06 < .01
a The degrees of freedom are all 2 and 27.
b The degrees of freedom are all 1 and 9.
* First position, ** Second position.

23
Table 2 (cont.)
/ɑ/ ME MJ1 MJ2 Mean F-valuea p-value Comparison
car* F1 541 514 646 567 47.86 < .001 MJ1, ME < MJ2
F2 1074 1026 1240 1113 25.01 < .001 MJ1, ME < MJ2
Far* F1 565 520 643 576 32.82 < .001 MJ1 < ME < MJ2
F2 951 921 1162 1011 116.0 < .001 MJ1, ME < MJ2
Mean F1 553 517 644
F-value 1.34 0.38 0.00
p-value n.s. n.s. n.s.
Mean F2 1012 973 1200
F-valueb 36.49 33.33 5.80
p-value < .001 < .001 < .05
Arms** F1 462 699 624 595 59.91 < .001 ME < MJ2 < MJ1
F2 968 1062 1852 1294 448.2 < .001 ME < MJ1 < MJ2
March**F1 520 781 592 631 75.79 < .001 ME < MJ2 < MJ1
F2 1215 1071 1216 1167 12.68 < .001 MJ1 < ME, MJ2
Mean F1 491 740 608
F-value 26.11 8.95 2.53
p-value < .001 < .05 n.s.
Mean F2 1091 1066 1236
F-valueb 104.6 0.11 1.91
p-value < .001 n.s. n.s.
a The degrees of freedom are all 2 and 27.
b The degrees of freedom are all 1 and 9.
* First position, ** Second position.

24
Table 3
Mean Vowel Spaces (Hz2) for Individual Speakers
Female Mean Male Mean
FE 153,469 ME 126,314
FJ1 174,093 MJ1 107,752
FJ2 36,156 MJ2 77,755
F-value 76.45 7.83
df 1, 9 1, 9
p-value < .001 < .01
Comparison FJ1, FE > FJ2 MJ2, MJ1; MJ1, ME; MJ2 < ME

25
Table 4
Mean F1 and F2 Values of the Schwa of Each Test Word for the Female Speakers
FE FJ1 FJ2 F-valuea p-value Comparison
common
F1 511 834 652 197.2 < .001 FE < FJ2 < FJ1
F2 1939 1491 1467 75.50 < .001 FJ2, FJ1 < FE
chicken
F1 518 579 318 36.49 < .001 FJ2 < FE, FJ1
F2 2213 2348 2788 93.57 < .001 FE, FJ1 < FJ2
Tarzan
F1 490 677 482 31.28 < .001 FJ2, FE < FJ1
F2 1937 1922 1840 3.34 < .06 FJ2, FJ1, FE
redden
F1 501 361 504 24.52 < .001 FJ1 < FE, FJ2
F2 2151 2070 2062 12.57 < .001 FJ1, FJ2 < EF
spoonful
F1 378 477 372 55.53 < .001 FJ2, FE < FJ1
F2 863 827 662 94.53 < .001 FJ2 < FJ1 < FE
F1 Mb 480 586 466
F1 Fc 97.88 72.67 87.04
p < .001 < .001 < .001
F2 Mb 1821 1732 1764
F2 Fc 1570 477.0 836.8
p < .001 < .001 < .001
a The effect of speaker (df = 2, 27).
b The mean with spoonful excluded.
c The effect of word (df = 1, 9) with spoonful excluded.

26
Table 5
Mean F0, F1, and F2 Values of the Schwa of Each Test Word for the Male Speakers
ME MJ1 MJ2 F-valuea p-value Comparison
common
F1 356 713 683 177.9 < .001 ME < MJ2 < MJ1
F2 1508 1761 2054 xx.50 < .001
chicken
F1 351 437 187 65.31 < .001 MJ2 < ME, MJ1
F2 1821 2348 2269 < .001
Tarzan
F1 423 323 312 4.50 < .05 MJ2, MJ1; MJ1, ME
F2 1763 1260 1522 < .06
redden
F1 373 330 281 16.52 < .001 MJ1 < MJ2 < ME
F2 1761 1762 1751 < .001
spoonful
F1 414 308 259 71.51 < .001 MJ2 < MJ1 < MJ1
F2 737 850 1349 < .001
F1 Mb 383 422 344
F1 Fc
p
F2 Mb
F2 Fc
p < .001 < .001 < .001
a The effect of speaker (df = 2, 27).
b The mean with spoonful excluded.
c The effect of word (df = 1, 9) with spoonful excluded.

27
Table 6
Mean Distance (Hz) between the Constituent Vowels of Each Test Word
for the Female Speakers
FE FJ1 FJ2 Mean F-valuea p-value Comparison
1. common
/ɑ-ə/ 752 285 290 442 90.31 < .001 FJ1, FJ2 < FE
2. chicken
/ı-ə/ 220 212 177 203 0.35 n.s. FJ2, FJ1, FE
3. Tarzan
/ɑ-ə/ 595 706 589 630 1.19 n.s. FJ2, FE, FJ1
4. redden
/ɛ-ə/ 235 394 107 245 51.31 < .001 FJ2 < FE < FJ1
5. spoonful
/u-ə/ 569 535 321 475 3.49 < .05 FJ2, FJ1, FE
Mean 474 426 297 399
F-valueb 20.35 38.44 13.80
p-value < .001 < .001 < .001
Between-speaker comparison: FJ2 < FJ1, FE
Within FE: 2, 4; 4 < 5, 3; 5, 1; 3 < 1
Within FJ1: 2, 1 < 4 < 5 < 3
Within FJ2: 4, 2; 2, 1; 1, 5; 2 < 5 < 3; 1 < 3
a The degrees of freedom are all 2 and 29.
b The degrees of freedom are all 4 and 36.

28
Table 7
Mean Distance (Hz) between the Constituent Vowels of Each Test Word
for the Male Speakers
ME MJ1 MJ2 Mean F-valuea p-value Comparison
1. common
/ɑ-ə/ 452 772 1048
2. chicken
/ı-ə/ 240 374 242
3. Tarzan
/ɑ-ə/ 618 440 317
4. redden
/ɛ-ə/ 156 328 196
5. spoonful
/u-ə/ 528 196 222

29
Table 8
Differences in F1 and F2 Values between the First Vowel and Second Schwa
in Each Test Word for Each Speaker
Female speakers Male speakers
FE FJ1 FJ2 ME MJ1 MJ2
common
F1 7.36*** 0.06 13.3*** 8.08*** 7.18*** 4.24**
F2 34.7*** 5.40*** 1.16 14.0*** 12.5*** 3.12**
chicken
F1 25.1*** 4.01** 5.16*** 0.49 6.95*** 6.30***
F2 8.28*** 1.61 2.66* 4.91*** 5.58*** 0.74
Tarzan
F1 5.57*** 3.78** 2.67* 4.24** 8.61*** 4.57***
F2 9.81*** 20.1*** 6.78*** 13.6*** 6.99*** 1.54
redden
F1 12.3*** 24.9*** 0.72 12.3*** 0.81 12.1***
F2 30.2*** 2.93* 3.55** 0.43 5.77*** 4.35**
spoonful
F1 1.93 0.22 0.11
F2 5.41*** 22.8*** 5.12***
t-value *p < .05, **p < .01, ***p < .001.

30
Figure 1. English point-vowel spaces for the female English speaker and the two
female Japanese speakers.

31
Figure 2. English schwa spaces for the female English speaker and the two
female Japanese speakers.