The skills to welcome: the knowledge overcomes the national borders
41
The skills to welcome: the knowledge overcomes the national borders Gabriele Guglielmi, Presidente EBNT [email protected]
-
Upload
gabriele-guglielmi -
Category
Education
-
view
58 -
download
0
Transcript of The skills to welcome: the knowledge overcomes the national borders
The skills to welcome: the knowledge overcomes the national borders
Gabriele Guglielmi, Presidente EBNT [email protected]


In E.B.N.T. are present booth the enterprises’ Associations and the workers’ Associations of the tourism sector.
E.B.N.T. is the hightest level of social dialogue in the tourism sector
E.B.N.T. develops activity of: -observatory -training planning
E.B.N.T gives assistance and consuling to enterprises and workers
of the tourism sector

Europe for All - Bruxelles 19/01/07 Gabriele Guglielmi ETLC
http://www.effat.org/public/index.php http://www.iuf.org/
http://www.uni-europa.org/ http://www.union-network.org
http://www.itfglobal.org/etf/ http://www.itfglobal.org/
http://www.etlc-network.eu/etlc
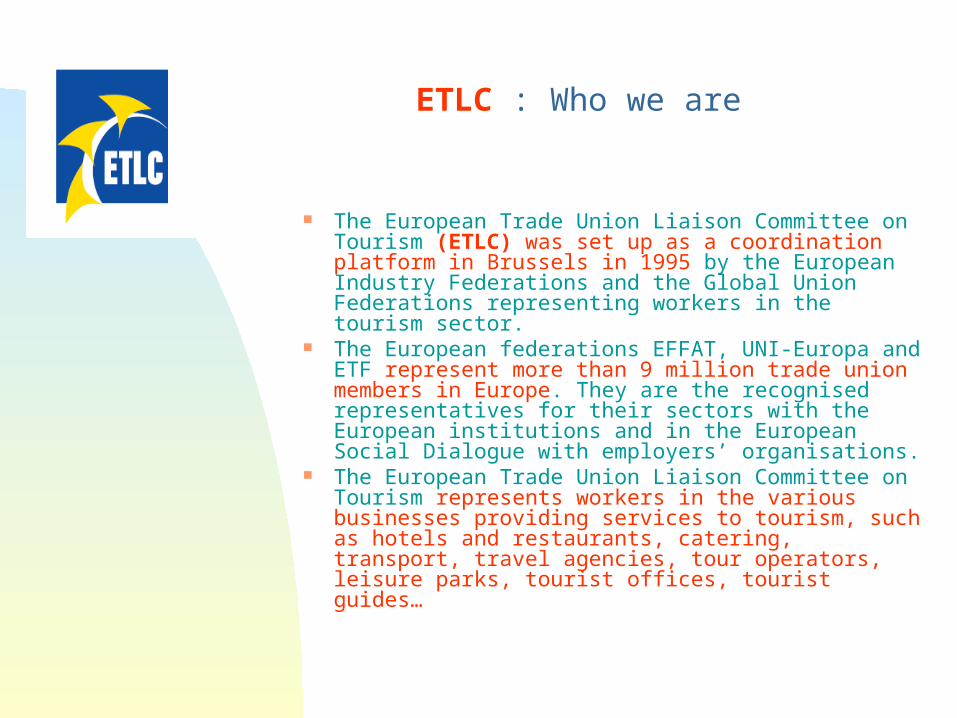
ETLC : Who we are
The European Trade Union Liaison Committee on Tourism (ETLC) was set up as a coordination platform in Brussels in 1995 by the European Industry Federations and the Global Union Federations representing workers in the tourism sector.
The European federations EFFAT, UNI-Europa and ETF represent more than 9 million trade union members in Europe. They are the recognised representatives for their sectors with the European institutions and in the European Social Dialogue with employers’ organisations.
The European Trade Union Liaison Committee on Tourism represents workers in the various businesses providing services to tourism, such as hotels and restaurants, catering, transport, travel agencies, tour operators, leisure parks, tourist offices, tourist guides…

I'm a trade-unionist because I've a bottom/up approach?
Or
I've a bottom/up approach because I'm a trade-unionist?

I look at the world from the weakest people point of view For example the workers, the employees point of view is a bottom/up approach. But the seasonals (migrants, females …) workers point of view is a much more bottom/up approach. The same is for tourists point of view. In the tourism chain, the disabled people point of view, is a bottom/up approach and the benefits of this approach will be
"benefits for all the tourists"

Economic Impulses of Accessibile Tourism for All Federal Ministry of Economics and Technology – Berlin – March 2004 – Documentation Nr. 526

ITALIA 2006: OCCUPATI NEL TURISMO Fonte: elaborazioni Federalberghi-FIPE su dati INPS
ITALIA 2006 MINIMO MASSIMO MEDIA STAGIONALI
661.106 914.840 772.007 253.734
27,74
MEDIA
MASCHI
FEMMINE
ACCOGLIENZA 45,00 55,00
RISTORAZIONE 42,10 57,90
AGENZIE DI VIAGGIO 23,30 76,60
TERME 42,10 57,90
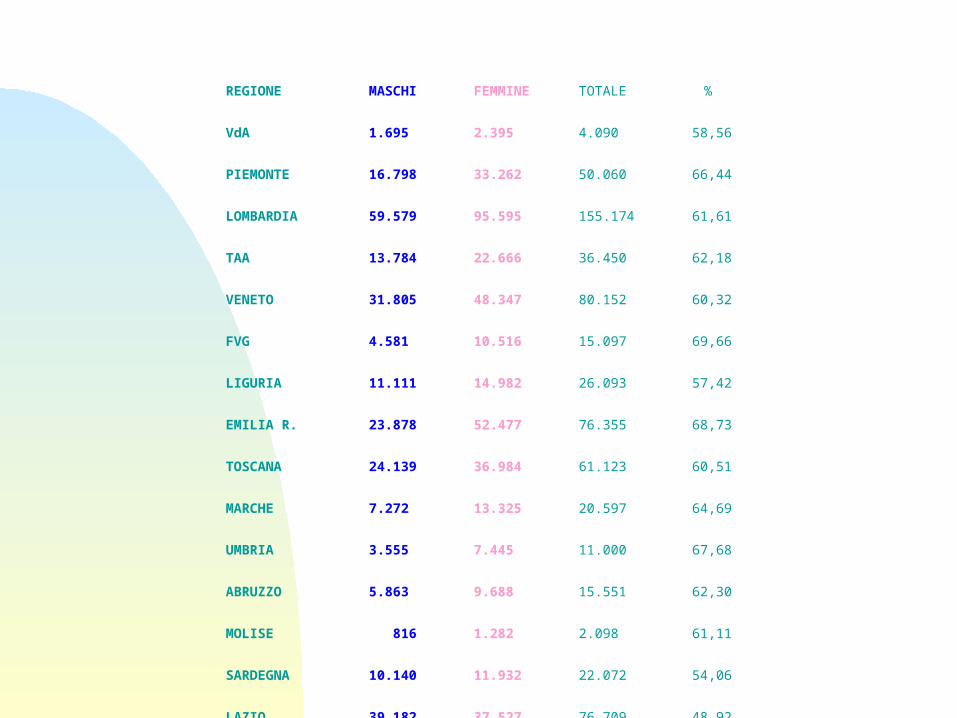
REGIONE MASCHI FEMMINE TOTALE %
VdA 1.695
2.395 4.090 58,56
PIEMONTE 16.798
33.262
50.060 66,44
LOMBARDIA 59.579
95.595
155.174 61,61
TAA 13.784
22.666
36.450 62,18
VENETO 31.805
48.347
80.152 60,32
FVG 4.581
10.516
15.097 69,66
LIGURIA 11.111
14.982
26.093 57,42
EMILIA R. 23.878
52.477
76.355 68,73
TOSCANA 24.139
36.984
61.123 60,51
MARCHE 7.272
13.325
20.597 64,69
UMBRIA 3.555
7.445
11.000 67,68
ABRUZZO 5.863
9.688
15.551 62,30
MOLISE 816
1.282 2.098 61,11
SARDEGNA 10.140
11.932
22.072 54,06
LAZIO 39.182
37.527
76.709 48,92
CAMPANIA 25.219
18.627
43.846 42,48
BASILICATA 2.157
2.178 4.335 50,24
PUGLIA 17.998
14.490
32.488 44,60
CALABRIA 8.394
7.639
16.033 47,65
SICILIA 22.763
14.284
37.047 38,56
ITALIA 330.729
455.641
786.370 57,94

2006: OCCUPAZIONE FEMMINILE NEL TURISMO PER REGIONI
30
35
40
45
50
55
60
65
70
75
VdA PIE LOM TAA VEN FVG LIG ER TOS MAR UMB ABR MOL SAR LAZ CAM BAS PUG CAL SIC

Stagionalità strutturale(Inps, lavoratori dipendenti da esercizi ricettivi italiani, 2004)
0
50.000
100.000
150.000
200.000
250.000
300.000
350.000


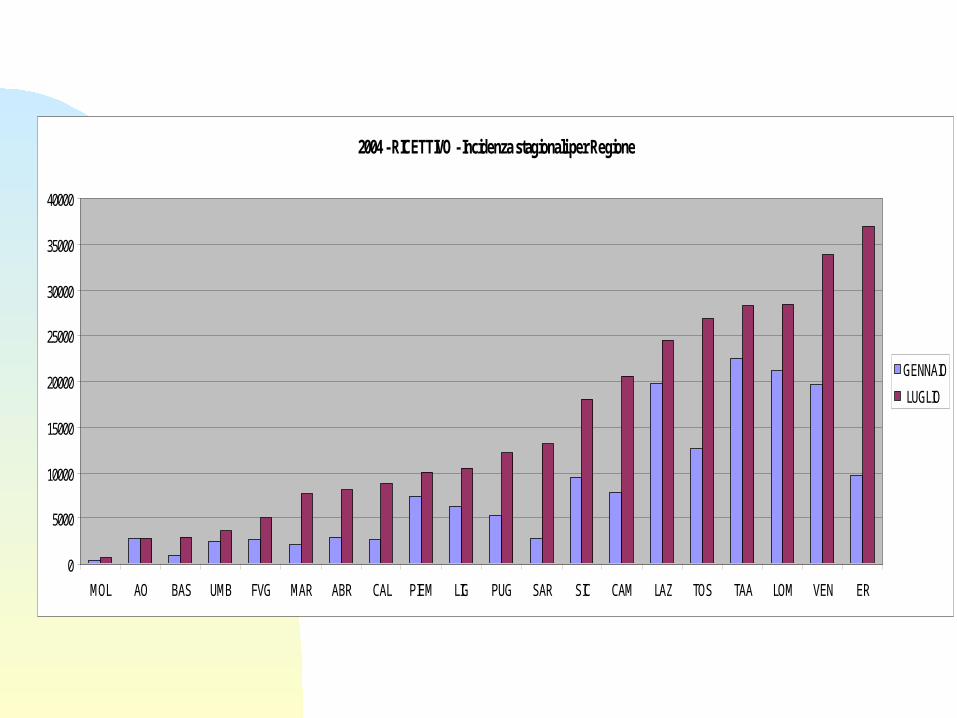
2004 - RICETTIVO - Incidenza stagionali per Regione
0
5000
10000
15000
20000
25000
30000
35000
40000
MOL AO BAS UMB FVG MAR ABR CAL PIEM LIG PUG SAR SIC CAM LAZ TOS TAA LOM VEN ER
GENNAIO
LUGLIO

Andamento dell'occupazione
0
200000
400000
600000
800000
1000000
1200000
1400000
1600000
1800000
2006200520042003

Lavoratori dipendenti da aziende turistiche della Valle d’Aosta
gen feb mar apr mag giu lug ago set ott nov dic
2005 4.463 4.454 4.623 3.487 2.129 3.018 5.057 5.249 3.261 2.155 2.219 4.917
2006 5.430 5.488 5.639 4.426 2.654 3.764 5.340 5.789 3.857 2.578 2.405 5.691
gen feb mar apr mag giu lug ago set ott nov dic
2005 2006

ENERO 2007 ESPANA
EXTRANJEROS TOTAL % EXTRANJEROS
COMERCIO AL POR MAYOR 71.175 860.204 8,3
COMERCIO AL POR MENOR 103.319 1.319.802 7,8
HOTELLERIA 210.801 864.121 24,4
TOTAL 385.295 3.044.127
FUENTE: IMMIGRACION Y MERCADO DE TRABAIO INFORME 2007
The aim of B.E.A.TR.I.C. (Building European pAssport for TRansparent and International Certification) is to create purpose-made istruments capable to help the mobility of citizens in the field of vocational training and work, instruments apt to verify concretely the usefulness of the certificates archieved and to describe the competences acquired. The role of such istruments is to ease the description of competences of a subject in order to be easily understoodby the enterprise, thus helping the mobility of workers throughout the Europe. The overriding purpose of the project is to give to the subjects the possibility to promote their knowledge and skills through instruments that allow to use them all over Europe

Labour mobility – McDonald’s style
Hot on the heels of the conference organized by the Committee on 14 September 2006 entitled“Labour mobility – the role of the social partners”, McDonald’s launched its “McPassport” in Brussels in the presence of Commissioner Spidla. The aim of this passport is to provideMcDonald’s employees with greater labour mobility within Europe.
“The option of giving up your job and travelling to another country at your own expense and own risk and searching for a job there already exists today anyway. So what’s so innovative about thismeasure?”, asks Kerstin Howald, Tourism Secretary at EFFAT. “Normally, businesses wishing to encourage their employees to cross-border occupational mobility within the company also shoulder the responsibility for the social framework conditions of this mobility.”
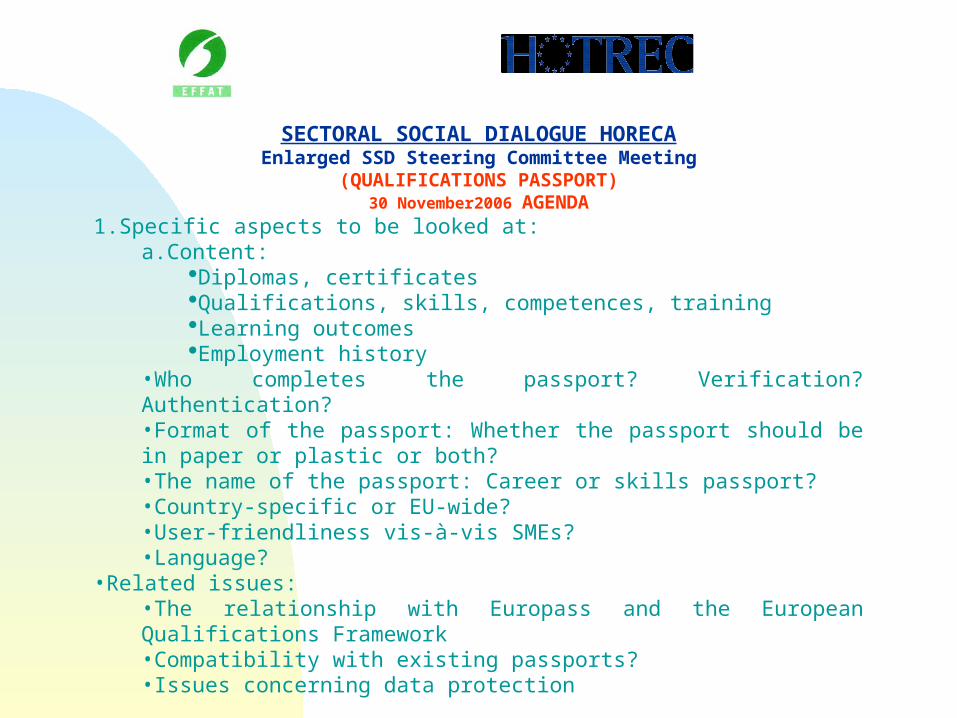
SECTORAL SOCIAL DIALOGUE HORECAEnlarged SSD Steering Committee Meeting
(QUALIFICATIONS PASSPORT)30 November2006 AGENDA
1.Specific aspects to be looked at:a.Content:
Diplomas, certificatesQualifications, skills, competences, trainingLearning outcomesEmployment history
•Who completes the passport? Verification? Authentication?•Format of the passport: Whether the passport should be in paper or plastic or both?•The name of the passport: Career or skills passport?•Country-specific or EU-wide?•User-friendliness vis-à-vis SMEs?•Language?
•Related issues:•The relationship with Europass and the European Qualifications Framework•Compatibility with existing passports?•Issues concerning data protection

Consumi turistici giornalieri (fonte Munster’s University)
accomodation39%
ristorazione24%
leisure7%
shopping13%
Local transport3%
Other services14%
accomodation
ristorazione
leisure
shopping
Local transport
Other services

Consumi turistici giornalieri (fonte Assoturismo)
ricettività22%
affitti9%
ristorazione24%
intrattenimento 9%
serv commerciali 15%
trasporti6%
consumi domestici11%
servizi balneari4%

Figure 3 - Tourism spending in Brazil by sector, 200521
21 Euromonitor, “Travel and Tourism in Brazil,” February 2004, p. 30


A trade-Unionist approach about WTO statistics
Gross Domestic Product per Capita (GDPC)
May be not only a competitiveness index
But Also a: Number of employed workers index Or: a wages level index
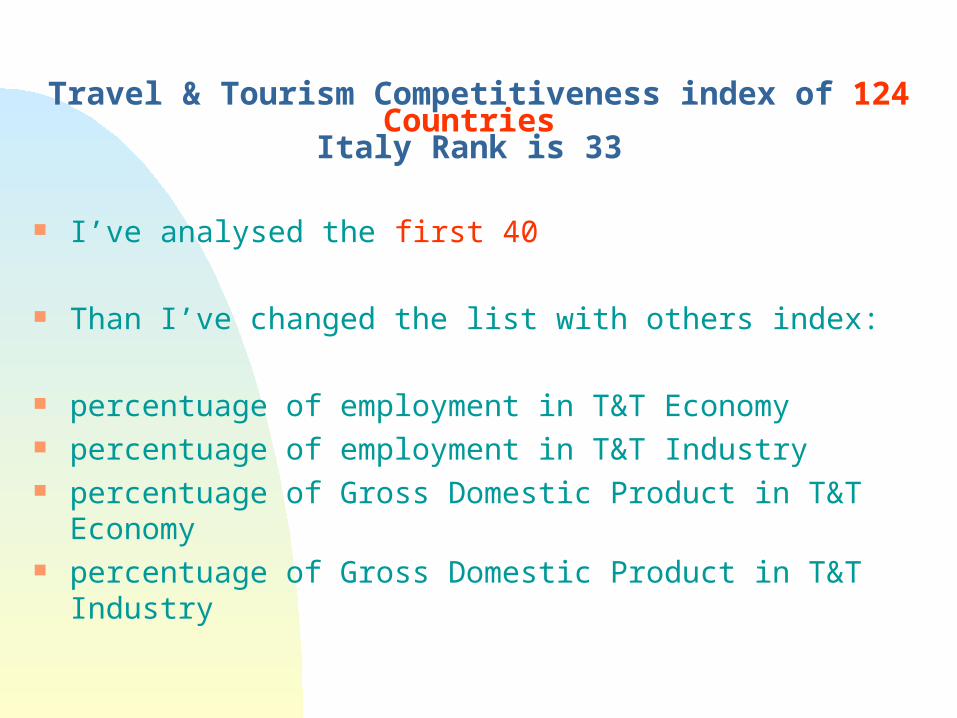
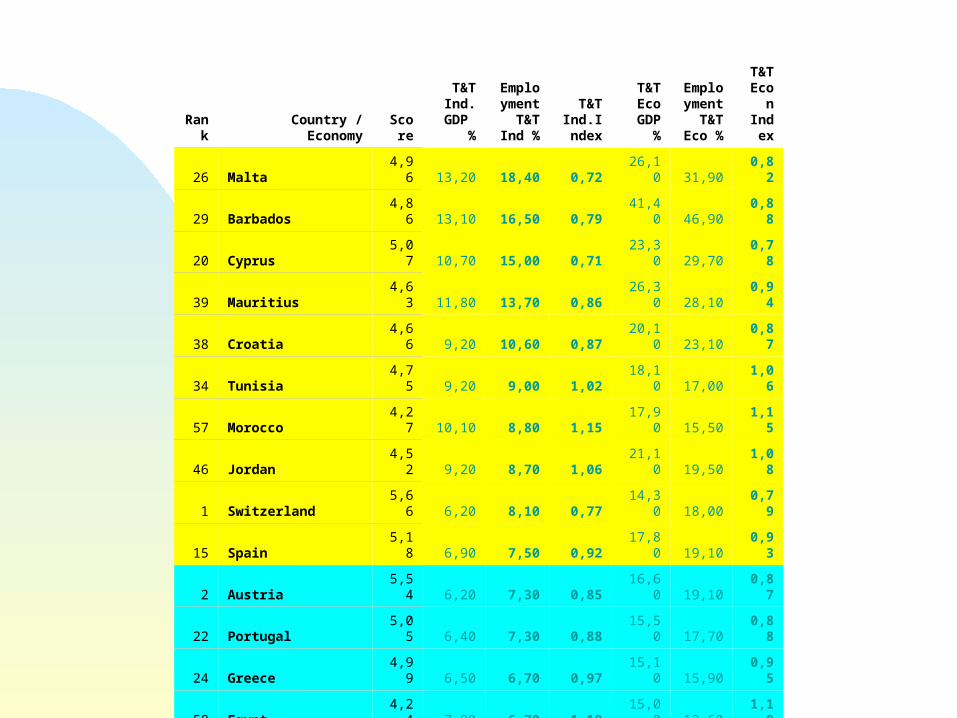
Travel & Tourism Competitiveness index of 124 Countries Italy Rank is 33
I’ve analysed the first 40
Than I’ve changed the list with others index:
percentuage of employment in T&T Economy percentuage of employment in T&T Industry percentuage of Gross Domestic Product in T&T Economy percentuage of Gross Domestic Product in T&T Industry

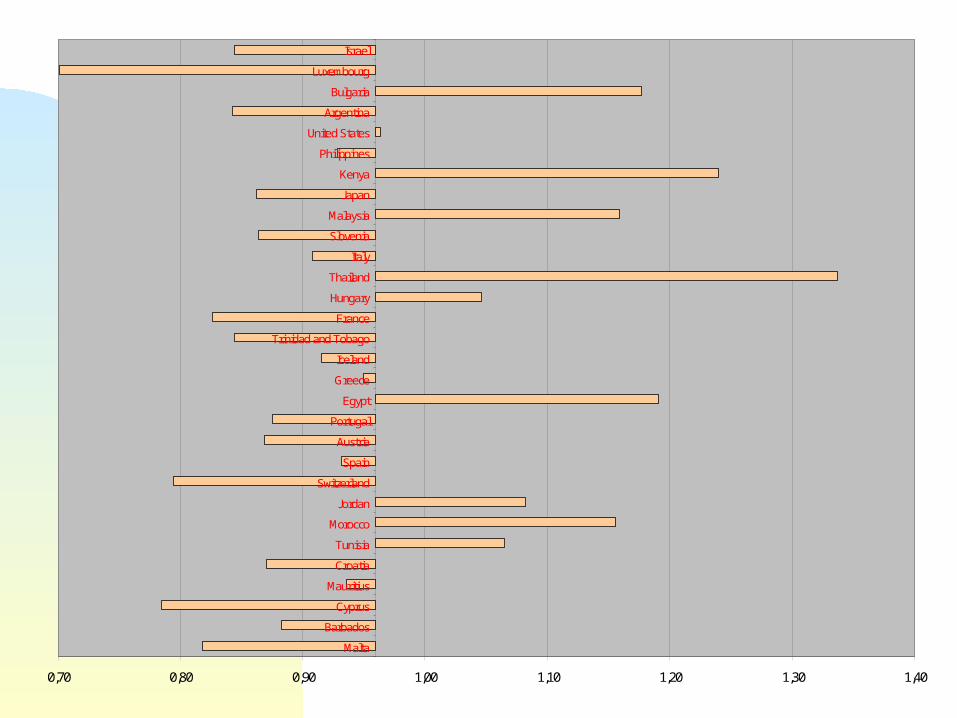
The Countries where the employed index is much more over the average
often there have not:
- a strong Trade Union Organisations
- good laws to protect workers

Where GDPC is under the average
AlsoThe working conditions and the wages level could
be under the average
And
“the distribution of the wealth among the population in that touristics destinations could be inequal”


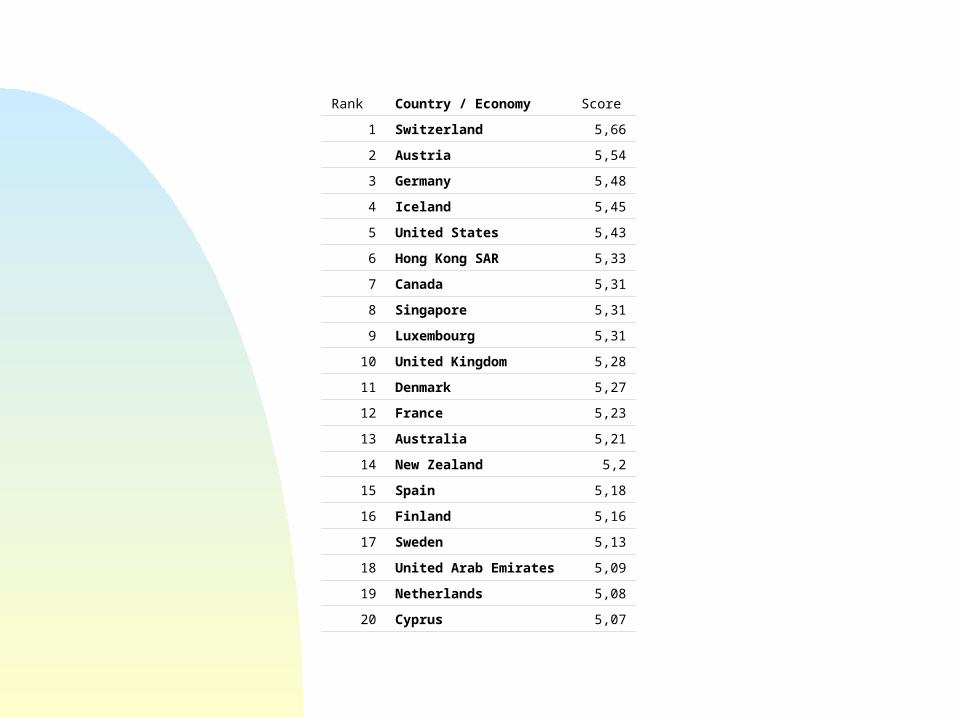
Rank Country / Economy Score1 Switzerland 5,662 Austria 5,543 Germany 5,484 Iceland 5,455 United States 5,436 Hong Kong SAR 5,337 Canada 5,318 Singapore 5,319 Luxembourg 5,31
10 United Kingdom 5,2811 Denmark 5,2712 France 5,2313 Australia 5,2114 New Zealand 5,215 Spain 5,1816 Finland 5,1617 Sweden 5,1318 United Arab Emirates 5,0919 Netherlands 5,0820 Cyprus 5,07
Rank
Country / Economy
Score
T&T Ind.
GDP %
Employme
nt T&T
Ind %
T&T Ind.In
dex
T&T Eco
GDP %
Employme
nt T&T Eco
%
T&T Eco
n Index
26 Malta 4,96 13,20 18,40 0,72 26,10 31,90 0,82
29 Barbados 4,86 13,10 16,50 0,79 41,40 46,90 0,88
20 Cyprus 5,07 10,70 15,00 0,71 23,30 29,70 0,78
39 Mauritius 4,63 11,80 13,70 0,86 26,30 28,10 0,94
38 Croatia 4,66 9,20 10,60 0,87 20,10 23,10 0,87
34 Tunisia 4,75 9,20 9,00 1,02 18,10 17,00 1,06
57 Morocco 4,27 10,10 8,80 1,15 17,90 15,50 1,15
46 Jordan 4,52 9,20 8,70 1,06 21,10 19,50 1,08
1 Switzerland 5,66 6,20 8,10 0,77 14,30 18,00 0,79
15 Spain 5,18 6,90 7,50 0,92 17,80 19,10 0,93
2 Austria 5,54 6,20 7,30 0,85 16,60 19,10 0,87
22 Portugal 5,05 6,40 7,30 0,88 15,50 17,70 0,88
24 Greece 4,99 6,50 6,70 0,97 15,10 15,90 0,95
58 Egypt 4,24 7,90 6,70 1,18 15,00 12,60 1,19
4 Iceland 5,45 6,30 6,30 1,00 17,40 19,00 0,92
85Trinidad and Tobago 3,79 5,10 6,00 0,85 14,60 17,30 0,84
12 France 5,23 4,40 5,50 0,80 11,40 13,80 0,83
43 Thailand 4,58 6,50 5,20 1,25 14,30 10,70 1,34
40 Hungary 4,61 3,50 5,20 0,67 9,00 8,60 1,05
33 Italy 4,78 4,60 4,90 0,94 10,80 11,90 0,91

Rank
Country / Economy
Score
T&T Ind.
GDP %
Employme
nt T&T
Ind %
T&T Ind.In
dex
T&T Eco
GDP %
Employme
nt T&T Eco
%
T&T Eco
n Index
29 Barbados 4,86 13,10 16,50 0,79 41,40 46,90 0,88
26 Malta 4,96 13,20 18,40 0,72 26,10 31,90 0,82
20 Cyprus 5,07 10,70 15,00 0,71 23,30 29,70 0,78
39 Mauritius 4,63 11,80 13,70 0,86 26,30 28,10 0,94
38 Croatia 4,66 9,20 10,60 0,87 20,10 23,10 0,87
46 Jordan 4,52 9,20 8,70 1,06 21,10 19,50 1,08
15 Spain 5,18 6,90 7,50 0,92 17,80 19,10 0,93
2 Austria 5,54 6,20 7,30 0,85 16,60 19,10 0,87
4 Iceland 5,45 6,30 6,30 1,00 17,40 19,00 0,92
1 Switzerland 5,66 6,20 8,10 0,77 14,30 18,00 0,79
22 Portugal 5,05 6,40 7,30 0,88 15,50 17,70 0,88
85Trinidad and Tobago 3,79 5,10 6,00 0,85 14,60 17,30 0,84
34 Tunisia 4,75 9,20 9,00 1,02 18,10 17,00 1,06
44 Slovenia 4,58 3,40 4,60 0,74 14,60 16,90 0,86
24 Greece 4,99 6,50 6,70 0,97 15,10 15,90 0,95
57 Morocco 4,27 10,10 8,80 1,15 17,90 15,50 1,15
12 France 5,23 4,40 5,50 0,80 11,40 13,80 0,83
54 Bulgaria 4,31 4,60 4,00 1,15 16,00 13,60 1,18
9 Luxembourg 5,31 2,90 3,90 0,74 9,40 13,40 0,70
58 Egypt 4,24 7,90 6,70 1,18 15,00 12,60 1,19

0,60
0,70
0,80
0,90
1,00
1,10
1,20
1,30
1,40

0,60 0,70 0,80 0,90 1,00 1,10 1,20 1,30
Malta
Barbados
Cyprus
Mauritius
Croatia
Tunisia
Morocco
Jordan
Switzerland
Spain
Austria
Portugal
Egypt
Greece
Iceland
Trinidad and Tobago
France
Hungary
Thailand
Italy
Slovenia
Malaysia
Japan
Kenya
Philippines
United States
Argentina
Bulgaria
Luxembourg
Israel
0,70 0,80 0,90 1,00 1,10 1,20 1,30 1,40
Malta
Barbados
Cyprus
Mauritius
Croatia
Tunisia
Morocco
Jordan
Switzerland
Spain
Austria
Portugal
Egypt
Greece
Iceland
Trinidad and Tobago
France
Hungary
Thailand
Italy
Slovenia
Malaysia
Japan
Kenya
Philippines
United States
Argentina
Bulgaria
Luxembourg
Israel

Survey of more than 500 business executives conducted by Grant Thornton LLP 2007 september
72% of respondents believe that government should regulate companies for their effect on the environment and 56 percent said companies should be regulated for their effect on human rights and labor
The three greatest benefits of enacting corporate responsibility programs are: improves public opinion, improves customer relations and attracts/retains talent.

Wohnen und Schlafen
Ankommen und Orientieren
Erinnern und Bestätigung finden
Essen und Trinken
Freizeit und Sport
Service und Assistenz
Unterhaltung und Kultur
Ausflug und Shopping
Vorbereiten, Informieren und Buchen
Anreise
Bildquelle: ADAC (Hrsg.) (2003): Barrierefreier Tourismus für Alle. München
Abreise

The skills to welcome: the knowledge overcomes the national borders
Gabriele Guglielmi, Presidente EBNT [email protected]