The Sine Function and the Cosine...
10
294 MHR • Functions 11 • Chapter 5 The Sine Function and the Cosine Function What do an oceanographer, a stock analyst, an audio engineer, and a musician playing electronic instruments have in common? They all deal with periodic patterns. Periodic patterns can be represented as graphs, equations, tables, and other mathematical forms. Even a complex periodic pattern can be broken down into a sum of terms, each of which is represented as a sine or a cosine function. This process is known as Fourier analysis, which is applied in such diverse fields as music synthesis, cryptography, acoustics, oceanography, stock option pricing, and probability theory. In this section, you will use your knowledge of the sine and cosine ratios to develop sine and cosine functions. You will investigate the properties of these functions and become familiar with the characteristics of their graphs. Investigate A How can you use a table and grid paper with the sine ratio to construct a function? In this chapter, you will consider wider applications of the trigonometric ratios, including applications where the independent variable does not represent an angle. In these applications, it is appropriate to use x rather than θ to represent the variable and to think of sine and cosine as functions of x: f (x) 5 sin x and g(x) 5 cos x. 1. Use a unit circle to find exact values for sin x. Use a calculator to determine approximate values for sin x. Begin at 0° and continue every 30° until you reach 360°. Copy and complete the table. x sin x Exact Value Rounded to One Decimal Place 0° 0 0.0 30° 1 _ 2 0.5 360° Tools • calculator • grid paper 5.2
Transcript of The Sine Function and the Cosine...
294MHR•Functions11•Chapter5
TheSineFunctionandtheCosineFunctionWhat do an oceanographer, a stock analyst, an audio engineer, and a musician playing electronic instruments have in common? They all deal with periodic patterns. Periodic patterns can be represented as graphs, equations, tables, and other mathematical forms. Even a complex periodic pattern can be broken down into a sum of terms, each of which is represented as a sine or a cosine function. This process is known as Fourier analysis, which is applied in such diverse fields as music synthesis, cryptography, acoustics, oceanography, stock option pricing, and probability theory.
In this section, you will use your knowledge of the sine and cosine ratios to develop sine and cosine functions. You will investigate the properties of these functions and become familiar with the characteristics of their graphs.
Investigate A
Howcanyouuseatableandgridpaperwiththesineratiotoconstructafunction?
In this chapter, you will consider wider applications of the trigonometric ratios, including applications where the independent variable does not represent an angle. In these applications, it is appropriate to use x rather than θ to represent the variable and to think of sine and cosine as functions of x: f (x) 5 sin x and g(x) 5 cos x.
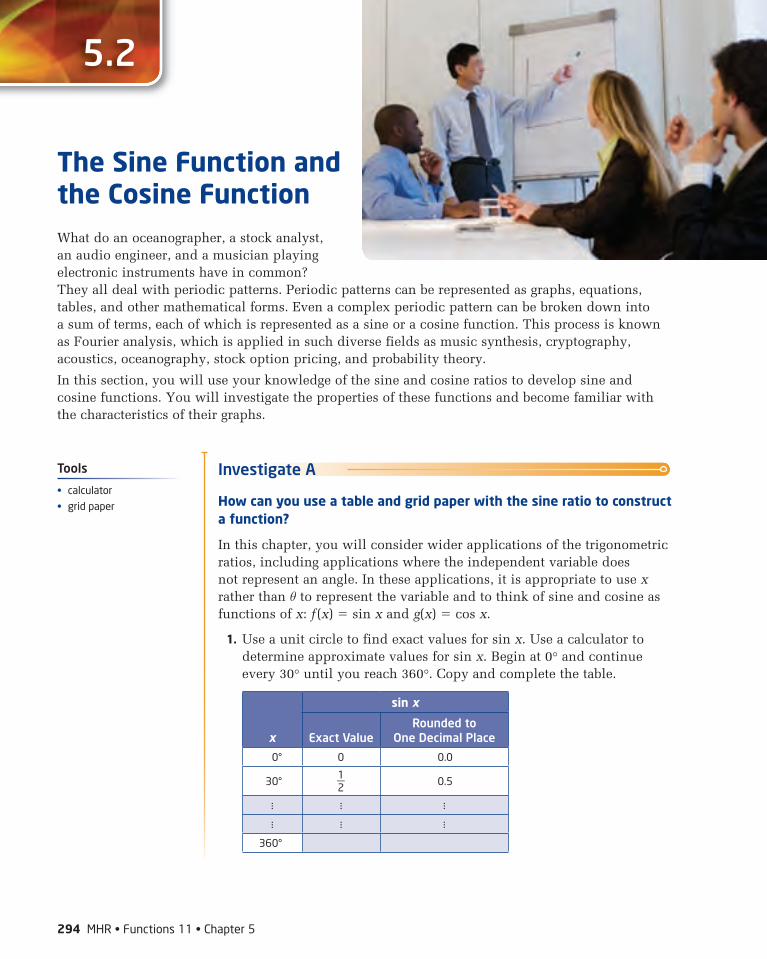
1. Use a unit circle to find exact values for sin x. Use a calculator to determine approximate values for sin x. Begin at 0° and continue every 30° until you reach 360°. Copy and complete the table.
x
sinx
Exact ValueRounded to
One Decimal Place
0° 0 0.0
30° 1
_ 2 0.5
360°
Tools
• calculator
• gridpaper
5.2
Functions 11 CH05.indd 294 6/10/09 4:10:54 PM

5.2TheSineFunctionandtheCosineFunction•MHR295
2. a) Plot the ordered pairs (x, sin x) on a graph, from x 5 0° to x 5 360°. Use the decimal values for sin x. Place the graph beside the unit circle.
b) Draw a smooth curve through the points.
3. Reflect Why do you think that this graph is often called a sine wave?
4. Continue your table past 360° for several more rows. What do you notice about the entries?
5. a) Predict the shape of the graph past 360°. Justify your prediction.
b) Verify your prediction.
6. Use your table and graph to copy and complete the table of properties for y 5 sin x for 0° to 360°. Leave the third column blank for now. You will use the third column in Investigate C.
Property y = sin x
maximum
minimum
amplitude
period
domain
range
y-intercept
x-intercepts
intervalsofincrease
intervalsofdecrease
7. Reflect Explain why the graph of y 5 sin x is periodic.
8. How can you verify that y 5 sin x is a function? Perform the verification. Write the function using function notation.
Many periodic patterns follow a sinusoidal relation and can be represented as a simple sine or cosine function. One of these patterns is the alternating current of electricity that provides energy for lights and appliances in your home. Other patterns can be modelled using combinations of two or more sine and cosine functions, or transformations of these functions. You will see some of these later in this chapter.
sinusoidal• havingthecurvedform
ofasinewave
Functions 11 CH05.indd 295 6/10/09 4:10:55 PM

296MHR•Functions11•Chapter5
Investigate B
Howcanyouusetechnologywiththesineratiotoconstructafunction?
Method1:UseaGraphingCalculator
1. Press 2nd [TBLSET] to access the TABLESETUP screen. This screen allows you to specify the starting value and the increment for a table of values. Set TblStart to 0 and Tbl to 10, as shown. Make sure Indpnt and Depend are set to AUTO.
2. Press MODE and ensure that your calculator is in DEGREE mode. Ensure that all plots are turned off. Access the Y= editor, and enter the expression sin (X) in Y1.
3. Adjust the window settings such that X is plotted from 0 to 360 with a scale of 30 and Y is plotted from 2 to 2 with a scale of 0.5. Press GRAPH .
4. Reflect Compare the graph shown by the graphing calculator to the graph that you sketched in Investigate A. Use the scale on each axis to help you compare several points. Press 2nd [CALC]. Select 1:value to evaluate y for your selection of x.
5. Press 2nd [TABLE] to access the table of values. Scroll down and compare the table to the one you constructed in Investigate A.
6. Continue scrolling past 360 to find the next maximum. How does it compare to your prediction in step 5a) of Investigate A? Predict where the next maximum will occur. Scroll down to check your answer.
7. Scroll back up and continue past 0. Predict where the next maximum will occur in this direction. Continue scrolling to check your answer.
8. Reflect Suppose that you can see the graph of f (x) 5 sin x from x 5 720 to x 5 720. How many cycles would you expect to see? Where would the maximum values occur? Where would the minimum values occur?
9. Adjust your window variables so that you can see the graph of f (x) 5 sin x from x 5 720 to x 5 720. Check your predictions from step 8.
Tools
• TI-83PlusorTI-84Plusgraphingcalculator
Functions 11 CH05.indd 296 6/10/09 4:10:55 PM

5.2TheSineFunctionandtheCosineFunction•MHR297
Method2:UseaTI-Nspire™CASGraphingCalculator
1. a) Press c and select 8:SystemInfo. Select 2:SystemSettings.... Use the e key to scroll down to Angle, and ensure that it is set to Degree. Continue on to AutoorApprox and ensure that it is set to Auto. Continue down to OK and press x twice.
b) Press c and select 6:NewDocument. Select 2:AddGraphs&Geometry.
c) Type sin(x) for function f1. Press ·.
d) Press b. Select 4:Window. Select 1:WindowSettings. Set XMin to 360, XMax to 360, Ymin to 2, and YMax to 2. Tab down to OK and press ·. The graph will be displayed as shown.
2. Reflect Compare the graph shown by the graphing calculator to the graph that you sketched in Investigate A.
b) Press b. Select 6:Points&Lines. Select 2:PointOn. Move the cursor to the graph, and press ·.
c) Press / x to grab the point. Use the cursor keys to move the point along the graph. Compare the displayed values to those in your table from Investigate A.
3. a) Press c. Add a Lists&Spreadsheet page.
b) Press b. Select 5:FunctionTable. Select 1:SwitchtoFunctionTable. Press ·. A table will appear.
c) Press b. Select 5:FunctionTable. Select 3:EditFunctionTableSettings. Set TableStart to 0. Set TableStep to 10. Tab down to OK and press ·. The function table will be displayed as shown.
4. Scroll down and compare the table to the one you constructed in Investigate A.
5. Continue scrolling past 360 to find the next maximum. How does it compare to your prediction in step 5a) of Investigate A? Predict where the next maximum will occur. Scroll down to check your answer.
6. Scroll back up and continue past 0. Predict where the next maximum will occur in this direction. Continue scrolling to check your answer.
Tools
• TI-NspireTMCASgraphingcalculator
Functions 11 CH05.indd 297 6/10/09 4:10:56 PM
298MHR•Functions11•Chapter5
7. a) Press / and the left cursor key to return to the graph display.
b) Suppose that you could see the graph of f (x) 5 sin x from x 5 720 to x 5 720. How many cycles would you expect to see? Where would the maximum values occur? Where would the minimum values occur?
8. Reflect Adjust your window settings so that you can see the graph of f (x) 5 sin x from x 5 720 to x 5 720. Check your predictions from step 7.
Investigate C
Howcanyouusethecosineratiotoconstructafunction?
The cosine curve has similarities to the sine curve, as well as some differences. Follow the steps of Investigate A and Investigate B to investigate the cosine curve. When you finish, complete the third column of the table in step 6 of Investigate A to summarize the properties of the cosine function.
KeyConcepts
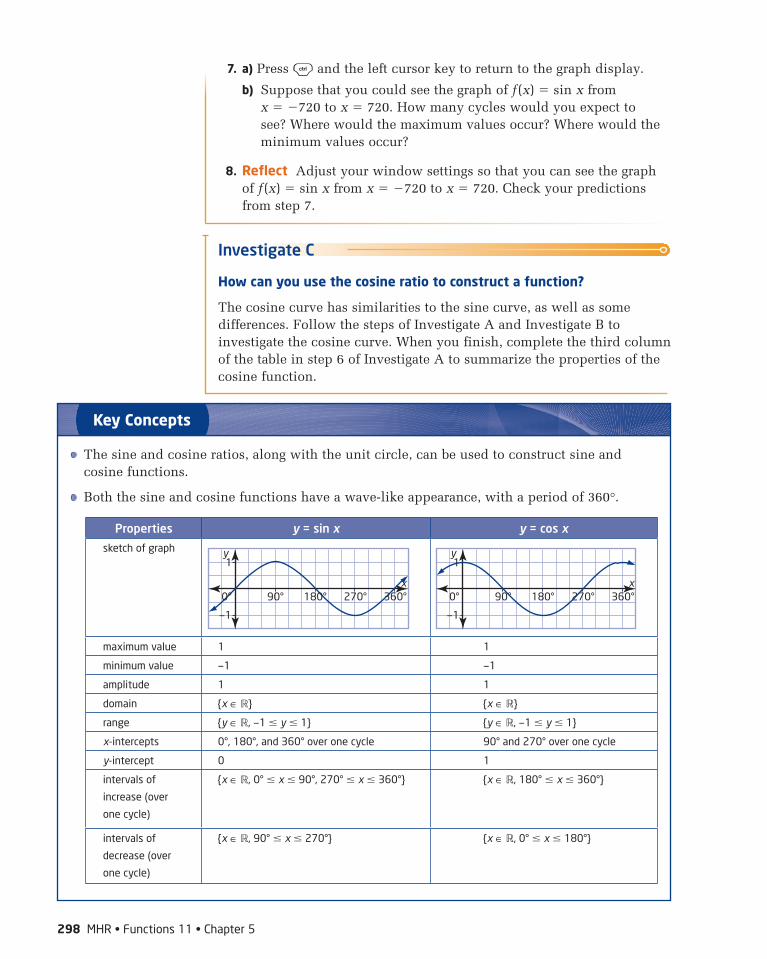
The sine and cosine ratios, along with the unit circle, can be used to construct sine and cosine functions.
Both the sine and cosine functions have a wave-like appearance, with a period of 360°.
Properties y = sin x y = cos x
sketchofgraph
maximumvalue 1 1
minimumvalue —1 —1
amplitude 1 1
domain {x∈R} {x∈R}
range {y∈R,—1y1} {y∈R,—1y1}
x-intercepts 0°,180°,and360°overonecycle 90°and270°overonecycle
y-intercept 0 1
intervalsof
increase(over
onecycle)
{x∈R, 0°x90°,270°x360°} {x∈R, 180°x360°}
intervalsof
decrease(over
onecycle)
{x∈R, 90°x270°} {x∈R, 0°x180°}
y
x
1
—1
270° 360°90° 180°0°
y
x
1
—1
270° 360°90° 180°0°
Functions 11 CH05.indd 298 6/10/09 4:10:58 PM
5.2TheSineFunctionandtheCosineFunction•MHR299
CommunicateYourUnderstanding
C1 Without a graph, predict the values of x for which the graphs of y 5 sin x and y 5 cos x will intersect in the interval from 0° to 360°. Justify your answer. Then, use graphs and tables to verify your answer.
C2 Review the x-intercepts for the sine and cosine functions. Write an expression for each graph, involving an integer n, that yields the x-intercepts when different values of n are substituted.
C3 Consider a point on the unit circle that is rotating around the circle in a counterclockwise direction.
a) Which function represents the horizontal displacement of the point with respect to the origin?
b) Which function represents the vertical displacement of the point with respect to the origin?
c) Justify your choices of functions in parts a) and b).
B ConnectandApply 1. You are in a car of a Ferris wheel. The
wheel has a radius of 8 m and turns counterclockwise. Let the origin be at the centre of the wheel. Begin each sketch in parts a) and b) when the radius from the centre of the wheel to your car is along the positive x-axis.
a) Sketch the graph of your horizontal displacement versus the angle through which you turn for one rotation of the wheel. Which function models the horizontal displacement? Justify your choice.
b) Sketch the graph of your vertical displacement versus the angle through which you turn for one rotation of the wheel. Which function models the vertical displacement? Justify your choice.
2. ChapterProblem Sounds can be modelled using sinusoidal functions. A simple instrument such as a flute produces a sound that can be modelled very closely using the function y 5 sin x. As sounds become more complex, the model must become more complex. For example, the
sound from a stringed instrument can be modelled closely using a more complex function such as y 5 sin x sin 2x.
a) Use technology or grid paper to sketch the graphs of y 5 sin x and y 5 sin x sin 2x.
b) How do the graphs differ? How are they similar?
c) Add the third harmonic, sin 3x, to your model and sketch the graph. Compare the graph to the simple sine wave and to the sine wave together with the second harmonic.
Connections
Inmusicalterms,youhaveaddedthesecondharmonic,sin2x,tothefundamental,sinx.Anelectronicsengineercanmimicthesoundsofconventionalinstrumentselectronicallybyaddingharmonics,orovertones.Thisprocessisknownasmusicsynthesisandisthebasicprinciplebehindtheoperationofsynthesizers.Tolearnmoreabouthowtheadditionofharmonicschangesasound,gototheFunctions 11pageoftheMcGraw-HillRyersonWebsiteandfollowthelinkstoChapter5.
Functions 11 CH05.indd 299 6/10/09 4:10:58 PM
3. The hour hand on a clock has a length of 12 cm. Let the origin be at the centre of the clock.
a) Sketch the graph of the vertical position of the tip of the hour hand versus the angle through which the hand turns for a time period of 72 h. Assume that the hour hand starts at 9.
b) Sketch the graph of the horizontal position of the tip of the hour hand versus the angle through which the hand turns for a time period of 72 h. Assume that the hour hand starts at 3.
c) How many cycles appear in the graph in part a)?
d) How many cycles will appear in the graph in part a) if you use the minute hand rather than the hour hand? Explain your prediction.
C Extend 4. What does the graph of y 5 tan x look
like? Use a calculator to investigate. Round values of tan x to three decimal places.
a) Construct a table of values for x and tan x. Use 10° increments up to 70°. Then, use 5° increments up to 85°. Change to 1° increments up to 89°.
b) What happens to the value of tan x as x approaches 90°? Review the unit circle and explain why this happens. What is the value of tan 90°?
c) Continue your table of values up to 360°. Adjust the increment as required.
d) Use your table of values to draw a graph of y 5 tan x. To keep the scale manageable, use y-values from 10 to 10. Allow space on the horizontal axis x-values from 720° to 720°.
e) Draw the asymptotes as vertical dashed lines at x 5 90° and x 5 270° on this graph. The graph of the tangent function approaches, but never reaches, each of these asymptotes.
f) Predict what the graph will look like if it is extended past x 5 360° to x 5 720°. Where will the asymptotes be drawn? Use the calculator to check a few points. Then, sketch the graph from x 5 360° to x 5 720°.
g) Predict what the graph will look like if it is extended left past x 5 0°. Where will the asymptotes be drawn? Use the calculator to check a few points. Then, sketch the graph from x 5 720° to x 5 0°.
h) Is the graph of y 5 tan x periodic? Justify your answer. If the function is periodic, determine the period.
5. a) Show that y 5 tan x is a function.
b) Is it possible to identify the amplitude of the function? Justify your answer.
c) For what interval(s) of values for x from 0° to 360° is the function increasing? For what interval(s) is it decreasing?
d) UseTechnology Use a graphing calculator to plot the tangent function from x 5 360° to x 5 360°. Compare the graph on the calculator to the graph that you sketched in question 4.
e) You can add asymptotes at appropriate values of x. Return to the home screen. Press 2nd [DRAW]. Select 4:Vertical, and type 90. Return to the graph. Note that a vertical line appears at x 5 90°. Add other asymptotes as appropriate.
300MHR•Functions11•Chapter5
Connecting
Problem Solving
Reasoning and Proving
Reflecting
Selecting ToolsRepresenting
Communicating
Connecting
Problem Solving
Reasoning and Proving
Reflecting
Selecting ToolsRepresenting
Communicating
Functions 11 CH05.indd 300 6/10/09 4:11:00 PM
5.2TheSineFunctionandtheCosineFunction•MHR301
f) What is the domain of the tangent function? What is the range? Write each using set notation.
6. a) Sketch the function f (x) 5 sin x from x 5 0° to x 5 360°.
b) Review the definition of cosecant. Using your graph from part a), determine the shape of the graph of y 5 csc x.
c) Use grid paper and a scientific calculator, or a graphing calculator, to check your answer to part b). Add asymptotes where appropriate.
d) Show that y 5 csc x is a function.
e) What is the domain of the function? What is the range?
7. Use a method similar to that in question 6 to analyse the graph of y 5 sec x.
8. Use a method similar to that in question 6 to analyse the graph of y 5 cot x.
9. Consider the function y 5 sin x cos x.
a) Predict the y-intercept of the function.
b) Predict the x-intercepts from 0° to 360°. Justify your answer.
c) Use a graph or a graphing calculator to verify your answers to parts a) and b).
10. MathContest For 0° θ 360°, over what intervals is sin θ cos θ?
11. MathContest For 90° θ 90°, for what value(s) of θ does tan θ 5 cot θ?
12. MathContest From a list of five numbers, a pair are chosen and then totalled. The sums of all possible pairs are 4, 8, 10, 12, 14, 18, 20, 22, 26, and 30. What is the sum of all five numbers?
A 164 B 82
C 41 D not possible to determine
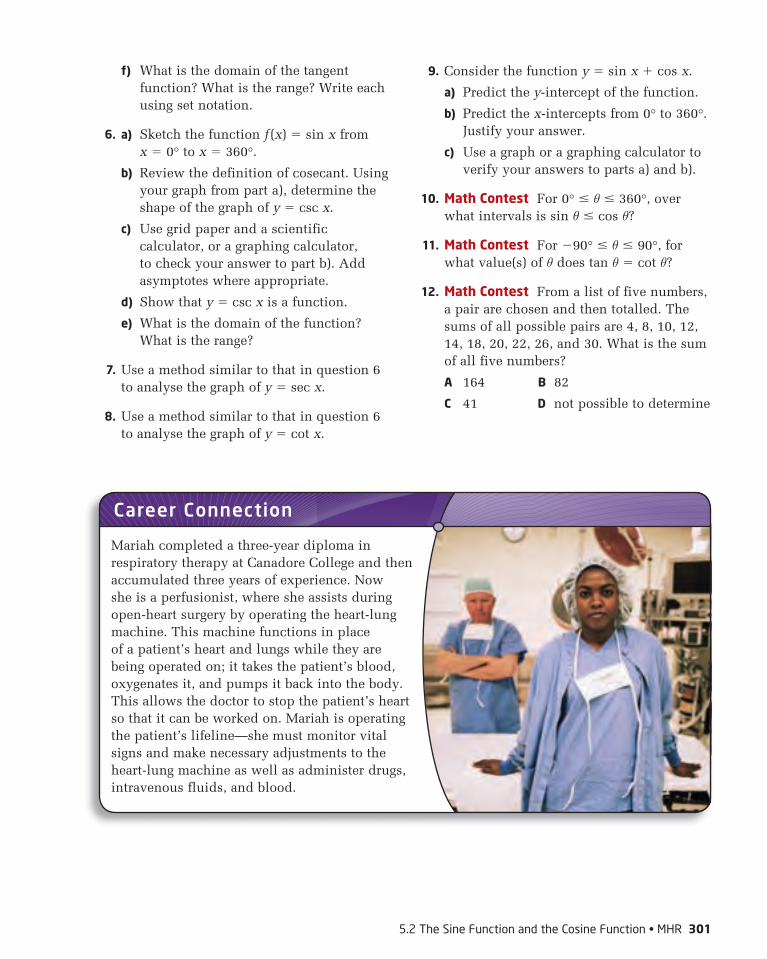
Mariah completed a three-year diploma in respiratory therapy at Canadore College and then accumulated three years of experience. Now she is a perfusionist, where she assists during open-heart surgery by operating the heart-lung machine. This machine functions in place of a patient’s heart and lungs while they are being operated on; it takes the patient’s blood, oxygenates it, and pumps it back into the body. This allows the doctor to stop the patient’s heart so that it can be worked on. Mariah is operating the patient’s lifeline—she must monitor vital signs and make necessary adjustments to the heart-lung machine as well as administer drugs, intravenous fluids, and blood.
Career Connection
Functions 11 CH05.indd 301 6/10/09 4:11:04 PM

302MHR•Functions11•Chapter5
Dynamically Unwrap the Unit Circle
Draw a graph of the unit circle and plot a point at (1, 0). Recall that the coordinates of a point on the unit circle can be expressed as (cos θ, sin θ), where θ is an angle in standard position. Imagine the point moving counterclockwise around the circle. As the point moves, the angle θ increases from 0° to 360°. At the same time, the y-coordinate of the point follows the sine function. You can use a graphing calculator to plot the unit circle and the sine function simultaneously.
1. Press MODE . Set the fourth line to parametric mode PAR and the sixth line to simultaneous mode SIMUL.
2. In parametric mode, you can enter a separate equation for each of x and y in terms of a third parameter. The calculator assigns the variable T to the third parameter. The SIMUL mode will plot the two graphs at the same time, rather than one after the other. Press Y= . Notice that the list looks somewhat different from what you are used to. Enter the expression cos(T) for X1T and sin(T) for Y1T.
3. Reflect Compare these expressions to the coordinates of a point on the unit circle.
4. Plot the unit circle and the sine function on the same set of axes. The unit circle has a radius of 1 and the sine function needs an interval of 0° to 360° for one cycle. These scales are not compatible. To compensate, adjust the scale for the sine function by dividing by 60. This allows you to use a window that can accommodate both graphs. Enter T/60 for X2T and sin(T) for Y2T.
Tools
• graphingcalculator
Technology TipWhenyouareinparametricmode,pressing X, T, , n willreturnaT.
Use Technology
Functions 11 CH05.indd 302 6/10/09 4:11:05 PM

UseTechnology:DynamicallyUnwraptheUnitCircle•MHR303
5. Press WINDOW . The window variables will also look a little different from what you are used to. Set the T interval from 0 to 360 with a scale of 1, the X interval from 2 to 8 with a scale of 1, and the Y interval from 3 to 3 with a scale of 1.
6. Press GRAPH . Watch how the unit circle and the sine function are drawn in step with each other. Note: Keep in mind that the scales are different for the two graphs so that you can display them on the same screen. For the unit circle, each mark on the x-axis represents 1 unit. For the sine function, each mark on the x-axis represents 60°.
7. Reflect The instructions direct you to operate the graphing calculator in a mode that is probably new to you. Review each step to ensure that you understand what is being done in that step. Explain the role of T in the functions being graphed.
8. Modify steps 1 to 6 to plot the unit circle along with the cosine curve. What changes do you need to make? Explain why these changes are necessary.
Extend 9. Suppose that you want to plot the unit circle along with the tangent,
cosecant, secant, and cotangent curves, one at a time.
a) Explain which of steps 1 to 6 need to be changed and which do not.
b) Make the changes that you identified in part a). Then, plot the four graphs.
Technology TipIfyouwanttowatchthegraphsbedrawnagain,youcannotjust
press QUIT andthen
press GRAPH .Thegraphingcalculatorremembersthelastgraphthatyouaskedfor,andwilljustdisplayit,providedthatyouhavenotmadeanychangesthataffectthegraph.Thereareseveralwaystogetaroundthisfeature.OneistoselectPlotsOnfromtheSTATPLOTmenuandthenselectPlotsOff.Whenyou
press GRAPH ,theunitcircleandsinefunctionwillbedrawnagain.
Functions 11 CH05.indd 303 6/10/09 4:11:07 PM