The Simple View of Reading over time 1 The Simple View of ...
43
The Simple View of Reading over time 1 The Simple View of Reading across development: the prediction of grade 3 reading comprehension by prekindergarten skills Language and Reading Research Consortium Chiu, Y. D. Lancaster University, UK Accepted for publication: Remedial and Special Education. 18 January 2018.
Transcript of The Simple View of Reading over time 1 The Simple View of ...

The Simple View of Reading over time
1
The Simple View of Reading across development: the prediction of grade 3 reading
comprehension by prekindergarten skills
Language and Reading Research Consortium
Chiu, Y. D. Lancaster University, UK
Accepted for publication: Remedial and Special Education. 18 January 2018.

The Simple View of Reading over time
2
Author Note:
This paper was prepared by a Task Force of the Language and Reading Research Consortium
(LARRC) consisting of Kate Cain (Convener) and Yi-Da Chiu. LARRC project sites and
investigators are as follows:
Ohio State University (Columbus, OH): Laura M. Justice (Site PI), Richard Lomax, Ann
O’Connell, Jill Pentimonti1, Stephen A. Petrill2, Shayne B. Piasta
Arizona State University (Tempe, AZ): Shelley Gray (Site PI), Maria Adelaida Restrepo.
Lancaster University (Lancaster, UK): Kate Cain (Site PI).
University of Kansas (Lawrence, KS): Hugh Catts3 (Site PI), Mindy Bridges, Diane Nielsen.
University of Nebraska-Lincoln (Lincoln, NE): Tiffany Hogan (Site PI), Jim Bovaird, J. Ron
Nelson.4
MGH Institute of Health Professions (Boston, MA): Tiffany Hogan (Site PI)
1. Jill Pentimonti is now at American Institutes for Research (AIR).
2. Stephen A. Petrill was a LARRC co-investigator from 2010-2013.
3. Hugh Catts is now at Florida State University.
4. J. Ron Nelson was a LARRC co-investigator from 2010-2012.
This work was supported by grant # R305F100002 of the Institute of Education Sciences’
Reading for Understanding Initiative. We are deeply grateful to the numerous staff, research
associates, school administrators, teachers, children, and families who participated. Key
personnel at study sites include: Crystle Alonzo, Lisa Baldwin-Skinner, Lauren Barnes, Garey
Berry, Beau Bevens, Jennifer Bostic, Shara Brinkley, Janet Capps, Tracy Centanni, Beth
Chandler, Lori Chleborad, Emmanuel Cortez, Willa Cree, Dawn Davis, Kelsey Dickerhoof,
Jaclyn Dynia, Michel Eltschinger, Kelly Farquharson, Tamarine Foreman, Yvonne Fraser,
The Simple View of Reading over time
3
Abraham Aldaco Gastelum, Rashaun Geter, Sara Gilliam, Alexandria Hamilton, Cindy Honnens,
Miki Herman, Hui Jiang, Elaine Joy, Jaime Kubik, Trudy Kuo, Gustavo Lujan, Chi Luu, Junko
Maekawa, Carol Mesa, Denise Meyer, Maria Moratto, Kimberly Murphy, Marcie Mutters, Amy
Pratt, Trevor Rey, Lizeth Sanchez-Verduzco, Amber Sherman, Shannon Tierney, Stephanie
Williams, and Gloria Yeomans-Maldonado.
The views presented in this work do not represent those of the federal government, nor do they
endorse any products or findings presented herein. Correspondence concerning this work should
be sent to Kate Cain, [email protected], Department of Psychology, Lancaster University,
LA1 4YF, UK.

The Simple View of Reading over time
4
Abstract
We assessed the simple view of reading as a framework to explain grade 3 reading
comprehension in two ways. We first confirmed that a structural equation model in which word
recognition, listening comprehension, and reading comprehension were assessed by multiple
measures to inform each latent construct provided an adequate fit to this model in grade 3.
Together, these variables explained sizeable (95%) variance in reading comprehension. We next
examined how well oral language and code-related skills assessed in prekindergarten (PK)
predicted reading comprehension in grade 3, through the two core components of the simple
view: word recognition and listening comprehension. Multiple measures of vocabulary,
grammar, and discourse-level skills were used to inform a latent construct of PK oral language,
and multiple measures of letter and print knowledge and phonological processing informed a
latent construct of code-related skills that are precursors to word reading. The best-fitting
structural equation model explained 96% of the variance in reading comprehension, with strong
relations evident between prekindergarten skills and the complementary grade 3 constructs of
listening comprehension and word recognition. Of note, the PK latent constructs of oral language
and code-related skills were strongly related to each other, with a much weaker (and non
significant) relation between the complementary grade 3 constructs of listening comprehension
and word recognition. These findings demonstrate a strong influence of PK oral language skills
on later reading comprehension, and provide diagnostic and instructional implications for the
teaching of early reading.
WC=240
Keywords: simple view of reading, reading comprehension, listening comprehension, word
recognition, language skills, longitudinal

The Simple View of Reading over time
5
The Simple View of Reading across development: the prediction of grade 3 reading
comprehension by prekindergarten skills
The Simple View of Reading (Gough & Tunmer, 1986) provides a powerful, yet
straightforward, framework for the study of reading comprehension. There is significant support
for the central tenet of this framework, that reading comprehension is the product of word
recognition and listening comprehension: when considered together, measures of these two broad
skill sets explain sizeable and significant variance in reading comprehension (Garcia & Cain,
2014) across a wide age range. Because of its validity, the simple view has had a substantial
impact beyond academia, influencing educational policy and practice on the need to foster the
skills that underpin word reading (Kendeou, Savage, & van den Broek, 2009) and also those that
support comprehension (Snow, 2002). In this special issue celebrating the reach and impact of
the simple view, we consider its explanatory power for reading development. We examine the
relative influence of listening comprehension and word recognition on reading comprehension in
beginner readers of English, and the relation between prekindergarten (PK) language skills and
knowledge and grade 3 listening comprehension, word recognition, and reading comprehension.
Our first aim was to examine the concurrent influence of word recognition and listening
comprehension on reading comprehension in grade 3. We use the term ‘word recognition’ to
refer to the application of knowledge of letter-sound relationships and letter patterns, as well
word-specific orthographic knowledge, for regular and irregular word reading (Wang, Nickels,
Nation, & Castles, 2013). We use ‘listening comprehension’ to refer to understanding of text
read aloud, which has also been referred to as linguistic comprehension (Gough & Tunmer,
1986) and language comprehension (Cragg & Nation, 2006). The simple view predicts
diachronic change in their influence: as word recognition accuracy and fluency develop through

The Simple View of Reading over time
6
formal literacy instruction, the strength of the prediction of reading comprehension from word
recognition decreases and listening comprehension becomes the more substantial predictor. This
basic pattern for English readers is confirmed by meta-analysis (Garcia & Cain, 2014) and
empirical work (Language and Reading Research Consortium (LARRC), 2015b). Our focus in
the current study is the concurrent prediction of reading comprehension in grade 3. Whilst Garcia
and Cain’s (2014) meta-analysis suggests a stronger influence of word recognition than listening
comprehension for this age group, recent empirical work using the same measures as the current
study found that in grade 3 listening comprehension was the stronger predictor (LARRC, 2015b).
That finding is in line with studies of readers of Finnish (Lepola, Lynch, Kiuru, Laakkonen, &
Niemi, 2016; Torppa et al., 2016), a transparent orthography for which word reading fluency is
achieved earlier than for more opaque orthographies such as English (Seymour, Aro, & Erskine,
2003). Given the influence of the simple view on the teaching of reading (e.g., Kirby & Savage
(Kirby & Savage, 2008), we sought to test the reproducibility of the LARRC (2015b) finding for
grade 3 English speakers, with the same measures, but a larger and different set of participants.
Our second and central aim was to examine the prediction of reading comprehension
longitudinally, within the framework of the simple view. Neither word recognition nor listening
comprehension are unidimensional, thus it is important to sample the range of skills and
knowledge that informs each construct. Longitudinal studies have included preschool
measurement of a range of code-related precursors to word recognition, including letter and
sound identification and phonological processing skills. When sampled comprehensively in this
way, preschool skills are found to influence reading comprehension indirectly through later word
recognition (Catts, Herrera, Nielsen, & Bridges, 2015; Kendeou, van den Broek, White, &
Lynch, 2009; Storch & Whitehurst, 2002; Torppa et al., 2016). With regard to listening

The Simple View of Reading over time
7
comprehension, recent tests of the simple view report that vocabulary and listening
comprehension both load onto a single construct (Braze et al., 2016; Tunmer & Chapman, 2012).
In line with this, longitudinal studies of reading comprehension development find that greater
variance is explained by models that include both vocabulary and discourse-level measures of
oral language (47-88%: (Catts, Herrera, Cocoran Nielsen, & Sittner Bridges, 2015; Kendeou, van
den Broek, et al., 2009; Lepola et al., 2016) than by models that include only vocabulary (32%:
(Torppa et al., 2016). Vocabulary, grammar, and discourse-level comprehension all inform the
construct of oral language in the early years (Foorman, Herrera, Petscher, Mitchell, &
Truckenmiller, 2015; Language and Reading Research Consortium (LARRC), 2015a), but
research to date has not investigated how oral language predicts later reading comprehension via
listening comprehension, that is they have not directly addressed the longitudinal prediction of
reading comprehension within the simple framework. We address that limitation in our paper.
Further, in contrast to other studies, we included a range of oral language skills – vocabulary,
grammar, and discourse-level, to provide a comprehension sampling of this construct.
Although code-related skills and oral language are related in the early years, their
subsequent development is broadly independent (Kendeou, van den Broek, et al., 2009; Lepola et
al., 2016; Storch & Whitehurst, 2002; Torppa et al., 2016) and the correlations between
concurrent measures of word recognition and listening comprehension by grades 2 to 4 are weak
(Catts, Hogan, & Fey, 2003; Kendeou, Savage, et al., 2009). However, a recent study of 7-year-
olds found that the best fitting model of the simple view included a pathway between concurrent
word recognition and listening comprehension (Tunmer & Chapman, 2012). Vocabulary was
included as an indicator of listening comprehension, which may have influenced model fit
because of its relation to both word recognition and listening comprehension (LARRC, 2015b).

The Simple View of Reading over time
8
In the current study, we conceptualized listening comprehension as understanding of passages
spoken aloud (Hoover & Gough, 1990), and contrasted models in which word recognition and
listening comprehension were independent or related.
Current study
Our first aim was to confirm that the basic model of the simple view of reading provided
a good estimation of reading comprehension in grade 3 (LARRC, 2015b). To address this aim,
we used structural equation modeling to examine the relations between listening comprehension,
word recognition, and reading comprehension in a large sample of grade 3 children. Our second
set of analyses focused on our central aim to determine if language skills and knowledge
assessed before the start of formal literacy instruction predicted later reading comprehension,
through listening comprehension and word recognition. These analyses examined continuity in
the development of these components within the framework of the simple view. There are
relations between code-related skills and oral language in preschool (Kendeou, van den Broek, et
al., 2009) and between word recognition and listening comprehension in grade 3 (Tunmer &
Chapman, 2012). Thus, we also examined whether the two constructs in PK and grade 3 were
independent or related, and also whether they were related across time with the addition of cross-
lagged longitudinal relations. Previous studies have not found significant cross-lagged relations
over 2 years (Kendeou, van den Broek, et al., 2009), but it is possible that such effects may be
evident over a longer period of time. The unique contribution of our study is the examination of
how well oral language and code-related skills assessed in prekindergarten predict reading
comprehension five years later, through the two core components of the simple view: listening
comprehension and word recognition, and the extent to which their influence is independent.
Method

The Simple View of Reading over time
9
Participants
The participants were part of a larger longitudinal study of reading and listening
comprehension in preschool to third grade children. The original sample was 420 children in
prekindergarten in the initial year of the study and who progressed to grade 3 five years later,
which was a final sample of 305 children (77 children left the study before Year 5, and 38
progressed only to grade 1 or 2). They were selected through preschool centers at four data
collection sites (Arizona, Kansas, Nebraska, Ohio) via recruitment packs sent home to the
children’s caregivers. Approximately the same number were recruited from each site, with key
demographic characteristics (e.g., eligibility to receive free/reduced price lunch and membership
in racial/ethnic categories) of the sample similar to the child population at that site. The final
sample’s mean age in PK was 5 years, 1 month. The majority (94.1%) was white/Caucasian with
English as the home language (94.1% for each variable), with more boys than girls (56.1% vs
43.9) and 9.5% of children received free/reduced lunch. Full details are reported in (Language
and Reading Research Consortium (LARRC), Farquharson, & Murphy, 2016).
Measures in Prekindergarten
The assessment battery described below includes multiple measures of three dimensions
of oral language: vocabulary, grammar, and discourse-level, and multiple measures of code-
related skills: letter name and sound knowledge, print knowledge, and phonological processing.
We report the correlations between variables, the mean raw scores and standard deviations for
the sample included in our statistical analyses in Tables 1 - 3. We also report reliability
(Cronbach’s alpha, unless otherwise stated) for our entire PK sample (N=420). The measures
were administered in the latter half of the school year. The administration and scoring protocols
in the manual was followed for standardized measures, unless stated below.

The Simple View of Reading over time
10
Oral language. Three measures of vocabulary were administered: The Peabody Picture
Vocabulary-4 (PPVT-4: Dunn & Dunn, 2007) assessed receptive vocabulary; the Expressive
Vocabulary Test-2 (EVT-2: Williams, 2007) assessed expressive vocabulary; and the Word
Classes 1 subtest from the Clinical Evaluation of Language Fundamentals-4 (CELF-4: Semel &
Wiig, 2006) assessed understanding of relationships between words and included both receptive
and expressive components. Five measures of grammar were administered. The Word Structure
(WS) subtest of the CELF-4 (Semel & Wiig, 2006) assessed understanding of morphology and
pronouns. A stop rule of eight incorrect responses was utilized. The Recalling Sentences (RS)
subtest of the CELF-4 assessed the ability to repeat back spoken sentences of increasing length
and complexity. To better accommodate PK children, the first two items from the Recalling
Sentences subtest of the CELF: Preschool, 2nd edition (Semel & Wiig, 2006) were administered
first, followed by the test items from the CELF-4 in the designated order. The Past Tense probe
(TEGT) of the Rice/Wexler Test of Early Grammatical Impairment (TEGI; Rice & Wexler,
2001) assessed children’s production of regular and irregular past tense verbs. The Third Person
Singular probe (TEGS) of the TEGI assessed children’s production of /-s/ or /-z/ in present tense
verb forms with singular subjects. The Test for Reception of Grammar – Version 2 (TROG-2;
Bishop, 2003) assessed comprehension of grammatical contrasts, with four items in each block
to assess the same grammatical contrast. The total number of correct blocks was the score used.
Three measures of discourse skills were administered. Comprehension monitoring was
assessed with a researcher-developed measure, the Knowledge Violations Test (KVT), based on
previous research (Cain & Oakhill, 2006; Oakhill & Cain, 2012). The child heard short stories
that were either entirely consistent or included inconsistent information. After each one, the child
was asked whether the story made sense and, if not, what was wrong with it. One point was

The Simple View of Reading over time
11
awarded when both components were correctly answered. Inference making was assessed with a
researcher-developed measure based on previous research (Cain & Oakhill, 1999; Oakhill &
Cain, 2012). One practice and two experimental stories were read aloud by the assessor. After
each one, they asked four open-ended questions to assess the ability to generate inferences that
require integration of information in the text (INF-INT), and four to assess the ability to generate
inferences that require integration of textual information with background knowledge (INF-BK).
These were scored 0-2 points and the average score for each was calculated. Text structure
knowledge was assessed with an adaptation of the Picture Arrangement Test (PAT) from the
Wechsler Intelligence Scale for Children (WISC-III; Wechsler, 1992). There was one practice
item and 12 test items. For each, children saw three to five picture cards in a fixed order and
heard a sentence that described each. Their task was to arrange the pictures into the correct
(temporal and causal) sequence. A ceiling rule of five incorrect items was applied.
TABLE 1 AROUND HERE
Code-related skills. Four measures were administered. Letter knowledge was assessed
using the Letter Identification (LI) subtest of the Woodcock Reading Mastery Tests-Revised:
Normative Update (WRMT-R:NU: Woodcock, 1997), for which children named letters of the
alphabet presented in isolation in a variety of fonts and styles. The Print Knowledge (PK) subtest
of the Test of Preschool Early Literacy (TOPEL: Lonigan, Wagner, Torgesen, & Rashotte, 2007)
assessed the ability to name and say the sounds of specific letters, and to identify letters
associated with specific sounds. Phonological awareness was assessed by the Phonological
Awareness (PA) subtest of the TOPEL, which comprises auditory elision and blending tasks.
Rapid automatized naming (RAN) was assessed with a modification of the RAN task in the
CELF-4, which does not have a preschool version. Children were required to name arrays of

The Simple View of Reading over time
12
colors, objects (familiar animals: cow, horse, pig), and colors and objects combined (red cow,
blue horse, etc.). Both errors and time taken to name the array were recorded.
TABLE 2 AROUND HERE
Measures in Grade 3
The assessment battery included multiple measures of reading comprehension, word
recognition, and listening comprehension. We report the correlations between variables, mean
raw scores and standard deviations for the sample included in our statistical analyses (N=305) in
Table 2. We also report reliability (Cronbach’s alpha, unless otherwise stated) computed on a
separate sample of children in grade 3 (N=120), where appropriate. The measures were
administered in the latter half of the school year and the administration and scoring protocols in
the manual was followed for standardized measures, unless stated below.
Reading comprehension. Three measures of reading comprehension were administered.
The Gates-MacGinitie (GM) (MacGinitie, MacGinitie, Maria, & Dreyer, 2000) for grade 3
comprises a series of passages. Children answer questions (with multiple choice responses) after
each one. The Passage Comprehension (WPC) subtest from the WRMT-R:NU (Woodcock,
1997) assessed reading comprehension with a cloze procedure. The Reading Comprehension
Measure (RCM) was adapted from the Qualitative Reading Inventory (QRI-5: Leslie &
Caldwell, 2011) and comprised two narrative and two expository passages, which children read
silently. They answered open-ended questions after each passage, tapping inferential and non-
inferential information. Five passages came from the QRI-5 and the remainder was created
matched to these passages in terms of length and lexile. For each measure, the total number of
items (questions) correct was used as the raw score.

The Simple View of Reading over time
13
Word recognition. We included measures of word and nonword reading accuracy and
efficiency and passage reading fluency to provide a comprehensive sampling of the skills and
knowledge that support word recognition. Accuracy was assessed by two subtests from the
WRMT-R:NU (Woodcock, 1997). The Word Identification (WID) subtest measured the ability
to accurately pronounce printed English words ranging from high to low frequency of
occurrence. The Word Attack (WA) subtest assessed the ability to read pronounceable nonwords
of increasing complexity. Two subtests of the Test of Word Reading Efficiency-Second Edition
(TOWRE-2: Torgesen, Wagner & Rashotte, 2011) measured word reading efficiency by
determining how many printed English words (Sight Word Efficiency (SWE) subtest) and
pronounceable nonwords (Phonemic Decoding Efficiency (PDE) subtest) children could
pronounce accurately in 45 seconds. Word reading fluency in context was assessed with an
adaption of the Florida Assessment for Instruction in Reading: Oral Reading Fluency (ORF:
State of Florida, 2009). Children read two passages aloud for up to 60 seconds. They were asked
a comprehension question after each passage to encourage reading for meaning. Words read
accurately per minute was calculated for each and a fluency score obtained from the lookup
tables provided by the Florida Center for Reading Research (www.fcrr.org/lookup).
Listening comprehension. Three measures of listening comprehension were
administered. In the Test of Narrative Language - Receptive (TNL; Gilliam & Pearson, 2004),
children listened to three passages and answered open-ended questions after each. The measure
was administered according to test procedures with the exception that prior to answering
questions for the second passage, children retold the passage (used for other studies within the
larger project). We administered a modified version of the Understanding Spoken Paragraphs
(USP) subtest of the CELF-4 (Semel & Wiig, 2006), using only two test paragraphs instead of

The Simple View of Reading over time
14
three for each grade. Reliability was low (.51). Exploratory factor analyses revealed a multi-
factor structure which could explain the low reliability. We also administered an experimental
measure, the Listening Comprehension Measure (LCM), adapted in part from the QRI-5, and
similar to the RCM in format. Inter-rater reliability (on 10% of the sample) was good = .96. For
each measure, the total number of items (questions) correct was used as the raw score.
TABLE 3 AROUND HERE
Procedures
All measures were administered by trained research staff in a quiet room in the child’s
school, local university site, community center, or home. The full battery took 5 to 6 hours to
complete, with measures administered in prescribed blocks each lasting 15 to 40 minutes. All
measures were administered individually, with the exception of the Gates-MacGinitie, which
was administered in small groups or individually, where necessary. Inter-rater reliability (intra-
class correlation on 10% of the sample) was calculated for measures with open-ended questions
(PK Inference; G3 modified understanding spoken paragraphs; G3 listening and reading
comprehension measures) and all were excellent (> .85) (Cicchetti, 1984). Full detail on our
training and assessment procedures can be found in (LARRC, Farquharson, & Murphy, 2016).
Results
Descriptive Statistics
Inspection of skewness and kurtosis criteria, histograms, and boxplots of the data, the
majority of variables showed adequate distribution with no severe departures from normality. No
extreme outliers were identified within the data at either grade.
Structural Equation Models
For each research aim we used structural equation modelling (SEM) to assess the

The Simple View of Reading over time
15
relations among variables in different theoretical models, using version 0.5-23 of the R package
lavaan (Rosseel, 2012). A Maximum Likelihood robust estimator (Finney & DiStefano,
2008)with Full Information Maximum Likelihood (FIML) method (Enders & Bandalos, 2001)
was used to address missing data, and mild violations of normality assumptions. We assumed
that the data were Missing at Random (MAR), which is a requirement of the FIML. The two
typical submodels in SEM were used: the measurement model and the structural model. The
measurement model specifies the relationships between the observed (or measured) variables and
their underlying unmeasured latent variable (as specified in Tables 1-4, and Figures 1 &
2). Measurement errors of observed variables were allowed to vary. The structural model
specifies the hypothetical directed relations among the latent variables, as shown in Figures 1-4,
for each theoretical model. Note that measurement error is essentially regression residual
uncorrelated with the corresponding latent variable which cannot explain variance in the error.
The use of multiple measures takes measurement error into account, thereby resulting in a better
assessment of each latent variable. It consequently solidifies the entity of latent constructs before
further testing the posited hypothesis about their directed relations. This feature is generally not
available when only single measures are used and no measurement errors are considered
To evaluate model fit, we examined a range of fit indices (Lomax, 2013; McCoach,
Black, & O’Connell, 2007). The !" goodness-of-fit test is sensitive to sample size, so we
expected this to be significant for all models and report it for completeness. We evaluated fit on
the basis of the following indices: the root mean square error of approximation (RMSEA), for
which values of < .08 indicate acceptable fit (Browne & Cudeck, 1993; MacCallum & Austin,
2000); the standardized root mean square residual (SRMR), for which values of < .05 indicate
good fit (Byrne, 2012); the comparative fit index (CFI) and the non-normed fit index (NNFI), for

The Simple View of Reading over time
16
which values > .90 indicate good fit (Lomax, 2013). We report 90% confidence intervals for the
RMSEA and results of the closeness of fit test (Browne & Cudeck, 1993) which tests the null
hypothesis that RMSEA is less than or equal to .05 (this test should be ns). Akaike’s Information
Criterion (AIC) was used to compare competing models: smaller AICs indicate better fit (Kline,
2013) and the Chi-square difference test was also used to compare fit of nested models. For each
theoretical model, we present estimates from the standardized solution. The fit indices are
reported in Tables 4-6 and the estimated parameters (including factor loadings, structure
coefficients, and correlations) in the tables and Figures 1 and 2.
Prediction of grade 3 reading comprehension by concurrent measures of listening
comprehension and word recognition. In this first pair of analyses, we sought to confirm that
the basic model of the SVR reported in LARRC (2015b) was retained in a new sample of
participants. We tested the fit of two models to determine whether listening comprehension and
word recognition were independently related to reading comprehension (independent model), or
whether the best fitting model included a pathway between the two (dependent model).
TABLE 4 AROUND HERE
FIGURE 1 AROUND HERE
The basic theoretical model hypothesized that listening comprehension and word
recognition independently influence reading comprehension. This provided a good estimation of
grade 3 reading comprehension explaining around 94% of the variance. All of the factor loadings
and structure coefficients were significantly different from zero (p < .05) and in the expected
direction (i.e., positive). Model fit was only moderate. The second model that included an
additional hypothesized relation between word recognition and listening comprehension (Figure
1) produced a better fit to the data, although we note that the closeness of fit test for RMSEA

The Simple View of Reading over time
17
remained significant. The adjusted S-B Δ!" difference test confirmed that the dependent model
was the superior fitting model: Δ!" = 40.44, p < .001. In contrast to LARRC (2015b) there was a
stronger relation between word recognition and reading comprehension (.66) than between
listening comprehension and reading comprehension (.47) (coefficients reported in LARRC,
2015b, were .48 and .60, respectively). We consider reasons for this difference in the Discussion.
Longitudinal prediction of grade 3 reading comprehension by prekindergarten oral
language and code-related skills. Our second, central, research question, examined the
prediction of grade 3 reading comprehension by PK oral language (vocabulary, grammar,
discourse) and code-related skills (letter and print knowledge, phonological awareness, and
RAN). All models hypothesized that PK oral language and code-related skills predicted grade 3
reading comprehension through their influence on listening comprehension and word
recognition, respectively. We first compared the fit of four different models to examine whether
oral language and decoding skills develop along independent pathways or whether there was
interdependence between the constructs within time (Figure 2). In the first model, the pathways
from the PK code-related and listening comprehension are independent; the second model allows
for covariance between the PK constructs (Lepola et al., 2016; Storch & Whitehurst, 2002); the
third model additionally allows for covariance between the G3 constructs (Kendeou, van den
Broek, et al., 2009); the fourth model excluded the relation between the grade 3 constructs, found
to be non-significant by Kendeou, van den Broek, et al (2009). The Standardised Solution for
each model is reported in Table 5 and the Global Fit Indices in Table 6.
FIGURE 2 AROUND HERE
TABLES 5 & 6 AROUND HERE
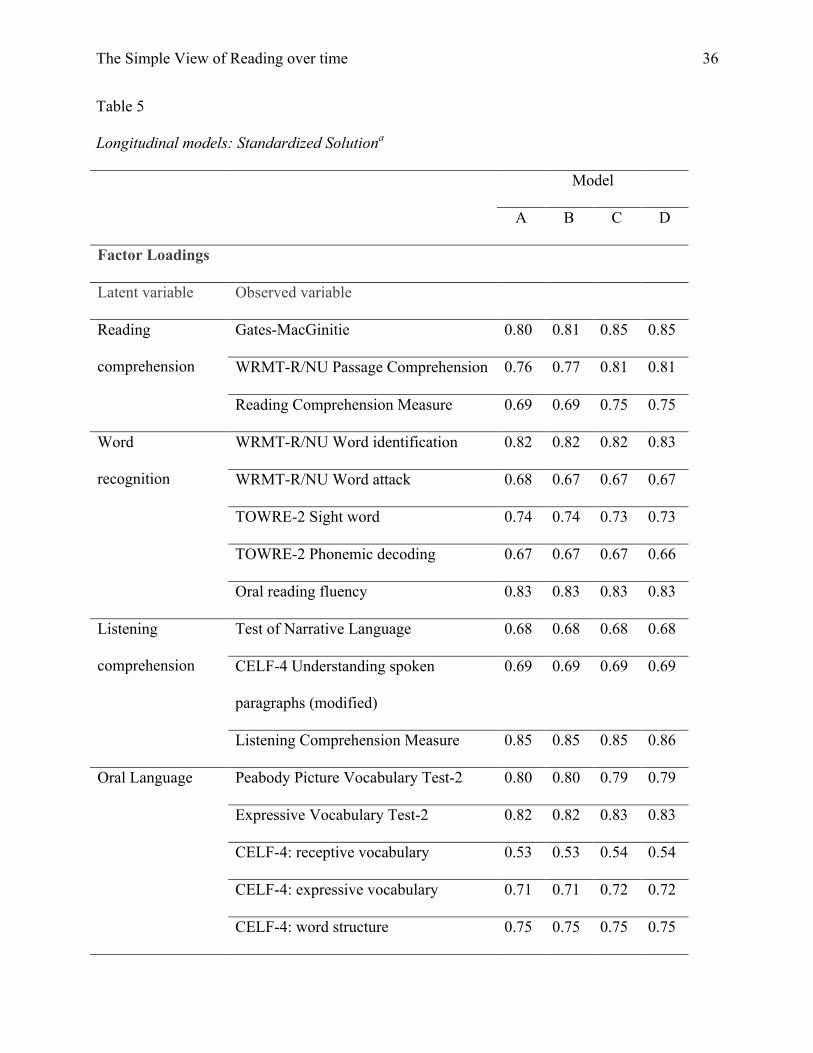
All models explained sizeable variance in grade 3 reading comprehension (all R2 > .94).

The Simple View of Reading over time
18
In addition, we found longitudinal continuity between the PK constructs of oral language and
code-related skills and their complementary constructs in grade 3. The two models that allowed
for concurrent covariance either between the two PK constructs of decoding and listening
comprehension (model C) or additionally between the G3 constructs of word recognition and
listening comprehension (model D) had the best fits. In the more complex model, the additional
relation between grade 3 listening comprehension and word recognition was not significant (p >
.10). This model was not a significantly better fit than the model without this relation (model C):
Δ!" = 1.92, df=2, p > .10. Thus, the more parsimonious model, without the relation between
grade 3 listening comprehension and word recognition is preferred.
We tested four variants of these models that included cross-lagged longitudinal relations
across years. These are shown in Appendix A. The best fitting models were those that also
included within time relations between PK code-related skills and oral language and G3 word
recognition and decoding (C–CL and D–CL, respectively). Neither models provided a better fit
to the data than the models without longitudinal relations, S-B �!" difference test: �!" < 4.0,
p > .10 for both. Thus the more parsimonious models, without the cross-lagged longitudinal
relations are preferred.
Discussion
Reading for understanding is the ultimate aim of reading. Our data show that we can
describe reading comprehension in young readers adequately from the two core components of
the simple view of reading: significant variance in grade 3 reading comprehension was explained
by the ability to read words and comprehend oral language. Our study has extended our
understanding of reading development, demonstrating that we can predict the simple view in
grade 3 from oral language and print knowledge assessed in preschool, before the start of formal

The Simple View of Reading over time
19
literacy instruction. This extends previous research by including a more comprehensive range of
oral language measures to predict reading comprehension across a longer period of development,
and confirms the relatively independent development of the two core components of the simple
view. We relate our findings to the extant literature, and discuss their practical implications.
In line with previous research, we explained sizeable (> 90%) variance in grade 3 reading
comprehension by latent constructs of concurrent listening comprehension and word recognition
(LARRC, 2015b.) Thus, our data confirm the utility of the simple view for describing reading
ability in young readers. Typically, greater variance is explained when using latent variables
compared with single observed variables in multiple regression because of the reduction in
measurement error; for example, prediction of reading comprehension for this age group from
the components of the simple view using multiple regression is typically between 50- 70% of
variance (Cutting & Scarborough, 2006; Spear-Swerling, 2004). In addition, we believe that the
substantial variance explained in our study is, in part, due to our use of multiple measures to
comprehensively assess each construct, including nonword and real word reading accuracy and
fluency to indicate word recognition, and assessments of both narrative and expository text
comprehension, which tapped inferential and literal comprehension, to indicate listening and
reading comprehension. Of note, studies that include a greater range of word reading and
comprehension measures predict up to 80% even with multiple regression (Nation & Snowling,
2004; Tunmer & Chapman, 2012). Our best fitting model allowed relations between word
recognition and listening comprehension, which is in keeping with Tunmer and Chapman (2012).
We discuss the implications of this finding when we consider the longitudinal analyses, below.
Word recognition had a slightly stronger relationship with reading comprehension than
did listening comprehension. This is in line with other studies of this age group (see Garcia &

The Simple View of Reading over time
20
Cain, 2014, for a summary) but in contrast to a related study that administered the same
measures with the same procedures to a different sample (LARRC, 2015b). The children in both
studies were sampled from the same school districts, ruling out differences in measures or
educational practice as a source of these discrepant findings. However, a lower proportion of the
current sample were from high income families: just under 40% reported annual family income >
$80k, compared with nearly 50% in LARRC (2015b) and a greater proportion of the current
sample had an Individualized Education Program: 12.2 % vs 7%. Future research should
examine how these and other background factors influence the contribution of listening
comprehension and word recognition to reading comprehension.
Turning to the longitudinal analyses, we found that oral language and code-related skills
in prekindergarten predicted reading comprehension five years later. Of note was the very strong
relationship between preschool measures of oral language (vocabulary, grammar, and discourse)
and grade 3 listening comprehension, demonstrating significant continuity over a 5-year period
(see also Lepola et al., 2016). The relation between print knowledge, phonological awareness,
and later word recognition skills is well established (Catts, Fey, Zhang, & Tomblin, 1999; Storch
& Whitehurst, 2002). Previous research has not included such comprehensive assessment of oral
language (vocabulary, grammar, and discourse-level skills) in preschool to predict reading
comprehension via listening comprehension. In this regard, our study is unique and speaks to the
importance of oral language skills developed before the start of formal reading instruction.
In line with previous research (Kendeou, van den Broek, et al., 2009) our best fitting
longitudinal model showed that listening comprehension and word recognition in grade 3 were
broadly independent, whereas the latent variables representing these constructs in PK were
strongly related. Our findings extend this work in two critical ways: first, the prediction across 5

The Simple View of Reading over time
21
years of development compared with the 2-year period studied by Kendeou and colleagues;
second, the prediction of reading comprehension through the two components of the simple
view: word recognition and listening comprehension. One reason for the strong relationship in
PK is that both are informed by a common variable: for example, there are strong links between
the development of vocabulary and phoneme awareness in preschool (Metsala & Walley, 1998).
A body of work demonstrates that different aspects of the home literacy environment support the
longitudinal prediction of oral language skills and word reading (Sénéchal, LeFevre, Thomas, &
Daley, 1998), which may explain the separate developmental trajectories reported here.
Several implications for assessment, intervention, and curriculum design stem from our
findings. Previous work confirms the predictions of the simple view that reading comprehension
difficulties can arise because of weaknesses in word reading, listening comprehension, or both
(Cain & Oakhill, 2006; Catts, Adlof, & Weismer, 2006; Torppa et al., 2007). Our longitudinal
findings show that preschool oral language is strongly predictive of later reading comprehension
via listening comprehension and confirm that the developmental pathways of listening
comprehension and word reading are largely independent. These findings indicate that preschool
assessment may usefully identify children at risk of later reading comprehension difficulties and
raises the possibility of early targeted intervention to mitigate such risk. In addition, the strong
influence of a range of oral language skills from PK through to grade 3 supports the call for these
to be included in the early years curriculum (Dickinson, Golinkoff, & Hirsh-Pasek, 2010).
We note several limitations. First, our research design included a very comprehensive
assessment of oral language skills in preschool, but it would not be practical to include multiple
measures of vocabulary, grammar, and discourse when screening children to identify those at
risk of later reading comprehension difficulties. Although oral language skills in the early years

The Simple View of Reading over time
22
form a single latent construct (LARRC, 2015a), it would be useful to identify a cluster of key
predictors that can be used by professionals in early years’ settings. Second, although we
included multiple measures of reading comprehension, listening comprehension, word
recognition in grade 3 and oral language and code-related skills in PK, we did not include other
variables such as motivation and executive function/working memory, which are important both
for concurrent reading comprehension (Guthrie, Wigfield, Metsala, & Cox, 1999; Sesma,
Mahone, Levine, Eason, & Cutting, 2009) and its longitudinal prediction (Lepola et al., 2016;
Pike, Swank, Taylor, Landry, & Barnes, 2013). Given the interrelations between these variables
and language development, future work should focus on disentangling their interrelations across
development. Third, our study was not designed to speak to reading development in children
learning to read in an additional language or those at risk of reading or language impairment
through familial factors; there may be different developmental relations for those populations.
Three decades on, the simple view of reading remains a useful framework for describing
the complex phenomenon of reading comprehension as the product of word reading and listening
comprehension. We have shown that preschool indicators of these two components predict
reading comprehension five years later, demonstrating the importance of early language skills for
reading comprehension. We recommend that educators exploit this continuity in the development
of language comprehension to develop effective curricula and assessment tools.

The Simple View of Reading over time
23
References
Bishop, D. (2003). Test for Reception of Grammar - Version 2. Pearson.
Braze, D., Katz, L., Magnuson, J. S., Mencl, W. E., Tabor, W., van Dyke, J. A., . . . Shankweiler,
D. P. (2016). Vocabulary does not complicate the simple view of reading. Reading &
Writing, 29, 435-451. doi:10.1007/s11145-015-9608-6
Browne, M. W., & Cudeck, R. (1993). Alternative ways of assesssing model fit. In K. A. Bollen
& J. S. Long (Eds.), Testing structural equation models (pp. 136–162). Newbury Park,
CA: Sage.
Byrne, B. M. (2012). Structural equation modeling with Mplus. New York, NY: Routledge.
Cain, K., & Oakhill, J. (2006). Profiles of children with specific reading comprehension
difficulties. British Journal of Educational Psychology, 76, 683-696.
doi:10.1348/000709905X67610
Cain, K., & Oakhill, J. V. (1999). Inference making and its relation to comprehension failure.
Reading and Writing: An Interdisciplinary Journal, 11, 489-503.
doi:10.1023/A:1008084120205
Catts, H. W., Adlof, S. M., & Weismer, S. E. (2006). Language deficits in poor comprehenders:
A case for the simple view of reading. Journal of Speech, Language, and Hearing
Research, 49, 278-293. doi:10.1044/1092-4388(2006/023)
Catts, H. W., Fey, M. E., Zhang, X., & Tomblin, J. B. (1999). Language basis of reading and
reading disabilities: Evidence from a longitudinal investigation. Scientific Studies of
Reading, 3, 331-361. doi:10.1207/s1532799xssr0304_2

The Simple View of Reading over time
24
Catts, H. W., Herrera, S., Cocoran Nielsen, D., & Sittner Bridges, M. (2015). Early prediction of
reading comprehension within the simple view framework. Reading and Writing, 28,
1407-1425. doi:10.1007/s11145-015-9576-x
Catts, H. W., Herrera, S., Nielsen, D. C., & Bridges, M. S. (2015). Early prediction of reading
comprehension within the simple view framework. Reading and Writing, 28, 1407-1425.
doi:10.1007/s11145-015-9576-x
Catts, H. W., Hogan, T. P., & Fey, M. E. (2003). Subgrouping poor readers on the basis of
individual differences in reading-related abilities. Journal of Learning Disabilities, 36,
151-164. doi:10.1177/002221940303600208
Cicchetti, D. V. (1984). Guidelines, criteria, and rules of thumb for evaluating normed and
standardized assessment instruments in psychology. Psychological Assessment, 6, 284–
290. doi:10.1037/1040-3590.6.4.284
Cragg, L., & Nation, K. (2006). Exploring written narrative in children with poor reading
comprehension. Educational Psychology, 26, 55-72. doi:10.1080/01443410500340991
Cutting, L. E., & Scarborough, H. S. (2006). Prediction of reading comprehension: Relative
contributions of word recognition, language proficiency, and other cognitive skills can
depend on how comprehension is measured. Scientific Studies of Reading, 10, 277-299.
doi:10.1207/s1532799xssr1003_5
Dickinson, D. K., Golinkoff, R., & Hirsh-Pasek, K. (2010). Speaking out for language: Why
language is central to reading development. Educational Researcher, 39, 305-310.
doi:10.3102/0013189X1037020
Dunn, L. M., & Dunn, D. M. (2007). Peabody Picture Vocabulary Test-Fourth Edition: Pearson
Assessment.
The Simple View of Reading over time
25
Enders, C. K., & Bandalos, D. L. (2001). The relative performance of full information maximum
likelihood estimation for missing data in structure equation models. Structural Equation
Modeling: A Multidisciplinary Journal, 8, 430-457. doi:10.1207/S15328007SEM0803_5
Finney, S. J., & DiStefano, C. (2008). Non-normal and categorical data in structural equation
modeling. In G. R. Hancock & R. D. Mueller (Eds.), Structural Equation Modeling: A
Second Course (pp. 269-314): nformation Age Publishing.
Foorman, B. R., Herrera, S., Petscher, Y., Mitchell, A., & Truckenmiller, A. (2015). The
structure of oral language and reading and their relation to comprehension in
Kindergarten through Grade 2. Reading and Writing, 28, 655-681. doi:10.1007/s11145-
015-9544-5
Garcia, J. R., & Cain, K. (2014). Decoding and reading comprehension: a meta-analysis to
identify which reader and assessment characteristics influence the strength of the
relationship in English Review of Educational Research, 84, 74-111.
doi:10.3102/0034654313499616
Gough, P. B., & Tunmer, W. E. (1986). Decoding, reading and reading disability. Remedial and
Special Education, 7, 6-10. doi:10.1177/074193258600700104
Guthrie, J. T., Wigfield, A., Metsala, J. L., & Cox, K. E. (1999). Motivational and cognitive
predictors of text comprehension and reading amount. Scientific Studies of Reading, 3,
231-256. doi:10.1207/s1532799xssr0303_3
Hoover, W. A., & Gough, P. B. (1990). The simple view of reading. Reading and Writing, 2,
127-160. doi:10.1007/BF00401799

The Simple View of Reading over time
26
Kendeou, P., Savage, R., & van den Broek, P. (2009). Revisiting the simple view of reading.
British Journal of Educational Psychology, 79, 353-370.
doi:10.1348/978185408X369020
Kendeou, P., van den Broek, P., White, M., & Lynch, J. S. (2009). Predicting reading
comprehension in early elementary school: the independent contributions of oral
language and decoding skills. Journal of Educational Psychology, 101, 765-778.
doi:10.1037/a0015956
Kirby, J., & Savage, R. (2008). Can the simple view deal with the complexities of reading?
Literacy, 42, 75-82. doi:10.1111/j.1741-4369.2008.00487.x
Kline, R. (2013). Exploratory and confirmatory factor analysis. In Y. Petscher, C.
Schatschneider, & D. Compton (Eds.), Applied quantitative analysis in education and the
social sciences (pp. 171-207). New York, NY: Routledge.
Language and Reading Research Consortium (LARRC). (2015a). The dimensionality of
language ability in young children. Child Development, 86, 1948-1965.
doi:10.1111/cdev.12450
Language and Reading Research Consortium (LARRC). (2015b). Learning to read: should we
keep things simple? Reading Research Quarterly, 50, 151-169. doi:10.1002/rrq.99
Language and Reading Research Consortium (LARRC), Farquharson, K., & Murphy, K. (2016).
Ten steps to a large, multi-site, longitudinal investigation of language and reading in
young children. Frontiers in Developmental Psychology, 7, 1-16.
doi:10.3389/fpsyg.2016.00419
The Simple View of Reading over time
27
Lepola, J., Lynch, J., Kiuru, N., Laakkonen, E., & Niemi, P. (2016). Early oral language
comprehension, task orientation, and foundational reading skills as predictors of grade 3
reading comprehension. Reading Research Quarterly, 51, 373-390. doi:10.1002/rrq.145
Leslie, L., & Caldwell, J. S. (2011). Qualitative reading inventory (5 ed.): Pearson.
Lomax, R. (2013). Introduction to structural equation modeling. In Y. Petscher, C.
Schatschneider, & D. Compton (Eds.), Applied quantitative analysis in education and the
social sciences (pp. 245–264). New York, NY: Routledge.
Lonigan, C. J., Wagner, R. K., Torgesen, J. K., & Rashotte, C. A. (2007). Test of preschool
literacy. Austin, TX: ProEd.
MacCallum, R. C., & Austin, J. T. (2000). Applications of structural equation modeling in
psychological research. Annual Review of Psychology, 51, 201-226.
doi:10.1146/annurev.psych.51.1.201
MacGinitie, W. H., MacGinitie, R. K., Maria, K., & Dreyer, L. G. (2000). Gates-MacGinitie
Reading Tests (4 ed.). Itasca, Illinois Riverside Publishing.
McCoach, D. B., Black, A. C., & O’Connell, A. A. (2007). Errors of inference in structural
equation modeling. Psychology in the schools, 44, 461-470. doi:10.1002/pits.20238
Metsala, J. L., & Walley, A. C. (1998). Spoken vocabulary growth and the segmental
restructuring of lexical representations: Precursors to phonemic awareness and early
reading ability. In J. L. Metsala & L. C. Ehri (Eds.), Word recognition in beginning
literacy (pp. 89-120). Mahwah, NJ: Erlbaum.
Nation, K., & Snowling, M. (2004). Beyond phonological skills: broader language skills
contribute to the development of reading. Journal of Research in Reading, 27, 342-356.
doi:10.1111/j.1467-9817.2004.00238.x

The Simple View of Reading over time
28
Oakhill, J., & Cain, K. (2012). The precursors of reading comprehension and word reading in
young readers: Evidence from a four-year longitudinal study. Scientific Studies of
Reading, 16, 91-121. doi:10.1080/10888438.2010.529219
Pike, M., Swank, P., Taylor, H., Landry, S., & Barnes, M. A. (2013). Effect of preschool
working memory, language, and narrative abilities on inferential comprehension at
school-age in children with Spina Bifida Myelomeningocele and typically developing
children. Journal of the International Neuropsychological Society, 19, 390-399.
doi:10.1017/S1355617712001579
Rice, M. L., & Wexler, K. (2001). Rice/Wexler Test of Early Grammatical Impairment. San
Antonia, TX: The Psychological Corporation.
Rosseel, Y. (2012). lavaan: An R Package for Structural Equation Modeling. Journal of
Statistical Software, 48, 1-36.
Semel, E., & Wiig, E. (2006). Clinical Evaluation of Language Fundamentals: 4: Pearson
Assessment.
Sénéchal, M., LeFevre, J., Thomas, E. M., & Daley, K. E. (1998). Differential effects of home
literacy experiences on the development of oral and written language. Reading Research
Quarterly, 33, 96-116. doi:10.1598/RRQ.33.1.5
Sesma, H. W., Mahone, E. M., Levine, T., Eason, S. H., & Cutting, L. E. (2009). The
contribution of executive skills to reading comprehension. Child Neuropsychology, 15,
232-246. doi:10.1080/09297040802220029
Seymour, P. H., Aro, M., & Erskine, J. M. (2003). Foundation literacy acquisition in European
orthographies. British Journal of Psychology, 94, 143-174.
doi:10.1348/000712603321661859

The Simple View of Reading over time
29
Snow, C. E. (2002). Reading for understanding: Toward an R&D program in reading
comprehension: Rand Corporation.
Spear-Swerling, L. (2004). Fourth graders' performance on a state-manadated assessment
involving two different measures of reading comprehension. Reading Psychology, 25,
121-148. doi:10.1080/02702710490435727
State of Florida, Department of Education, Florida Center for Reading Research (2009). Florida
assessment for instruction in reading: oral reading fluency. Tallahassee, FL.
Storch, S. A., & Whitehurst, G. J. (2002). Oral language and code-related precursors to reading:
Evidence from a longitudinal structural model. Developmental Psychology, 38, 934-947.
doi:10.1037/0012-1649.38.6.934
Torppa, M., Georgiou, G. K., Lerkkanen, M. K., Niemi, P., Poikkeus, A. M., & Nurmi, J. E.
(2016). Examining the simple view of reading in a transparent orthography: A
longitudinal study from kindergarten to grade 3. Merrill-Palmer Quarterly, 62, 179-206.
Torppa, M., Tolvanen, A., Poikkeus, A.-M., Eklund, K., Lerkkanen, M.-K., Leskinen, E., &
Lyytinen, H. (2007). Reading development subtypes and their early characteristics.
Annals of Dyslexia, 57, 3-32. doi:10.1007/s11881-007-0003-0
Tunmer, W. E., & Chapman, J. W. (2012). The Simple View of Reading redux: Vocabulary
knowledge and the independent components hypothesis. Journal of Learning Disabilities,
45, 453-466. doi:10.1177/0022219411432685
Wang, H. C., Nickels, L., Nation, K., & Castles, A. (2013). Predictors of orthographic learning
of regular and irregular words. Scientific Studies of Reading, 17, 369-384.
doi:10.1080/10888438.2012.749879

The Simple View of Reading over time
30
Wechsler, D. (1992). Wechsler Intelligence Scale for Children (3rd ed.). London: The
Psychology Corporation.
Williams, K. T. (2007). Expressive Vocabulary Test (2nd ed.). Bloomington: Pearson.
Woodcock, R. W. (1997). Woodcock Reading Mastery Test – Revised/Normative Update
(WRMT-R/NU). Bloomington, MN: American Guidance Service/ Pearson Assessments.

The Simple View of Reading over time
31
Table 1. Descriptive statistics, correlations, and reliability for PK observed variables for latent variable of oral language Observed Variables
PPVT-4 EVT-2 WCR WCE WS RS TEGT TEGS TROG-2 KVT INF-INT
INF-BK
PAT
PPVT-4 - EVT-2 .699 - WCR .393 .433 - WCE .469 .553 .763 - WS .566 .555 .324 .465 - RS .571 .646 .387 .549 .616 - TEGT .296 .342 .127 .192 .346 .364 - TEGS .402 .384 .263 .366 .507 .465 .379 - TROG-2 .527 .500 .356 .500 .454 .505 .301 .302 - KVT .470 .476 .268 .413 .468 .437 .199 .260 .432 - INF-INT .385 .393 .303 .413 .328 .371 .058 .175 .414 .327 - INF-BK .557 .571 .365 .471 .476 .521 .310 .326 .388 .415 .300 - PAT .488 .455 .286 .421 .443 .507 .262 .405 .372 .358 .337 .624 - M 96.90 71.79 14.90 8.67 16.27 34.37 8.88 7.32 6.76 2.15 0.80 0.94 2.51 (SD) (17.82) (13.51) (4.19) (4.40) (4.52) (13.64) (4.22) (2.68) (3.71) (1.59) (0.37) (0.48) (2.01) Reliabilitya .96 .94 .92b .83 .93 .86 .85 .84 .81 .78 b .85 Note. PPVT-4: Peabody Picture Vocabulary Test – 4; EVT-2: Expressive Vocabulary Test-2; WCR = word classes subtest receptive from
Clinical Evaluation of Language Fundamentals-4; WCE = word classes subtest expressive from CELF-4; RS = recalling sentences; TEGT = Past
tense probe from Test for Grammatical Impairment; TEGS = third person singular from Test for Grammatical Impairment; TROG-2 = Test for
Reception of Grammar; KVT = knowledge violations task; INF-INT = inference integration; INF-BK = inference background knowledge; PAT
= picture arrangement test. All correlations > .147 significant at p < .01 (two-tailed). aCronbach’s alpha unless otherwise stated; bcombined
across the two components.

The Simple View of Reading over time
32
Table 2. Descriptive statistics, correlations, and reliability for PK observed variables for latent variable of code-related skills KATE TO DO Observed Variables
LI PK PA RAN-E RAN-T
LI - PK .866 - PA .460 .493 - RAN-E -.160 -.161 -.208 - RAN-T -.362 -.328 -.207 -.052 - Mean 23.97 27.86 19.14 2.61 84.33 (SD) (9.59) (8.58) (5.24) (5.33) (31.45) Reliabilitya .95 .95 .88 Note. LI = letter identification; PK = print knowledge; PA = phonological awareness; RAN-E = rapid automatized naming errors; RAN-T =
rapid automatized naming time. All correlations > .147 significant at p < .01 (two-tailed). aCronbach’s alpha.

The Simple View of Reading over time
33
Table 3
Grade 3 descriptive statistics, correlations, and reliability for observed variables Latent Variable Observed
Variables GM WPC RCM WID WA SWE PDE ORF TNL USP LCM
Reading comprehension
GM - WJ-P .673 - RCM .627 .570 -
Word recognition WID .603 .659 .436 - WA .473 .484 .312 .727 - SWE .506 .507 .427 .610 .536 - PDE .450 .502 .350 .674 .680 .747 - ORF .631 .631 .512 .684 .557 .764 .688 -
Listening comprehension
TNL .459 .376 .494 .244 .169 .279 .238 .369 - USP .383 .359 .483 .234 .139 .241 .230 .338 .500 - LCM .546 .480 .606 .316 .133 .230 .167 .361 .555 .599 -
Mean 33.82 36.77 19.87 69.66 31.23 65.82 34.33 135.97 31.01 7.26 20.10 (SD) (9.30) (5.78) (4.85) (9.02) (7.22) (8.68) (10.21) (36.33) (3.72) (2.14) (5.50) Reliabilitya .91 .89 .80 .93 .92 .93b .91b >.85c .58 .51 .83 Note. GM = Gates MacGinitie; WPC = WRMT-R:NU Passage Comprehension; RCM = Reading Comprehension Measure; WID = word
identification subtest of Woodcock Reading Mastery Tests-Revised: Normative Update; WA = word attack subtest of Woodcock Reading
Mastery Tests-Revised: Normative Update; SWE = sight word efficiency subtest from Test of Word Reading Efficiency-2; PDE = phonemic
decoding efficiency subtest from Test of Word Reading Efficiency-2; ORF = oral reading fluency from Florida Assessment for Instruction in
Reading; TNL = Test of Narrative Language (receptive); USP = adaptation of Understanding Spoken Paragraphs subtest from Clinical
Evaluation of Language Fundamentals-4; LCM = Listening Comprehension Measure. All correlations > .147 significant at p < .01 (two-tailed). aCronbach’s alpha unless otherwise stated; btest-retest reliability reported in manual; cpublished IRT precision estimates.

The Simple View of Reading over time
34
Table 4
Grade 3 model fit for models without (independent) or with (dependent) pathway between word
recognition and listening comprehension
Models
Independent Dependent
Factor Loadings
Latent variable Observed variable
Reading comprehension Gates-MacGinitie .81 .84
WRMT-R/NU Passage
Comprehension
.76 .81
Reading Comprehension Measure .71 .74
Word recognition WRMT-R/NU Word identification .80 .83
WRMT-R/NU Word attack .70 .67
TOWRE-2 Sight word .82 .73
TOWRE-2 Phonemic decoding .80 .67
Oral reading fluency .87 .83
Listening comprehension Test of Narrative Language .65 .68
CELF-4 Understanding spoken
paragraphs (modified)
.68 .69
Listening Comprehension Measure .88 .86
Structure coefficients
Word recognition → Reading comprehension .77 .66
Listening comprehension → Reading comprehension .58 .47

The Simple View of Reading over time
35
Correlations
Word recognition ↔ Listening comprehension n/a .48
Global Fit Indices
Chi-Square (df) 138.70 (36) 90.21 (35)
CFI .948 .972
RMSEA
(90% CI)
p close
.098
(.081-.116)
< .001
.073
(.055-.092)
= .021
SRMR .146 .045
NNFI .921 .956
AIC 7151.244 7104.756
Note. CELF–4 = Clinical Evaluation of Language Fundamentals–Fourth Edition; TOWRE–2:
Test of Word Reading Efficiency–Second Edition; WRMT–R/NU: Woodcock Reading Mastery
Tests–Revised – Normative Update. CFI: comparative fit index; RMSEA: root mean square error
of approximation; SRMR: standardized root mean squared residual; NNFI: non-normed fit
index; AIC = Akaike’s Information Criterion.
The Simple View of Reading over time
36
Table 5
Longitudinal models: Standardized Solutiona
Model
A B C D
Factor Loadings
Latent variable Observed variable
Reading
comprehension
Gates-MacGinitie 0.80 0.81 0.85 0.85
WRMT-R/NU Passage Comprehension 0.76 0.77 0.81 0.81
Reading Comprehension Measure 0.69 0.69 0.75 0.75
Word
recognition
WRMT-R/NU Word identification 0.82 0.82 0.82 0.83
WRMT-R/NU Word attack 0.68 0.67 0.67 0.67
TOWRE-2 Sight word 0.74 0.74 0.73 0.73
TOWRE-2 Phonemic decoding 0.67 0.67 0.67 0.66
Oral reading fluency 0.83 0.83 0.83 0.83
Listening
comprehension
Test of Narrative Language 0.68 0.68 0.68 0.68
CELF-4 Understanding spoken
paragraphs (modified)
0.69 0.69 0.69 0.69
Listening Comprehension Measure 0.85 0.85 0.85 0.86
Oral Language Peabody Picture Vocabulary Test-2 0.80 0.80 0.79 0.79
Expressive Vocabulary Test-2 0.82 0.82 0.83 0.83
CELF-4: receptive vocabulary 0.53 0.53 0.54 0.54
CELF-4: expressive vocabulary 0.71 0.71 0.72 0.72
CELF-4: word structure 0.75 0.75 0.75 0.75

The Simple View of Reading over time
37
CELF-4: recalling sentences 0.81 0.81 0.81 0.81
TEGI: past tense probe 0.48 0.48 0.48 0.48
TEGI: third person singular 0.56 0.56 0.56 0.56
Test for Reception of Grammar-2 0.66 0.66 0.66 0.66
Knowledge Violations Task 0.65 0.65 0.64 0.64
Inference: integration 0.69 0.70 0.68 0.68
Inference: background knowledge 0.6 0.65 0.64 0.64
Picture Arrangement Task 0.52 0.52 0.53 0.53
Code-related WRMT-T/NU: Letter Identification 0.70 0.70 0.63 0.63
TOPEL: print knowledge 0.72 0.72 0.68 0.68
TOPEL: phonological awareness 0.70 0.70 0.77 0.77
CELF-4: RAN naming errors -0.30 -0.30 -0.32 -0.32
CELF-4: RAN naming speed -0.42 -0.42 -0.43 -0.43
Structure coefficients
G3 Word recognition → G3 Reading comprehension 0.78 0.76 0.65 0.66
G3 Listening comprehension → G3 Reading comprehension 0.58 0.56 0.46 0.46
PK oral language → G3 listening comprehension 0.80 0.80 0.80 0.80
PK code-related skills → G3 word recognition 0.75 0.75 0.71 0.71
Correlations
G3 Word recognition ↔ G3 Listening comprehension n/a 0.14 0.12 n/a
PK code-related skills ↔ PK oral language n/a n/a 0.83 0.83
aall parameter estimates are statistically different from zero (p < .05)

The Simple View of Reading over time
38
Note. WRMT-R-NU: Woodcock Reading Mastery Tests-Revised: Normative Update; TOWRE-
2: Test of Word Reading Efficiency-2; CELF-4: Clinical Evaluation of Language Fundamentals-
4; TEGI: Test for Grammatical Impairment. TOPEL: Test of Preschool Early Literacy.

The Simple View of Reading over time
39
Table 6
Longitudinal models: Global Fit Indices
A B C D
Global Fit Indices
Chi-Square
(df)
948.824
(362)
946.844
(361)
670.649
(360)
672.393
(361)
CFI 0.904 0.904 0.949 0.949
RMSEA
(90% CI)
p close
0.062
(0.057–0.067)
.001
0.062
(0.057- 0.067)
.001
0.045
(0.040-0.051)
.926
0.045
(0.040-0.051)
.926
SRMR 0.196 0.194 0.053 0.054
NNFI 0.893 0.892 0.943 0.943
AIC 23816.568 23816.587 23542.393 23542.137
Note. CFI: comparative fit index; RMSEA: root mean square error of approximation; SRMR:
standardized root mean squared residual; NNFI: non-normed fit index; AIC = Akaike’s
Information Criterion.

The Simple View of Reading over time
40
Figure Captions
Figure 1. Grade 3: best fitting model with pathway between word recognition and listening
comprehension. All paths are significantly different from zero (p < .05).
G3ReadingComprehension
G3ListeningComprehension
G3WordRecognition
LCM TNLUSP
WA PDEWI SWE
RCM WPCGM
.81.74 .84
.68.69.86
.73.67.83.67
.47
.66
.49ORF
.83
.41 .29
.33.41
.39
.48

The Simple View of Reading over time
41
Figure 2. Longitudinal prediction from PK to Grade 3: models
G3listeningcomprehension
G3wordrecognition
G3readingcomprehension
PKorallanguage
PKcode-relatedskills
Model A
G3listeningcomprehension
G3wordrecognition
G3readingcomprehension
PKorallanguage
PKcode-relatedskills
Model D
G3listeningcomprehension
G3wordrecognition
G3readingcomprehension
PKorallanguage
PKcode-relatedskills
Model C
G3listeningcomprehension
G3wordrecognition
G3readingcomprehension
PKorallanguage
PKcode-relatedskills
Model B

The Simple View of Reading over time
42
Figure 3. Longitudinal prediction from PK to grade 3: best fitting model. All paths are
significantly different from zero (p < .05).
G3ListeningComprehension
G3WordRecognition
G3ReadingComprehension
LCM TNLUSP
RCM GM
.82.75 .85
.69.85
.47
.67
PKOralLanguage
WCE
INK-BK
INF-INT
KVT
PAT
WCR
EVT
PPVT
TROG-2
TEGT
TEGS
RS
WS
.80
.75
.82
.56
.49
.67
.80
.83
.72
.54
.65
.69
.64
.53
.25
.66
.41
.12
WPC
PKCode-relatedskills
PK RAN-ELI RAN-TPA
.77 .68 .63 -.32 -.43
.71
.84
.77
ModelD
.70
WA PDEWI SWE
.73.67.83.67
.490.42 .30
.84
0.390.35
0.42
ORF

The Simple View of Reading over time
43
Figure 4. Longitudinal prediction from PK to grade 3: models with cross-lagged relations.
G3listeningcomprehension
G3wordrecognition
G3readingcomprehension
PKorallanguage
PKcode-relatedskills
Model A-CL
G3listeningcomprehension
G3wordrecognition
G3readingcomprehension
PKorallanguage
PKcode-relatedskills
Model B-CL
G3listeningcomprehension
G3wordrecognition
G3readingcomprehension
PKorallanguage
PKcode-relatedskills
Model C-CL
G3listeningcomprehension
G3wordrecognition
G3readingcomprehension
PKorallanguage
PKcode-relatedskills
Model D-CL